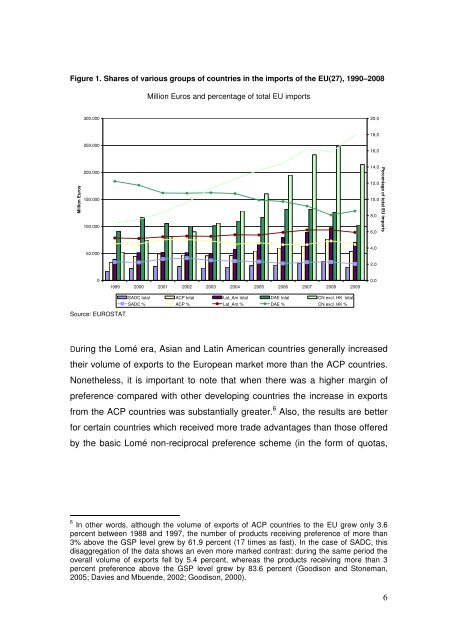
Figure 1. Shares of various groups of countries in <strong>the</strong> imports of <strong>the</strong> EU(27), 1990–2008Million Euros and percentage of total EU imports300.00020,018,0250.00016,0Million Euros200.000150.000100.00014,012,010,08,06,0Percentage of total EU imports50.0004,02,001999 2000 2001 2002 2003 2004 2005 2006 2007 2008 20090,0Source: EUROSTATSADC total ACP total Lat_Am total DAE total CN excl. HK totalSADC % ACP % Lat_Am % DAE % CN excl. HK %During <strong>the</strong> Lomé era, Asian and Latin American countries generally increased<strong>the</strong>ir volume of exports to <strong>the</strong> European market more than <strong>the</strong> ACP countries.None<strong>the</strong>less, it is important to <strong>not</strong>e that when <strong>the</strong>re was a higher margin ofpreference compared with o<strong>the</strong>r developing countries <strong>the</strong> increase in exports<strong>from</strong> <strong>the</strong> ACP countries was substantially greater. 6 Also, <strong>the</strong> results are betterfor certain countries which received more trade advantages than those offeredby <strong>the</strong> basic Lomé non-reciprocal preference scheme (in <strong>the</strong> form of quotas,6 In o<strong>the</strong>r words, although <strong>the</strong> volume of exports of ACP countries to <strong>the</strong> EU grew only 3.6percent between 1988 and 1997, <strong>the</strong> number of products receiving preference of more than3% above <strong>the</strong> GSP level grew by 61.9 percent (17 times as fast). In <strong>the</strong> case of SADC, thisdisaggregation of <strong>the</strong> data shows an even more marked contrast: during <strong>the</strong> same period <strong>the</strong>overall volume of exports fell by 5.4 percent, whereas <strong>the</strong> products receiving more than 3percent preference above <strong>the</strong> GSP level grew by 83.6 percent (Goodison and Stoneman,2005; Davies and Mbuende, 2002; Goodison, 2000).6
for instance). 7 For this reason some writers have questioned <strong>the</strong> honesty of<strong>the</strong> EU when it declares <strong>the</strong> Lomé system to have been a failure, given that<strong>the</strong> EU fails to mention o<strong>the</strong>r problems of a structural, supply-side nature inSSA countries, such as <strong>the</strong>ir specialisation in a limited range of primaryproducts which were facing over-supply and falling prices in <strong>the</strong> world market.The erosion of <strong>the</strong> level of preference due to <strong>the</strong> advance of <strong>the</strong> GATTliberalization programme was a<strong>not</strong>her reason why <strong>the</strong> argument that Loméfailed is an exaggeration. These points suggest that <strong>the</strong> verdict on <strong>the</strong>previous preferential system is a good deal more complex than <strong>the</strong> EU hasadmitted (Mold, 2007, Goodison and Stoneman, 2005; Hurt, 2003).Moreover, if <strong>the</strong> preferences had been such a failure it would be hard tounderstand why African governments insist that <strong>the</strong> old model should beretained, as well as <strong>the</strong> fact that <strong>the</strong> EU itself proposed to continue nonreciprocalpreferences for <strong>the</strong> worst-off economies (<strong>the</strong> LDCs) ra<strong>the</strong>r thansubmit <strong>the</strong>m to <strong>the</strong> reciprocal trade rules of <strong>the</strong> EPAs (Faber and Orbie, 2009).The EU’s arguments highlight <strong>the</strong> incompatibility between <strong>the</strong> Lomé model and<strong>the</strong> WTO principles in relation to reciprocity and non-discrimination. 8 Also <strong>the</strong>importance of differentiating between different ACP countries on <strong>the</strong> basis of<strong>the</strong>ir level of development, by giving more favourable conditions to <strong>the</strong> LCDs,led <strong>the</strong> European Commission to stress <strong>the</strong> need for changing <strong>the</strong> Lomémodel. In spite of <strong>the</strong>se incompatibilities, it has been possible in recent yearsto continue to apply <strong>the</strong> Lomé model thanks to <strong>the</strong> acceptance of two requestsby <strong>the</strong> EU for temporary exemptions <strong>from</strong> <strong>the</strong> WTO multilateral norms, <strong>the</strong> lastof <strong>the</strong>se expiring on <strong>the</strong> 31 December 2007. The possibility that <strong>the</strong> EU couldcontinue to press for temporary exemptions has also been mentioned by7 Countries such as Botswana, Swaziland, Namibia, Mauritius and Zimbabwe had significantlyincreased <strong>the</strong>ir income in <strong>the</strong> SADC thanks to <strong>the</strong> advantages offered by special protocols forsugar and beef. These facts, in contrast to <strong>the</strong> general opinion about <strong>the</strong> effectiveness of <strong>the</strong>Lomé Agreements, show that for <strong>the</strong> favoured nations preferential trade has played animportant role in ensuring that <strong>the</strong> SACD countries are <strong>not</strong> marginalised <strong>from</strong> internationaltrade flows (Goodison, 2000; Matambalya, 1998).8 The exception to <strong>the</strong> principle of reciprocity, using <strong>the</strong> controversial Article XXIV on regionalintegration agreements, was <strong>not</strong> applicable. And in relation to <strong>the</strong> Most Favoured Nationclause, which signified <strong>the</strong> absence of discrimination, <strong>the</strong> Lomé non-reciprocal preferencesystem was authorized in <strong>the</strong> form of an exception using <strong>the</strong> Habilitation Clause. Thispermitted Lomé, as long as such advantages were given to all developing economies and <strong>not</strong>merely some of <strong>the</strong>m (Solignac-Lecomte, 2001; Gibb, 2000; McQueen, 1998).7