Organization and Performance of Cotton Sectors in Africa ... - infoDev
Organization and Performance of Cotton Sectors in Africa ... - infoDev
Organization and Performance of Cotton Sectors in Africa ... - infoDev

You also want an ePaper? Increase the reach of your titles
YUMPU automatically turns print PDFs into web optimized ePapers that Google loves.
AGRICULTURE AND RURAL DEVELOPMENT<strong>Organization</strong> <strong>and</strong><strong>Performance</strong> <strong>of</strong><strong>Cotton</strong> <strong>Sectors</strong> <strong>in</strong> <strong>Africa</strong>LEARNING FROM REFORM EXPERIENCEDavid Tschirley, Col<strong>in</strong> Poulton, <strong>and</strong> Patrick Labaste, Editors
<strong>Organization</strong>AND PERFORMANCEOF COTTONSECTORS IN AFRICA
AGRICULTURE AND RURAL DEVELOPMENTSeventy-five percent <strong>of</strong> the world’s poor live <strong>in</strong> rural areas <strong>and</strong> most are <strong>in</strong>volved <strong>in</strong>agriculture. In the 21st century, agriculture rema<strong>in</strong>s fundamental to economicgrowth, poverty alleviation, <strong>and</strong> environmental susta<strong>in</strong>ability. The World Bank’s Agriculture<strong>and</strong> Rural Development publication series presents recent analyses <strong>of</strong> issuesthat affect the role <strong>of</strong> agriculture, <strong>in</strong>clud<strong>in</strong>g livestock, fisheries, <strong>and</strong> forestry, as asource <strong>of</strong> economic development, rural livelihoods, <strong>and</strong> environmental services. Theseries is <strong>in</strong>tended for practical application, <strong>and</strong> we hope that it will serve to <strong>in</strong>formpublic discussion, policy formulation, <strong>and</strong> development plann<strong>in</strong>g.Titles <strong>in</strong> this series:Agricultural L<strong>and</strong> Redistribution: Toward Greater ConsensusAgriculture Investment SourcebookChang<strong>in</strong>g the Face <strong>of</strong> the Waters: The Promise <strong>and</strong> Challenge <strong>of</strong> Susta<strong>in</strong>able AquacultureEnhanc<strong>in</strong>g Agricultural Innovation: How to Go Beyond the Strengthen<strong>in</strong>g <strong>of</strong>Research SystemsForests Sourcebook: Practical Guidance for Susta<strong>in</strong><strong>in</strong>g Forests <strong>in</strong> DevelopmentCooperationGender <strong>in</strong> Agriculture Sourcebook<strong>Organization</strong> <strong>and</strong> <strong>Performance</strong> <strong>of</strong> <strong>Cotton</strong> <strong>Sectors</strong> <strong>in</strong> <strong>Africa</strong>: Learn<strong>in</strong>g from ReformExperienceReform<strong>in</strong>g Agricultural Trade for Develop<strong>in</strong>g Countries, Volume 1: Key Issues for aPro-Development Outcome <strong>of</strong> the Doha RoundReform<strong>in</strong>g Agricultural Trade for Develop<strong>in</strong>g Countries, Volume 2: Quantify<strong>in</strong>g theImpact <strong>of</strong> Multilateral Trade ReformShap<strong>in</strong>g the Future <strong>of</strong> Water for Agriculture: A Sourcebook for Investment <strong>in</strong> AgriculturalWater ManagementThe Sunken Billions: The Economic Justification for Fisheries ReformSusta<strong>in</strong>able L<strong>and</strong> Management: Challenges, Opportunities, <strong>and</strong> Trade-OffsSusta<strong>in</strong>able L<strong>and</strong> Management SourcebookSusta<strong>in</strong><strong>in</strong>g Forests: A Development Strategy
<strong>Organization</strong>AND PERFORMANCEOF COTTONSECTORS IN AFRICALearn<strong>in</strong>g from Reform ExperienceEditorsDavid TschirleyCol<strong>in</strong> PoultonPatrick Labaste
© 2009 The International Bank for Reconstruction <strong>and</strong> Development / The World Bank1818 H Street NWWash<strong>in</strong>gton DC 20433Telephone: 202-473-1000Internet: www.worldbank.orgE-mail: feedback@worldbank.orgAll rights reserved1 2 3 4 12 11 10 09This volume is a product <strong>of</strong> the staff <strong>of</strong> the International Bank for Reconstruction <strong>and</strong>Development / The World Bank. The f<strong>in</strong>d<strong>in</strong>gs, <strong>in</strong>terpretations, <strong>and</strong> conclusionsexpressed <strong>in</strong> this volume do not necessarily reflect the views <strong>of</strong> the Executive Directors<strong>of</strong> The World Bank or the governments they represent.The World Bank does not guarantee the accuracy <strong>of</strong> the data <strong>in</strong>cluded <strong>in</strong> this work.The boundaries, colors, denom<strong>in</strong>ations, <strong>and</strong> other <strong>in</strong>formation shown on any map <strong>in</strong>this work do not imply any judgement on the part <strong>of</strong> The World Bank concern<strong>in</strong>g thelegal status <strong>of</strong> any territory or the endorsement or acceptance <strong>of</strong> such boundaries.Rights <strong>and</strong> PermissionsThe material <strong>in</strong> this publication is copyrighted. Copy<strong>in</strong>g <strong>and</strong>/or transmitt<strong>in</strong>g portionsor all <strong>of</strong> this work without permission may be a violation <strong>of</strong> applicable law. The InternationalBank for Reconstruction <strong>and</strong> Development / The World Bank encouragesdissem<strong>in</strong>ation <strong>of</strong> its work <strong>and</strong> will normally grant permission to reproduce portions<strong>of</strong> the work promptly.For permission to photocopy or repr<strong>in</strong>t any part <strong>of</strong> this work, please send a requestwith complete <strong>in</strong>formation to the Copyright Clearance Center Inc., 222 RosewoodDrive, Danvers, MA 01923, USA; telephone: 978-750-8400; fax: 978-750-4470; Internet:www.copyright.com.All other queries on rights <strong>and</strong> licenses, <strong>in</strong>clud<strong>in</strong>g subsidiary rights, should beaddressed to the Office <strong>of</strong> the Publisher, The World Bank, 1818 H Street NW, Wash<strong>in</strong>gton,DC 20433, USA; fax: 202-522-2422; e-mail: pubrights@worldbank.org.ISBN-13: 978-0-8213-7770-3eISBN: 978-0-8213-7823-6DOI: 10.1596/978-0-8213-7770-3Library <strong>of</strong> Congress Catalog<strong>in</strong>g-<strong>in</strong>-Publication Data<strong>Organization</strong> <strong>and</strong> performance <strong>of</strong> cotton sectors <strong>in</strong> <strong>Africa</strong> : learn<strong>in</strong>g from reformexperience / edited by David Tschirley, Col<strong>in</strong> Poulton, <strong>and</strong> Patrick Labaste.p. cm. — (Agriculture <strong>and</strong> rural development)Includes bibliographical references <strong>and</strong> <strong>in</strong>dex.ISBN 978-0-8213-7770-3 — ISBN 978-0-8213-7823-6 (electronic)1. <strong>Cotton</strong> trade—<strong>Africa</strong>, Sub-Saharan. 2. <strong>Cotton</strong> grow<strong>in</strong>g—<strong>Africa</strong>, Sub-Saharan.I. Tschirley, David L. (David Lawrence) II. Poulton, Col<strong>in</strong>. III. Labaste, Patrick, 1952-HD9087.A3587O74 2009338.1'73510967—dc222008049852Cover design: Patricia Hord Design
CONTENTSP reface xiiiAcknowledgmentsAbbreviations xixE xecutive SummaryxviixxiiiSection I. Introduction <strong>and</strong> Market Context1. Introduction 3David Tschirley2. Market Context 11John Baffes <strong>and</strong> Gérald EsturThe Supply Side: Exp<strong>and</strong><strong>in</strong>g Production <strong>and</strong> Exports 11The Dem<strong>and</strong> Side: Chang<strong>in</strong>g Focus <strong>of</strong> Dem<strong>and</strong> <strong>and</strong> Competitionwith Synthetic Fibers 14Decl<strong>in</strong><strong>in</strong>g <strong>and</strong> Volatile World Prices for L<strong>in</strong>t 14External Factors Affect<strong>in</strong>g World L<strong>in</strong>t Prices 16Increas<strong>in</strong>gly Str<strong>in</strong>gent Dem<strong>and</strong> for Quality Fiber 21L<strong>in</strong>t Market<strong>in</strong>g Strategies: The Role <strong>of</strong> the International<strong>Cotton</strong> Merchant 24Valorization <strong>of</strong> By-Products: Markets for <strong>Cotton</strong>seedOil <strong>and</strong> Cake 26v
Section II. Historical Background <strong>and</strong> Conceptual Approach3. Historical Background <strong>and</strong> Recent Institutional Evolution <strong>of</strong> <strong>Africa</strong>n<strong>Cotton</strong> <strong>Sectors</strong> 31Nicolas Gergely <strong>and</strong> Col<strong>in</strong> PoultonWest <strong>and</strong> Central <strong>Africa</strong> 31East <strong>and</strong> Southern <strong>Africa</strong> 384. A Typology <strong>of</strong> <strong>Africa</strong>n <strong>Cotton</strong> <strong>Sectors</strong> 45Col<strong>in</strong> Poulton <strong>and</strong> David TschirleyCompetition <strong>and</strong> Coord<strong>in</strong>ation 46Dynamic Considerations 49Predicted Strengths <strong>and</strong> Weaknesses <strong>of</strong> Different Sector Types 51Conceptualization <strong>of</strong> the L<strong>in</strong>ks between <strong>Cotton</strong> Sector <strong>Organization</strong> <strong>and</strong><strong>Performance</strong> 54Section III. Comparative Analysis: Core Activities <strong>and</strong>Service Delivery5. Pric<strong>in</strong>g Systems <strong>and</strong> Prices Paid to Growers 65John Baffes, David Tschirley, <strong>and</strong> Nicolas GergelyPric<strong>in</strong>g Mechanisms <strong>in</strong> WCA 66Pric<strong>in</strong>g Mechanisms <strong>in</strong> ESA 68Compar<strong>in</strong>g Pric<strong>in</strong>g <strong>Performance</strong> at the Farmer Level 68Conclusions 716. Input Credit <strong>and</strong> Extension 73David TschirleyMali <strong>and</strong> Cameroon: Government Monopolies that Show Similar Strengths<strong>and</strong> Weaknesses 74Local Monopolies: Vastly Differ<strong>in</strong>g Histories Complicate ComparativeAssessment <strong>in</strong> Mozambique <strong>and</strong> Burk<strong>in</strong>a Faso 75Competitive <strong>Sectors</strong>: Tanzania <strong>and</strong> Ug<strong>and</strong>a Struggle <strong>and</strong> Take VeryDifferent Paths to Ensure Input Supply, Extension, <strong>and</strong> Quality 76Concentrated, Market-Based <strong>Sectors</strong>: Zimbabwe <strong>and</strong>Zambia Perform Well on Input Credit <strong>and</strong> Extension,but Face Instability 77Conclusions 817. Quality Control 87Gérald Estur, Col<strong>in</strong> Poulton, <strong>and</strong> David TschirleyImpact <strong>of</strong> Quality on Export Prices 90Impact <strong>of</strong> Sector <strong>Organization</strong> on Quality 92Conclusions 96viCONTENTS
8. Valorization <strong>of</strong> Seed <strong>Cotton</strong> By-Products 97Nicolas Gergely <strong>and</strong> Col<strong>in</strong> PoultonStructure <strong>and</strong> <strong>Organization</strong> <strong>of</strong> Oil <strong>Sectors</strong> 97<strong>Performance</strong> <strong>of</strong> Oil <strong>Sectors</strong>, Seed Pric<strong>in</strong>g, <strong>and</strong> Returns to Farmers 101Conclusions 1039. <strong>Cotton</strong> Research 105Duncan Boughton <strong>and</strong> Col<strong>in</strong> Poulton<strong>Cotton</strong> Research <strong>Organization</strong> <strong>and</strong> <strong>Performance</strong> 106Articulat<strong>in</strong>g Research Dem<strong>and</strong>: Insights from the Typology? 108Conclusions 111Section IV. Comparative Analysis: Outcomes10. Yields <strong>and</strong> Returns to Farmers 117Col<strong>in</strong> Poulton, Patrick Labaste, <strong>and</strong> Duncan Boughton<strong>Cotton</strong> Yields 117Returns to Farmers 122Conclusions 131Annex A10. Methodology for Focus Group Discussion onFarmer Types 13411. Cost Efficiency <strong>of</strong> Companies, Overall Sector Competitiveness,<strong>and</strong> Macro Impact 139Nicolas GergelyCompany Cost Efficiency 140Overall Competitiveness 145Macro Impacts 14712. Conclusions 153Patrick Labaste, Col<strong>in</strong> Poulton, <strong>and</strong> David TschirleySummary <strong>of</strong> Expected <strong>and</strong> Realized <strong>Performance</strong> across Key Indicators 154Ways Forward for <strong>Africa</strong>n <strong>Cotton</strong>: Cross-Cutt<strong>in</strong>g Challenges 164Ways Forward for Particular Sector Types 174Appendix A : Statistical Tables 181Notes 205Bibliography 213Index 219CONTENTSvii
BOXES, FIGURES, AND TABLESBoxes2.1 The CFA Franc <strong>and</strong> <strong>Cotton</strong> In WCA 172.2 <strong>Cotton</strong> Subsidies 204.1 Is This Typology Specific to <strong>Africa</strong>? 504.2 Factors <strong>in</strong> Addition to Structure That Influence Behavior <strong>and</strong><strong>Performance</strong> 596.1 The Instability <strong>of</strong> Concentrated Systems 797.1 Why Is Quality Management So Hard with<strong>in</strong> Competitive <strong>Sectors</strong>? 948.1 Toll G<strong>in</strong>n<strong>in</strong>g <strong>in</strong> Zimbabwe 100Figures0.1 Location <strong>of</strong> <strong>Cotton</strong> <strong>Sectors</strong> with<strong>in</strong> <strong>Africa</strong>n <strong>Cotton</strong> Sector Typology xxvi1.1 Map <strong>of</strong> <strong>Africa</strong> Highlight<strong>in</strong>g Study Countries <strong>of</strong> WCA <strong>and</strong> ESA 71.2 Major SSA <strong>Cotton</strong> Producers (thous<strong>and</strong>s <strong>of</strong> tons <strong>of</strong> l<strong>in</strong>t, 2004–08 average) 82.1 Real Agricultural Price Index (based on 28 commodities) <strong>and</strong> <strong>Cotton</strong>Prices Adjusted by the MUV, 1960–2008 (1980 =1.0) 152.2 Nom<strong>in</strong>al <strong>Cotton</strong> Prices (US$ per kilogram) <strong>and</strong> Agricultural Price Index(October 2001 = 1.0), January 1985–September 2008 16ix
2.3 Real Exchange Rate for India, Ch<strong>in</strong>a, <strong>and</strong> Burk<strong>in</strong>a Faso aga<strong>in</strong>st theU.S. Dollar, Adjusted by the Consumer Price Indices, 2001–07(January 2002 = 1.0) 194.1 Decision Tree for <strong>Cotton</strong> Sector Typology 464.2 <strong>Africa</strong>n <strong>Cotton</strong> Sector Typology 484.3 L<strong>in</strong>k<strong>in</strong>g <strong>Cotton</strong> Sector <strong>Organization</strong> <strong>and</strong> <strong>Performance</strong> 557.1 Estimated Premium for Top Type <strong>of</strong> L<strong>in</strong>t dur<strong>in</strong>g 2006/07, by Country 917.2 Estimated Premium Weighted Average Basis, - by Country, U.S.cents/lb 9210.1 <strong>Cotton</strong> Yield Trends <strong>in</strong> World, WCA, <strong>and</strong> ESA (1970–2008) 11810.2 Average Worldwide Yields <strong>of</strong> Irrigated <strong>and</strong> Ra<strong>in</strong>fed <strong>Cotton</strong> 11910.3 Average Yields <strong>of</strong> Ra<strong>in</strong>fed <strong>Cotton</strong> <strong>in</strong> ESA Countries, WCA, <strong>and</strong> World,1994/95–2003/04 12010.4 Variation <strong>in</strong> Yields across Farmer Groups 12110.5 Proportion <strong>of</strong> <strong>Cotton</strong> Farmers by Farmer Group 12310.6 Net Marg<strong>in</strong>s after All Costs (<strong>in</strong>clud<strong>in</strong>g Labor), US$/kg 12910.7 Weighted Average Returns to Family Labor <strong>and</strong> All Labor <strong>in</strong>Study Countries 13011.1 Estimated Average G<strong>in</strong>n<strong>in</strong>g Costs at 2006 Capacity UtilizationRates <strong>in</strong> Study Countries 14211.2 Company <strong>Performance</strong> Indicator: Adjusted Total Cost, Farm Gate to FOT2006/07 14411.3 Total Value Added per capita by <strong>Cotton</strong> Sector, 2006/07 150Tables2.1 Global Balance <strong>of</strong> the <strong>Cotton</strong> Market (thous<strong>and</strong> metric tons) 132.2 Fiber Properties <strong>of</strong> the Cotlook A Index, Typical <strong>Africa</strong>n Upl<strong>and</strong> <strong>Cotton</strong>,<strong>and</strong> Top Quality L<strong>in</strong>t for Combed Yarns 232.3 Summary <strong>of</strong> Indicators <strong>of</strong> Valorization <strong>of</strong> By-Products 274.1 Trad<strong>in</strong>g Off: Strengths <strong>and</strong> Weaknesses <strong>of</strong> Different Sectoral Types 524.2 Key Indicators <strong>of</strong> <strong>Cotton</strong> Sector <strong>Performance</strong> 574.3 Expected <strong>Performance</strong> along Key Indicators 585.1 Summary <strong>of</strong> Pric<strong>in</strong>g Mechanisms <strong>in</strong> WCA Countries, 2006 67xBOXES, FIGURES, AND TABLES
5.2 Summary <strong>of</strong> Pric<strong>in</strong>g Mechanisms <strong>in</strong> ESA Countries, 2006 695.3 Summary <strong>of</strong> Producer Shares <strong>of</strong> FOT L<strong>in</strong>t Price (percent) 706.1 Summary <strong>of</strong> Input Supply <strong>and</strong> Extension Systems 827.1 Summary Information on Quality Control Mechanisms <strong>and</strong> Results <strong>in</strong>Study Countries 888.1 <strong>Cotton</strong> Seed Production <strong>and</strong> Process<strong>in</strong>g <strong>in</strong> Study Countries 989.1 Number <strong>of</strong> Varietal Releases <strong>in</strong> Study Countries 10810.1 Summary Crop Budgets by Farmer Type <strong>and</strong> Country 12410.2 Summary <strong>of</strong> Average Yield <strong>and</strong> Return per Day <strong>of</strong> Labor 13311.1 Comparative Analysis <strong>of</strong> G<strong>in</strong>n<strong>in</strong>g Costs (U.S. ¢ per kg<strong>of</strong> l<strong>in</strong>t cotton) 14111.2 Company <strong>Performance</strong> Indicator: Adjusted Costs, FarmGate to FOT (U.S.¢ per kg <strong>of</strong> l<strong>in</strong>t) 14311.3 Overall Competitiveness Indicator: FOT Costs/FOT Revenue,2006/07 (all costs <strong>and</strong> revenues <strong>in</strong> U.S.$/kg l<strong>in</strong>t) 14611.4 Total Value Added per Capita from <strong>Cotton</strong> Sector, 2006 14811.5 Net per Capita Budgetary Contribution <strong>of</strong> <strong>Cotton</strong> Sector, 2006 15112.1 Summary <strong>of</strong> Expected <strong>and</strong> Realized <strong>Performance</strong> acrossKey Indicators 155A1 Ben<strong>in</strong> 182A2 Burk<strong>in</strong>a Faso 184A3 Cameroon 186A4 Mali 188A5 Mozambique 190A6 Tanzania 192A7 Ug<strong>and</strong>a 194A8 Zambia 195A9 Zimbabwe 197A10 G<strong>in</strong>n<strong>in</strong>g <strong>and</strong> FOB-to-CIF Costs, All WCA Countries, 1970–2006(nom<strong>in</strong>al terms) 199A11<strong>Cotton</strong> Production, Area, <strong>and</strong> Yields, World <strong>and</strong> All WCA Countries,1970–2006 202BOXES, FIGURES, AND TABLESxi
PREFACE<strong>Cotton</strong> is a major source <strong>of</strong> foreign exchange earn<strong>in</strong>gs <strong>in</strong> more than 15 countriesacross all regions <strong>of</strong> Sub-Saharan <strong>Africa</strong>n (SSA) <strong>and</strong> a crucial source <strong>of</strong>cash <strong>in</strong>come for millions <strong>of</strong> rural people <strong>in</strong> these countries. The crop is, therefore,critical <strong>in</strong> the fight aga<strong>in</strong>st rural poverty. The World Bank <strong>and</strong> otherdevelopment <strong>in</strong>stitutions have been <strong>and</strong> are currently assist<strong>in</strong>g many cottonexport<strong>in</strong>gcountries <strong>of</strong> SSA to improve their cotton sector performancethrough projects support<strong>in</strong>g <strong>in</strong>vestment as well as through policy <strong>and</strong> <strong>in</strong>stitutionalreform.Many SSA countries have been implement<strong>in</strong>g or are consider<strong>in</strong>g implement<strong>in</strong>greforms <strong>of</strong> their cotton <strong>in</strong>dustries. The ultimate objective <strong>of</strong> thereform programs is to strengthen the competitiveness <strong>of</strong> cotton production,process<strong>in</strong>g, <strong>and</strong> exports <strong>in</strong> an <strong>in</strong>creas<strong>in</strong>gly dem<strong>and</strong><strong>in</strong>g world market <strong>and</strong> toensure long-term, susta<strong>in</strong>able, <strong>and</strong> equitable growth for these major sectors <strong>of</strong>many <strong>Africa</strong>n economies. The reform programs generally entail redef<strong>in</strong><strong>in</strong>g therole <strong>of</strong> the state; facilitat<strong>in</strong>g greater <strong>in</strong>volvement <strong>of</strong> the private sector <strong>and</strong>farmer organizations; ensur<strong>in</strong>g greater competition <strong>in</strong> <strong>in</strong>put <strong>and</strong> output markets;improv<strong>in</strong>g productivity through research <strong>and</strong> development, extension,<strong>and</strong> technology dissem<strong>in</strong>ation; <strong>and</strong> seek<strong>in</strong>g value addition through marketdevelopment <strong>and</strong> process<strong>in</strong>g <strong>of</strong> cotton l<strong>in</strong>t <strong>and</strong> by-products.This study was undertaken by the Environmentally <strong>and</strong> Socially Susta<strong>in</strong>ableDevelopment Department <strong>of</strong> the <strong>Africa</strong> Region <strong>of</strong> the World Bank to fill a perceivedgap <strong>in</strong> knowledge on the lessons to be drawn from nearly two decades<strong>of</strong> cotton sector reforms <strong>in</strong> SSA. Recent experience <strong>in</strong> policy dialogue, particularlywith West <strong>Africa</strong>n countries, shows that very <strong>of</strong>ten the analytical po<strong>in</strong>ts <strong>of</strong>xiii
eference are limited to neighbor<strong>in</strong>g countries. At a time when the design <strong>of</strong>cotton sector reform programs has become extremely complex <strong>and</strong> potentiallyrisky, stronger <strong>and</strong> broader analysis, draw<strong>in</strong>g on a broader array <strong>of</strong> empiricalevidence, <strong>and</strong> reflect<strong>in</strong>g strategically on potential options, would be very usefulfor policy makers. The lack <strong>of</strong> such analysis, especially <strong>of</strong> the reform optionsavailable <strong>and</strong> <strong>of</strong> their possible implications, partly expla<strong>in</strong>s the reluctance <strong>of</strong>many governments to engage <strong>in</strong> ambitious restructur<strong>in</strong>g <strong>of</strong> their cotton sectors.Therefore, the ma<strong>in</strong> objective <strong>of</strong> this study is to provide an <strong>in</strong>-depth <strong>and</strong>comparative analysis <strong>of</strong> the reforms that have been implemented by SSA cottonsectors s<strong>in</strong>ce 1990, <strong>and</strong>, from there, to establish l<strong>in</strong>ks between reforms <strong>and</strong>observable outcomes.The state <strong>of</strong> implementation <strong>of</strong> cotton sector reforms varies widely fromcountry to country. Serious structural reform <strong>of</strong> cotton sectors <strong>in</strong> East <strong>and</strong>Southern <strong>Africa</strong> (ESA) began <strong>in</strong> the mid-1990s. Reform <strong>in</strong> West <strong>and</strong> Central<strong>Africa</strong> (WCA) has been slower, for a complex set <strong>of</strong> reasons related to bothdomestic <strong>and</strong> <strong>in</strong>ternational concerns; among the latter, the case submitted tothe World Trade <strong>Organization</strong> (WTO) by the <strong>Cotton</strong>-4 countries (Ben<strong>in</strong>,Burk<strong>in</strong>a Faso, Chad, <strong>and</strong> Mali) regard<strong>in</strong>g market distortions caused by subsidies<strong>in</strong> Organisation for Economic Co-operation <strong>and</strong> Development (OECD)countries has given a political dimension to the issues <strong>in</strong> the sector, <strong>and</strong> figuresprom<strong>in</strong>ently among the reasons for resistance to reform <strong>in</strong> some countries.Resistance is also due to the perception—genu<strong>in</strong>e or not—that the impact<strong>of</strong> reforms on sector performance, <strong>and</strong> especially on small farmers, has been atbest mixed. A number <strong>of</strong> West <strong>Africa</strong>n leaders <strong>and</strong> policy makers strongly feelthat the reforms are likely to create major social problems, <strong>and</strong> the results <strong>in</strong>countries that have implemented reforms, particularly <strong>in</strong> ESA, do not make astrong case for privatization <strong>and</strong> liberalization <strong>of</strong> the cotton sectors. Given thecomplexities <strong>of</strong> reform programs <strong>and</strong> the uncerta<strong>in</strong>ties <strong>and</strong> fluctuations <strong>in</strong> theworld cotton market, it is also difficult to establish clear causal l<strong>in</strong>ks betweenstructural changes, risks faced by cotton companies after liberalization, <strong>and</strong>outcomes at the farm <strong>and</strong> sector levels.Abundant literature has been produced <strong>in</strong> recent years on cotton policies <strong>in</strong><strong>Africa</strong>. However, there has been little comparative analysis <strong>of</strong> the actual outcomes<strong>of</strong> cotton sector reforms as measured by growth <strong>and</strong> poverty reduction,<strong>and</strong> the ma<strong>in</strong> lessons to be drawn to <strong>in</strong>form future reform processes. Also, onlylimited attempts have been made to br<strong>in</strong>g together, compare, <strong>and</strong> assess reformexperiences from WCA <strong>and</strong> ESA. Bridg<strong>in</strong>g these knowledge gaps <strong>in</strong> an effort tobetter advise governments on cotton sector reform programs <strong>and</strong> policies providesthe fundamental rationale for this study.A number <strong>of</strong> SSA cotton sectors, especially <strong>in</strong> WCA, are currently fac<strong>in</strong>gserious short-term f<strong>in</strong>ancial difficulties. It is important to clarify that the purpose<strong>of</strong> this report is not to provide quick solutions to these short-run problems.Rather, it is to step back, build up a reliable broad assessment <strong>of</strong> cottonsector performance from detailed empirical <strong>in</strong>formation, <strong>and</strong> thereby providexivPREFACE
guidance for the design <strong>of</strong> strategies that will address the long-term challenges<strong>of</strong> cotton production <strong>and</strong> market<strong>in</strong>g <strong>in</strong> <strong>Africa</strong>.F<strong>in</strong>ally, to ensure that a broad perspective was brought to bear, the studywas entrusted to a team which <strong>in</strong>cludes <strong>in</strong>dependent researchers <strong>and</strong> experts <strong>in</strong>the field <strong>of</strong> cotton. Evidence from the analysis is reported regardless <strong>of</strong> whetherit confirms previous theories <strong>and</strong> hypotheses. Interpretations are suggested,but never imposed, <strong>and</strong> some care is taken to identify assumptions that drivethe analysis. For this reason, the authors, not the World Bank or other bilateraldonors, bear <strong>in</strong>dividually the full <strong>and</strong> f<strong>in</strong>al responsibility for the content <strong>of</strong> thisreport.PREFACExv
ACKNOWLEDGMENTSThis study was carried out by a World Bank team led by Patrick Labaste (LeadAgricultural Economist, Susta<strong>in</strong>able Development Department, <strong>Africa</strong> Region[AFTSD], World Bank). The ma<strong>in</strong> authors <strong>of</strong> the report are David Tschirley(Michigan State University) <strong>and</strong> Col<strong>in</strong> Poulton (School <strong>of</strong> Oriental <strong>and</strong> <strong>Africa</strong>nStudies, University <strong>of</strong> London). Other authors are Nicolas Gergely (consultant),John Baffes (Development Economics Vice Presidency, World Bank),Duncan Boughton (Michigan State University), <strong>and</strong> Gérald Estur (consultant,market<strong>in</strong>g <strong>and</strong> quality). The draft report was edited by Julie Dana (Agriculture<strong>and</strong> Rural Development/Commodity Risk Management Group [ARD/CRMG]World Bank). Review <strong>and</strong> edit<strong>in</strong>g <strong>of</strong> the f<strong>in</strong>al report were performed by PatrickLabaste, Col<strong>in</strong> Poulton, <strong>and</strong> David Tschirley. Julie Dana <strong>and</strong> Christophe Ravry(AFTSD, World Bank) provided <strong>in</strong>puts at various stages <strong>of</strong> the study.Prelim<strong>in</strong>ary desk reviews <strong>of</strong> country cases were carried out <strong>in</strong> September <strong>and</strong>October 2006 <strong>and</strong> discussed at a workshop held <strong>in</strong> Wash<strong>in</strong>gton <strong>in</strong> November2006. The second phase <strong>of</strong> the study took place between January <strong>and</strong> June 2007<strong>and</strong> entailed field visits <strong>in</strong> most <strong>of</strong> the countries <strong>in</strong> the sample. A second workshopwas held <strong>in</strong> Wash<strong>in</strong>gton <strong>in</strong> April 2007 to share the f<strong>in</strong>d<strong>in</strong>gs <strong>of</strong> the fieldwork, country case study analysis, <strong>and</strong> emerg<strong>in</strong>g f<strong>in</strong>d<strong>in</strong>gs from the comparativeanalysis as a basis for the preparation <strong>of</strong> the study’s report.This work was funded by the World Bank <strong>and</strong> by contributions from bilateral<strong>and</strong> multilateral trust funds, particularly from Belgium (Belgian Poverty ReductionProgram), the Netherl<strong>and</strong>s (Bank–Netherl<strong>and</strong> Partnership/CommodityRisk Management Group), the Swiss Secretariat for Economic Affairs (CRMG),<strong>and</strong> the European Union (All ACP, or Agricultural Commodities Programme).xvii
The team is thankful to the peer reviewers—B. Losch (AFTSD), A. Touré(AFTSD), C. Delgado (ARD), S. Jaffee (ARD), <strong>and</strong> B. Shamsiev (ECSSD, WorldBank)—as well as to Stephen M<strong>in</strong>k (AFTSD) <strong>and</strong> Quent<strong>in</strong> Wodon (PovertyReduction <strong>and</strong> Economic Management Group, World Bank), for their usefuladvice <strong>and</strong> guidance.The authors want to thank the various <strong>in</strong>dividuals <strong>in</strong> the cotton bus<strong>in</strong>ess, <strong>in</strong>Sub-Saharan <strong>Africa</strong> <strong>and</strong> elsewhere, who provided advice <strong>and</strong> <strong>in</strong>formation forthis study. It is not possible to give a full list <strong>of</strong> contributors, but the teamwould like to particularly acknowledge the <strong>in</strong>puts <strong>and</strong> contributions providedby R. Chaudhry <strong>and</strong> A. Gruère (International <strong>Cotton</strong> Advisory Committee);M. Cour, M. Le Grix, <strong>and</strong> L. Humbert (Agence Française de Développement);P. Texier (Développement des Agro-Industries du Sud [DAGRIS]); A. Gruson(SODECOTON); D. Bab<strong>in</strong>, C. Konaté, <strong>and</strong> I. Coulibaly (CIRAD/CMDT);D. Dakou (SOFITEX); L. Godart (SOCOMA); W. Maro, J. Kabissa, <strong>and</strong>M. Mtunga (Tanzania); B. Hanyani-Mlambo <strong>and</strong> J. Battershell (Zimbabwe);S. Kabwe <strong>and</strong> T. Isherwood (Dunavant/Zambia); <strong>and</strong> the management <strong>of</strong>Cargill/Zambia.Many thanks to colleagues <strong>in</strong> the World Bank field <strong>of</strong>fices: C. Ngomba,Y. Sangho, H. Gordon, <strong>and</strong> I. Nébié who facilitated the field visits <strong>in</strong> Cameroon,Mali, Tanzania, <strong>and</strong> Burk<strong>in</strong>a Faso, respectively, as well as to N. Ahouissoussi<strong>and</strong> A. Mwakanawele, who provided comments on country case studies, <strong>and</strong>M. Sadler who commented on the f<strong>in</strong>al draft report. The team also expresses itsappreciation to A. Diawara, M. Barton-Dock, K. Brooks, <strong>and</strong> J. McIntire fromthe World Bank who supported the <strong>in</strong>itiative right from the beg<strong>in</strong>n<strong>in</strong>g <strong>and</strong>made this undertak<strong>in</strong>g feasible.The team is also grateful to W. Olth<strong>of</strong> (Directorate General for Development,European Commission) <strong>and</strong> V. Gnassounou <strong>of</strong> the Secretariat <strong>of</strong> the<strong>Africa</strong>n, Caribbean <strong>and</strong> Pacific Group <strong>of</strong> States, <strong>in</strong> Brussels, for their <strong>in</strong>terest<strong>and</strong> support <strong>in</strong> this research project.F<strong>in</strong>ally, a special word <strong>of</strong> thanks to those who provided adm<strong>in</strong>istrativesupport throughout the process <strong>and</strong> contributed to the creation <strong>of</strong> the report:V. Vaselopulos, H. Page, M.-C. Fundi, M. Diallo, <strong>and</strong> P. Sadé <strong>of</strong> the World Bank;<strong>and</strong> J. Keel <strong>of</strong> Michigan State University, <strong>and</strong> special thanks to E. Kl<strong>in</strong>e <strong>of</strong> theWorld Bank, who h<strong>and</strong>led with remarkable care <strong>and</strong> dedication the f<strong>in</strong>al edit<strong>in</strong>g<strong>and</strong> publication process.xviiiACKNOWLEDGMENTS
ABBREVIATIONS¢ U.S. centACPAgriculture Commodities ProgrammeAMAAgricultural Market<strong>in</strong>g AuthorityARD/CRMG Agriculture <strong>and</strong> Rural Development/Commodity RiskManagement GroupASARECA Association for Strengthen<strong>in</strong>g Agricultural Research <strong>in</strong>Eastern <strong>and</strong> Central <strong>Africa</strong>BEACBank <strong>of</strong> Central <strong>Africa</strong>n StatesC4<strong>Cotton</strong>-4CDF<strong>Cotton</strong> Development FundCDO<strong>Cotton</strong> Development <strong>Organization</strong>CDT<strong>Cotton</strong> Development TrustCEMACCentral <strong>Africa</strong> Economic <strong>and</strong> M<strong>in</strong>etary CommunityCFACommunauté Française d’Afrique (French community<strong>of</strong> <strong>Africa</strong>)CFAFCFA francCFDTCompagnie Française pour le Développement desFibres TextilesCIFcost, <strong>in</strong>surance, <strong>and</strong> freightCIRADCentre International de Recherche Agronomique pourle DéveloppementCMB<strong>Cotton</strong> Market<strong>in</strong>g Boardxix
CMDTCompagnie Malienne de Développement desFibres TextilesCNACompanhia Nacional de Algodão (Mozambique)COTTCO<strong>Cotton</strong> Company <strong>of</strong> Zimbabwe Ltd.CORAF/WECARD Conseil Ouest et Centre <strong>Africa</strong><strong>in</strong> pour la Recherche et leDéveloppement AgricolesCRI<strong>Cotton</strong> Research InstituteDAGRISDéveloppement des Agro-Industries du Sud€ euroESAEast <strong>and</strong> Southern <strong>Africa</strong>EUEuropean UnionFAOFood <strong>and</strong> Agriculture <strong>Organization</strong> <strong>of</strong> theUnited NationsFFFrench francFOBfree on boardFOTfree on truckFUPROFédération de Unions de Producteurs du Bén<strong>in</strong>GDPgross domestic productGMgenetically modifiedGORsG<strong>in</strong>n<strong>in</strong>g Outturn RatiosGTZGerman Agency for Technical CooperationhahectareHUICOMA Huileries Cotonnières du MaliICACInternational <strong>Cotton</strong> Advisory CommitteeIMFInternational Monetary FundIPC<strong>in</strong>terpr<strong>of</strong>essional committeeIPM<strong>in</strong>tegrated pest managementIRCTInstitut de Recherches sur le Coton et les Textileskgkilogrammmmillimetermtmetric tonNCCNational <strong>Cotton</strong> CouncilODIOverseas Development InstituteOECDOrganisation for Economic Co-operation <strong>and</strong>DevelopmentOPCCOrganisation des Productions de Coton du CamerounSACCOsSav<strong>in</strong>gs <strong>and</strong> Credit CooperationsSN CITEC Société Nouvelle CITECSSASub-Saharan <strong>Africa</strong>TCATanga<strong>in</strong>a <strong>Cotton</strong> AssociationT shTanzanian shill<strong>in</strong>gUNPCBUnion Nationale des Producteurs de Coton du Burk<strong>in</strong>aU.S.United StatesxxABBREVIATIONS
US$U shWAEMUWCAWTOU.S. dollarUg<strong>and</strong>an shill<strong>in</strong>gWest <strong>Africa</strong> Economic <strong>and</strong> Monetary UnionWest <strong>and</strong> Central <strong>Africa</strong>World Trade <strong>Organization</strong>ABBREVIATIONSxxi
EXECUTIVE SUMMARY<strong>Cotton</strong> is a rare economic success story <strong>in</strong> Sub-Saharan <strong>Africa</strong> (SSA). While thecont<strong>in</strong>ent’s share <strong>of</strong> total world agricultural trade fell by about half from 1980to 2005, its share <strong>of</strong> world cotton exports more than doubled. The crop is amajor source <strong>of</strong> foreign exchange earn<strong>in</strong>gs <strong>in</strong> more than 15 countries <strong>of</strong> thecont<strong>in</strong>ent <strong>and</strong> is a crucial source <strong>of</strong> cash <strong>in</strong>come for millions <strong>of</strong> smallholderfarmers <strong>and</strong> their families. In some countries, especially <strong>in</strong> the Sahel, there isno short- to medium-term cash crop substitute for cotton for small farmers.Throughout SSA, cotton sectors face major challenges perta<strong>in</strong><strong>in</strong>g to competitiveness<strong>and</strong> susta<strong>in</strong>ability. In parts <strong>of</strong> West <strong>and</strong> Central <strong>Africa</strong> (WCA) sectorsare experienc<strong>in</strong>g f<strong>in</strong>ancial crises brought on by years <strong>of</strong> decl<strong>in</strong><strong>in</strong>g productivitythroughout the sectors, compounded by unfavorable external factors (exchangerate fluctuations <strong>and</strong> market distortions). Because <strong>of</strong> the size <strong>of</strong> the sectors—afunction <strong>of</strong> past success—these crises pose serious threats to the ruraleconomies <strong>and</strong> macroeconomic stability <strong>of</strong> the countries. Problems fac<strong>in</strong>g sectors<strong>in</strong> East <strong>and</strong> Southern <strong>Africa</strong> (ESA) do not have the same macroeconomicramifications. Nevertheless, some <strong>of</strong> the best performers <strong>in</strong> that region are currentlygo<strong>in</strong>g through credit default crises, <strong>and</strong> all face important challenges tocreat<strong>in</strong>g a solid basis for susta<strong>in</strong>ed growth over time.S<strong>in</strong>ce the early 1990s, governments <strong>of</strong> most cotton produc<strong>in</strong>g countries <strong>in</strong> SSAhave been implement<strong>in</strong>g sectoral reforms, <strong>of</strong>ten with the support <strong>of</strong> the WorldBank <strong>and</strong> other development <strong>in</strong>stitutions. These reform processes generallyentailed disengag<strong>in</strong>g the state, facilitat<strong>in</strong>g greater <strong>in</strong>volvement <strong>of</strong> the privatesector <strong>and</strong> producer organizations, ensur<strong>in</strong>g greater competition <strong>in</strong> <strong>in</strong>put <strong>and</strong>xxiii
output markets, improv<strong>in</strong>g productivity through research <strong>and</strong> development<strong>and</strong> technology dissem<strong>in</strong>ation, <strong>and</strong> seek<strong>in</strong>g value addition through marketdevelopment <strong>and</strong> process<strong>in</strong>g <strong>of</strong> cotton l<strong>in</strong>t <strong>and</strong> by-products.The pace <strong>and</strong> trajectory <strong>of</strong> cotton reform programs have varied widely fromcountry to country. Pr<strong>of</strong>ound structural reforms were <strong>in</strong>itiated <strong>in</strong> the early tomid-1990s with the privatization <strong>and</strong> liberalization <strong>of</strong> the cooperative-basedsystems <strong>in</strong> Tanzania <strong>and</strong> Ug<strong>and</strong>a, <strong>and</strong> the elim<strong>in</strong>ation <strong>of</strong> s<strong>in</strong>gle-channel systems<strong>in</strong> Zambia <strong>and</strong> Zimbabwe. The first two have cont<strong>in</strong>ued to see periodic structuralreforms as they had to deal with the problem <strong>of</strong> <strong>in</strong>put credit provision tosmallholder farmers <strong>in</strong> sectors with many g<strong>in</strong>ners; Zambia <strong>and</strong> Zimbabwe haveseen less radical policy change but have struggled with the problems caused bynew entrants. Reform <strong>in</strong> WCA has been more recent <strong>and</strong> slower paced, as thesheer size <strong>of</strong> the sectors <strong>and</strong> the greater role <strong>of</strong> the state has made reforms moredifficult, from both political <strong>and</strong> practical perspectives. In several countrieswhere the reform process is less advanced, there is a common perceptionamong policy makers <strong>and</strong> many stakeholders that the experiences <strong>of</strong> reformselsewhere, especially <strong>in</strong> ESA, have resulted <strong>in</strong> unsatisfactory outcomes <strong>and</strong>/orpatterns <strong>of</strong> near-term disruption.This study was, therefore, motivated by the perceived need for a broad, empirical,analytically based assessment <strong>of</strong> reform experience across a range <strong>of</strong> <strong>Africa</strong>n countriesthat would yield lessons <strong>and</strong> guidance to policy makers, other local stakeholders, <strong>and</strong><strong>in</strong>terested donors agencies.The conviction that such an effort was worthwhile emerged from fourobservations:■■■■First, much <strong>of</strong> the public debate on cotton <strong>in</strong> recent years has been excessivelyfocused on particular, highly visible, <strong>and</strong> sensitive issues, such asOrganisation for Economic Co-operation <strong>and</strong> Development (OECD) <strong>and</strong>Ch<strong>in</strong>ese subsidies to their cotton sectors. Although certa<strong>in</strong>ly important,such subsidies are not the prime determ<strong>in</strong>ants <strong>of</strong> long-term competitiveness<strong>of</strong> cotton production <strong>and</strong> trade <strong>in</strong> SSA.Second, the policy dialogue on the serious challenges fac<strong>in</strong>g <strong>Africa</strong>n cottonhas <strong>of</strong>ten been highly polarized. In the Francophone West <strong>Africa</strong>, for example,sector stakeholders have typically focused on the need to preserve <strong>in</strong>putcredit <strong>and</strong> extension systems, while donors have focused primarily on costefficiency <strong>and</strong> long-term susta<strong>in</strong>ability. In fact, it is clear that both issues areequally important <strong>and</strong> need to be considered together.Third, relatively little susta<strong>in</strong>ed attention has been paid to the precise<strong>in</strong>stitutional structure that postreform sectors could take or why a particularstructure might be preferable. Yet any proposal for change mustaddress such issues if reform is to have a reasonable chance <strong>of</strong> achiev<strong>in</strong>gdesired goals.F<strong>in</strong>ally, very little has been done to comparatively assess the differ<strong>in</strong>g experiences<strong>of</strong> WCA <strong>and</strong> ESA <strong>and</strong> draw lessons across the regions.xxivEXECUTIVE SUMMARY
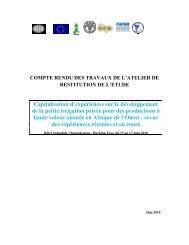
METHODOLOGY AND CONCEPTUAL FRAMEWORK:A TYPOLOGY OF AFRICAN COTTON SECTORSThis comparative study was undertaken to exam<strong>in</strong>e the complex issues raisedabove, with a view to br<strong>in</strong>g<strong>in</strong>g fresh <strong>in</strong>sights to <strong>in</strong>form <strong>and</strong> guide decisionsrather than fuel<strong>in</strong>g old controversies. To implement its study, the World Bankbrought together a large <strong>and</strong> diverse team <strong>of</strong> experts <strong>and</strong> researchers withextensive experience <strong>in</strong> cotton sectors across the cont<strong>in</strong>ent. The review wasbased on detailed case studies <strong>in</strong> n<strong>in</strong>e <strong>of</strong> the ma<strong>in</strong> cotton produc<strong>in</strong>g countries<strong>of</strong> Sub-Saharan <strong>Africa</strong>: Ben<strong>in</strong>, Burk<strong>in</strong>a Faso, Cameroon, <strong>and</strong> Mali <strong>in</strong>WCA; <strong>and</strong> Mozambique, Tanzania, Ug<strong>and</strong>a, Zambia, <strong>and</strong> Zimbabwe <strong>in</strong> ESA.The study analyzes systematically <strong>and</strong> thoroughly the relations between sectororganization <strong>and</strong> sector performance <strong>and</strong> outcomes, with the aim <strong>of</strong>establish<strong>in</strong>g evidence-based causality l<strong>in</strong>ks between a given sector organization<strong>and</strong> a series <strong>of</strong> performance <strong>in</strong>dicators. Conversely, it does not pretendto provide detailed prescriptions to guide further reform processes <strong>in</strong> <strong>in</strong>dividualcountries. Stakeholders <strong>in</strong> the various countries will need to drawimplications from the comparative analysis <strong>and</strong> apply pert<strong>in</strong>ent lessons totheir local circumstances.The study followed a four-step process. It first drew on available experienceto develop a conceptual framework that would generate testable hypotheses.Next, it developed an analytical framework that <strong>in</strong>cluded the characterization <strong>of</strong>clearly dist<strong>in</strong>ct sector types—based on the market structure <strong>and</strong> associatedframework for seed cotton—<strong>and</strong> a set <strong>of</strong> empirical performance <strong>in</strong>dicators withwhich to test the hypotheses. Third, the team used the country case studies,together with a broad range <strong>of</strong> <strong>in</strong>formation sources (literature review, historicalanalysis, key <strong>in</strong>formant <strong>in</strong>terviews, focus group <strong>in</strong>terviews, secondary quantitativedata, <strong>and</strong> newly collected data), to “tell the story” <strong>of</strong> reform <strong>in</strong> each country<strong>and</strong> to <strong>in</strong>form the comparative analysis. This story entailed comput<strong>in</strong>g the <strong>in</strong>dicators;benchmark<strong>in</strong>g performance, past <strong>and</strong> current, by country <strong>and</strong> sectortype; <strong>and</strong> draw<strong>in</strong>g conclusions on the major drivers <strong>of</strong> that performance, particularlywith regard to sector structure.The conceptual framework for this comparative analysis <strong>of</strong> cotton sectors restson the idea that economic systems benefit from both competition <strong>and</strong> coord<strong>in</strong>ation,but that <strong>in</strong> the real world <strong>of</strong> imperfect markets <strong>and</strong> weak states there is likelyto be a trade-<strong>of</strong>f between them. Conventionally produced cotton is an <strong>in</strong>put<strong>in</strong>tensivecrop, so <strong>Africa</strong>’s frequently fail<strong>in</strong>g <strong>in</strong>put <strong>and</strong> credit markets present aparticular challenge to its development. National quality reputation for cottonalso rema<strong>in</strong>s important, provid<strong>in</strong>g a second major justification for sector coord<strong>in</strong>ation.Competition is important to ensur<strong>in</strong>g efficiency <strong>and</strong> equitable shar<strong>in</strong>g<strong>of</strong> benefits between buyers <strong>and</strong> sellers. Yet, too much competition will makeit difficult or impossible for stakeholders to engage <strong>in</strong> the coord<strong>in</strong>ation neededto provide important services such as quality control, <strong>in</strong>put credit, research,<strong>and</strong> extension. A well-function<strong>in</strong>g cotton sector is one that strikes a balanceEXECUTIVE SUMMARYxxv
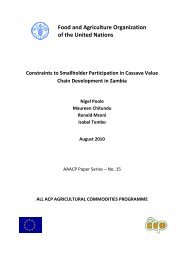
etween these compet<strong>in</strong>g needs, provid<strong>in</strong>g sufficient benefits to all stakeholdersso that the system is able to ma<strong>in</strong>ta<strong>in</strong> itself <strong>and</strong> grow.This hypothesized trade-<strong>of</strong>f is at the center <strong>of</strong> the organiz<strong>in</strong>g feature <strong>of</strong> thisbook: a typology <strong>of</strong> cotton sectors <strong>in</strong> SSA based on the structure <strong>of</strong> the market forthe purchase <strong>of</strong> seed cotton <strong>and</strong> <strong>of</strong> the regulatory framework <strong>in</strong> which farms <strong>and</strong>firms operate. Market structure can be def<strong>in</strong>ed by the nature <strong>of</strong> players <strong>and</strong>entities <strong>in</strong> the sector, together with the distribution <strong>of</strong> roles <strong>and</strong> power betweenthem. The regulatory framework is the set <strong>of</strong> rules, regulations, <strong>and</strong> other legal<strong>in</strong>struments that are imposed on participants <strong>in</strong> the sector to enable it to operate<strong>and</strong> limit conflicts. These two pillars <strong>of</strong> the framework (market structure<strong>and</strong> regulatory framework) are based on the observation that structure has afundamental <strong>in</strong>fluence on the balance that a country is able to strike betweencompetition <strong>and</strong> coord<strong>in</strong>ation, <strong>and</strong> that regulatory frameworks can modify thecompetition–coord<strong>in</strong>ation trade-<strong>of</strong>f but must deal with structure as it exists.Together with basic characteristics common to nearly all SSA economies (suchas the predom<strong>in</strong>ance <strong>of</strong> undercapitalized smallholder farmers, widespread failure<strong>of</strong> <strong>in</strong>put <strong>and</strong> credit markets, <strong>and</strong> weak legal systems), these two factorsestablish the opportunities <strong>and</strong> constra<strong>in</strong>ts that cotton sector stakeholdersoperate with<strong>in</strong>.Figure 1 below shows the five sector types identified <strong>in</strong> the typology, alongwith each country’s current location <strong>and</strong> its evolution over the recent past.Solid arrows depict changes that have taken place <strong>in</strong> sector organization s<strong>in</strong>cethe mid-1990s; dashed arrows suggest changes that may be under way. Thel<strong>in</strong>es show<strong>in</strong>g recent changes <strong>in</strong> sector organization illustrate the po<strong>in</strong>t thatreform is not a one-<strong>of</strong>f event <strong>and</strong> that most sectors are still seek<strong>in</strong>g an optimalstructure to cope with the challenges <strong>of</strong> rema<strong>in</strong><strong>in</strong>g <strong>in</strong>ternationally competitive.National monopolies are now found only <strong>in</strong> WCA <strong>and</strong>, with the exception <strong>of</strong>Senegal, are owned <strong>and</strong> operated by public or mixed companies. Local monopolieshave more than one firm, but they establish geographical areas with<strong>in</strong>Figure 0.1 Location <strong>of</strong> <strong>Cotton</strong> <strong>Sectors</strong> with<strong>in</strong> <strong>Africa</strong>n <strong>Cotton</strong>Sector TypologyNational monopolyCameroonMaliChad*Senegal*(private)Local monopoly(“concession”)MozambiqueBurk<strong>in</strong>a FasoCôte d’Ivoire*Ghana*Concentrated,market-based Competitive HybridZambiaZimbabweTanzaniaBen<strong>in</strong>Ug<strong>and</strong>aNote: * Not <strong>in</strong>cluded <strong>in</strong> this studyxxviEXECUTIVE SUMMARY
which each has an exclusive right to purchase all cotton (<strong>and</strong>, typically, a responsibilityto promote it). G<strong>in</strong>n<strong>in</strong>g companies compete directly with each other <strong>in</strong>concentrated <strong>and</strong> competitive sectors. The basic difference between these systemslies <strong>in</strong> the number <strong>of</strong> g<strong>in</strong>n<strong>in</strong>g firms. Thus, Zambia <strong>and</strong> Zimbabwe wereboth, until fairly recently, effectively duopsonies <strong>in</strong> which the top two firmsaccounted for 90 percent or more <strong>of</strong> seed cotton purchases. By contrast, <strong>in</strong> Tanzaniathere are about 30 g<strong>in</strong>ners, the top 5 <strong>of</strong> which have only about a 40 percentmarket share (<strong>and</strong> these top 5 typically change from year to year).This difference <strong>in</strong> market concentration is also associated with an importantdifference <strong>in</strong> the nature <strong>of</strong> competition across the two sector types. In concentratedsectors, firms compete (on reputation) for the right to transact with producersthrough the com<strong>in</strong>g season. By contrast, <strong>in</strong> competitive sectors there are few<strong>in</strong>centives for preharvest service provision. Instead, they compete for seed cottonon the basis <strong>of</strong> price at harvest time. F<strong>in</strong>ally, hybrid systems are a potentiallydiverse group, emerg<strong>in</strong>g either out <strong>of</strong> attempts to liberalize a nationalmonopoly (Ben<strong>in</strong>) or to solve the problems unleashed by liberalization <strong>in</strong> asector with a competitive structure (Ug<strong>and</strong>a).<strong>Performance</strong> across the different sectors <strong>and</strong> sector-types was assessedthrough a range <strong>of</strong> efficiency, effectiveness, <strong>and</strong> distributional <strong>in</strong>dicators, someat the micro (that is, farm or enterprise) level <strong>and</strong> others at more sectoral ormacro levels. Some <strong>of</strong> these <strong>in</strong>dicators are readily quantifiable, while others arebased on qualitative “order <strong>of</strong> magnitude” judgments. They <strong>in</strong>clude process<strong>in</strong>dicators (prices paid to farmers, services delivered to them, quality management,technology creation <strong>and</strong> dissem<strong>in</strong>ation, valorization <strong>of</strong> by-products),<strong>and</strong> outcome <strong>in</strong>dicators for stakeholders (revenue <strong>and</strong> pr<strong>of</strong>itability at farmlevel, economic efficiency, value added, macro impacts), as well as an assessment<strong>of</strong> the logical l<strong>in</strong>ks between these. The conceptual framework generatesclear expectations about how different sector types would perform on many,though not all, <strong>of</strong> these <strong>in</strong>dicators. It also recognizes that structural factors maynot fully determ<strong>in</strong>e outcomes, as other factors will also <strong>in</strong>fluence competitiveness,<strong>in</strong>centives, <strong>and</strong> the acceptability <strong>and</strong> impacts <strong>of</strong> reform measures.EMPIRICAL RESULTS: STRONG LINKS BETWEEN SECTORSTRUCTURE AND PERFORMANCEIn large measure, the analysis showed that sector structure has a major <strong>and</strong> predictable<strong>in</strong>fluence on performance.This is particularly the case when look<strong>in</strong>g at how a sector performs onprocess <strong>in</strong>dicators.■Competitive, market-based systems deliver relatively high prices to farmers,but are weak on <strong>in</strong>put credit provision, extension, <strong>and</strong> quality. Evidenceis strong <strong>in</strong> Tanzania <strong>and</strong> Ug<strong>and</strong>a that, with<strong>in</strong> market-based systems,EXECUTIVE SUMMARYxxvii
■■■■■competition <strong>in</strong>creases prices paid to farmers, a direct result <strong>of</strong> <strong>in</strong>tense competitionamong companies. Despite the recent high prices paid by the WCAmonopoly systems, tak<strong>in</strong>g a 20-year perspective, WCA sectors have beenlargely outperformed on price by Tanzania <strong>and</strong> Ug<strong>and</strong>a. However, as expected,competitively structured sectors perform poorly on <strong>in</strong>put credit provision,extension, <strong>and</strong> quality. This f<strong>in</strong>d<strong>in</strong>g stems directly from the great difficulty <strong>in</strong>coord<strong>in</strong>at<strong>in</strong>g across more than a few companies, whether this coord<strong>in</strong>ation isto prevent side-sell<strong>in</strong>g or to agree on discounts to be paid for poor-quality seedcotton.Concentrated <strong>and</strong> monopoly (national or local) sectors can performwell on prices paid to farmers, but such performance depends on thestrategic priorities <strong>of</strong> dom<strong>in</strong>ant companies (which can vary over time), onthe existence <strong>of</strong> political <strong>in</strong>terference (if any), <strong>and</strong> on the voice <strong>of</strong> cottonfarmers <strong>in</strong> price negotiations. S<strong>in</strong>ce 2000, concentrated sectors (Zambia<strong>and</strong> Zimbabwe) have performed relatively poorly on prices to farmers,while national monopolies have paid unsusta<strong>in</strong>ably high (yet politicallybacked) prices that have been an important contributor to these sectors’fiscal crises.Concentrated sectors do well on quality management <strong>and</strong>, to a certa<strong>in</strong>extent, delivery <strong>of</strong> services to farmers. Concentrated sectors perform beston quality. They also provide <strong>in</strong>put credit <strong>and</strong> extension advice to largeshares <strong>of</strong> cotton farmers, although farmer coverage is not as complete as <strong>in</strong>national <strong>and</strong> local monopolies.National <strong>and</strong> local monopolies <strong>in</strong> WCA have been able to provide <strong>in</strong>putcredit <strong>and</strong> extension to a large number <strong>of</strong> farmers <strong>and</strong> achieve relativelyhigh yields as well as high <strong>and</strong> fairly stable credit repayment rates. However,there are reasons to believe that the quality <strong>of</strong> extension assistance <strong>in</strong> thesemonopoly systems has probably decl<strong>in</strong>ed over the past 20 years, while farmyields have been stagnant or decl<strong>in</strong><strong>in</strong>g s<strong>in</strong>ce the mid-1980s.Research efficacy is not clearly l<strong>in</strong>ked to sector type. One hypothesis wasthat a small number <strong>of</strong> large companies should be better placed to <strong>in</strong>fluenceresearch performance than multiple small g<strong>in</strong>ners, but <strong>in</strong> practice this speculationwas not borne out. The ma<strong>in</strong> reason for this unexpected f<strong>in</strong>d<strong>in</strong>g isthat governments have been slow to allow private g<strong>in</strong>ners to contribute toresearch management, even where they have been allowed to assumeresponsibility for most other aspects <strong>of</strong> national cotton production <strong>and</strong>market<strong>in</strong>g; most research programs rema<strong>in</strong> firmly with<strong>in</strong> the public sector.Low valorization <strong>of</strong> cotton seeds can be observed <strong>in</strong> monopoly systems.In the case <strong>of</strong> by-product valorization, WCA sectors (especially Mali <strong>and</strong>Burk<strong>in</strong>a Faso) receive low prices for cottonseed, an outcome related to thehistory <strong>of</strong> vertical <strong>in</strong>tegration with<strong>in</strong> the sector. Otherwise, major determ<strong>in</strong>ants<strong>of</strong> prices received <strong>in</strong>clude whether a country is l<strong>and</strong>locked <strong>and</strong> thestrength <strong>of</strong> local dem<strong>and</strong> for cake for cattle feed. In any case, by-productvalorization has so far received <strong>in</strong>sufficient attention <strong>in</strong> the study <strong>of</strong> cottonxxviiiEXECUTIVE SUMMARY
sectors <strong>and</strong> is an area where value could be added <strong>and</strong> redistributed t<strong>of</strong>armers through greater open<strong>in</strong>g <strong>of</strong> the sector <strong>and</strong> competition.<strong>Performance</strong> on outcome <strong>in</strong>dicators is less clearly tied to sector type,because many outcomes are a function <strong>of</strong> more than one process, <strong>and</strong> a givensector type might perform well on some processes but poorly on others.Returns to farmers are a clear example:■■■Competitively structured sectors pay high prices to farmers but are unableto provide <strong>in</strong>put credit or extension; as a result, they tend to generate lowyields. They also score poorly on l<strong>in</strong>t quality, which limits the price advantagethey can pass to farmers.Concentrated sectors do better on <strong>in</strong>put credit <strong>and</strong> extension (<strong>and</strong> thus onyields), <strong>and</strong> they also do well on quality. But they may pass little if any <strong>of</strong> thequality premium on to farmers, <strong>and</strong> they may have a tendency to chargehigher than market rates for the <strong>in</strong>puts they provide. As a result, returns t<strong>of</strong>armers are similar <strong>in</strong> Zambia’s concentrated system <strong>and</strong> Tanzania’s competitivelystructured one.<strong>Sectors</strong> perform<strong>in</strong>g best on returns to farmers are those that have benefitedfrom many years <strong>of</strong> susta<strong>in</strong>ed <strong>in</strong>vestment <strong>in</strong> research <strong>and</strong> extension, <strong>and</strong>that, therefore, have been able to raise the productivity <strong>of</strong> large numbers <strong>of</strong>farmers; most WCA countries <strong>and</strong> Zimbabwe <strong>in</strong> ESA fall <strong>in</strong>to this category.However, <strong>in</strong> WCA, this performance has decl<strong>in</strong>ed dur<strong>in</strong>g the past twodecades, as have the returns for a majority <strong>of</strong> farmers.Dur<strong>in</strong>g the present decade, national monopolies have performed very wellon one macro <strong>in</strong>dicator (valued added per capita) but very poorly on anotherone (net budgetary contribution per capita). However, the positive performanceon per capita value added <strong>in</strong> Burk<strong>in</strong>a Faso <strong>and</strong> Mali has come at a steep cost tothe rest <strong>of</strong> the economy, especially to the state budget, particularly <strong>in</strong> recent years.Tanzania’s competitively structured sector performs very well on value addedper capita dur<strong>in</strong>g some years, but poorly dur<strong>in</strong>g others, as a result <strong>of</strong> highly variableproduction. A key <strong>in</strong>sight from the work is that this variable production isa direct result <strong>of</strong> Tanzania’s sectoral structure. Because farmers do not have the<strong>in</strong>centive <strong>of</strong> <strong>in</strong>-k<strong>in</strong>d <strong>in</strong>put credit to produce cotton, they move <strong>in</strong> <strong>and</strong> out <strong>of</strong> thecrop accord<strong>in</strong>g to expected price, much as they would with any other cash crop.Company efficiency is one outcome <strong>in</strong>dicator clearly tied to sector structure.Companies <strong>in</strong> market-based sectors are most efficient, with competitively structuredsectors more efficient than concentrated sectors, but with both greatlyoutperform<strong>in</strong>g companies <strong>in</strong> local <strong>and</strong> national monopolies. The comb<strong>in</strong>ation<strong>of</strong> high farmer prices dur<strong>in</strong>g the past six to seven years plus relatively <strong>in</strong>efficientcompanies—that is, those with high operat<strong>in</strong>g costs—means that the WCAmonopolies are, by a substantial marg<strong>in</strong>, currently the least <strong>in</strong>ternationallycompetitive sectors <strong>in</strong> the study. Free-on-truck cost to value ratios <strong>in</strong> WCAEXECUTIVE SUMMARYxxix
monopolies range from 0.98 to 1.15, compared with a range <strong>of</strong> 0.76 to 0.88 <strong>in</strong>all other countries except Ug<strong>and</strong>a. Although it is clear that the WCA nationalmonopoly model has generated strong returns to very large numbers <strong>of</strong> farmers,poor <strong>in</strong>centives for cost efficiency have underm<strong>in</strong>ed the <strong>in</strong>ternational competitiveness<strong>of</strong> these sectors, as well as their contribution to the wider economy.In Zambia <strong>and</strong> Zimbabwe, <strong>and</strong> also <strong>in</strong> Mozambique, the competitive costto-valueratios have been achieved <strong>in</strong> part because <strong>of</strong> the low prices paid t<strong>of</strong>armers. In Mozambique (which scores 0.79 by the study’s measure), the seedcotton price has been 20 percent to 30 percent lower than prices <strong>in</strong> all otherESA countries. In Zambia (the most <strong>in</strong>ternationally competitive sector <strong>in</strong> thestudy at 0.76), the seed cotton price to farmers is substantially higher than <strong>in</strong>Mozambique <strong>and</strong> not far below that <strong>in</strong> Tanzania <strong>in</strong> absolute terms, but itreflects little <strong>of</strong> the substantial quality premium that Zambian companiesreceive on the <strong>in</strong>ternational market.CORE CHALLENGES: PERFORMANCE OF AFRICANCOTTON SECTORS IN THE GLOBAL CONTEXTThe comparison <strong>of</strong> the n<strong>in</strong>e cotton sectors <strong>of</strong> the study sample concluded thatno s<strong>in</strong>gle market sector type performed so well that it can be considered thebenchmark for all others. There are strong correlations between sector type<strong>and</strong> performance results, yet there is no ideal model among the study countries<strong>and</strong> trade-<strong>of</strong>fs have to be considered. There are clear <strong>in</strong>dications that factors <strong>in</strong>addition to sector structure do have an <strong>in</strong>fluence. A given sectoral type can performwell or poorly on f<strong>in</strong>al outcome <strong>in</strong>dicators, <strong>and</strong> this performance isstrongly <strong>in</strong>fluenced by history (<strong>in</strong>clud<strong>in</strong>g past <strong>in</strong>vestments), culture, managerialeffectiveness (which is partly a function <strong>of</strong> culture <strong>and</strong> <strong>in</strong>dividual personalities),<strong>and</strong> agro-ecological endowments. Nevertheless, sector type (marketstructure <strong>and</strong> associated regulatory framework) does say a great deal about thekey challenges that will be most difficult for a sector to meet, <strong>and</strong> about themost promis<strong>in</strong>g approaches for deal<strong>in</strong>g with those challenges. For example,<strong>in</strong>put credit, extension, <strong>and</strong> quality will be problems <strong>in</strong> competitive systems;prices to farmers will tend to be low <strong>in</strong> concentrated sectors; company efficiencywill tend to be poor <strong>in</strong> monopolies.The high <strong>in</strong>tr<strong>in</strong>sic quality <strong>of</strong> <strong>Africa</strong>n fiber, the fact that it is h<strong>and</strong>picked, <strong>and</strong>the low unit production costs <strong>of</strong> its smallholder production base give <strong>Africa</strong>ncotton important growth potential on the world market <strong>in</strong> the long run. However,an assessment <strong>of</strong> relative performance among <strong>Africa</strong>n countries <strong>and</strong> what theyneed to do to be competitive reveals that all sectors show productivity <strong>and</strong> performancegaps on a global scale <strong>and</strong> therefore generally lag well beh<strong>in</strong>d the best performers<strong>in</strong> the world. Across the full spectrum <strong>of</strong> <strong>Africa</strong>n cotton <strong>in</strong>dustries, corechallenges for competitiveness <strong>and</strong> pr<strong>of</strong>itability have emerged. All <strong>Africa</strong>n cottonsectors face <strong>in</strong>creas<strong>in</strong>g competition from other countries <strong>and</strong> cont<strong>in</strong>entsxxxEXECUTIVE SUMMARY
<strong>and</strong> from synthetic fibers, <strong>and</strong> thus they face cont<strong>in</strong>ual pressure on prices.<strong>Africa</strong>n cotton sectors must therefore cont<strong>in</strong>ually strive to cut costs, raise productivity,improve l<strong>in</strong>t quality, <strong>and</strong> add value if they are to ma<strong>in</strong>ta<strong>in</strong> attractivereturns to farmers <strong>and</strong> to make a positive contribution to national povertyreduction goals. To achieve this goal, cotton sectors need to improve their performanceon critical factors, such as the responsiveness <strong>and</strong> efficiency <strong>of</strong>research <strong>and</strong> extension, technology transfer <strong>in</strong> areas such as genetically modifiedstra<strong>in</strong> dissem<strong>in</strong>ation, l<strong>in</strong>t quality management <strong>and</strong> market<strong>in</strong>g, soil conservation,<strong>and</strong> technical support to farmers <strong>and</strong> farmer organizations.Effective strategies for <strong>Africa</strong>n cotton sectors should, therefore, comb<strong>in</strong>e<strong>in</strong>stitutional <strong>in</strong>novations <strong>and</strong> reforms with necessary <strong>in</strong>vestments <strong>in</strong> key publicgoods. The three broad objectives that all <strong>Africa</strong>n cotton sectors should pursueare (a) achiev<strong>in</strong>g greater value through improved quality, market<strong>in</strong>g, <strong>and</strong> valorization<strong>of</strong> by-products; (b) bridg<strong>in</strong>g competitiveness gaps through farmlevelproductivity <strong>and</strong> g<strong>in</strong>n<strong>in</strong>g efficiency; <strong>and</strong> (c) improv<strong>in</strong>g susta<strong>in</strong>abilitythrough <strong>in</strong>stitutional development <strong>and</strong> capacity-build<strong>in</strong>g <strong>of</strong> stakeholders, aswell as strengthen<strong>in</strong>g <strong>of</strong> governance <strong>and</strong> regulatory structures <strong>and</strong> managementsystems. Some <strong>of</strong> these actions could usefully be tackled at a regionallevel, as well as nationally, <strong>and</strong> could benefit from donor support.The analysis also showed that a country’s history, current sector type, <strong>and</strong>political imperatives also have a significant <strong>in</strong>fluence on the feasible path <strong>of</strong><strong>in</strong>stitutional change over time. For example, concentrated (market-based) sectorsemerge from the analysis as perhaps the best performers, do<strong>in</strong>g well on awide range <strong>of</strong> <strong>in</strong>dicators. Yet <strong>in</strong> the current sett<strong>in</strong>g <strong>in</strong> SSA, marked by <strong>in</strong>stitutional<strong>and</strong> human capacity weakness, these sectors have a difficult time ma<strong>in</strong>ta<strong>in</strong><strong>in</strong>gtheir concentrated structure. They tend to slide toward greater competition,with predictable decl<strong>in</strong>es <strong>in</strong> performance on <strong>in</strong>put credit, extension, <strong>and</strong>quality. A worrisome f<strong>in</strong>d<strong>in</strong>g is that, as competition <strong>in</strong>creases <strong>in</strong> concentratedsectors, <strong>in</strong>put supply <strong>and</strong> quality control may decl<strong>in</strong>e before prices paid t<strong>of</strong>armers show noticeable signs <strong>of</strong> improvement. Such a pattern is <strong>of</strong> specialconcern because these negative impacts are quite difficult to reverse.STRUCTURE AS A KEY FACTOR OF COMPETITIVENESSAND SUSTAINABILITY OF AFRICAN COTTON SECTORSImplicit <strong>in</strong> reform programs <strong>in</strong> cotton <strong>and</strong> other sectors <strong>in</strong> <strong>Africa</strong> to date hasbeen the notion that structure matters, at least <strong>in</strong>s<strong>of</strong>ar as it promotes or impedescompetition. One <strong>of</strong> the ma<strong>in</strong> conclusions <strong>of</strong> this analysis is that structure doesexpla<strong>in</strong> a good share <strong>of</strong> the variability <strong>in</strong> sector performance. This is anextremely important f<strong>in</strong>d<strong>in</strong>g for decision makers, as well as a clear encouragementfor governments to pursue reforms <strong>of</strong> their cotton sectors as a means <strong>of</strong>ensur<strong>in</strong>g future competitiveness. At the same time, this analysis recognizes thatother factors, such as history, managerial competence, geography, politics,EXECUTIVE SUMMARYxxxi
macroeconomics, developments <strong>in</strong> compet<strong>in</strong>g or complementary sectors, <strong>and</strong>even luck, also play a role that cannot be ignored. It means that structure doesnot uniquely expla<strong>in</strong> everyth<strong>in</strong>g either, <strong>and</strong> that there are some common corechallenges fac<strong>in</strong>g all <strong>Africa</strong>n cotton sectors.The ultimate objective <strong>of</strong> reform is to strengthen the competitiveness <strong>of</strong> cottonproduction <strong>in</strong> the context <strong>of</strong> the global world market <strong>and</strong> thereby to ensure longterm,susta<strong>in</strong>able, <strong>and</strong> equitable growth for these major sectors <strong>of</strong> many <strong>Africa</strong>neconomies. The broad policy objectives <strong>in</strong>clude farmer welfare, <strong>in</strong>dustry <strong>in</strong>novation,technical <strong>and</strong> economic efficiency, <strong>and</strong> value addition. However, there maybe some trade-<strong>of</strong>fs among these result<strong>in</strong>g from the tension between competition(<strong>in</strong>centives) <strong>and</strong> coord<strong>in</strong>ation (controls) with<strong>in</strong> the different systems. The comparativeanalysis based on the typology showed the strengths <strong>and</strong> weaknesses <strong>of</strong>the various sector types. However, this f<strong>in</strong>d<strong>in</strong>g does not mean that the pros <strong>and</strong>cons <strong>of</strong> each model are all <strong>of</strong> equal nature <strong>and</strong> magnitude thereby tend<strong>in</strong>g to <strong>of</strong>fseteach other. This <strong>in</strong>terpretation one would be a very static <strong>of</strong> the necessarytrade-<strong>of</strong>fs between coord<strong>in</strong>ation <strong>and</strong> competition. To the contrary, the reviewhighlighted important differences <strong>in</strong> long-term viability across sector types:■■At one extreme, most s<strong>in</strong>gle-channel systems have become f<strong>in</strong>anciallyunsusta<strong>in</strong>able, not only because <strong>of</strong> the current exchange rate <strong>of</strong> the CommunautéFrançaise d’Afrique (CFA) franc, but ma<strong>in</strong>ly because <strong>of</strong> their<strong>in</strong>ability to adapt, manage, <strong>and</strong> <strong>in</strong>novate quickly <strong>in</strong> response to chang<strong>in</strong>gcircumstances. At the other extreme, competitive models have serious drawbacks<strong>in</strong> the current SSA context—that is, weak markets for <strong>in</strong>puts <strong>and</strong>f<strong>in</strong>ancial services—which means that they are unsusta<strong>in</strong>able from an environmentalpo<strong>in</strong>t <strong>of</strong> view.Local monopolies <strong>and</strong> concentrated systems may <strong>of</strong>fer better prospects forthe future, but subject to a number <strong>of</strong> critical conditions such as the carefulselection <strong>of</strong> <strong>in</strong>vestors with long-term commitments to the sector’s development,the sett<strong>in</strong>g up <strong>and</strong> enforcement <strong>of</strong> regulatory frameworks adapted tothe sector’s needs, the strengthen<strong>in</strong>g <strong>of</strong> <strong>in</strong>put <strong>and</strong> credit markets, <strong>and</strong> thebuild<strong>in</strong>g up <strong>of</strong> <strong>in</strong>terpr<strong>of</strong>essional organizations to ensure broadly based representation<strong>in</strong> sector management.INSIGHTS ON MAJOR CHALLENGES AND FEASIBLEREFORM PATHS FOR SPECIFIC SECTOR TYPES<strong>Cotton</strong> sectors are fac<strong>in</strong>g broad generic types <strong>of</strong> challenges—value added, competitiveness,susta<strong>in</strong>ability—<strong>and</strong> the need to rearrange pert<strong>in</strong>ent rules <strong>and</strong> <strong>in</strong>centivesto meet these challenges. Reform programs should, therefore, be designed tohelp specific sectors face their own peculiar challenges. In effect, relatively littlesusta<strong>in</strong>ed attention has been paid so far to the precise structure that post-reformsectors could take or why a particular structure might be preferable.xxxiiEXECUTIVE SUMMARY
The report concludes that problems <strong>of</strong> cost <strong>in</strong>efficiency <strong>and</strong> managerial dysfunction<strong>in</strong> national monopolies are serious enough, <strong>and</strong> the politics <strong>of</strong> improv<strong>in</strong>gperformance under such monopolies is complicated enough, that most <strong>of</strong>them need to move toward a different sectoral structure. But this conclusionshould not be applied dogmatically. Cameroon, with relatively good performanceto date, may be able to ma<strong>in</strong>ta<strong>in</strong> its national monopoly to good effect, as long asit reforms its price-sett<strong>in</strong>g process <strong>and</strong> cont<strong>in</strong>ues to promote productivity.If national monopolies do choose to change, the direction <strong>of</strong> change is likelyto be toward local monopolies or concentrated, market-based systems. Thereport concludes that mov<strong>in</strong>g <strong>in</strong> WCA to fully privatized markets allow<strong>in</strong>g competitionamong companies, even if the market is <strong>in</strong>itially very concentrated, isrisky because <strong>of</strong> the possible <strong>in</strong>stability <strong>of</strong> concentrated sectors. If, <strong>in</strong>stead, thesesectors can use the local monopoly approach to develop sound regulatorymechanisms <strong>and</strong> build the operational capacity <strong>of</strong> farmer organizations, concentrated<strong>and</strong> eventually competitive systems could perform well. Dur<strong>in</strong>g thelocal monopoly phase, care must be taken to ensure that private companies playa greater role <strong>in</strong> price sett<strong>in</strong>g <strong>and</strong> other decision mak<strong>in</strong>g than they have so farplayed <strong>in</strong> Burk<strong>in</strong>a Faso; price sett<strong>in</strong>g must also be done <strong>in</strong> a way that providesreasonable assurance to companies that, if they operate efficiently accord<strong>in</strong>g to<strong>in</strong>ternational st<strong>and</strong>ards, they will be able to earn a reasonable return on their<strong>in</strong>vestment. Clear rules for evaluat<strong>in</strong>g <strong>and</strong> retender<strong>in</strong>g concession areas are alsoneeded, as this approach has been a clear failure <strong>in</strong> Mozambique.The key challenge <strong>in</strong> Mozambique’s local monopoly sector is how to create<strong>in</strong>centives for good company performance. In the absence <strong>of</strong> strong farmerassociations, these <strong>in</strong>centives have to come from improved rules govern<strong>in</strong>g tender<strong>in</strong>g<strong>and</strong> retender<strong>in</strong>g <strong>of</strong> concessions, procedures for monitor<strong>in</strong>g performance<strong>of</strong> concessionaires, <strong>and</strong> careful selection <strong>of</strong> companies.The key challenge for concentrated sectors is to develop a regulatoryapproach with three characteristics:■■■Clear <strong>and</strong> transparent licens<strong>in</strong>g rules must be developed to strictly specifythe capabilities <strong>and</strong> conduct <strong>of</strong> firms wish<strong>in</strong>g to participate <strong>in</strong> the sector,<strong>and</strong> to defend the ability <strong>of</strong> firms to coord<strong>in</strong>ate on <strong>in</strong>put supply, extension,<strong>and</strong> quality control.These rules must be strictly enforced, but they must allow enough prospect<strong>of</strong> entry that <strong>in</strong>cumbents have an <strong>in</strong>centive to ma<strong>in</strong>ta<strong>in</strong> attractive seed cottonprices.Given the problems <strong>of</strong> rely<strong>in</strong>g entirely on the threat <strong>of</strong> entry to discipl<strong>in</strong>e<strong>in</strong>cumbent firms, it may also be desirable to develop price-sett<strong>in</strong>g mechanismsthat are more formalized than the price leadership that has prevailed<strong>in</strong> concentrated systems so far.Competitive sectors perform poorly on coord<strong>in</strong>ation for service provision.The book concludes that such coord<strong>in</strong>ation as does occur must come from aEXECUTIVE SUMMARYxxxiii
central body <strong>and</strong> that the state needs to play a key role with<strong>in</strong> this body. Thisrole is <strong>in</strong> contrast to local monopoly or concentrated systems, where <strong>in</strong>terpr<strong>of</strong>essionalcommittees dom<strong>in</strong>ated by g<strong>in</strong>ners <strong>and</strong> farmers have more potential toadequately manage the sector. Given the well-known problems <strong>of</strong> such state<strong>in</strong>volvement, the accountability <strong>of</strong> regulatory bodies toward g<strong>in</strong>ners <strong>and</strong> farmers<strong>in</strong> competitive systems needs to be strengthened. Because <strong>in</strong>centives are verylimited with<strong>in</strong> competitive sectors for <strong>in</strong>dividual g<strong>in</strong>ners to support long-termprograms for productivity growth, the state <strong>and</strong> the g<strong>in</strong>ners’ association mayhave to work with other actors (local government or donors, for <strong>in</strong>stance) todevelop programs that enhance the asset base <strong>of</strong> farmers <strong>and</strong> also generate benefitsbeyond the cotton sector. The review suggests that if competitive sectors (as<strong>in</strong> Ug<strong>and</strong>a) move to hybrid structures, such approaches need to avoid protect<strong>in</strong>gg<strong>in</strong>ners entirely from competitive pressure; this conclusion is based onUg<strong>and</strong>a’s experience, where entrenched overcapacity elim<strong>in</strong>ates cost advantagesthe sector would otherwise have. Tanzania’s agro-ecological <strong>and</strong> population settlementcharacteristics have so far protected it from the need to take the type <strong>of</strong>radical measures that Ug<strong>and</strong>a has experimented with for <strong>in</strong>put credit provision.However, if yields beg<strong>in</strong> to fall as a result <strong>of</strong> decl<strong>in</strong><strong>in</strong>g soil fertility (or possiblyone day to <strong>in</strong>creas<strong>in</strong>g pest pressure), <strong>and</strong> if the country wants to realize itspotential more fully, it may need to consider mov<strong>in</strong>g to a more coord<strong>in</strong>atedapproach.F<strong>in</strong>ally, when referr<strong>in</strong>g to the challenges faced by the various sector types, itis important to recognize that governments, private companies, farmers, <strong>and</strong>service providers may experience these challenges <strong>in</strong> very different ways. One<strong>of</strong> the next steps <strong>in</strong> the reform processes is therefore to ga<strong>in</strong> consensus on whatthese particular challenges are for specific actors <strong>and</strong> what further <strong>in</strong>vestmentis needed to address them.xxxivEXECUTIVE SUMMARY
SECTION ONEIntroduction <strong>and</strong> MarketContext
CHAPTER ONEIntroductionDavid Tschirley<strong>Cotton</strong> <strong>in</strong> Sub-Saharan <strong>Africa</strong> (SSA) is at once a major success story<strong>and</strong>, <strong>in</strong> much <strong>of</strong> the cont<strong>in</strong>ent, a focus <strong>of</strong> <strong>in</strong>tense concern. While thecont<strong>in</strong>ent’s share <strong>of</strong> world agricultural trade fell by about half from1980 to 2005, its share <strong>of</strong> cotton trade more than doubled. 1 Production grewthree times more rapidly <strong>in</strong> SSA over the period than it did <strong>in</strong> the rest <strong>of</strong> theworld. <strong>Cotton</strong> is predom<strong>in</strong>antly a smallholder crop, with more than 2 millionpoor rural households <strong>in</strong> SSA depend<strong>in</strong>g on it as their ma<strong>in</strong> source <strong>of</strong> cash<strong>in</strong>come. Among export crops with substantial smallholder farmer <strong>in</strong>volvement<strong>in</strong> SSA, cotton ranks second <strong>in</strong> value only to cocoa, <strong>and</strong> cotton’s production isspread more widely across the cont<strong>in</strong>ent. The pr<strong>of</strong>itability <strong>of</strong> cotton production<strong>and</strong> process<strong>in</strong>g <strong>in</strong> <strong>Africa</strong> has large <strong>and</strong> widespread impacts on ruralgrowth <strong>and</strong> poverty <strong>in</strong> the cont<strong>in</strong>ent, <strong>and</strong> as a result, the challenges faced bythe sector are serious.Unusual for <strong>Africa</strong>n export crops, cotton is also produced <strong>in</strong> several countries<strong>of</strong> the developed world <strong>and</strong> <strong>in</strong> Ch<strong>in</strong>a. Large subsidies to cotton farmers <strong>in</strong>many <strong>of</strong> these countries, comb<strong>in</strong>ed with the obvious role that cotton plays <strong>in</strong>the livelihoods <strong>of</strong> millions <strong>of</strong> poor <strong>Africa</strong>n farmers, has helped make the cropa major issue <strong>in</strong> world trade negotiations. The Overseas Development Institute(ODI 2004) shows that subsidies to cotton farmers <strong>in</strong> the United States dur<strong>in</strong>g2001/02 were equivalent to about 50 percent <strong>of</strong> the world price; <strong>in</strong> Ch<strong>in</strong>a <strong>and</strong>the European Union, these figures were about 25 percent <strong>and</strong> 100 percent,respectively. The total value <strong>of</strong> subsidies is highest <strong>in</strong> the United States, whereabout 25,000 cotton farmers received an average <strong>of</strong> about US$2 billion per year3
etween 2001 <strong>and</strong> 2003, equal to about 60 percent <strong>of</strong> the national gross domesticproduct (GDP) <strong>of</strong> both Burk<strong>in</strong>a Faso <strong>and</strong> Mali.Formal compla<strong>in</strong>ts under the World Trade <strong>Organization</strong> (WTO) aboutthese subsidies began <strong>in</strong> 2003 with Brazil, which challenged U.S. subsidies <strong>and</strong>won its case <strong>in</strong> 2004. Also <strong>in</strong> 2003, Burk<strong>in</strong>a Faso presented the WTO with a cottonproposal on behalf <strong>of</strong> itself, Ben<strong>in</strong>, Chad, <strong>and</strong> Mali call<strong>in</strong>g for the eventualelim<strong>in</strong>ation <strong>of</strong> all developed-country cotton subsidies, coupled with f<strong>in</strong>ancialcompensation for cotton farmers <strong>in</strong> develop<strong>in</strong>g countries. With<strong>in</strong> <strong>Africa</strong>, publicdebate about subsidies has focused almost entirely on these four West <strong>Africa</strong>ncountries, know as the “C4” (<strong>Cotton</strong>-4).Predat<strong>in</strong>g this trade <strong>and</strong> subsidies debate has been another debate, now last<strong>in</strong>gmore than two decades, on whether the highly <strong>in</strong>tegrated approach to cottonsupply cha<strong>in</strong> development <strong>in</strong> countries <strong>of</strong> West <strong>and</strong> Central <strong>Africa</strong> (WCA)needed to be reformed. The WCA approach, which typically featured “s<strong>in</strong>glechannel”systems built around public monopoly cotton companies, has driventremendous growth <strong>in</strong> cotton production <strong>in</strong> the region; the International <strong>Cotton</strong>Advisory Council (ICAC) data <strong>in</strong>dicate that total l<strong>in</strong>t production <strong>in</strong> theCommunauté française d’Afrique (CFA) Franc Zone rose from 50,000 tons <strong>in</strong>1960 to about 220,000 tons <strong>in</strong> 1980, to an average <strong>of</strong> about 1.1 million tons <strong>in</strong>2004 <strong>and</strong> 2005. The crop has also played a major role <strong>in</strong> rural development,facilitat<strong>in</strong>g <strong>in</strong>put supply for other crops <strong>in</strong> cotton zones <strong>and</strong> help<strong>in</strong>g farmers <strong>in</strong>vest<strong>in</strong> animal traction <strong>and</strong> other equipment that improved overall farm productivity<strong>and</strong> <strong>in</strong>comes.However, these s<strong>in</strong>gle-channel systems have also suffered from serious<strong>and</strong> perhaps grow<strong>in</strong>g problems. Dur<strong>in</strong>g the years immediately follow<strong>in</strong>g thedevaluation <strong>of</strong> the CFA franc <strong>in</strong> 1994 (Pursell 1999; Badiane et al. 2002),cotton sectors <strong>in</strong> WCA were seen to pay lower prices to farmers than sectorswith more competitive arrangements. Many studies commented on the stagnation<strong>of</strong> WCA farm yields start<strong>in</strong>g about 1990, although these yieldsrema<strong>in</strong>ed higher than <strong>in</strong> most other areas <strong>of</strong> <strong>Africa</strong>. The parastatal g<strong>in</strong>n<strong>in</strong>gcompanies were also seen to be <strong>in</strong>creas<strong>in</strong>gly <strong>in</strong>efficient <strong>and</strong> opaque <strong>in</strong> theiroperations (Pursell 1999; Badiane et al. 2002; World Bank 2007). In Mali,farmers boycotted the crop <strong>in</strong> 2000/01 because <strong>of</strong> low prices <strong>and</strong> perceivedcorruption with<strong>in</strong> Compagnie Malienne de Développement des Fibres Textiles(CMDT), <strong>and</strong> top managers <strong>in</strong> CMDT were eventually sent to jail forf<strong>in</strong>ancial mismanagement.In a world market where real prices have fallen by about half s<strong>in</strong>ce 1980, 2the problems described above can threaten the survival <strong>of</strong> cotton production,process<strong>in</strong>g, <strong>and</strong> trade. These concerns have come acutely to the fore s<strong>in</strong>ce thebeg<strong>in</strong>n<strong>in</strong>g <strong>of</strong> the 2000s, as high prices to farmers, comb<strong>in</strong>ed with high operat<strong>in</strong>gcosts <strong>of</strong> the g<strong>in</strong>n<strong>in</strong>g companies <strong>and</strong> stagnant farm yields, have led to massivesectoral deficits <strong>in</strong> most countries. In Burk<strong>in</strong>a Faso <strong>and</strong> perhaps other countries,these deficits threaten nationwide macroeconomic stability. Meanwhile,farmers cont<strong>in</strong>ue to compla<strong>in</strong> that the prices they receive are too low.4 DAVID TSCHIRLEY
The debate about how to deal with these problems is rooted <strong>in</strong> several factorsat the <strong>in</strong>tersection <strong>of</strong> characteristics <strong>of</strong> cotton as a crop <strong>and</strong> the rural sett<strong>in</strong>g<strong>in</strong> much <strong>of</strong> SSA. First is the widely appreciated fact that cotton productionrequires substantial use <strong>of</strong> external <strong>in</strong>puts, specifically treated seed, fertilizers,<strong>and</strong> <strong>in</strong>secticides. 3 A second factor is that markets <strong>in</strong> SSA for <strong>in</strong>puts, especiallycredit for <strong>in</strong>puts, frequently fail for smallholder farmers. Although seed <strong>and</strong>fertilizer for a crop like maize may be relatively available <strong>in</strong> markets <strong>and</strong> frequentlypurchased by smallholder farmers, specialized <strong>in</strong>secticides <strong>and</strong> seed treatmentsfor cotton are less likely to be available, <strong>and</strong> credit is almost never accessibleby unorganized smallholders. Additionally, because cotton is produced <strong>in</strong> ahighly competitive export market, efficiency is paramount throughout thecha<strong>in</strong>. At the farm level, farmers must use the right <strong>in</strong>puts <strong>in</strong> the right way ifthey are to earn reasonable returns from the crop, <strong>and</strong> if they are to produceenough product to susta<strong>in</strong> the g<strong>in</strong>n<strong>in</strong>g companies. Control over the <strong>in</strong>put mix<strong>and</strong> extension assistance to ensure proper use are issues <strong>in</strong> which g<strong>in</strong>ners havevested <strong>in</strong>terests. Bundl<strong>in</strong>g <strong>in</strong>puts <strong>and</strong> extension <strong>in</strong>to a package creates efficienciesfor the distributor <strong>and</strong> as a result, most approaches to the <strong>in</strong>put creditproblem have featured <strong>in</strong>terlocked transactions. A g<strong>in</strong>n<strong>in</strong>g firm wish<strong>in</strong>g topurchase the farm output provides some level <strong>of</strong> extension advice along with<strong>in</strong>puts to farmers on credit, <strong>and</strong> attempts to recover the credit upon purchase<strong>of</strong> the farm’s product.Such arrangements, known as contract farm<strong>in</strong>g or outgrower schemes, havegoverned production <strong>of</strong> a wide range <strong>of</strong> cash crops throughout the develop<strong>in</strong>gworld for many decades. 4 When effective, these arrangements allow smallholderfarmers to pr<strong>of</strong>it from a crop they might ord<strong>in</strong>arily not be able to plant<strong>and</strong> allow processors to benefit from low costs <strong>of</strong> production. 5 Yet the conditionsunder which <strong>in</strong>terlocked transactions can be expected to emerge <strong>and</strong> persistare relatively restrictive (Delgado 1999; Benfica, Tschirley, <strong>and</strong> Sambo2002). 6 Numerous examples exist <strong>of</strong> failed efforts, primarily related to the<strong>in</strong>ability <strong>of</strong> processors to recover <strong>in</strong>put credit (Str<strong>in</strong>gfellow 1996; Glover 1990).Though the structure <strong>of</strong> the cotton market lends itself to contract farm<strong>in</strong>goperations, it too has frequently been threatened by acute credit default crises<strong>in</strong> many countries. Additionally, over the longer term, cotton systems can beunderm<strong>in</strong>ed by the <strong>in</strong>ability <strong>of</strong> participants <strong>in</strong> the supply cha<strong>in</strong> to agree on <strong>and</strong>develop f<strong>in</strong>anc<strong>in</strong>g mechanisms for <strong>in</strong>vestments <strong>in</strong> research, extension, riskmanagement, <strong>and</strong> quality control.The performance <strong>of</strong> cotton <strong>in</strong>put credit <strong>and</strong> extension systems <strong>in</strong> SSA isstrongly <strong>in</strong>fluenced by the structure <strong>and</strong> behavior <strong>of</strong> the market for seed cotton.Because changes <strong>in</strong> the structure <strong>of</strong> the output market are central to anysectoral reform, they have the potential to dramatically affect <strong>in</strong>put-creditextensionsystems. It should not be surpris<strong>in</strong>g, therefore, that proposedreforms have engendered great concern about possible unanticipated negativeeffects on these systems. As early as 1988, a major comparative review <strong>of</strong> cottonsector performance <strong>in</strong> Anglophone <strong>and</strong> Francophone countries <strong>of</strong> SSAINTRODUCTION 5
concluded that, <strong>in</strong> West <strong>Africa</strong>’s s<strong>in</strong>gle-channel systems (which to that time hadbeen far more successful than systems <strong>in</strong> Anglophone countries), “privatization<strong>of</strong> <strong>in</strong>put distribution . . . should be considered only with the greatest caution,due to the need to l<strong>in</strong>k distribution with credit <strong>and</strong> output market<strong>in</strong>g” (Lele,Van de Walle, <strong>and</strong> Gbetiobouo 1989: 31). This review further cautioned aboutthe potential “collapse <strong>of</strong> the cotton <strong>in</strong>dustry <strong>in</strong> francophone <strong>Africa</strong>” if research<strong>and</strong> extension were moved out <strong>of</strong> exist<strong>in</strong>g s<strong>in</strong>gle-channel systems withoutviable alternative <strong>in</strong>stitutional approaches to ensur<strong>in</strong>g the cont<strong>in</strong>uity <strong>of</strong> theseactivities. With<strong>in</strong> Francophone <strong>Africa</strong>n countries, one important basis foropposition to reform has been fears that <strong>in</strong>put credit <strong>and</strong> extension would beunderm<strong>in</strong>ed.In both the subsidies debate <strong>and</strong> the debate on structural reform <strong>of</strong> cottonsectors, little attention has been paid to countries <strong>of</strong> East <strong>and</strong> Southern <strong>Africa</strong>(ESA). Yet production <strong>in</strong> ESA has been grow<strong>in</strong>g steadily, <strong>and</strong> reached nearlyhalf a million tons <strong>of</strong> l<strong>in</strong>t <strong>in</strong> 2004/05. Serious structural reform <strong>of</strong> cotton sectors<strong>in</strong> ESA, <strong>in</strong>clud<strong>in</strong>g the elim<strong>in</strong>ation <strong>of</strong> exist<strong>in</strong>g s<strong>in</strong>gle-channel systems,began <strong>in</strong> the early 1990s <strong>and</strong> much has been learned about the process. Reform<strong>in</strong> countries <strong>of</strong> WCA has been slower for a number <strong>of</strong> reasons: the s<strong>in</strong>gle-channelsystems were very strongly established <strong>in</strong> many WCA countries; stakeholderscould po<strong>in</strong>t to substantial successes <strong>in</strong> addition to clear <strong>and</strong> mount<strong>in</strong>g problems;<strong>and</strong> the sheer number <strong>of</strong> farmers <strong>in</strong>volved—<strong>and</strong> the size <strong>of</strong> the publiccompanies serv<strong>in</strong>g them—made reform difficult from political, social, <strong>and</strong>commercial perspectives. The developed-world subsidies referred to earlieralso fueled <strong>in</strong>ternal resistance to reform. Yet nearly all countries <strong>in</strong> WCA havemade substantial <strong>in</strong>cremental changes <strong>in</strong> their systems, <strong>and</strong> some have undertaken(or will soon undertake) structural reforms. To date, few attempts havebeen made systematically to br<strong>in</strong>g together <strong>and</strong> assess reform experience fromboth regions <strong>of</strong> the cont<strong>in</strong>ent. This analytical gap, <strong>and</strong> the potential benefitsfrom such an exercise, provides the fundamental rationale for this study. 7This comparative analysis is based on detailed case studies <strong>in</strong> n<strong>in</strong>e countries<strong>of</strong> ESA <strong>and</strong> WCA: Ben<strong>in</strong>, Burk<strong>in</strong>a Faso, Cameroon, <strong>and</strong> Mali <strong>in</strong> WCA; <strong>and</strong>Mozambique, Tanzania, Ug<strong>and</strong>a, Zambia, <strong>and</strong> Zimbabwe <strong>in</strong> ESA (figure 1.1).Dur<strong>in</strong>g the period 2004–08, these countries produced an average <strong>of</strong> 0.98 milliontons <strong>and</strong> accounted for 70 percent <strong>of</strong> SSA’s cotton production (1.35 milliontons dur<strong>in</strong>g that period). In 2005/06, the n<strong>in</strong>e countries <strong>in</strong> the sample togetherproduced more than 1 million tons <strong>of</strong> cotton l<strong>in</strong>t, the majority <strong>of</strong> which wasexported. This figure represents 60 percent <strong>of</strong> total <strong>Africa</strong>n production <strong>and</strong> 68percent <strong>of</strong> SSA production. The four WCA countries accounted for 70 percent<strong>of</strong> total production <strong>of</strong> countries <strong>in</strong> our sample <strong>in</strong> 2005/06. 8 Figure 1.2 showsaverage cotton production for major <strong>Africa</strong>n cotton producers dur<strong>in</strong>g 2004–08(<strong>in</strong>clud<strong>in</strong>g the n<strong>in</strong>e countries analyzed <strong>in</strong> this study).Each case study <strong>in</strong>volved a literature review plus a two-week visit to thecountry 9 by researchers who already had several years <strong>of</strong> experience <strong>in</strong> the sector.In addition to compil<strong>in</strong>g st<strong>and</strong>ard <strong>in</strong>formation on the historical background,6 DAVID TSCHIRLEY
Figure 1.1 Map <strong>of</strong> <strong>Africa</strong> Highlight<strong>in</strong>g Study Countries <strong>of</strong> WCA <strong>and</strong> ESATunisiaMoroccoAlgeriaLibyaArab Rep.<strong>of</strong> EgyptSenegalThe GambiaGu<strong>in</strong>ea-BissauSierraLeoneLiberiaMauritaniaGu<strong>in</strong>eaMaliBurk<strong>in</strong>aFasoCôte d’Ivoire GhanaNigerNigeriaBen<strong>in</strong>TogoEquatorialGu<strong>in</strong>eaCameroonGabonChadRep. <strong>of</strong> CongoCentral <strong>Africa</strong>nRepublicDem. Rep. <strong>of</strong>CongoSudanEritreaEthiopiaKenyaTanzaniaUg<strong>and</strong>aSomaliaRw<strong>and</strong>aBurundiMalawiAngolaNamibiaBotswanaZambiaZimbabweMozambiqueMadagascarS. <strong>Africa</strong>LesothoSwazil<strong>and</strong>Source: Authors.recent changes, <strong>and</strong> current organization <strong>of</strong> the sector <strong>in</strong> each country, the casestudies shared three key characteristics that heavily <strong>in</strong>fluenced the content <strong>of</strong>this comparative report. First, each provided a detailed overview <strong>of</strong> the <strong>in</strong>stitutionalarrangements <strong>in</strong> place for key sector services, such as <strong>in</strong>put credit,research, <strong>and</strong> extension; l<strong>in</strong>t market<strong>in</strong>g <strong>and</strong> quality ma<strong>in</strong>tenance; <strong>and</strong> seed cottonpric<strong>in</strong>g. Especially <strong>in</strong> ESA, the diversity <strong>of</strong> approaches to these challengesprovides great scope for learn<strong>in</strong>g. Second, each study developed disaggregatedbudgets for representative g<strong>in</strong>ners, allow<strong>in</strong>g this analysis to conduct a detailedcomparison <strong>of</strong> the level <strong>and</strong> structure <strong>of</strong> g<strong>in</strong>n<strong>in</strong>g costs <strong>in</strong> each country. Third,each study—except Ben<strong>in</strong> <strong>and</strong> Cameroon—used a comparable focus groupapproach to develop detailed farm-level budgets for a range <strong>of</strong> cotton farmertypes. Focus<strong>in</strong>g on the diversity <strong>of</strong> farm types, behavior, <strong>and</strong> performance atthe farm level provides important <strong>in</strong>sights <strong>in</strong>to cotton’s contribution toINTRODUCTION 7
Figure 1.2 Major SSA <strong>Cotton</strong> Producers (thous<strong>and</strong>s <strong>of</strong> tons <strong>of</strong> l<strong>in</strong>t, 2004–08average)Burk<strong>in</strong>a FasoMaliBen<strong>in</strong>ZimbabweTanzaniaCôte d’IvoireCameroonNigeriaChadZambiaTogoMozambiqueMalawiUg<strong>and</strong>aEthiopiaSenegalothers0 50 100 150 200 250 300annual l<strong>in</strong>t production (thous<strong>and</strong> tons)Source: ICAC.Note: The list <strong>in</strong>cludes countries produc<strong>in</strong>g more than 20,000 tons <strong>of</strong> l<strong>in</strong>t. Dark color denotescountries covered <strong>in</strong> this study.poverty reduction, <strong>in</strong>to the differential effects <strong>of</strong> pric<strong>in</strong>g policies, <strong>and</strong> <strong>in</strong>to thenature <strong>and</strong> scope <strong>of</strong> the productivity challenges the sector faces.The term “reform” is widely used but seldom def<strong>in</strong>ed <strong>in</strong> development literature.This book underst<strong>and</strong>s reform to be consciously chosen change <strong>in</strong> thefundamental organization <strong>of</strong> a sector <strong>and</strong> related changes <strong>in</strong> the “rules <strong>of</strong> thegame” under which stakeholders operate. Under this def<strong>in</strong>ition, every country<strong>in</strong> ESA reformed its cotton sector <strong>in</strong> the early to mid-1990s, either elim<strong>in</strong>at<strong>in</strong>gs<strong>in</strong>gle-channel parastatals (Zambia <strong>and</strong> Zimbabwe) or privatiz<strong>in</strong>g cooperativeg<strong>in</strong>ners (Ug<strong>and</strong>a <strong>and</strong> Tanzania). 10 In the sample WCA countries, only Ben<strong>in</strong><strong>and</strong>, to a lesser degree, Burk<strong>in</strong>a Faso have reformed their cotton sectors underthis def<strong>in</strong>ition. 11Yet a key theme that emerges from this research is that reform is not simplya movement from one stable set <strong>of</strong> rules <strong>of</strong> the game to another stable set. Thereforms <strong>of</strong> the 1990s <strong>in</strong> ESA have been followed by cont<strong>in</strong>uous <strong>and</strong> sometimesdramatic change <strong>in</strong> every country. Even countries <strong>in</strong> WCA that have notreformed under this def<strong>in</strong>ition have effected substantial <strong>in</strong>cremental change <strong>in</strong>the ways <strong>in</strong> which they carry out critical sector activities. An important contribution<strong>of</strong> this research is show<strong>in</strong>g how the details <strong>of</strong> <strong>in</strong>stitutional design matter,provid<strong>in</strong>g a rich sense <strong>of</strong> the diversity <strong>of</strong> approaches that have emerged to dealwith common challenges, <strong>and</strong> provid<strong>in</strong>g <strong>in</strong>sight <strong>in</strong>to the factors that <strong>in</strong>fluencewhich approach might be chosen under different circumstances.The report is organized <strong>in</strong> five sections. The next chapter <strong>in</strong> section I presentskey elements <strong>of</strong> the current world market sett<strong>in</strong>g. Section II provides historicalbackground, outl<strong>in</strong>es the typology <strong>of</strong> cotton sectors used to form8 DAVID TSCHIRLEY
hypotheses about sector performance, <strong>and</strong> presents a conceptual frameworkfor analyz<strong>in</strong>g sector organization <strong>and</strong> l<strong>in</strong>k<strong>in</strong>g it to outcomes.Sections III <strong>and</strong> IV provide a detailed comparative description <strong>and</strong> performanceassessment <strong>of</strong> n<strong>in</strong>e systems around a set <strong>of</strong> key themes. Section IIIfocuses on processes, functions, <strong>and</strong> services that are most directly under thecontrol <strong>of</strong> cotton companies:■■■■■pric<strong>in</strong>g systems <strong>and</strong> prices paid to farmers,<strong>in</strong>stitutional arrangements for <strong>in</strong>put credit <strong>and</strong> extension,quality control <strong>and</strong> l<strong>in</strong>t market<strong>in</strong>g strategies,valorization <strong>of</strong> cotton seed by-products, <strong>and</strong><strong>in</strong>stitutional arrangements for research.Section IV assesses overall performance <strong>of</strong> the different sectors <strong>of</strong> the studysample on the basis <strong>of</strong> outcome <strong>in</strong>dicators that have a bear<strong>in</strong>g on the sector’s contributionto national growth <strong>and</strong> poverty reduction objectives. These <strong>in</strong>dicators<strong>in</strong>clude yield performance <strong>and</strong> returns to farmers, competitiveness at g<strong>in</strong>n<strong>in</strong>glevel, value addition, <strong>and</strong> macro-level impacts.Section V closes by summariz<strong>in</strong>g performance across countries <strong>and</strong> sectortypes <strong>and</strong> suggest<strong>in</strong>g key issues to be taken <strong>in</strong>to account <strong>in</strong> policy discussionsregard<strong>in</strong>g cont<strong>in</strong>ued efforts to strengthen cotton sectors <strong>in</strong> the cont<strong>in</strong>ent.INTRODUCTION 9
CHAPTER TWOMarket ContextJohn Baffes <strong>and</strong> Gérald Estur<strong>Africa</strong>n cotton producers are becom<strong>in</strong>g more <strong>and</strong> more aware that theyoperate <strong>in</strong> an <strong>in</strong>creas<strong>in</strong>gly <strong>in</strong>tegrated <strong>and</strong> quickly chang<strong>in</strong>g globalmarket. Any analysis <strong>of</strong> the evolution <strong>and</strong> performance <strong>of</strong> cotton sectors<strong>in</strong> Sub-Saharan <strong>Africa</strong> (SSA) must, therefore, be put <strong>in</strong> this context <strong>and</strong>must take <strong>in</strong>to account the market dynamics <strong>and</strong> their implications for theentire supply cha<strong>in</strong>, back to farm level.This chapter aims to set the stage by provid<strong>in</strong>g a strategic overview <strong>of</strong> thema<strong>in</strong> characteristics <strong>of</strong> this market. First, the key trends <strong>in</strong> global supply <strong>and</strong>dem<strong>and</strong> are presented <strong>and</strong> discussed. A short analysis follows <strong>of</strong> price trends<strong>and</strong> price determ<strong>in</strong>ants, particularly with regard to external factors affect<strong>in</strong>g<strong>in</strong>ternational prices <strong>of</strong> cotton l<strong>in</strong>t <strong>and</strong> its by-products, <strong>in</strong>clud<strong>in</strong>g exchangerate fluctuations <strong>and</strong> market distortions created by subsidies <strong>in</strong> some majorexport<strong>in</strong>g countries. Specific attention is given to critical factors <strong>in</strong>fluenc<strong>in</strong>gthe dem<strong>and</strong> for cotton l<strong>in</strong>t, such as quality <strong>and</strong> market<strong>in</strong>g strategies. The chaptercloses with an overview <strong>of</strong> the market for cottonseed by-products, an<strong>in</strong>creas<strong>in</strong>gly important element <strong>of</strong> valorization <strong>of</strong> raw cotton for farmers <strong>and</strong>for the national economies.THE SUPPLY SIDE: EXPANDING PRODUCTIONAND EXPORTSAbout three-quarters <strong>of</strong> cotton is produced by develop<strong>in</strong>g countries. S<strong>in</strong>ce1960, world cotton production has grown at an annual rate <strong>of</strong> almost 2 percent11
to reach 25 million tons <strong>of</strong> l<strong>in</strong>t <strong>in</strong> 2006, up from 10.2 million tons <strong>in</strong> 1960.Most <strong>of</strong> this growth came from Ch<strong>in</strong>a <strong>and</strong> India, whose production quadrupleddur<strong>in</strong>g that period. Today, these two countries account for almost 45 percent<strong>of</strong> world cotton production <strong>and</strong> more than half <strong>of</strong> global consumption.Other countries that significantly <strong>in</strong>creased their production shares dur<strong>in</strong>g thisperiod were Brazil, Greece, Pakistan, <strong>and</strong> Turkey (see table 2.1). Some newentrants also contributed to this growth. Australia, for example, which producedonly 2,000 tons <strong>of</strong> cotton <strong>in</strong> 1960, averaged 0.5 million tons between1995 <strong>and</strong> 2005. Francophone <strong>Africa</strong> produced less than 100,000 tons <strong>in</strong> the1960s <strong>and</strong> now produces 10 times that much. The United States <strong>and</strong> the CentralAsian republics, two <strong>of</strong> the four dom<strong>in</strong>ant cotton producers dur<strong>in</strong>g the1960s, have ma<strong>in</strong>ta<strong>in</strong>ed their production at about the same levels, effectivelyhalv<strong>in</strong>g their global output shares. A number <strong>of</strong> Central American countries thattogether accounted for 250,000 tons dur<strong>in</strong>g the 1970s now produce virtually nocotton at all.About one-third <strong>of</strong> cotton production is traded <strong>in</strong>ternationally. The threedom<strong>in</strong>ant exporters—the United States, Central Asia, <strong>and</strong> Francophone<strong>Africa</strong>—account for more than two-thirds <strong>of</strong> global exports. Overall, Sub-Saharan <strong>Africa</strong> (SSA) <strong>in</strong>creased its share <strong>in</strong> world cotton trade from 7 percent<strong>in</strong> 1960 to 15 percent <strong>in</strong> 2006. However, the export performances <strong>of</strong> West <strong>and</strong>Central <strong>Africa</strong> (WCA) <strong>and</strong> East <strong>and</strong> Southern <strong>Africa</strong> (ESA) differ considerably.In 1960, WCA accounted for a little more than 1 percent <strong>of</strong> global exportswhile today it accounts for more than 11 percent. Exports from ESA, however,have decl<strong>in</strong>ed from 6 percent <strong>in</strong> 1960 to 4 percent today.World prices for cotton have been decl<strong>in</strong><strong>in</strong>g mostly as a result <strong>of</strong> competitionon the supply side, which has driven down production costs; such reductionshave been associated primarily with technological improvements result<strong>in</strong>g <strong>in</strong>yield <strong>in</strong>creases from 300 kilograms <strong>of</strong> l<strong>in</strong>t per hectare <strong>in</strong> the early 1960s to about700 kilograms <strong>of</strong> l<strong>in</strong>t per hectare <strong>in</strong> 2005 (world average). This yield <strong>in</strong>creasereflects the <strong>in</strong>troduction <strong>of</strong> improved varieties <strong>and</strong> <strong>in</strong>creased use <strong>of</strong> irrigation<strong>and</strong> chemical fertilizers. The spread <strong>of</strong> genetically modified (GM) seed technology<strong>in</strong> develop<strong>in</strong>g countries <strong>and</strong> precision farm<strong>in</strong>g <strong>in</strong> developed countries isexpected to reduce the costs <strong>of</strong> production even further.More than one-quarter <strong>of</strong> the area allocated to cotton is currently plantedus<strong>in</strong>g GM varieties, account<strong>in</strong>g for almost 40 percent <strong>of</strong> world production. GMcotton <strong>in</strong> the United States—where it was first <strong>in</strong>troduced <strong>in</strong> 1996—currentlyaccounts for about 80 percent <strong>of</strong> the U.S. area allocated to cotton. Other majorGM cotton producers are Argent<strong>in</strong>a (70 percent <strong>of</strong> its cotton area), Australia(80 percent), Ch<strong>in</strong>a (60 percent), Colombia (35 percent), India (10 percent),Mexico (40 percent), <strong>and</strong> South <strong>Africa</strong> (90 percent). 12 Countries at a trial stage<strong>in</strong>clude Brazil, Burk<strong>in</strong>a Faso (the only SSA country), Israel, Pakistan, <strong>and</strong>Turkey (<strong>Cotton</strong> Outlook 2005).Although the past decade has witnessed the expansion <strong>of</strong> the organic movement<strong>in</strong> other commodities, cotton has not enjoyed much success. Organic12 BAFFES AND ESTUR
Table 2.1 Global Balance <strong>of</strong> the <strong>Cotton</strong> Market (thous<strong>and</strong> metric tons)Country or Region 1960 1970 1980 1990 2000 2005 2006 2007ProductionCh<strong>in</strong>a 1,372 1,995 2,707 4,508 4,417 5,714 6,729 8,078India 1,012 909 1,322 1,989 2,380 4,148 4,590 5,355United States 3,147 2,219 2,422 3,376 3,818 5,201 4,731 4,182Pakistan 306 543 714 1,638 1,816 2,089 2,115 1,845Central Asia 1,491 2,342 2,661 2,593 1,412 1,828 1,719 1,788Brazil 425 549 623 717 939 1,038 1,381 1,556Turkey 192 400 500 655 880 800 850 675Francophone <strong>Africa</strong> 63 140 224 562 728 937 888 571Greece 63 110 115 213 421 430 300 300Australia 2 19 99 433 804 589 253 116World 10,201 11,740 13,831 18,970 19,437 24,775 25,312 26,213ExportsUnited States 1,444 848 1,290 1,697 1,472 3,821 3,048 3,092Central Asia 381 553 876 1,835 1,203 1,454 1,467 1,324India 53 34 140 255 24 800 1,050 1,300Francophone <strong>Africa</strong> 48 137 185 498 767 1,013 928 609Brazil 152 220 21 167 68 429 300 500Australia 0 4 53 329 849 628 483 270Greece 33 0 13 86 244 355 243 223Egypt, Arab Rep. <strong>of</strong> 346 304 162 18 79 100 100 125Syrian Arab Rep. 97 134 71 91 212 191 100 65World 3,667 3,875 4,414 5,081 5,857 9,801 8,270 8,247Source: ICAC various issues.Note: Bangladesh is <strong>in</strong>cluded <strong>in</strong> Pakistan through 1970. Francophone <strong>Africa</strong> comprises Ben<strong>in</strong>, Burk<strong>in</strong>a Faso, Cameroon, the Central <strong>Africa</strong>n Republic, Chad,Côte d’Ivoire, Gu<strong>in</strong>ea, Madagascar, Mali, Niger, Senegal, <strong>and</strong> Togo. Central Asia comprises Azerbaijan, Kazakhstan, the Kyrgyz Republic, Tajikistan, Turkmenistan,<strong>and</strong> Uzbekistan. Years refer to market<strong>in</strong>g seasons, for example, 2006 is 2006/07 (August through July).13
cotton production was <strong>in</strong>troduced <strong>in</strong> the United States <strong>in</strong> 1990, when 330 tonswere produced. Follow<strong>in</strong>g a peak <strong>of</strong> 7,425 tons <strong>in</strong> 1995, the United States nowproduces less than 2,000 tons. Currently, the world’s two major organic cottonproducers are India <strong>and</strong> Turkey, which together account for two-thirds <strong>of</strong>global organic cotton production. In 2004, this production was 25,400 tons,only about 0.1 percent <strong>of</strong> world cotton production.THE DEMAND SIDE: CHANGING FOCUS OF DEMANDAND COMPETITION WITH SYNTHETIC FIBERSBetween 1960 <strong>and</strong> 2005, global cotton dem<strong>and</strong> grew at the same rate as the population(close to 2 percent per year), imply<strong>in</strong>g that per capita cotton consumptionhas rema<strong>in</strong>ed steady at about 3.5 kgs per year. By contrast, consumption <strong>of</strong>chemical fibers, which compete with cotton, has <strong>in</strong>creased over the past 50 yearsby 2.2 percent per year, caus<strong>in</strong>g cotton’s share <strong>in</strong> total fiber consumption todecl<strong>in</strong>e from 60 percent <strong>in</strong> 1960 to less than 40 percent <strong>in</strong> 2005.<strong>Cotton</strong> l<strong>in</strong>t consumption is determ<strong>in</strong>ed by the location <strong>of</strong> the textile <strong>in</strong>dustries.Dur<strong>in</strong>g the 1960s, Europe, the United States, <strong>and</strong> Japan were major textile manufacturers<strong>and</strong> hence major consumers <strong>of</strong> cotton l<strong>in</strong>t. Gradually, however, textile<strong>in</strong>dustries moved to Asia. Today, Ch<strong>in</strong>a, India, Pakistan, <strong>and</strong> Turkey account formore than 70 percent <strong>of</strong> global cotton consumption. Key reasons for the relocation<strong>of</strong> textile <strong>in</strong>dustries to these countries <strong>in</strong>clude low wage <strong>and</strong> energy costs <strong>and</strong>their ability to deliver f<strong>in</strong>al goods <strong>in</strong> a timely fashion. Currently, the 10 largest cottonimporters account for more than 70 percent <strong>of</strong> global cotton trade. Threemajor producers—Ch<strong>in</strong>a, Pakistan, <strong>and</strong> Turkey—also import cotton l<strong>in</strong>t to supplytheir textile <strong>in</strong>dustries. The four East Asian textile producers—Indonesia, theRepublic <strong>of</strong> Korea, Taiwan, <strong>and</strong> Thail<strong>and</strong>—accounted for more than 20 percent<strong>of</strong> world cotton imports <strong>in</strong> 2005, compared with just 3 percent <strong>in</strong> 1960. F<strong>in</strong>ally,the shift <strong>of</strong> cotton consumption to Asia has been aided by the fact that mostchemicals are produced <strong>in</strong> Asia <strong>and</strong> by the abolition <strong>of</strong> the Multi-Fiber Agreement,which, <strong>in</strong> effect, dictated the trade flows <strong>of</strong> textile products.DECLINING AND VOLATILE WORLD PRICES FOR LINTReal cotton prices have decl<strong>in</strong>ed over the last two centuries, although with temporaryspikes. The reasons for the long-term decl<strong>in</strong>e are similar to those characteriz<strong>in</strong>gmost primary commodities: on the supply side, reduced productioncosts result<strong>in</strong>g from technological improvements, <strong>and</strong> on the dem<strong>and</strong> side,stagnant per capita consumption <strong>and</strong> competition from synthetic products(for some commodities, <strong>in</strong>clud<strong>in</strong>g cotton). Between 1960–64 <strong>and</strong> 1999–2003,real cotton prices fell 55 percent, remarkably similar to the 50 percent decl<strong>in</strong>e<strong>in</strong> the broad agriculture price <strong>in</strong>dex <strong>of</strong> 28 commodities (figure 2.1). Two periods<strong>of</strong> pronounced price changes dur<strong>in</strong>g the past half century were the oil-<strong>in</strong>duced14 BAFFES AND ESTUR
Figure 2.1 Real Agricultural Price Index (based on 28 commodities) <strong>and</strong><strong>Cotton</strong> Prices Adjusted by the MUV, 1960–2008 (1980 = 1.0)1.61.41.2<strong>in</strong>dex1.00.80.60.41960196319661969197219751978Source: World Bank, Commodity Price Data.Note: MUV = manufacturers unit value.1981cotton19841987agriculture1990199319961999200220052008boom <strong>of</strong> the 1970s <strong>and</strong> the price collapse <strong>of</strong> the mid-1980s. The 1985 cottonprice collapse was a result <strong>of</strong> a policy shift <strong>in</strong> U.S. commodity programs(<strong>in</strong>clud<strong>in</strong>g cotton). It also reflected a policy shift <strong>in</strong> Ch<strong>in</strong>a that favored domesticcotton production.In addition to their decl<strong>in</strong><strong>in</strong>g trend, cotton prices have been volatile, a commonphenomenon among primary commodities. The degree <strong>of</strong> volatility, however,changed considerably dur<strong>in</strong>g the past 40 years. Various measures <strong>of</strong> pricevolatility calculated by Baffes (2005) show three dist<strong>in</strong>ct periods: (a) 1960 to1972, when prices were very stable; (b) 1973 to 1984, when various measure <strong>of</strong>volatility quadrupled; <strong>and</strong> (c) 1985 to 2002, when volatility fell by half butrema<strong>in</strong>ed twice what it was dur<strong>in</strong>g the period 1960–72. This conclusion is similarto f<strong>in</strong>d<strong>in</strong>gs by Valdès <strong>and</strong> Foster (2003), who looked at price variability <strong>of</strong>corn, rice, sugar, <strong>and</strong> wheat, as well as f<strong>in</strong>d<strong>in</strong>gs by Sarris (2000), who exam<strong>in</strong>ed<strong>in</strong>trayear <strong>and</strong> <strong>in</strong>teryear price variability <strong>of</strong> wheat <strong>and</strong> maize. 13<strong>Cotton</strong> has not been part <strong>of</strong> the recent commodity price boom (figure 2.2).Likely reasons <strong>in</strong>clude the fact that (a) cotton subsidies cont<strong>in</strong>ue to depressprices; (b) GM cotton production is exp<strong>and</strong><strong>in</strong>g, particularly <strong>in</strong> Ch<strong>in</strong>a <strong>and</strong>India, where production costs have been kept low, <strong>in</strong> part as a result <strong>of</strong> rapidexpansion <strong>of</strong> GM cotton varieties; (c) the prices <strong>of</strong> many other commoditieshave recently rallied because <strong>of</strong> the <strong>in</strong>creas<strong>in</strong>g dem<strong>and</strong> for bi<strong>of</strong>uels production(for example, maize for ethanol production <strong>in</strong> the United States <strong>and</strong>rapeseed for biodiesel production <strong>in</strong> the European Union); <strong>and</strong> (d) most foodMARKET CONTEXT 15
Figure 2.2 Nom<strong>in</strong>al <strong>Cotton</strong> Prices (US$ per kilogram) <strong>and</strong> Agricultural PriceIndex (October 2001 = 1.0), January 1985–September 20083.02.5<strong>in</strong>dex2.01.51.00.5Jan-85Jan-87Jan-89Jan-91Jan-93Jan-95cottonJan-97Jan-99agricultureJan-01Jan-03Jan-05Jan-07Source: World Bank, Commodity Price Data.commodities have responded to <strong>in</strong>creased energy costs much more stronglythan cotton. 14EXTERNAL FACTORS AFFECTING WORLD LINT PRICESTwo major factors affect<strong>in</strong>g <strong>Africa</strong>n cotton trade—but for the most part notunder full control <strong>of</strong> <strong>in</strong>dividual governments—must be underscored: (a) theimpact <strong>of</strong> exchange rate variations, that is, the relative value <strong>of</strong> the nationalcurrency with respect to the dollar; <strong>and</strong> (b) the distortions created on theworld market for cotton l<strong>in</strong>t by the subsidies paid by some <strong>of</strong> the Organisationfor Economic Co-operation <strong>and</strong> Development countries <strong>and</strong> by Ch<strong>in</strong>a to theircotton producers.Exchange RatesBecause cotton is traded <strong>in</strong> U.S. dollars (as are most commodities), cottonprices are affected by the movement <strong>of</strong> the U.S. dollar <strong>in</strong> addition to allother factors affect<strong>in</strong>g cotton prices. For example, the U.S. dollar’s strengthafter the East Asian f<strong>in</strong>ancial crisis was partly responsible for the collapse <strong>of</strong>commodity prices <strong>in</strong> the late 1990s <strong>and</strong> early 2000s. Similarly, the weakness<strong>of</strong> the U.S. dollar contributed to the commodity price boom at the middle<strong>of</strong> the 2000s. 15 However, all cotton producers are affected by the variability<strong>of</strong> the currency <strong>in</strong> which their cotton is sold. Countries exam<strong>in</strong>ed <strong>in</strong> thisreport are affected by three exchange rate–related issues: (a) appreciation <strong>of</strong>16 BAFFES AND ESTUR
the CFA franc, particularly critical for WCA countries; (b) the Dutch diseaseeffect <strong>in</strong> Zambia; <strong>and</strong> (c) hyper<strong>in</strong>flation <strong>in</strong> Zimbabwe.The CFA franc, the currency <strong>of</strong> 14 WCA countries, is l<strong>in</strong>ked to the euro(or to the French franc before 2000; see box 2.1 for the history <strong>of</strong> the CFAfranc). Follow<strong>in</strong>g the 1994 devaluation <strong>of</strong> the CFA franc aga<strong>in</strong>st the Frenchfranc, WCA countries <strong>in</strong> general, <strong>and</strong> their cotton sectors <strong>in</strong> particular,ga<strong>in</strong>ed competitiveness; production <strong>in</strong> the four WCA study countries nearlydoubled over the next four years (compared with a 20 percent rise over theprevious four years), driven especially by Burk<strong>in</strong>a Faso <strong>and</strong> Mali. However,follow<strong>in</strong>g the very strong appreciation <strong>in</strong> recent years <strong>of</strong> the euro aga<strong>in</strong>st theU.S. dollar (<strong>and</strong> consequently <strong>of</strong> the CFA franc), the competitive edge that itBox 2.1 The CFA Franc <strong>and</strong> <strong>Cotton</strong> <strong>in</strong> WCAThe CFA franc (CFAF) is the common currency <strong>of</strong> 14 WCA countries compris<strong>in</strong>gtwo groups, all members <strong>of</strong> the <strong>Africa</strong>n franc zone. One group<strong>in</strong>cludes Ben<strong>in</strong>, Burk<strong>in</strong>a Faso, Côte d’Ivoire, Gu<strong>in</strong>ea Bissau, Mali, Niger, Senegal,<strong>and</strong> Togo, which form the West <strong>Africa</strong>n Economic <strong>and</strong> Monetary Union(WAEMU) <strong>and</strong> whose common central bank is the Central Bank <strong>of</strong> West<strong>Africa</strong>n States. The other group <strong>in</strong>cludes Cameroon, the Central <strong>Africa</strong>nRepublic, Republic <strong>of</strong> Congo, Gabon, Equatorial Gu<strong>in</strong>ea, <strong>and</strong> Chad, whichform the Central <strong>Africa</strong> Economic <strong>and</strong> Monetary Community (CEMAC) <strong>and</strong>whose common central bank is the Bank <strong>of</strong> Central <strong>Africa</strong>n States (BEAC).The CFAF was created <strong>in</strong> 1945, when France ratified the Bretton Woodsagreement. At that time, the CFAF was the abbreviation for Franc <strong>of</strong> theFrench Colonies <strong>of</strong> <strong>Africa</strong> (Franc des Colonies Françaises d’Afrique). In 1958,it became Franc <strong>of</strong> the French Community <strong>of</strong> <strong>Africa</strong> (Franc de la CommunautéFrançaise d’Afrique). Today it means Franc <strong>of</strong> the <strong>Africa</strong>n F<strong>in</strong>ancialCommunity (Franc de la Communauté F<strong>in</strong>anciére d’Afrique) for WAEMUmembers <strong>and</strong> Franc <strong>of</strong> F<strong>in</strong>ancial Cooperation <strong>in</strong> Central <strong>Africa</strong> (Franc de laCoopération F<strong>in</strong>anciére en Afrique Centrale) for CEMAC members. Initially,convertibility with the French franc (FF) was set at 0.59 CFAF/FF, becom<strong>in</strong>g0.50 CFAF/FF after the 1948 devaluation <strong>of</strong> the French franc. In 1958, twozeros were added to the exist<strong>in</strong>g denom<strong>in</strong>ation, mak<strong>in</strong>g it 50 CFAF/FF.Dur<strong>in</strong>g the early 1990s, it became <strong>in</strong>creas<strong>in</strong>gly apparent that the CFAF wasovervalued. The degree <strong>of</strong> overvaluation, however, differed markedly amongWCA countries. Baffes, Elbadawi, <strong>and</strong> O’Connell (1999), for example, basedon a s<strong>in</strong>gle-equation framework, estimated that dur<strong>in</strong>g the early 1990s, theCFAF was overvalued more than 30 percent <strong>in</strong> Côte d’Ivoire while it wasroughly <strong>in</strong> equilibrium <strong>in</strong> Burk<strong>in</strong>a Faso. Devarajan (1999), based on a simplegeneral equilibrium model, concluded that the CFAF overvaluation <strong>in</strong> 1993(one year before the devaluation) was 78 percent <strong>in</strong> Cameroon, 52 percent <strong>in</strong>(cont<strong>in</strong>ued)MARKET CONTEXT 17
Box 2.1 (Cont<strong>in</strong>ued)Togo, 39 percent <strong>in</strong> Mali, 36 percent <strong>in</strong> Côte d’Ivoire, 22 percent <strong>in</strong> Senegal, 9percent <strong>in</strong> Burk<strong>in</strong>a Faso, 3 percent <strong>in</strong> Ben<strong>in</strong>, <strong>and</strong> –19 percent <strong>in</strong> Chad (that is,undervalued). For an extensive discussion <strong>of</strong> issues surround<strong>in</strong>g the CFAFovervaluation, see H<strong>in</strong>kle <strong>and</strong> Montiel (1999). In January 1994, the CFAF wasrepegged to the French franc at 100 CFAF/FF <strong>and</strong> <strong>in</strong> 1999 it was l<strong>in</strong>ked to theeuro at 656 CFAF/€, keep<strong>in</strong>g its former parity with the FF.The 1994 adjustment to the CFAF, which temporarily restored currencyequilibrium <strong>in</strong> most WCA countries, coupled with the cotton price <strong>in</strong>creases<strong>of</strong> the mid-1990s, <strong>in</strong>duced considerable supply response <strong>in</strong> the cotton sectors<strong>of</strong> most WCA countries. For example, regional cotton production <strong>in</strong>creasedfrom 573,000 tons <strong>in</strong> 1993/94 (the year before devaluation) to 921,000 tons <strong>in</strong>just four years. For the n<strong>in</strong>e years that followed, however, cotton outputrema<strong>in</strong>ed, for the most part, stagnant at 900,000 tons. Such stagnation alongwith the f<strong>in</strong>ancial difficulties <strong>of</strong> the cotton companies may be a result <strong>of</strong>, <strong>in</strong>part, the likely overvaluation <strong>of</strong> the CFAF. This result should not be surpris<strong>in</strong>g.Dur<strong>in</strong>g 2005/06, the U.S. dollar Cotlook A Index (that is, the world price<strong>of</strong> cotton) average was roughly the same as <strong>in</strong> 2000/01. However, dur<strong>in</strong>g thesame period, the CFAF appreciated from 731 CFAF/$ to 535 CFAF/$, effectivelyreduc<strong>in</strong>g the world price <strong>of</strong> cotton <strong>in</strong> CFAF terms by 37 percent.was giv<strong>in</strong>g to CFA countries <strong>in</strong> the 1990s disappeared. Figure 2.3 depicts theConsumer Price Indices adjusted bilateral exchange rate <strong>of</strong> three countries,India, Ch<strong>in</strong>a, <strong>and</strong> Burk<strong>in</strong>a Faso, s<strong>in</strong>ce January 2002. Although India <strong>and</strong>Ch<strong>in</strong>a have seen little real depreciation, the CFA franc <strong>in</strong> Burk<strong>in</strong>a Faso hasappreciated by almost one-third aga<strong>in</strong>st the U.S. dollar <strong>in</strong> real terms. Thesefluctuations affect the performance <strong>of</strong> the cotton sectors: Ch<strong>in</strong>a’s cotton production<strong>in</strong>creased from 5.3 million tons <strong>in</strong> 2003 to 8 million tons <strong>in</strong> 2007.Similarly, India’s cotton production <strong>in</strong>creased from 3.0 to 5.3 million dur<strong>in</strong>gthe same period. <strong>Cotton</strong> production <strong>in</strong> WCA, however, decl<strong>in</strong>ed from 0.91 to0.79 million tons dur<strong>in</strong>g the period.Exchange rate movements are also an important issue <strong>in</strong> Zambia, but for adifferent reason (Tschirley <strong>and</strong> Kabwe 2007b). From 1996 through 2001, theZambian kwacha slowly depreciated <strong>in</strong> real terms aga<strong>in</strong>st the U.S. dollar. As aresult, export sectors with a significant share <strong>of</strong> costs <strong>in</strong> local currency wouldhave been able to earn slightly higher pr<strong>of</strong>its, all else be<strong>in</strong>g equal. From mid-2002 to mid-2005, however, the kwacha appreciated more than 30 percentaga<strong>in</strong>st the U.S. dollar. Though this pattern may have been broadly consistentwith depreciation <strong>of</strong> the U.S. dollar more generally, the kwacha then appreciatedan additional 35 percent over the next n<strong>in</strong>e months, putt<strong>in</strong>g extraord<strong>in</strong>arypressure on its export sectors. A slight recovery <strong>in</strong> the real rate <strong>in</strong> late 2006 leftit still well below typical levels from 1996 through 2002.Zimbabwe faces exchange rate issues as well, albeit <strong>of</strong> a different k<strong>in</strong>d. S<strong>in</strong>ce2001, export<strong>in</strong>g companies have been required to remit a proportion <strong>of</strong> all18 BAFFES AND ESTUR
Figure 2.3 Real Exchange Rate for India, Ch<strong>in</strong>a, <strong>and</strong> Burk<strong>in</strong>a Faso aga<strong>in</strong>stthe U.S. Dollar, Adjusted by the Consumer Price Indices,2001–07 (January 2002 = 1.0)1.21.11.0<strong>in</strong>dex0.90.80.70.6Jan-02Jul-02Jan-03Jul-03Jan-04Source: IMF, International F<strong>in</strong>ancial Statistics.Jul-04Jan-05Jul-05Jan-06India Ch<strong>in</strong>a Burk<strong>in</strong>a FasoJul-06Jan-07Jul-07foreign exchange receipts to the Central Bank, where they have beenexchanged <strong>in</strong>to Zimbabwe dollars at the <strong>of</strong>ficial exchange rate. The export<strong>in</strong>gcompanies have been allowed to keep the rema<strong>in</strong>der <strong>in</strong> foreign currencyaccounts, but s<strong>in</strong>ce 2005 it has been difficult for companies to access <strong>and</strong>freely use the portion (currently 70 percent) kept <strong>in</strong> foreign accounts. As theratio <strong>of</strong> the parallel exchange rate to the <strong>of</strong>ficial exchange rate varied from 1.0to 24.7 between January 2003 <strong>and</strong> February 2007 (average was 3.7), the proportion<strong>of</strong> their proceeds that companies were allowed to keep became animportant determ<strong>in</strong>ant <strong>of</strong> their pr<strong>of</strong>itability.SubsidiesAlthough there are various trade-distort<strong>in</strong>g <strong>in</strong>terventions <strong>in</strong> the cotton market,the most important at a global level is the domestic support given by theUnited States (see box 2.2). Numerous models have evaluated the impact <strong>of</strong>US cotton policies on the global market, with considerable variation <strong>in</strong> results(a summary description <strong>of</strong> these models can be found <strong>in</strong> Food <strong>and</strong> Agriculture<strong>Organization</strong> <strong>of</strong> the United Nations [FAO 2004]). 16 A simple average overall models shows that world cotton prices would have been between 10 <strong>and</strong> 15percent higher without support. Apply<strong>in</strong>g a simple average to WCA cottonproduc<strong>in</strong>g countries shows that these countries lost approximately $150million annually <strong>in</strong> export earn<strong>in</strong>gs because <strong>of</strong> the subsidies. <strong>Cotton</strong> subsidiesMARKET CONTEXT 19
Box 2.2 <strong>Cotton</strong> Subsidies<strong>Cotton</strong> subsidies <strong>in</strong> the United States have a long history dat<strong>in</strong>g from thecommodity programs <strong>of</strong> the Great Depression. The specific provisions <strong>of</strong>these programs, <strong>in</strong>clud<strong>in</strong>g the one for cotton, change with each farm billpassed by the Congress (farm bills are <strong>in</strong>troduced approximately every fourto five years), but their chief objective has rema<strong>in</strong>ed largely unchanged: totransfer <strong>in</strong>come from taxpayers (<strong>and</strong> to some extent consumers) to producers.The ma<strong>in</strong> channels <strong>of</strong> support to U.S. cotton producers are the follow<strong>in</strong>g:(a) price-based payments (also known as loan rate payments) are designed tocompensate cotton growers for the difference between the market price <strong>and</strong>the target price when the latter exceeds the former; (b) decoupled payments(renamed direct payments <strong>in</strong> the 2002 farm bill) are predeterm<strong>in</strong>ed annualpayments calculated on the basis <strong>of</strong> area historically used for cotton production(direct payments were <strong>in</strong>troduced with the 1996 farm bill to compensateproducers for “losses” follow<strong>in</strong>g the elim<strong>in</strong>ation <strong>of</strong> deficiency payments);(c) crop <strong>in</strong>surance is a subsidy to provide protection aga<strong>in</strong>st weather-relatedcrop failures; <strong>and</strong> (d) countercyclical payments were <strong>in</strong>troduced <strong>in</strong> 1998 (as“emergency payments”) to compensate producers for <strong>in</strong>come “lost” because<strong>of</strong> low commodity prices. The countercyclical payments were made permanentunder the 2002 farm bill. In addition to these transfers, there are otherpublicly funded programs—among them research <strong>and</strong> extension services <strong>and</strong>subsidized irrigation. The U.S. cotton program, which was subject to reviewby the U.S. General Account<strong>in</strong>g Office twice (1990 <strong>and</strong> 1995), was, <strong>and</strong> still is,very complex <strong>and</strong> expensive.The European Union (EU) also supports its cotton producers. Between1997 <strong>and</strong> 2007, the budgetary expenditure on the cotton sector rangedbetween $0.7 <strong>and</strong> $1.0 billion, imply<strong>in</strong>g that, on average, EU cotton producersreceived more than twice the world price <strong>of</strong> cotton. EU cotton producersreceived support even <strong>in</strong> periods <strong>of</strong> high prices—because the budgetary allocationto the cotton sector must be disbursed. For example, producersreceived approximately the same level <strong>of</strong> support <strong>in</strong> 1995 <strong>and</strong> 2002, althoughcotton prices <strong>in</strong> 1995 were twice the level <strong>of</strong> 2002. A major restructur<strong>in</strong>g <strong>of</strong>the EU cotton program was undertaken under the Luxembourg Council’sdecision <strong>of</strong> April 22, 2004, which was based on the September 2003 proposal.Under the new program that went <strong>in</strong>to effect <strong>in</strong> 2006, an estimated €700 million(almost US$1 billion) funds two support measures, with 65 percent <strong>of</strong> thesupport tak<strong>in</strong>g the form <strong>of</strong> a s<strong>in</strong>gle decoupled payment <strong>and</strong> the rema<strong>in</strong><strong>in</strong>g 35percent tak<strong>in</strong>g the form <strong>of</strong> an area payment (European Commission 2003). Am<strong>in</strong>or change took place <strong>in</strong> 2008 regard<strong>in</strong>g the eligible base area, but this doesnot affect the amount <strong>of</strong> total support.20 BAFFES AND ESTUR
ecame a contentious issue dur<strong>in</strong>g the current trade round under the auspices<strong>of</strong> the Doha Development Agenda. The cotton subsidy issue was further highlightedfollow<strong>in</strong>g the move by four WCA cotton produc<strong>in</strong>g countries (Ben<strong>in</strong>,Burk<strong>in</strong>a Faso, Chad, <strong>and</strong> Mali) to dem<strong>and</strong> compensation for the lower pricesreceived because <strong>of</strong> subsidies. Brazil also brought a case to the World Trade<strong>Organization</strong> (WTO) aga<strong>in</strong>st the United States, claim<strong>in</strong>g, among other issues,that subsidies reduce world prices <strong>and</strong> hence hurt Brazil’s export earn<strong>in</strong>gs.Follow<strong>in</strong>g the WTO’s rul<strong>in</strong>g, the United States removed the Step 2 paymentpart <strong>of</strong> its cotton program (amount<strong>in</strong>g to about 15 percent <strong>of</strong> its subsidies).The WCA cotton producers, however, have not received any compensation.The fate <strong>of</strong> rema<strong>in</strong><strong>in</strong>g U.S. subsidies is currently under discussion with<strong>in</strong> theframework <strong>of</strong> the U.S. Farm Bill. Although there may be some reduction <strong>in</strong>U.S. subsidies, it is unlikely that they will be elim<strong>in</strong>ated altogether.INCREASINGLY STRINGENT DEMAND FOR QUALITY FIBERLike all commodities, cotton is differentiated by quality parameters for thepurposes <strong>of</strong> trade. <strong>Cotton</strong> fiber (l<strong>in</strong>t) is the raw material for the textile manufacturerwho transforms cotton <strong>in</strong>to yarn <strong>and</strong> then <strong>in</strong>to fabric for apparel,household goods, or <strong>in</strong>dustrial products. <strong>Cotton</strong> quality requirements canvary substantially depend<strong>in</strong>g on the f<strong>in</strong>al product, <strong>and</strong> the quality differencesaffect the price that manufacturers are will<strong>in</strong>g to pay <strong>and</strong> the value they canget from the cotton l<strong>in</strong>t. Price differentials vary widely, with a ratio <strong>of</strong> about1:4 between the lowest <strong>and</strong> the highest quality l<strong>in</strong>t. 17Increas<strong>in</strong>gly, quality dem<strong>and</strong>s are be<strong>in</strong>g placed on the entire textile supplycha<strong>in</strong>, from the raw material to end products. Chemical fiber performance hasbecome a benchmark for cotton sp<strong>in</strong>n<strong>in</strong>g. The ma<strong>in</strong> challenge for cotton is tobe able to compete with chemical fibers, ma<strong>in</strong>ly polyester, on both price <strong>and</strong>quality. Chemical fibers are generally easier to process, more versatile, <strong>and</strong>stronger than cotton fiber, <strong>and</strong> modern textile <strong>in</strong>dustry mach<strong>in</strong>ery requiresfrom cotton fiber the same characteristics <strong>of</strong> cleanl<strong>in</strong>ess <strong>and</strong> homogeneity asthose <strong>of</strong>fered by artificial fibers.In short, the <strong>in</strong>creas<strong>in</strong>gly str<strong>in</strong>gent dem<strong>and</strong> for quality cotton can be articulated<strong>in</strong> the follow<strong>in</strong>g motto: “fiber, only fiber, but more than just fiber.” Therest <strong>of</strong> this section elaborates on each aspect <strong>of</strong> this challenge.FiberBecause cotton is a natural <strong>and</strong> seasonal product, its fiber properties, its cleanl<strong>in</strong>ess<strong>and</strong> contam<strong>in</strong>ation, <strong>and</strong> the homogeneity <strong>of</strong> its characteristics can varygreatly as a result <strong>of</strong> genetic, environmental, harvest<strong>in</strong>g, <strong>and</strong> g<strong>in</strong>n<strong>in</strong>g factors.Such variability impacts process<strong>in</strong>g performance, costs, <strong>and</strong> quality throughoutthe cotton textile cha<strong>in</strong>. Fiber properties primarily depend on varieties grown,agro-climatic conditions, <strong>and</strong> crop management practices. The cleanl<strong>in</strong>ess <strong>of</strong> l<strong>in</strong>tMARKET CONTEXT 21
efers specifically to the presence <strong>of</strong> vegetal matter other than l<strong>in</strong>t, whilecontam<strong>in</strong>ation refers to the presence <strong>of</strong> nonplant matter. Both cleanl<strong>in</strong>ess<strong>and</strong> contam<strong>in</strong>ation depend on harvest<strong>in</strong>g methods, storage, transport, <strong>and</strong>g<strong>in</strong>n<strong>in</strong>g practices.Better fiber quality translates <strong>in</strong>to better yarn quality <strong>and</strong> higher process<strong>in</strong>gefficiency. Among the fiber properties, staple length has the greatest <strong>in</strong>fluenceon sp<strong>in</strong>n<strong>in</strong>g performance. <strong>Cotton</strong> fiber represents about 50 percent <strong>of</strong>the cost <strong>of</strong> yarn. Traditionally, the price <strong>of</strong> cotton was largely determ<strong>in</strong>ed byfactors such as staple length, grade, color, <strong>and</strong> micronaire. 18 Those factors arestill the major determ<strong>in</strong>ants <strong>of</strong> price, but sp<strong>in</strong>ners today are also <strong>in</strong>terested <strong>in</strong>other fiber properties that affect the quality <strong>of</strong> their yarns <strong>and</strong> the efficiencywith which they can produce those yarns. As the textile <strong>in</strong>dustry has beenstriv<strong>in</strong>g to improve quality <strong>and</strong> efficiency through automatic high-speedmach<strong>in</strong>ery, new technologies place <strong>in</strong>creas<strong>in</strong>gly severe technical dem<strong>and</strong>s ontextile fibers, rais<strong>in</strong>g the importance <strong>of</strong> other properties <strong>of</strong> cotton: strength(or tenacity), uniformity, maturity, f<strong>in</strong>eness, elongation, neps, 19 short fibercontent, sp<strong>in</strong>n<strong>in</strong>g performance, dye<strong>in</strong>g ability, <strong>and</strong> cleanl<strong>in</strong>ess. All else equal,sp<strong>in</strong>ners pay a higher price for longer, f<strong>in</strong>er, <strong>and</strong> stronger cotton l<strong>in</strong>t that iswhite, bright, <strong>and</strong> fully mature.The most commonly produced <strong>and</strong> traded cotton l<strong>in</strong>t variety <strong>in</strong> the worldbelongs to the species Gossypium hirsutum, which is also known as upl<strong>and</strong> cotton.Extra long staple cotton used for produc<strong>in</strong>g very f<strong>in</strong>e yarns come fromanother species 20 <strong>and</strong> accounts for less than 5 percent <strong>of</strong> world cotton trade.Follow<strong>in</strong>g the global trend toward improv<strong>in</strong>g yarn quality, the market share<strong>of</strong> medium <strong>and</strong> higher grades is ris<strong>in</strong>g, while the share <strong>of</strong> shorter (“coarsecount”) upl<strong>and</strong> cotton is decl<strong>in</strong><strong>in</strong>g. Medium <strong>and</strong> higher grades <strong>of</strong> upl<strong>and</strong> cottonnow account for an estimated 75 percent <strong>of</strong> world trade, or some 7 millionmetric tons, <strong>and</strong> are typically used <strong>in</strong> r<strong>in</strong>g sp<strong>in</strong>n<strong>in</strong>g.The recognized benchmark for <strong>in</strong>ternational cotton prices, the Cotlook AIndex, is based on the representative <strong>of</strong>fer<strong>in</strong>g price for a “basket” <strong>of</strong> themedium grade cotton most commonly traded <strong>in</strong>ternationally. Those pricequotations refer to a common quality, contractual, <strong>and</strong> geographical 21 basis(table 2.2). L<strong>in</strong>t <strong>of</strong> this quality is typically used <strong>in</strong> r<strong>in</strong>g sp<strong>in</strong>n<strong>in</strong>g for the production<strong>of</strong> r<strong>in</strong>g spun carded yarns. 22 The fastest grow<strong>in</strong>g <strong>and</strong> most remunerativemarket for upl<strong>and</strong> cotton is for higher grades <strong>and</strong> f<strong>in</strong>er cotton used forproduc<strong>in</strong>g r<strong>in</strong>g spun combed yarns 23 for the woven <strong>and</strong> knitted apparel sector.In that segment, the modern high-speed mach<strong>in</strong>ery requires better fiber characteristicsto operate at maximum efficiency <strong>and</strong> sp<strong>in</strong> high quality yarns. Asshown <strong>in</strong> table 2.2, the fiber properties <strong>of</strong> most <strong>Africa</strong>n upl<strong>and</strong> cotton liebetween these two levels, superior to Cotlook A Index specifications but notalways reach<strong>in</strong>g those needed for r<strong>in</strong>g spun combed yarns.In addition to requir<strong>in</strong>g longer, cleaner, whiter, brighter, stronger, <strong>and</strong> f<strong>in</strong>erfiber, this higher segment <strong>of</strong> the market (for r<strong>in</strong>g spun combed yarns) is moredem<strong>and</strong><strong>in</strong>g <strong>of</strong> other fiber properties, such as elongation <strong>and</strong> neps. It also22 BAFFES AND ESTUR
Table 2.2 Fiber Properties <strong>of</strong> the Cotlook A Index, Typical <strong>Africa</strong>nUpl<strong>and</strong> <strong>Cotton</strong>, <strong>and</strong> Top Quality L<strong>in</strong>t for Combed YarnsFiber propertyCotlook A <strong>in</strong>dexTypical <strong>Africa</strong>nupl<strong>and</strong> cottonGrade Middl<strong>in</strong>g—white Strict low middl<strong>in</strong>gto good middl<strong>in</strong>gStaple length1 3/32 <strong>in</strong>ches(27.8 mm)1 1/6 to 1 3/16<strong>in</strong>ches (27 to30.2 mm)L<strong>in</strong>t for r<strong>in</strong>g spuncombed yarnsStrict middl<strong>in</strong>g—white1 1/8 <strong>in</strong>ches(28.6 mm)Micronaire 3.5 to 4.9 3.5 to 4.5 3.8 to 4.2Fiber strength 25 to 30 grams 27 to 32 grams more than 30 gramsper texper texper texSource: Authors’ estimates based on <strong>in</strong>terviews.Note: A tex unit is equal to the weight <strong>in</strong> grams <strong>of</strong> 1,000 meters <strong>of</strong> fiber. The strengthreported is the force <strong>in</strong> grams required to break a bundle <strong>of</strong> fibers one tex unit <strong>in</strong> size.dem<strong>and</strong>s a lower variance <strong>in</strong> fiber properties, notably greater uniformity <strong>of</strong>length <strong>and</strong> lower short fiber content.Only Fiber<strong>Cotton</strong> prices are not solely determ<strong>in</strong>ed by <strong>in</strong>tr<strong>in</strong>sic fiber properties <strong>and</strong> l<strong>in</strong>tcleanl<strong>in</strong>ess. Contam<strong>in</strong>ation <strong>of</strong> l<strong>in</strong>t by nonvegetal foreign matter is the mostserious problem confront<strong>in</strong>g cotton sp<strong>in</strong>ners. Contam<strong>in</strong>ated cotton causes disruptions<strong>in</strong> the sp<strong>in</strong>n<strong>in</strong>g process, which <strong>in</strong>creases the cost <strong>of</strong> sp<strong>in</strong>n<strong>in</strong>g <strong>and</strong>reduces the quality <strong>of</strong> yarn <strong>and</strong> end products. There are no cost-effectivemeans <strong>of</strong> remov<strong>in</strong>g contam<strong>in</strong>ation once it is present <strong>in</strong> yarn or fabric. As aresult, contam<strong>in</strong>ation leads to the downgrad<strong>in</strong>g <strong>of</strong> end products or even torejection <strong>of</strong> an entire lot.<strong>Cotton</strong> that is contam<strong>in</strong>ated, or that is suspected <strong>of</strong> be<strong>in</strong>g contam<strong>in</strong>atedbecause <strong>of</strong> its orig<strong>in</strong>, can only be sold at a substantial discount to compensatethe user for <strong>in</strong>spect<strong>in</strong>g <strong>and</strong> clean<strong>in</strong>g the cotton before sp<strong>in</strong>n<strong>in</strong>g. Price differentialsfor cotton with the same fiber characteristics range from 5 percent to30 percent, depend<strong>in</strong>g on the degree <strong>of</strong> perceived contam<strong>in</strong>ation by extraneousmatter, stick<strong>in</strong>ess, <strong>and</strong> seed coat fragments. These discounts are usuallyapplied <strong>in</strong>discrim<strong>in</strong>ately to all cotton orig<strong>in</strong>at<strong>in</strong>g from an area or a countryconsidered to be affected by contam<strong>in</strong>ation.Contam<strong>in</strong>ation by foreign matter is more serious with h<strong>and</strong>picked cotton.Seed cotton picked by h<strong>and</strong> is cleaner, <strong>and</strong> the fiber obta<strong>in</strong>ed has fewer neps <strong>and</strong>a lower short fiber content than cotton picked by mach<strong>in</strong>e, which must becleaned more vigorously because it has more vegetative residues. H<strong>and</strong>pickedcotton should, therefore, normally be purchased at a premium over mach<strong>in</strong>epicked cotton. However, h<strong>and</strong>picked seed cotton <strong>of</strong>ten gets contam<strong>in</strong>ated dur<strong>in</strong>gMARKET CONTEXT 23
pick<strong>in</strong>g, storage, h<strong>and</strong>l<strong>in</strong>g, or transport, <strong>and</strong> the presence <strong>of</strong> foreign matter <strong>in</strong> thefiber <strong>of</strong>fsets the theoretical advantage conferred by manual pick<strong>in</strong>g. Because contam<strong>in</strong>ation<strong>of</strong> raw cotton by foreign matter is the ma<strong>in</strong> concern for quality yarn<strong>and</strong> fabric producers, sp<strong>in</strong>ners tend to prefer mach<strong>in</strong>e picked cotton to h<strong>and</strong>pickedcotton. As a result, h<strong>and</strong>picked cotton has lost its advantage <strong>and</strong> nowtrades at a discount to mach<strong>in</strong>e picked cotton. The elim<strong>in</strong>ation <strong>of</strong> contam<strong>in</strong>ationthus st<strong>and</strong>s out as the first priority for quality improvement <strong>in</strong> SSA.More than FiberAlong with fiber characteristics, other criteria, such as reputation <strong>and</strong> othermarket<strong>in</strong>g factors generally not <strong>in</strong>cluded <strong>in</strong> contracts, can have a last<strong>in</strong>g <strong>in</strong>fluenceon cotton prices. However, nonquality premiums <strong>and</strong> discounts are hardto quantify because each shipper <strong>and</strong> sp<strong>in</strong>ner may have different op<strong>in</strong>ions ona specific growth or orig<strong>in</strong>.Pric<strong>in</strong>g <strong>of</strong> l<strong>in</strong>t is significantly <strong>in</strong>fluenced by the way cotton is marketed<strong>and</strong> shipped. The sp<strong>in</strong>n<strong>in</strong>g <strong>in</strong>dustry today is especially concerned about consistency<strong>in</strong> shipments. Customers require homogeneous <strong>and</strong> reliable yearroundshipments, with consistent cotton characteristics, st<strong>and</strong>ardized baleswrapped <strong>in</strong> cotton cloth, <strong>and</strong> bale per bale <strong>in</strong>strument classification data.Because some countries can <strong>of</strong>fer bale per bale St<strong>and</strong>ardized Instrument forTest<strong>in</strong>g <strong>of</strong> <strong>Cotton</strong> data, the lack <strong>of</strong> reliable cotton quality data on each balenegatively impacts the price <strong>of</strong> cotton that is classified manually. The homogeneity<strong>of</strong> deliveries depends on seed cotton grad<strong>in</strong>g, l<strong>in</strong>t classification, <strong>and</strong>bale allotments.In market<strong>in</strong>g, perception may take a long time to catch up with facts. Trust<strong>and</strong> reputation matter <strong>in</strong> the cotton bus<strong>in</strong>ess <strong>and</strong> the market rewards orig<strong>in</strong>s<strong>and</strong> shippers that have strong records <strong>of</strong> deliver<strong>in</strong>g accord<strong>in</strong>g to quality st<strong>and</strong>ards<strong>and</strong> with consistency, while respect<strong>in</strong>g contract terms. Premiums <strong>and</strong>discounts attached to <strong>in</strong>ternationally traded cotton derive partly from the reputation<strong>of</strong> national orig<strong>in</strong>s.LINT MARKETING STRATEGIES: THE ROLE OF THEINTERNATIONAL COTTON MERCHANTUntil the mid-1980s, most l<strong>in</strong>t produced <strong>in</strong> <strong>Africa</strong> was sold by national cottoncompanies <strong>and</strong> market<strong>in</strong>g boards to <strong>in</strong>ternational merchants or to sp<strong>in</strong>nersthrough commissioned agents. Today, two types <strong>of</strong> companies supply l<strong>in</strong>t tothe world market out <strong>of</strong> SSA: (a) <strong>in</strong>dependent g<strong>in</strong>ners sell l<strong>in</strong>t to <strong>in</strong>ternationalcotton merchants (b) g<strong>in</strong>n<strong>in</strong>g companies affiliated with such merchants (“affiliatedg<strong>in</strong>ners”) sell l<strong>in</strong>t to or through their mother companies. 24 Internationalcotton merchants thus play a lead<strong>in</strong>g role <strong>in</strong> the market<strong>in</strong>g <strong>of</strong> <strong>Africa</strong>n l<strong>in</strong>t.Affiliated g<strong>in</strong>ners are present <strong>in</strong> all countries <strong>in</strong> this review except Cameroon<strong>and</strong> Mali, which cont<strong>in</strong>ue to operate national monopoly sectors. Most l<strong>in</strong>t24 BAFFES AND ESTUR
from SSA is h<strong>and</strong>led by <strong>in</strong>dependent g<strong>in</strong>ners. These g<strong>in</strong>ners <strong>in</strong>clude very largecompanies—the national monopolies <strong>of</strong> Mali <strong>and</strong> Cameroon <strong>and</strong> the formernational monopolies <strong>in</strong> Burk<strong>in</strong>a Faso <strong>and</strong> Ben<strong>in</strong> (SOFITEX <strong>and</strong> SONAPRA,respectively)—<strong>and</strong> smaller private companies, most <strong>in</strong> ESA. As a general rule,these <strong>in</strong>dependent g<strong>in</strong>ners have little knowledge <strong>of</strong> the world cotton market,very limited ability to use risk management tools, <strong>and</strong> receive very little feedbackfrom the end users. International cotton merchants are thus <strong>in</strong> a strongnegotiat<strong>in</strong>g position when deal<strong>in</strong>g with <strong>in</strong>dependent g<strong>in</strong>ners.In WCA, forward sales contracts at fixed price have been used extensivelyfor decades, primarily as a way to secure <strong>in</strong>put <strong>and</strong> crop f<strong>in</strong>anc<strong>in</strong>g. Sales arecontracted <strong>in</strong> euros per kilogram free on board, <strong>of</strong>fsett<strong>in</strong>g the exchange risk.G<strong>in</strong>ners usually base their prices on the Cotlook A Index, 25 valued at the forwardexchange rate for the shipp<strong>in</strong>g period considered. Forward sales at fixedprice <strong>in</strong> euro per kilogram are an effective way <strong>of</strong> mitigat<strong>in</strong>g risks, althoughhigh percentages <strong>of</strong> forward sales <strong>in</strong>crease the risk <strong>of</strong> not be<strong>in</strong>g able to deliverthe contracted quality <strong>and</strong> may lead to oversold situations. Smaller <strong>in</strong>dependentg<strong>in</strong>ners <strong>in</strong> ESA are generally not <strong>in</strong> a position to guarantee the volume <strong>and</strong>the quality <strong>of</strong> their production before it is g<strong>in</strong>ned, are not able to store l<strong>in</strong>t foran extended period, <strong>and</strong> therefore seldom engage <strong>in</strong> forward sales. They primarilydeal with price <strong>and</strong> exchange rate risks by adjust<strong>in</strong>g their buy<strong>in</strong>g priceover the course <strong>of</strong> the season <strong>and</strong> by sell<strong>in</strong>g the l<strong>in</strong>t as it is g<strong>in</strong>ned.Merchants carefully select sellers to guarantee contract performance. Largeparastatal companies <strong>in</strong> WCA are considered reliable by merchants, default<strong>in</strong>gonly <strong>in</strong> good faith, while private <strong>in</strong>dependent g<strong>in</strong>ners have mixed reputations.Merchants generally consider it much easier to purchase cotton <strong>in</strong> WCA countriesthan from <strong>in</strong>dependent g<strong>in</strong>ners <strong>in</strong> ESA countries because <strong>of</strong>fers are notspread over numerous small trad<strong>in</strong>g companies, 26 <strong>and</strong> the volume is sufficientto ensure year-round shipments, while quality st<strong>and</strong>ards are relatively consistent.In contrast, small <strong>in</strong>dependent g<strong>in</strong>ners <strong>in</strong> ESA are generally not <strong>in</strong> a positionto guarantee consistent or year-round shipments <strong>and</strong> large volumes.In addition to fixed price contracts, some basis pric<strong>in</strong>g is done “on call”the Cotlook A Index, “on call” the <strong>Africa</strong>n franc zone quotation <strong>in</strong> <strong>Cotton</strong>Outlook, or “on call” New York futures. On call pric<strong>in</strong>g means that the buyer(or seller) agrees to a volume <strong>and</strong> delivery date, but that the price will befixed at a later time. Major fluctuations <strong>in</strong> the basis (arithmetic difference)between spot prices <strong>and</strong> the New York futures can present challenges to hedg<strong>in</strong>g<strong>of</strong> <strong>Africa</strong>n cottons.Competition among buyers <strong>and</strong> among g<strong>in</strong>ners <strong>of</strong> seed cotton with<strong>in</strong> a produc<strong>in</strong>gcountry may <strong>in</strong>crease the producer price, especially when there is overcapacity<strong>in</strong> g<strong>in</strong>n<strong>in</strong>g. Among the countries <strong>in</strong>cluded <strong>in</strong> this study, this practiceis most common <strong>in</strong> Tanzania <strong>and</strong> Ug<strong>and</strong>a. Yet the immediate impact <strong>of</strong><strong>in</strong>creased competition between g<strong>in</strong>ners <strong>and</strong> exporters is to put pressure on thesell<strong>in</strong>g price <strong>of</strong> l<strong>in</strong>t because buyers (merchants <strong>and</strong> sp<strong>in</strong>ners) always takeadvantage <strong>of</strong> compet<strong>in</strong>g <strong>of</strong>fers from several sellers to buy from the cheapest. AMARKET CONTEXT 25
national monopoly (state-owned or private) is generally <strong>in</strong> a better position toprotect its sell<strong>in</strong>g price.Affiliated g<strong>in</strong>ners are generally more aware <strong>of</strong> market dem<strong>and</strong> <strong>and</strong> have lessexposure to <strong>in</strong>ternational price fluctuations than <strong>in</strong>dependent g<strong>in</strong>ners becausea part <strong>of</strong> the market risk is taken by the mother company, which has the abilityto hedge price <strong>and</strong> exchange rate risks.VALORIZATION OF BY-PRODUCTS: MARKETS FORCOTTONSEED OIL AND CAKEThe g<strong>in</strong>n<strong>in</strong>g process separates the cotton l<strong>in</strong>t from the seeds. In all <strong>of</strong> the studycountries, g<strong>in</strong>n<strong>in</strong>g companies buy the raw cotton <strong>and</strong> own both the l<strong>in</strong>t <strong>and</strong> theseed. In all countries but Zimbabwe, g<strong>in</strong>ners treat a small proportion (typicallyless than 10 percent) <strong>of</strong> the seeds <strong>and</strong> pack them for distribution back to farmersas plant<strong>in</strong>g seed. G<strong>in</strong>ners sell the rema<strong>in</strong>der 27 for process<strong>in</strong>g <strong>in</strong>to oil <strong>and</strong> cakeor, <strong>in</strong> a few cases, the seeds are processed directly by the g<strong>in</strong>n<strong>in</strong>g company. 28The value <strong>of</strong> l<strong>in</strong>t obta<strong>in</strong>ed from a ton <strong>of</strong> seed cotton is three to four times thecomb<strong>in</strong>ed value <strong>of</strong> the oil <strong>and</strong> cake that are derived from process<strong>in</strong>g the seeds.For this reason, oil <strong>and</strong> cake markets are <strong>of</strong>ten neglected <strong>in</strong> the analysis <strong>of</strong><strong>Africa</strong>n cotton sectors. Yet <strong>in</strong> some <strong>of</strong> the study countries, the revenue from seedsales more than covers the cost <strong>of</strong> g<strong>in</strong>n<strong>in</strong>g. In Cameroon, SODECOTON has s<strong>of</strong>ar avoided the losses that have affected the sector <strong>in</strong> other WCA countries, <strong>in</strong>part because <strong>of</strong> cross-subsidization from its pr<strong>of</strong>itable, <strong>in</strong>tegrated oil bus<strong>in</strong>ess.In Tanzania, more than a third <strong>of</strong> cotton g<strong>in</strong>ners now have an <strong>in</strong>tegrated oil process<strong>in</strong>gbus<strong>in</strong>ess. Not surpris<strong>in</strong>gly, some g<strong>in</strong>ners see oil process<strong>in</strong>g as their core(<strong>and</strong> most pr<strong>of</strong>itable) bus<strong>in</strong>ess.International Trade <strong>in</strong> <strong>Cotton</strong>seed OilIt is estimated that about 5 million tons <strong>of</strong> cottonseed oil is produced worldwideper year. This amount is similar to the production <strong>of</strong> groundnut, coconut, <strong>and</strong>palm kernel oil, but well beh<strong>in</strong>d palm oil (38 million tons), soybean oil (37million tons), rapeseed oil (18 million tons), <strong>and</strong> sunflower oil (11 milliontons). Moreover, while a large proportion <strong>of</strong> the four lead<strong>in</strong>g oils is traded<strong>in</strong>ternationally, less than 10 percent <strong>of</strong> global cottonseed oil production is traded.World cottonseed oil prices averaged $1,600/ton dur<strong>in</strong>g 2007/08, up from$800/ton dur<strong>in</strong>g 2006/07 (October to September) These price <strong>in</strong>creases aresimilar to those <strong>of</strong> other edible oils. For example, the World Bank’s fats <strong>and</strong> oilsprice <strong>in</strong>dex <strong>in</strong>creased 51 percent from 2006 to 2007 <strong>and</strong> 44 percent from 2007to 2008. <strong>Cotton</strong>seed oil used to be traded with a large premium over the fourlead<strong>in</strong>g oils. However, the premium has almost disappeared lately because <strong>of</strong>the high biodiesel dem<strong>and</strong> for rapeseed oil, which has also put upward pressureon soybean <strong>and</strong> palm oil prices. 2926 BAFFES AND ESTUR
Table 2.3 Summary <strong>of</strong> Indicators <strong>of</strong> Valorization <strong>of</strong> By-ProductsCountryAverage national seedcotton production,2001–06 (tons)<strong>Cotton</strong>seed oilproduction as % <strong>of</strong>national oilconsumption aBen<strong>in</strong> 339,500 53Burk<strong>in</strong>a Faso 557,833 57Cameroon 242,966 18Mali 488,281 50Mozambique 72,178 6 (potential)Tanzania 235,000 8Ug<strong>and</strong>a 78,410 4Zambia 160,000 20Zimbabwe 246,350 27Source: Calculations based on <strong>in</strong>formation given <strong>in</strong> the country studies.a. Estimated from the quantity <strong>of</strong> seed available for crush<strong>in</strong>g (2001–06 average), aftersubtraction <strong>of</strong> seed reta<strong>in</strong>ed for redistribution to farmers, us<strong>in</strong>g an oil outturn <strong>of</strong> 18 percent<strong>and</strong> an average annual oil consumption <strong>of</strong> 7 kg/person.Domestic Oil <strong>and</strong> Cake MarketsVirtually all cottonseed oil produced <strong>in</strong> the countries studied here is consumeddomestically. Because all countries are net edible oil importers (<strong>in</strong> most casespalm oil), cottonseed oil is an import compet<strong>in</strong>g crop. Table 2.3 estimates theproportion <strong>of</strong> edible oil consumption that can be supplied from cotton seeds<strong>in</strong> each <strong>of</strong> the n<strong>in</strong>e study countries. This consumption ranges from 50 percentor more <strong>in</strong> Ben<strong>in</strong>, Burk<strong>in</strong>a Faso, <strong>and</strong> Mali to less than 10 percent <strong>in</strong> Mozambique,Tanzania, <strong>and</strong> Ug<strong>and</strong>a.<strong>Cotton</strong>seed cake is an oil process<strong>in</strong>g by-product sold as livestock feed. It israrely traded <strong>in</strong>ternationally because <strong>of</strong> its low value-to-weight ratio. Dem<strong>and</strong>for cake, therefore, depends heavily on the size <strong>and</strong> degree <strong>of</strong> commercialization<strong>of</strong> the local livestock (cattle, poultry) <strong>in</strong>dustry.MARKET CONTEXT 27
SECTION TWOHistorical Background <strong>and</strong>Conceptual Approach
CHAPTER THREEHistorical Background <strong>and</strong>Recent InstitutionalEvolution <strong>of</strong> <strong>Africa</strong>n <strong>Cotton</strong><strong>Sectors</strong>Nicolas Gergely <strong>and</strong> Col<strong>in</strong> PoultonThis chapter provides the historical background <strong>and</strong> recent evolution <strong>in</strong>the cotton sectors <strong>of</strong> the study sample. The presentation is structuredaccord<strong>in</strong>g to the two subsets <strong>of</strong> countries—West <strong>and</strong> Central <strong>Africa</strong>(WCA) <strong>and</strong> East <strong>and</strong> Central <strong>Africa</strong> (ESA)—because the countries <strong>in</strong> eachgroup feature a relatively common history, at least <strong>in</strong> prereform models.WEST AND CENTRAL AFRICA<strong>Cotton</strong> was <strong>in</strong>troduced <strong>in</strong> most Francophone countries <strong>of</strong> West <strong>and</strong> Central<strong>Africa</strong> (WCA) <strong>in</strong> the last decades <strong>of</strong> the colonial period, as part <strong>of</strong> a broad policyaim<strong>in</strong>g to supply the French textile <strong>in</strong>dustry with raw material. To that end,the French government created a dedicated parastatal company, CFDT (CompagnieFrançaise pour le Développement des Fibres Textiles). CFDT wasentrusted with develop<strong>in</strong>g cotton cultivation as an <strong>in</strong>tegrated supply cha<strong>in</strong>—from the provision <strong>of</strong> <strong>in</strong>put to farmers to the market<strong>in</strong>g <strong>of</strong> l<strong>in</strong>t—<strong>in</strong> countries<strong>of</strong> Francophone <strong>Africa</strong>. After <strong>in</strong>dependence <strong>in</strong> 1960, CFDT cont<strong>in</strong>ued to operatethrough various country or subregional branches until the mid-1970s,when these branches were turned <strong>in</strong>to national companies with a majority <strong>of</strong>31
shares belong<strong>in</strong>g to governments, <strong>and</strong> a m<strong>in</strong>ority reta<strong>in</strong>ed by CFDT. 30 Most <strong>of</strong>these companies 31 entered <strong>in</strong>to long-term technical assistance contracts withCFDT. These companies were usually granted a legal monopoly on the purchase<strong>and</strong> process<strong>in</strong>g <strong>of</strong> seed cotton <strong>and</strong> on l<strong>in</strong>t market<strong>in</strong>g, <strong>and</strong> were obliged topurchase all seed cotton production at a fixed price set by the government.G<strong>in</strong>n<strong>in</strong>g was based on large units us<strong>in</strong>g saw g<strong>in</strong> equipment.Dur<strong>in</strong>g the 1980s, the national cotton companies exp<strong>and</strong>ed their activitiesconsiderably, <strong>of</strong>ten with the assistance <strong>of</strong> <strong>in</strong>ternationally funded developmentprojects: they <strong>in</strong>creased g<strong>in</strong>n<strong>in</strong>g capacity, further developed <strong>in</strong>put creditschemes, <strong>in</strong>vested <strong>in</strong> transport for seed <strong>and</strong> l<strong>in</strong>t cotton, <strong>and</strong> created their ownextension services to dissem<strong>in</strong>ate technical packages. 32 As <strong>in</strong> the past, thenational cotton companies cont<strong>in</strong>ued to guarantee purchase <strong>of</strong> the crop at afixed, panterritorial price announced before plant<strong>in</strong>g. In some cases (Mali <strong>and</strong>,to some extent, Cameroon), the companies were also given responsibility forrural development activities <strong>in</strong> the cotton areas. <strong>Cotton</strong> production grew rapidlyas a result <strong>of</strong> these <strong>in</strong>vestments, based on an <strong>in</strong>creas<strong>in</strong>g number <strong>of</strong> cotton farmers<strong>and</strong> <strong>in</strong>creased farm yields <strong>and</strong> g<strong>in</strong>n<strong>in</strong>g outturn ratios. L<strong>in</strong>t quality alsoimproved. Yields <strong>in</strong>creased dramatically <strong>in</strong> most countries until the mid-1980s,thanks to <strong>in</strong>tensified use <strong>of</strong> fertilizer (made possible through <strong>in</strong>put credits),development <strong>of</strong> animal traction, <strong>and</strong> development <strong>of</strong> new varieties with higheryield potential, as well as higher g<strong>in</strong>n<strong>in</strong>g outturn ratios. Most varieties were developed<strong>in</strong> cooperation with Institut de Recherches sur le Coton et les Textiles, orIRCT (the French public <strong>Cotton</strong> <strong>and</strong> Textile Research Institute, which latermerged <strong>in</strong>to Centre International de Recherche Agronomique pour le Développementor CIRAD, the French Agricultural Research Centre for International Development).Meanwhile, to cope with <strong>in</strong>creas<strong>in</strong>g seed production, large-scale cottonseed process<strong>in</strong>g units designed to supply domestic markets with quality ref<strong>in</strong>ed oilwere built, <strong>of</strong>ten as part <strong>of</strong> the cotton companies (<strong>in</strong> Cameroon <strong>and</strong> Mali).Strengths <strong>and</strong> Weaknesses <strong>of</strong> the WCA ModelDur<strong>in</strong>g the three decades follow<strong>in</strong>g <strong>in</strong>dependence (1960–90), cotton development<strong>in</strong> WCA was widely regarded as a success story, with impressive <strong>and</strong>steady growth <strong>and</strong> outreach to nearly every farmer <strong>in</strong> cotton zones. However,the rapid growth <strong>of</strong> the cotton companies put <strong>in</strong>creas<strong>in</strong>g stra<strong>in</strong> on their managementcapacities, <strong>and</strong> most <strong>of</strong> them lacked adequate control <strong>and</strong> supervisionsystems. Aware <strong>of</strong> the risks, most WCA governments <strong>in</strong>troduced <strong>in</strong> the1980s a new monitor<strong>in</strong>g <strong>in</strong>strument called performance contracts, to benegotiated between the state, the cotton company, <strong>and</strong>, <strong>in</strong> some cases likeMali <strong>in</strong> the early 1990s, with the cotton farmer organization. The overallobjective <strong>of</strong> the performance contracts was to make cotton companies moreaccountable to governments <strong>and</strong> stakeholders. Specific objectives <strong>in</strong>cludeduntangl<strong>in</strong>g commercial activities from public service activities <strong>and</strong> secur<strong>in</strong>gseparate fund<strong>in</strong>g for these activities, as well as establish<strong>in</strong>g f<strong>in</strong>ancial performance32 GERGELY AND POULTON
targets for the cotton companies, based on st<strong>and</strong>ard costs (barêmes). 33 Theseperformance contracts were implemented <strong>in</strong> Burk<strong>in</strong>a Faso, Cameroon, <strong>and</strong>Mali, from the mid-1980s to the end <strong>of</strong> the 1990s. In practice, the contractsproved difficult to monitor <strong>in</strong> the absence <strong>of</strong> a strong <strong>and</strong> <strong>in</strong>dependentreport<strong>in</strong>g system. <strong>Cotton</strong> companies were reluctant to provide <strong>in</strong>formation,would <strong>of</strong>ten argue that changes <strong>in</strong> the economic environment justified theirperformance, <strong>and</strong> would still turn to the government to cover losses. In theend, the era <strong>of</strong> performance contracts failed to deliver any significant <strong>and</strong>long-last<strong>in</strong>g improvements <strong>in</strong> the governance <strong>of</strong> the cotton sectors.The need for deeper structural reforms began to appear for the first time atthe end <strong>of</strong> the 1980s, when WCA cotton sectors faced f<strong>in</strong>ancial difficulties as aresult <strong>of</strong> the cotton companies’ poor cost efficiency, decl<strong>in</strong><strong>in</strong>g world prices, <strong>and</strong>an overvalued local currency. After the 1994 devaluation <strong>of</strong> the CFA franc,which boosted both production <strong>and</strong> cotton company pr<strong>of</strong>its, the need forreform was perceived as less urgent. World prices also surged from 1994 to1996. The immediate postdevaluation period thus saw rapid productiongrowth <strong>and</strong> high pr<strong>of</strong>its for the cotton companies, but <strong>of</strong>ten lax managementpractices, result<strong>in</strong>g <strong>in</strong> high cost structures. Farm yields had also begun to stagnate.When world prices decl<strong>in</strong>ed at the end <strong>of</strong> the 1990s, cotton companiesaga<strong>in</strong> faced serious f<strong>in</strong>ancial difficulties, which were aggravated when the CFAfranc began to appreciate aga<strong>in</strong>st the U.S. dollar <strong>in</strong> 2001.It can be argued that the WCA cotton sector organizational model, longregarded as successful, became a victim <strong>of</strong> its own success <strong>in</strong> the post devaluationperiod (s<strong>in</strong>ce 1994) as a result <strong>of</strong> the follow<strong>in</strong>g constra<strong>in</strong>ts:■■■■The cont<strong>in</strong>uous development <strong>of</strong> cotton made WCA economies, particularly <strong>in</strong>Sahelian countries, heavily <strong>and</strong> <strong>in</strong>creas<strong>in</strong>gly dependent on the cotton sector. Asa result, cotton farmers <strong>and</strong> other stakeholders <strong>in</strong> the cotton sector exercisedconsiderable political <strong>and</strong> socioeconomic <strong>in</strong>fluence <strong>in</strong> rural areas, <strong>and</strong> management<strong>of</strong> the cotton companies became subject to <strong>in</strong>creas<strong>in</strong>g political <strong>in</strong>terference.At the same time, the companies themselves ga<strong>in</strong>ed economic weight<strong>and</strong> political <strong>in</strong>fluence, which made them even more difficult to control.Decisions by governments <strong>and</strong> by cotton companies became <strong>in</strong>dist<strong>in</strong>guishable,<strong>and</strong> were <strong>of</strong>ten driven by short-term political considerations ratherthan by the need to ensure long-term sector susta<strong>in</strong>ability.Because <strong>of</strong> the considerable <strong>in</strong>come accumulated dur<strong>in</strong>g the postdevaluationperiod, politicians were <strong>in</strong>creas<strong>in</strong>gly tempted to exert pressure toextract resources from cotton companies, either to f<strong>in</strong>ance public expendituresor for private ga<strong>in</strong>.F<strong>in</strong>ally, cotton companies failed to <strong>in</strong>troduce the sophisticated managementtools required for such large-scale <strong>and</strong> complex enterprises (SOFITEX<strong>in</strong> Burk<strong>in</strong>a Faso <strong>and</strong> Compagnie Malienne de Développement des FibresTextiles, or CMDT, <strong>in</strong> Mali are the largest cotton companies <strong>in</strong> <strong>Africa</strong>), thuslead<strong>in</strong>g to grow<strong>in</strong>g <strong>in</strong>efficiencies <strong>and</strong> lax management control.HISTORICAL BACKGROUND AND RECENT INSTITUTIONAL EVOLUTION 33
Changes Made S<strong>in</strong>ce the End <strong>of</strong> the 1990sBy the end <strong>of</strong> the 1990s, the repetition <strong>of</strong> f<strong>in</strong>ancial crisis among cotton companiescreated a strong feel<strong>in</strong>g <strong>in</strong> many stakeholders that the sectors neededreform. However, <strong>in</strong> most <strong>of</strong> the region, there was also a clear consensus thatthe s<strong>in</strong>gle-channel relationship between producers <strong>and</strong> the cotton companieswas necessary to ensure a susta<strong>in</strong>able <strong>in</strong>put credit system <strong>and</strong> to guarantee<strong>in</strong>tensive cropp<strong>in</strong>g practices <strong>and</strong> should, therefore, be ma<strong>in</strong>ta<strong>in</strong>ed, at least at aregional level. 34 This position considerably reduced the options for liberalization<strong>and</strong> reform. Therefore, unlike <strong>in</strong> ESA countries, little structural changewas effected <strong>in</strong> the cotton sectors <strong>of</strong> the reviewed WCA countries, except <strong>in</strong>Ben<strong>in</strong>. At the same time, <strong>in</strong>cremental change was brought to the exist<strong>in</strong>gs<strong>in</strong>gle-channel model. These changes perta<strong>in</strong>ed ma<strong>in</strong>ly to (a) the development<strong>of</strong> farmer associations <strong>and</strong> their progressive <strong>in</strong>volvement <strong>in</strong> the delivery <strong>of</strong> criticalservices <strong>and</strong> functions, (b) the entry <strong>of</strong> private actors <strong>in</strong> g<strong>in</strong>n<strong>in</strong>g or <strong>in</strong>putsupply activities (Ben<strong>in</strong>, Burk<strong>in</strong>a Faso), (c) the tentative <strong>and</strong> <strong>of</strong>ten partial withdrawal(<strong>in</strong> a limited number <strong>of</strong> countries) <strong>of</strong> the government from the management<strong>of</strong> the cotton sector <strong>and</strong> the parallel empowerment <strong>of</strong> cotton sector“<strong>in</strong>terpr<strong>of</strong>essional committees” (IPCs), <strong>and</strong> (d) the <strong>in</strong>troduction <strong>of</strong> producerprice-sett<strong>in</strong>g mechanisms that attempted to ensure a better l<strong>in</strong>k to worldprices. The extent <strong>of</strong> change to the orig<strong>in</strong>al system varies substantially fromone country to another <strong>in</strong> the selected sample, <strong>and</strong> <strong>in</strong> WCA <strong>in</strong> general.Empowerment <strong>of</strong> Farmer AssociationsThe first attempts to build farmer organizations began <strong>in</strong> the mid-1970s <strong>in</strong>Burk<strong>in</strong>a Faso <strong>and</strong> Mali, followed by Cameroon <strong>and</strong> Ben<strong>in</strong>. These associationswere orig<strong>in</strong>ally viewed by cotton companies as a means to cut their costs bytransferr<strong>in</strong>g some functions to farmers (<strong>in</strong> particular, primary collection <strong>of</strong>seed cotton <strong>and</strong> distribution <strong>of</strong> <strong>in</strong>put <strong>and</strong> seeds), <strong>and</strong> as a way to secure repayment<strong>of</strong> <strong>in</strong>put credit through mutual guarantee.The first generation <strong>of</strong> associations lacked <strong>in</strong>ternal cohesion <strong>and</strong> their performancewas generally disappo<strong>in</strong>t<strong>in</strong>g. They were replaced <strong>in</strong> the 1990s bysmaller associations that were legally recognized <strong>and</strong> exclusively <strong>in</strong>volved <strong>in</strong>cotton. In parallel, regional <strong>and</strong> national unions <strong>of</strong> associations were built upwith the support <strong>of</strong> the donor community: FUPRO (Fédération des Unions deProducteurs du Bén<strong>in</strong>) was created <strong>in</strong> Ben<strong>in</strong> <strong>in</strong> 1993, UNPCB (UnionNationale des Producteurs de Coton du Burk<strong>in</strong>a) <strong>in</strong> Burk<strong>in</strong>a Faso <strong>in</strong> 1998, <strong>and</strong>OPCC (Organisation des Producteurs de Coton du Cameroun) <strong>in</strong> Cameroon<strong>in</strong> 2000, while the process is still under way <strong>in</strong> Mali. To <strong>in</strong>crease their <strong>in</strong>volvement<strong>in</strong> the management <strong>of</strong> the sector, the national farmer association hasbeen given a 20 percent share <strong>in</strong> the capital <strong>of</strong> the three privatized cotton companies<strong>in</strong> Burk<strong>in</strong>a Faso, <strong>and</strong> the same move is be<strong>in</strong>g considered <strong>in</strong> Mali <strong>and</strong>Cameroon with<strong>in</strong> the privatization process. In Mali, Ben<strong>in</strong>, <strong>and</strong> Cameroon,responsibility for <strong>in</strong>put supply (through competitive bids) is be<strong>in</strong>g transferred34 GERGELY AND POULTON
to farmer associations <strong>and</strong> their unions. In Ben<strong>in</strong>, Cameroon, <strong>and</strong> Burk<strong>in</strong>aFaso, responsibility for extension services, particularly <strong>in</strong> the field <strong>of</strong> farmmanagement, is currently be<strong>in</strong>g taken over by farmer unions. Ultimately, it ishoped that these more focused associations will develop the technical capacity<strong>and</strong> cohesiveness to become equal partners with the cotton companies <strong>in</strong> a balancedcomanagement <strong>of</strong> the cotton sector. If a partnership happens, the governmentcould more effectively reduce its direct <strong>in</strong>volvement.Entry <strong>of</strong> Private Actors <strong>in</strong> G<strong>in</strong>n<strong>in</strong>g ActivitiesPrivatization <strong>of</strong> the cotton companies has been, <strong>in</strong> all countries, stronglyadvocated by a number <strong>of</strong> development partners, with the objectives <strong>of</strong>(a) provid<strong>in</strong>g cotton companies with clear managerial leadership, (b) improv<strong>in</strong>gmanagement practices <strong>and</strong> cost efficiency, (c) reduc<strong>in</strong>g the risks <strong>of</strong> political <strong>in</strong>terference,<strong>and</strong> (d) creat<strong>in</strong>g smaller <strong>and</strong> more manageable enterprises. However, the<strong>in</strong>volvement <strong>of</strong> the private sector has so far rema<strong>in</strong>ed limited. The privatizationprocess has been long <strong>and</strong> difficult. It has had to overcome the reluctance<strong>of</strong> the established cotton companies, <strong>and</strong> to be accompanied by thedesign, <strong>in</strong> the absence <strong>of</strong> a clear reference model, <strong>of</strong> mechanisms to ensurethat delivery <strong>of</strong> critical services <strong>and</strong> functions to farmers would be preserved.In the sample <strong>of</strong> reviewed countries, only Ben<strong>in</strong> (<strong>in</strong> 1995) <strong>and</strong> Burk<strong>in</strong>a Faso(<strong>in</strong> 2004) have so far permitted private <strong>in</strong>vestors control <strong>of</strong> cotton companies,without, however, allow<strong>in</strong>g them to compete for the supply <strong>of</strong> seed cotton. Eachcotton company has its exclusive zone <strong>in</strong> Burk<strong>in</strong>a Faso; seed cotton is allocatedadm<strong>in</strong>istratively to cotton companies, at a fixed price, <strong>in</strong> Ben<strong>in</strong>. 35 In Mali, privatization<strong>of</strong> CMDT was orig<strong>in</strong>ally scheduled to take place <strong>in</strong> 2004, but it waspostponed to 2008. In Burk<strong>in</strong>a Faso, the scope <strong>of</strong> the privatization process waslimited by the fact that the two private cotton companies represented less than15 percent <strong>of</strong> the country’s total cotton production <strong>and</strong> SOFITEX (<strong>in</strong> which thegovernment reta<strong>in</strong>s a 35 percent share) rema<strong>in</strong>s by far the largest g<strong>in</strong>ner. InBen<strong>in</strong>, the ma<strong>in</strong> g<strong>in</strong>ner, SONAPRA, is still a parastatal company <strong>and</strong> accounts forabout 50 percent <strong>of</strong> seed cotton g<strong>in</strong>ned <strong>in</strong> the country.The expected benefits <strong>of</strong> privatization have not yet materialized, <strong>in</strong> largepart because <strong>of</strong> the complicated f<strong>in</strong>ancial situation <strong>of</strong> the sectors. In Burk<strong>in</strong>aFaso, privatization had the potential to br<strong>in</strong>g new <strong>in</strong>vestments <strong>and</strong> new partnershipswith <strong>in</strong>ternational traders, but the f<strong>in</strong>ancial crisis that the cotton sectorhas experienced s<strong>in</strong>ce 2005 is threaten<strong>in</strong>g progress. The impact <strong>of</strong> privatesector entry on cost efficiency has been limited so far, probably as a result <strong>of</strong>the absence <strong>of</strong> real competition. Privatization efforts have also not clearlyreduced political <strong>in</strong>terference, as illustrated by the failure to reduce producerprices until 2006, <strong>in</strong> response to fall<strong>in</strong>g world prices. In Ben<strong>in</strong>, the outcome <strong>of</strong>reform clearly fell short <strong>of</strong> expectations <strong>and</strong> resulted <strong>in</strong> a sharp decl<strong>in</strong>e <strong>of</strong> thesector’s performance for a number <strong>of</strong> reasons: (a) new g<strong>in</strong>ners were local <strong>and</strong><strong>of</strong>ten <strong>in</strong>experienced bus<strong>in</strong>essmen attracted by short-term returns but withoutHISTORICAL BACKGROUND AND RECENT INSTITUTIONAL EVOLUTION 35
long-term development strategies, (b) the coord<strong>in</strong>ation mechanisms were notreally enforced, <strong>and</strong> (c) the government played an ambiguous role with respectto vested <strong>in</strong>terests.The next country to privatize will be Mali, where the governmentannounced <strong>in</strong> May 2008 that CMDT would be sold to four private companies,each with a regional monopoly. In Cameroon, the privatization <strong>of</strong> thecotton company SODECOTON is on the agenda, but no timetable has beenagreed on because <strong>of</strong> the mixed attitude <strong>of</strong> some stakeholders, who fear thatit might endanger the positive role that cotton has played <strong>in</strong> rural development<strong>and</strong> social stability <strong>in</strong> the northern region <strong>of</strong> the country. Other privatizationsare also planned for the short term, <strong>in</strong> Ben<strong>in</strong> (SONAPRA) <strong>and</strong> Chad(COTONTCHAD). These new privatizations should build on the experience<strong>of</strong> Burk<strong>in</strong>a Faso. However, the likelihood <strong>of</strong> attract<strong>in</strong>g strong <strong>and</strong> pr<strong>of</strong>essional<strong>in</strong>vestors, given prevail<strong>in</strong>g market conditions <strong>and</strong> f<strong>in</strong>ancial difficulties,is a concern.Evolution <strong>of</strong> Government’s Role <strong>and</strong> Empowerment <strong>of</strong> IPCsThe creation <strong>of</strong> Interpr<strong>of</strong>essional committees (IPCs) to take over monitor<strong>in</strong>g<strong>and</strong> coord<strong>in</strong>ation responsibility <strong>in</strong> the cotton supply cha<strong>in</strong> has been viewed asa way to remedy the deficiencies <strong>of</strong> the traditional state-controlled model <strong>and</strong>as a way <strong>of</strong> complement<strong>in</strong>g the strengthen<strong>in</strong>g <strong>of</strong> farmer unions. Progress <strong>in</strong>operationaliz<strong>in</strong>g IPCs has been mixed:■■■■Ben<strong>in</strong> created the first IPC <strong>in</strong> 1999. The body was given a legal m<strong>and</strong>ate buthas been struggl<strong>in</strong>g to exercise its power s<strong>in</strong>ce it was created, because f<strong>in</strong>aldecision mak<strong>in</strong>g rema<strong>in</strong>s with the government.Burk<strong>in</strong>a Faso created its IPC <strong>in</strong> 2006 <strong>and</strong> empowered it to regulate relationshipsbetween stakeholders <strong>in</strong> the sector, especially for the fund<strong>in</strong>g<strong>and</strong> provision <strong>of</strong> critical functions (extension, research, <strong>and</strong> road ma<strong>in</strong>tenance)<strong>and</strong> decisions on producer prices. These responsibilities were previouslyexercised by the government. The capacity <strong>of</strong> the Burk<strong>in</strong>a FasoIPC to effectively manage the sector rema<strong>in</strong>s weak, as revealed by therecent f<strong>in</strong>ancial crisis, by the marg<strong>in</strong>al role <strong>of</strong> the two private cotton companies<strong>in</strong> decision-mak<strong>in</strong>g processes, by the residual <strong>in</strong>fluential power <strong>of</strong>the government (<strong>in</strong> particular, through SOFITEX <strong>and</strong> local parastatalbanks), <strong>and</strong> by the absence <strong>of</strong> regional coord<strong>in</strong>ation bodies <strong>in</strong> each <strong>of</strong> theconcession zones.An IPC is scheduled to be created <strong>in</strong> Mali <strong>in</strong> 2008 (after the privatization <strong>of</strong>CMDT).In Cameroon there is only one cotton company <strong>and</strong> one farmer organization.The creation <strong>of</strong> an IPC has not, up to now, been deemed necessary to achievecomanagement <strong>of</strong> the supply cha<strong>in</strong>, but the two stakeholders have reached ahigh degree <strong>of</strong> cooperation <strong>in</strong> the decision-mak<strong>in</strong>g process on all sector issues.36 GERGELY AND POULTON
Evolution <strong>of</strong> Producer Pric<strong>in</strong>g MechanismsOne major drawback <strong>of</strong> the monopoly system for g<strong>in</strong>n<strong>in</strong>g companies is that itrequires fixed producer prices. When producer prices are fixed before plant<strong>in</strong>g,g<strong>in</strong>n<strong>in</strong>g companies take on great risk. The extent <strong>of</strong> this risk was fully revealed<strong>in</strong> the 2003/04 season, dur<strong>in</strong>g which world prices dropped nearly 30 percent,creat<strong>in</strong>g trad<strong>in</strong>g losses for the g<strong>in</strong>n<strong>in</strong>g companies. All WCA countries have hadto face this issue <strong>in</strong> recent years.With the build<strong>in</strong>g up <strong>of</strong> producer organizations, all WCA countries <strong>in</strong> thestudy shifted from prices adm<strong>in</strong>istered by the government to prices set jo<strong>in</strong>tlyby the cotton companies <strong>and</strong> producer organizations. In all <strong>of</strong> these countries,the price mechanism was, at least until the 2004 crisis, l<strong>in</strong>ked to a stabilizationfund designed to support producer prices when the world market was low, <strong>and</strong>to be replenished when the world market was high (by pay<strong>in</strong>g farmers lowerprices than could otherwise be paid). The rationale for these funds was to avoiddramatic drops <strong>in</strong> producer prices <strong>and</strong> to limit market risks for cotton companies.These support funds functioned well <strong>in</strong> Burk<strong>in</strong>a Faso <strong>and</strong> Cameroon until2004. S<strong>in</strong>ce then, however, they have fallen victim to the unsusta<strong>in</strong>ably highprices agreed to among cotton companies <strong>and</strong> producer unions. In Cameroon,the fund was exhausted by 2006, though it was sufficient to cover sector losses<strong>and</strong> so did not draw on the government budget. In Burk<strong>in</strong>a Faso, the fund hasbeen depleted <strong>and</strong> could not cover the deficits dur<strong>in</strong>g the 2005 <strong>and</strong> 2006 seasons.In Mali <strong>and</strong> <strong>in</strong> Ben<strong>in</strong>, the funds were exhausted before 2004 <strong>and</strong>, therefore,could not be used when world market prices started to fall. The losses <strong>in</strong> thecotton sectors <strong>of</strong> those countries were covered by direct government subsidies.To remedy this situation, the Burk<strong>in</strong>a Faso IPC adopted <strong>in</strong> 2006 a newprice-sett<strong>in</strong>g mechanism, based on a formula l<strong>in</strong>ked to world market trends.This system represents a move <strong>in</strong> the right direction but was not correctlyapplied for the 2006/07 season, result<strong>in</strong>g <strong>in</strong> additional losses for the cottoncompanies. In Mali, a new system was adopted for the period 2005 to 2008based on a conservative <strong>in</strong>itial producer price 36 <strong>and</strong> on shar<strong>in</strong>g <strong>of</strong> the actualsell<strong>in</strong>g price, at the end <strong>of</strong> the season, between producers <strong>and</strong> the cotton company.This system reduced the losses <strong>of</strong> the cotton company, yet it was unableto completely elim<strong>in</strong>ate the losses dur<strong>in</strong>g the 2007 season.Establish<strong>in</strong>g price mechanisms that are acceptable to farmers <strong>and</strong> susta<strong>in</strong>ablefor cotton companies (while provid<strong>in</strong>g <strong>in</strong>centives for them to be morecost efficient) appears, therefore, to be one <strong>of</strong> the major challenges for WCAcotton sectors <strong>in</strong> the near future. This challenge is especially important ifother features <strong>of</strong> the model (announcement <strong>of</strong> the producer price before theplant<strong>in</strong>g season, panterritorial pric<strong>in</strong>g, obligation to purchase all seed cotton<strong>of</strong>fered) are not reconsidered (that is, as long as no additional steps are made<strong>in</strong> liberaliz<strong>in</strong>g the sector).WCA cotton sectors are currently engaged <strong>in</strong> discussions, with the assistance<strong>of</strong> donors (<strong>in</strong> particular, Agence Française de Développement), on aHISTORICAL BACKGROUND AND RECENT INSTITUTIONAL EVOLUTION 37
possible l<strong>in</strong>k between price-sett<strong>in</strong>g mechanisms <strong>in</strong>spired by the new Burk<strong>in</strong>abesystem (that is, based on world market trends), <strong>and</strong> a national “smooth<strong>in</strong>gfund” backed by a regional ref<strong>in</strong>anc<strong>in</strong>g facility (at the level <strong>of</strong> the EconomicCommunity <strong>of</strong> West <strong>Africa</strong>n States). This fund would guarantee the payment<strong>of</strong> the producer price but, unlike the former stabilization funds, would be operated<strong>and</strong> managed by a bank (under monitor<strong>in</strong>g by the IPC) accord<strong>in</strong>g to predef<strong>in</strong>edrules. The expectation is that this approach will avoid manipulation <strong>of</strong>the rules or misuse <strong>of</strong> the fund.SummaryThough limited structural change has taken place <strong>in</strong> WCA, <strong>in</strong>cremental <strong>in</strong>stitutional<strong>and</strong> organizational changes have been significant. The strengthen<strong>in</strong>g <strong>of</strong>farmer organizations has paved the way for active <strong>in</strong>volvement <strong>in</strong> critical activities,such as <strong>in</strong>put supply <strong>and</strong> extension, <strong>in</strong> which they have a potential comparativeadvantage, <strong>and</strong> has also created the possibility <strong>of</strong> active comanagement<strong>of</strong> the cotton sectors by farmers <strong>and</strong> g<strong>in</strong>ners through the IPCs. The reform <strong>of</strong>pric<strong>in</strong>g systems has been difficult but it was necessary to make producer pricesmore connected to world market prices. The <strong>in</strong>troduction <strong>of</strong> private cottoncompanies <strong>in</strong> Burk<strong>in</strong>a Faso has shown the ability <strong>of</strong> national s<strong>in</strong>gle-channel systemsto shift toward local concession systems without disrupt<strong>in</strong>g <strong>in</strong>put creditsupply, though the potential advantages <strong>of</strong> such a change have not yet materializedbecause <strong>of</strong> other constra<strong>in</strong>ts.EAST AND SOUTHERN AFRICAIn East <strong>and</strong> Southern <strong>Africa</strong> (ESA), there is perhaps greater heterogeneity <strong>in</strong>the historical experience <strong>of</strong> cotton sector development compared with WCA,but there are important common threads across countries over time. Oneimportant contrast with WCA is the role assumed by the cotton sector <strong>in</strong>broader rural development. In WCA, colonial governments <strong>and</strong> then <strong>in</strong>dependentstates made cotton an eng<strong>in</strong>e <strong>of</strong> development <strong>and</strong> organized the filière(supply cha<strong>in</strong>) to serve that objective. By contrast, cotton cultivation <strong>in</strong> ESAtypically had its orig<strong>in</strong>s <strong>in</strong> commercial or missionary activity, with the governmentassum<strong>in</strong>g a greater role over time. Mozambique is the one exception togovernment control <strong>in</strong> ESA. In Mozambique, the Portuguese colonial regimetreated cotton as a strategic commodity, but the <strong>in</strong>dependent government wasunable to ma<strong>in</strong>ta<strong>in</strong> that commitment <strong>in</strong> the face <strong>of</strong> war <strong>and</strong> economic collapse.The cotton sectors <strong>in</strong> Ug<strong>and</strong>a <strong>and</strong> Tanzania have always been based onsmallholder production, spurred by the colonial requirement that smallholderhouseholds pay taxes. In the early 20th century, Asian bus<strong>in</strong>essmen dom<strong>in</strong>atedseed cotton purchase <strong>and</strong> g<strong>in</strong>n<strong>in</strong>g, while governments assumed responsibilityfor research <strong>and</strong> extension, seed multiplication, quality control, <strong>and</strong> l<strong>in</strong>texport. Ug<strong>and</strong>a was <strong>Africa</strong>’s largest l<strong>in</strong>t exporter until the beg<strong>in</strong>n<strong>in</strong>g <strong>of</strong> the38 GERGELY AND POULTON
1970s. Until the mid-1950s, the Ug<strong>and</strong>a L<strong>in</strong>t Market<strong>in</strong>g Board was alsoresponsible for the export <strong>of</strong> Tanganyikan l<strong>in</strong>t.The cotton sector <strong>in</strong> Mozambique was also based on smallholder productionfor most <strong>of</strong> its history, with the exception <strong>of</strong> 1965–75, when grow<strong>in</strong>gopposition to the colonial government <strong>in</strong> the north (the cotton grow<strong>in</strong>g heartl<strong>and</strong>)prompted the government to promote production on large Europeancontrolledfarms. By contrast, large-scale farmers <strong>of</strong> European orig<strong>in</strong> droveearly sector development <strong>in</strong> Zimbabwe. At least until 1980, the large-scale farmershad the political power to advocate for the establishment <strong>and</strong> ma<strong>in</strong>tenance<strong>of</strong> research <strong>and</strong> market<strong>in</strong>g systems to support their production activities.ESA <strong>Cotton</strong> <strong>Sectors</strong> <strong>in</strong> the Post-Independence YearsFrom 1960 to 1990, two ma<strong>in</strong> changes occurred <strong>in</strong> ESA cotton sectors. First,countries achiev<strong>in</strong>g <strong>in</strong>dependence transferred control over the sector, with thegovernment (or government-controlled organizations) play<strong>in</strong>g an <strong>in</strong>creas<strong>in</strong>grole <strong>in</strong> seed cotton purchase <strong>and</strong> g<strong>in</strong>n<strong>in</strong>g at the expense <strong>of</strong> the private sector.The purported reason for these changes was typically to support smallholdercotton farmers. At the same time, performance decl<strong>in</strong>ed seriously <strong>in</strong> all countriesexcept Zimbabwe.In both Ug<strong>and</strong>a <strong>and</strong> Tanzania, regional cooperative unions replaced Asianbus<strong>in</strong>essmen as buyers <strong>and</strong> g<strong>in</strong>ners <strong>of</strong> seed cotton. The cooperative movementstarted as a member-driven phenomenon, but politicians soon exerted governmentcontrol. In Ug<strong>and</strong>a, cooperatives were given monopoly rights over seedcotton purchase <strong>and</strong> g<strong>in</strong>n<strong>in</strong>g <strong>in</strong> 1969, with the L<strong>in</strong>t Market<strong>in</strong>g Board h<strong>and</strong>l<strong>in</strong>gthe market<strong>in</strong>g <strong>of</strong> l<strong>in</strong>t <strong>and</strong> seed <strong>and</strong> regulat<strong>in</strong>g the cooperatives. In Tanzania,cooperatives displaced Asian bus<strong>in</strong>essmen dur<strong>in</strong>g the 1960s, <strong>in</strong>itially withfarmer support, then through force <strong>of</strong> law. At the same time, the governmentattempted to control the powerful Victoria Federation <strong>of</strong> Cooperative Unions(seen as an alternative center <strong>of</strong> power to the rul<strong>in</strong>g party) by replac<strong>in</strong>g it withthe Nyanza Cooperative Union. State-imposed cooperatives performed poorly<strong>in</strong> a number <strong>of</strong> the country’s ma<strong>in</strong> cash crops, thus cooperative unions wereabolished <strong>in</strong> 1976 <strong>and</strong> a parastatal Tanzania <strong>Cotton</strong> Authority assumed responsibilityfor crop purchases from village-based cooperative societies.<strong>Cotton</strong> production experienced a precipitate collapse <strong>in</strong> both Ug<strong>and</strong>a <strong>and</strong>Mozambique <strong>in</strong> the mid-1970s. With the seizure <strong>of</strong> power by Idi Am<strong>in</strong>, l<strong>in</strong>tproduction <strong>in</strong> Ug<strong>and</strong>a plummeted from 78,000 tons <strong>in</strong> 1972 to just 14,000 tons<strong>in</strong> 1976, underm<strong>in</strong>ed by poor policies, escalat<strong>in</strong>g costs <strong>and</strong> mismanagement atthe cooperatives <strong>and</strong> the L<strong>in</strong>t Market<strong>in</strong>g Board. Similarly, with <strong>in</strong>dependence<strong>in</strong> Mozambique <strong>in</strong> 1975, seed cotton production fell from a peak <strong>of</strong> over140,000 tons <strong>in</strong> 1973 to below 40,000 tons <strong>in</strong> 1976. Production by commercialfarmers collapsed to around 20 percent <strong>of</strong> its immediate pre-<strong>in</strong>dependencepeak, <strong>and</strong> smallholder production decl<strong>in</strong>ed sharply, discouraged by disastrouscentral plann<strong>in</strong>g policies. With the outbreak <strong>of</strong> civil war <strong>in</strong> both countries,HISTORICAL BACKGROUND AND RECENT INSTITUTIONAL EVOLUTION 39
production fell further, to lows <strong>of</strong> 5,200 tons <strong>of</strong> seed cotton <strong>in</strong> Mozambique <strong>in</strong>1985 <strong>and</strong> 2,000 tons <strong>of</strong> l<strong>in</strong>t <strong>in</strong> Ug<strong>and</strong>a <strong>in</strong> 1987.In both Tanzania <strong>and</strong> Zambia, government mismanagement <strong>of</strong> the cottonsector led to mount<strong>in</strong>g debt <strong>and</strong> eventually to delayed payments to farmers.However, the impact on production was nowhere near as disastrous as <strong>in</strong>Ug<strong>and</strong>a or Mozambique. In Zambia, sector development was the responsibility<strong>of</strong> the parastatal L<strong>in</strong>tco from 1977 onward. Annual production rose fromaround 3,000 tons dur<strong>in</strong>g 1974–76 to a peak <strong>of</strong> over 60,000 tons <strong>in</strong> 1988, thentrended down to 30,000 tons by 1994. L<strong>in</strong>tco debts also <strong>in</strong>creased to the po<strong>in</strong>twhere the government decided to privatize it.Cooperative unions were re<strong>in</strong>stated <strong>in</strong> Tanzania <strong>in</strong> 1984 as part <strong>of</strong> an economywidereform. <strong>Cotton</strong> production, which had decl<strong>in</strong>ed steadily under Tanzania<strong>Cotton</strong> Authority management, began to recover, <strong>and</strong> reached record levels <strong>in</strong>1991 <strong>and</strong> 1992. Production dur<strong>in</strong>g the latter year was over 300,000 tons <strong>of</strong> seedcotton, a level that would not be reached aga<strong>in</strong> until 2004. The cooperative systemdelivered some credit to farmers <strong>and</strong>, until at least the late 1980s, Tanzaniama<strong>in</strong>ta<strong>in</strong>ed a reputation for good quality l<strong>in</strong>t. However, the <strong>in</strong>efficient restoredcooperative unions required <strong>in</strong>creas<strong>in</strong>g f<strong>in</strong>ancial assistance from the centralgovernment (mostly as guaranteed loans from government banks, despite nonrepayment<strong>of</strong> previous loans because <strong>of</strong> trad<strong>in</strong>g losses). As mismanagement<strong>and</strong> shortages <strong>of</strong> funds caused cooperative unions to take quality less seriously,Tanzania’s reputation for l<strong>in</strong>t quality began to decl<strong>in</strong>e (before the impacts <strong>of</strong>liberalization).The good performance <strong>of</strong> Zimbabwe’s cotton sector dur<strong>in</strong>g this periodst<strong>and</strong>s <strong>in</strong> contrast to that <strong>of</strong> the other ESA countries <strong>in</strong> the study. Productionexpansion dur<strong>in</strong>g the 1960s was founded on two research breakthroughs: the<strong>in</strong>troduction <strong>of</strong> the high-yield<strong>in</strong>g Albar 637 seed variety <strong>in</strong> 1959–60 <strong>and</strong> effectivechemical control <strong>of</strong> red bollworm. Production levels were ma<strong>in</strong>ta<strong>in</strong>ed dur<strong>in</strong>gthe 1970s despite the escalat<strong>in</strong>g liberation war. Half <strong>of</strong> the govern<strong>in</strong>g board <strong>of</strong>the Agricultural Market<strong>in</strong>g Authority (AMA)—set up <strong>in</strong> 1967 to coord<strong>in</strong>ate theactivities <strong>of</strong> the <strong>Cotton</strong> Market<strong>in</strong>g Board (CMB) <strong>and</strong> other major parastatals—was made up <strong>of</strong> representatives from the Rhodesian National Farmers’ Union.In 1976, the AMA began to announce generous guaranteed m<strong>in</strong>imum cottonprices before plant<strong>in</strong>g.Follow<strong>in</strong>g <strong>in</strong>dependence <strong>in</strong> 1980, activities <strong>of</strong> the CMB were reoriented towardmeet<strong>in</strong>g the needs <strong>of</strong> new, smallholder cotton producers <strong>in</strong> so-called communalareas. The number <strong>of</strong> buy<strong>in</strong>g posts <strong>in</strong> such areas was greatly <strong>in</strong>creased <strong>and</strong> effortswere made to provide smallholder farmers with extension advice, while new seedvarieties suited to production conditions <strong>in</strong> communal areas were developed. Inaddition, expansion <strong>of</strong> smallholder cotton production was supported by loansfrom the parastatal Agricultural F<strong>in</strong>ance Corporation. Nevertheless, commercialfarmers still accounted for 60 percent <strong>of</strong> national production <strong>in</strong> 1988.Commercial farmers <strong>in</strong> Zimbabwe began to exit cotton for more pr<strong>of</strong>itablealternatives <strong>in</strong> the late 1980s <strong>and</strong> early 1990s. The CMB responded <strong>in</strong> 199240 GERGELY AND POULTON
with the <strong>in</strong>troduction <strong>of</strong> a credit scheme designed to assist smallholder farmers<strong>in</strong> exp<strong>and</strong><strong>in</strong>g their cotton production. By the time <strong>of</strong> sector liberalization<strong>in</strong> 1994, smallholders accounted for 60 percent <strong>of</strong> production; their share hadrisen to almost 90 percent by the onset <strong>of</strong> the fast-track l<strong>and</strong> redistributionprogram <strong>in</strong> 2001.<strong>Cotton</strong> Sector Reform <strong>and</strong> Evolution <strong>in</strong> ESAMozambique was the first <strong>of</strong> the countries <strong>in</strong> this study to embark on thoroughreform <strong>of</strong> the cotton sector. In 1986, the first <strong>of</strong> four jo<strong>in</strong>t venture companies,a collaboration between the government <strong>of</strong> Mozambique <strong>and</strong> Lonrho, wasestablished <strong>and</strong> given exclusive rights to run a cotton concession area <strong>in</strong> CaboDelgado prov<strong>in</strong>ce. Because the country was still fight<strong>in</strong>g a civil war, develop<strong>in</strong>gcotton production entailed high costs (<strong>in</strong>clud<strong>in</strong>g some <strong>in</strong>frastructure <strong>in</strong>vestment<strong>and</strong> hir<strong>in</strong>g private militia to protect company assets), so local monopolyrights over cotton purchase were considered necessary to give some assurance<strong>of</strong> a return to <strong>in</strong>vestment. However, the sector cont<strong>in</strong>ued to be based on suchlocal monopolies, <strong>and</strong> some have argued that the open-ended nature <strong>of</strong> theconcession rights is at the root <strong>of</strong> subsequent disappo<strong>in</strong>t<strong>in</strong>g performance.The first concessions were granted to fully private companies <strong>in</strong> Mozambique<strong>in</strong> the 1990s; by 2002 there were at least 12 companies promot<strong>in</strong>g cotton, allwith<strong>in</strong> the concession system. However, there were two periods—<strong>in</strong> the mid-1990s <strong>and</strong> around 2000—when new entrants began buy<strong>in</strong>g <strong>in</strong> concession areas,effectively challeng<strong>in</strong>g the concession system. On the one h<strong>and</strong>, this changereflected dissatisfaction with the performance <strong>of</strong> some <strong>of</strong> the exist<strong>in</strong>g concessioncompanies. On the other h<strong>and</strong>, it re<strong>in</strong>forced any reluctance that thesecompanies had to <strong>in</strong>vest <strong>in</strong> better service delivery, because they could not besure <strong>of</strong> captur<strong>in</strong>g the returns. Both issues were eventually resolved by grant<strong>in</strong>gnew concessions to the more powerful new entrants. In addition, the entrance<strong>of</strong> several <strong>in</strong>ternational companies has raised hopes that sector performancewill beg<strong>in</strong> to improve. Notions <strong>of</strong> liberaliz<strong>in</strong>g the market receded, replaced <strong>in</strong>2007 with proposals (not yet implemented as <strong>of</strong> mid-2008) to more rigorouslymonitor the performance <strong>of</strong> concession companies <strong>and</strong> to re-award concessions,perhaps on a five-year cycle.The other four ESA countries <strong>in</strong> the study (Tanzania, Ug<strong>and</strong>a, Zambia, <strong>and</strong>Zimbabwe) all liberalized their cotton sectors dur<strong>in</strong>g 1994/95, when worldprices were near an all-time high.The <strong>in</strong>itial structure <strong>of</strong> the liberalized sectors mirrored their preliberalizationorganization. In Tanzania <strong>and</strong> Ug<strong>and</strong>a, where g<strong>in</strong>n<strong>in</strong>g was historically dom<strong>in</strong>atedby roller g<strong>in</strong>s (cheaper <strong>and</strong> with few economies <strong>of</strong> scale) <strong>in</strong> the h<strong>and</strong>s <strong>of</strong>decentralized cooperatives, a large number <strong>of</strong> private buyers <strong>and</strong> g<strong>in</strong>nersentered the sector. Both countries quickly grew to more than 30 seed cottonbuyers. In Zambia <strong>and</strong> Zimbabwe, where g<strong>in</strong>n<strong>in</strong>g was historically dom<strong>in</strong>ated bysaw g<strong>in</strong>s (larger <strong>and</strong> more expensive), <strong>and</strong> where a s<strong>in</strong>gle parastatal controlledHISTORICAL BACKGROUND AND RECENT INSTITUTIONAL EVOLUTION 41
all aspects <strong>of</strong> the cha<strong>in</strong> from <strong>in</strong>put supply to l<strong>in</strong>t market<strong>in</strong>g before liberalization,the orderly privatization <strong>of</strong> the parastatals led to effective duopolies. In1995/96, the <strong>Cotton</strong> Company <strong>of</strong> Zimbabwe Ltd. (COTTCO), the privatized successorto <strong>Cotton</strong> Monitor<strong>in</strong>g Board (CMB), was jo<strong>in</strong>ed <strong>in</strong> the market by Cargill.Cargill established a 25 percent market share <strong>in</strong> its first two years <strong>of</strong> operation,a share that has rema<strong>in</strong>ed stable ever s<strong>in</strong>ce. In Zambia, the assets <strong>of</strong> L<strong>in</strong>tco weresold <strong>in</strong> two parts to Lonrho <strong>and</strong> Clark <strong>Cotton</strong>. These operations were subsequentlysold to Dunavant <strong>and</strong> Cargill, respectively, <strong>and</strong> these companies stilldom<strong>in</strong>ate the market.In the first few years after liberalization, the concentrated sectors werefound to perform best (Poulton et al. 2004). Zimbabwe completed its transitionto a smallholder-based system, with COTTCO’s credit scheme (based onthe scheme established by CMB <strong>in</strong> 1992) an important part <strong>of</strong> the story. Strictattention to quality by COTTCO <strong>and</strong> Cargill allowed the sector to ma<strong>in</strong>ta<strong>in</strong> itsexcellent reputation for quality on <strong>in</strong>ternational markets. Meanwhile, Zambiaachieved a strong <strong>in</strong>crease <strong>in</strong> production because <strong>of</strong> a gradual <strong>in</strong>crease <strong>in</strong> yieldsamong established farmers <strong>and</strong> large <strong>in</strong>creases <strong>in</strong> the number <strong>of</strong> farmers. Thisproduction <strong>in</strong>crease was temporarily <strong>in</strong>terrupted by side sell<strong>in</strong>g <strong>of</strong> seed cotton,caused by the entry <strong>of</strong> a number <strong>of</strong> new firms <strong>in</strong> 1998 <strong>and</strong> 1999. However, several<strong>of</strong> these firms exited when world l<strong>in</strong>t prices fell. Meanwhile, Dunavant, whichhad bought out Lonrho dur<strong>in</strong>g this period, <strong>in</strong>troduced a system <strong>of</strong> <strong>in</strong>dependent“distributors” to h<strong>and</strong>le credit <strong>and</strong> extension provision to farmers, which contributedto a further expansion <strong>of</strong> production. Clark’s more traditional system<strong>of</strong> extension agents was quite effective—the distributors tra<strong>in</strong>ed by Dunavantfocus primarily on <strong>in</strong>put distribution <strong>and</strong> credit recovery, <strong>and</strong> only to a secondarydegree on extension advice. 37 In addition, both companies spearheadedcampaigns aga<strong>in</strong>st polypropylene contam<strong>in</strong>ation, which laid the foundationfor a sizable <strong>in</strong>crease <strong>in</strong> the price premium that Zambian l<strong>in</strong>t now receives onworld markets.Meanwhile, Tanzania <strong>and</strong> Ug<strong>and</strong>a struggled to support farmers <strong>in</strong> a highlycompetitive output market. Efforts by <strong>in</strong>dividual companies to provide <strong>in</strong>putcredit were quickly ab<strong>and</strong>oned because the credit could not be recovered. TheUg<strong>and</strong>a <strong>Cotton</strong> G<strong>in</strong>ners <strong>and</strong> Exporters Association experimented with an<strong>in</strong>novative scheme to provide chemicals to producers on a sectorwide basis, butit had to ab<strong>and</strong>on the effort for various reasons. Eventually, <strong>in</strong> 2003, the sectormoved to a zon<strong>in</strong>g system that severely restricted competition, as a way to giveg<strong>in</strong>neries the security to <strong>in</strong>vest <strong>in</strong> extension provision <strong>and</strong> <strong>in</strong>put supply. 38Start<strong>in</strong>g <strong>in</strong> 1999, Tanzania began experiment<strong>in</strong>g with an <strong>in</strong>put trust fund toprovide farmers with m<strong>in</strong>imal access to chemical <strong>in</strong>put. This fund was subsequentlyreplaced by a passbook (forced sav<strong>in</strong>g) system, which was superior <strong>in</strong>a number <strong>of</strong> ways. As <strong>in</strong> Ug<strong>and</strong>a, a sectorwide solution had to be sought to the<strong>in</strong>put supply challenge because the private <strong>in</strong>centives do not exist for <strong>in</strong>dividualcompanies to provide <strong>in</strong>put <strong>in</strong> a highly competitive output market. Anadditional challenge <strong>in</strong> Tanzania was ma<strong>in</strong>ta<strong>in</strong><strong>in</strong>g the quality <strong>of</strong> seed cotton42 GERGELY AND POULTON
<strong>and</strong> l<strong>in</strong>t. Liberalization accelerated the decl<strong>in</strong>e <strong>in</strong> l<strong>in</strong>t quality that had begunearlier, because seed varieties were soon mixed <strong>and</strong> a scramble for seed cottonunderm<strong>in</strong>ed farmers’ <strong>in</strong>centives to supply good quality seed cotton to buyers.After a short-lived boom <strong>in</strong>duced by high world prices, production fell sharply<strong>in</strong> Tanzania after liberalization. In Ug<strong>and</strong>a, it has rema<strong>in</strong>ed disappo<strong>in</strong>t<strong>in</strong>gly stables<strong>in</strong>ce liberalization. The challenges <strong>of</strong> <strong>in</strong>creas<strong>in</strong>g productivity <strong>and</strong> production <strong>in</strong> asector with numerous small to medium g<strong>in</strong>ners have encouraged multistakeholdercollaboration <strong>in</strong> both countries, but with uneven results. In Tanzania, atleast, this collaboration now appears to be bear<strong>in</strong>g some fruit.Meanwhile, a fairly dramatic change <strong>in</strong> sector organization has occurred <strong>in</strong>Zimbabwe s<strong>in</strong>ce 2001 <strong>and</strong> a similar change may now be occurr<strong>in</strong>g <strong>in</strong> Zambia.In Zimbabwe, the onset <strong>of</strong> economic crisis <strong>in</strong> 2001 made acquisition <strong>of</strong> foreignexchange a top priority, <strong>and</strong> cotton production appeared an attractiveway <strong>of</strong> achiev<strong>in</strong>g this goal. In addition, the real exchange rate depreciatedspectacularly dur<strong>in</strong>g 2001 <strong>and</strong> 2002, but the exist<strong>in</strong>g cotton companies didnot pass on the benefits to farmers. As a result, the total number <strong>of</strong> g<strong>in</strong>nersrose from 5 <strong>in</strong> 2000/01 to 17 <strong>in</strong> 2006/07. The overall effect <strong>of</strong> this dramaticchange is still to be determ<strong>in</strong>ed, but it is clear that the sector now faces similarchallenges on quality control, <strong>in</strong>put supply, <strong>and</strong> extension provision asdescribed above for Tanzania.Established players <strong>in</strong> the sector realized that the new circumstancesrequired a new regulatory framework. In 2004 cotton sector stakeholders presenteda draft set <strong>of</strong> regulations to the Zimbabwe M<strong>in</strong>ister <strong>of</strong> Agriculture, butas <strong>of</strong> mid-2008 the changes had not been approved. Instead, consensus wasreached on stricter licens<strong>in</strong>g procedures for 2007 that required all cotton l<strong>in</strong>texporters to demonstrate that they had supported smallholder cotton farmers.As <strong>in</strong> Ug<strong>and</strong>a <strong>and</strong> Mozambique, it appears that attempts to strengthen <strong>in</strong>centivesfor provision <strong>of</strong> preharvest services by g<strong>in</strong>n<strong>in</strong>g companies will come at thecost <strong>of</strong> reduced competition <strong>in</strong> the seed cotton market.In Zambia, new companies have also entered the sector s<strong>in</strong>ce about 2005<strong>and</strong> there has been a resurgence <strong>of</strong> side sell<strong>in</strong>g <strong>of</strong> seed cotton. Unlike <strong>in</strong> 1997,however, these new entrants are backed by <strong>in</strong>vestment <strong>in</strong> new g<strong>in</strong>neries, so itseems unlikely that the sector will return to its former duopoly structure. As <strong>in</strong>Zimbabwe, the new entry appears to be associated with low seed cotton pricess<strong>in</strong>ce the early 2000s <strong>and</strong> also with <strong>in</strong>stability <strong>in</strong> the real value <strong>of</strong> the exchangerate. In Zambia, the kwacha appreciated rapidly (but temporarily) before the2006 election, limit<strong>in</strong>g the prices that companies could pay for seed cotton.This change, however, occurred at a time when farmers were already dissatisfiedwith prices, thus compound<strong>in</strong>g their dissatisfaction <strong>and</strong> mak<strong>in</strong>g themwill<strong>in</strong>g to switch allegiance to new players.In Zambia, there has been an <strong>in</strong>termittent debate about a new regulatoryframework for the sector ever s<strong>in</strong>ce the first burst <strong>of</strong> new entry <strong>and</strong> side sell<strong>in</strong>g<strong>in</strong> 1997. The major po<strong>in</strong>ts <strong>of</strong> contention have been enforcement <strong>of</strong> contracts<strong>and</strong> prompt resolution <strong>of</strong> disputes when they occur. There have beenHISTORICAL BACKGROUND AND RECENT INSTITUTIONAL EVOLUTION 43
suggestions (a) <strong>of</strong> establish<strong>in</strong>g fast-track courts for this purpose <strong>and</strong> (b) <strong>of</strong>amend<strong>in</strong>g the Agricultural Credits Act. However, the ma<strong>in</strong> stakeholder focushas been on ensur<strong>in</strong>g passage <strong>of</strong> a revised <strong>Cotton</strong> Act; as <strong>of</strong> August 2007, theM<strong>in</strong>ister <strong>of</strong> Agriculture had submitted the revised act to Parliament, but it hasnot yet been passed (Tschirley <strong>and</strong> Kabwe 2007a).44 GERGELY AND POULTON
CHAPTER FOURA Typology <strong>of</strong> <strong>Africa</strong>n<strong>Cotton</strong> <strong>Sectors</strong>Col<strong>in</strong> Poulton <strong>and</strong> David TschirleyFor the purpose <strong>of</strong> this analysis, five types <strong>of</strong> <strong>Africa</strong>n cotton sectors aredel<strong>in</strong>eated, based on the structure <strong>of</strong> the market for seed cotton purchase<strong>and</strong> the regulatory framework <strong>in</strong> which firms operate. Both <strong>of</strong>these factors <strong>in</strong>fluence firm conduct, which <strong>in</strong>fluences sector performance. Thetypes are set out <strong>in</strong> figure 4.1 <strong>in</strong> a decision tree framework. The first dist<strong>in</strong>ctionis between “market-based” <strong>and</strong> “regulated” sectors. Because all markets functionwith<strong>in</strong> some type <strong>of</strong> regulatory framework, regulated <strong>in</strong> this contextmeans a sector <strong>in</strong> which competition for the purchase <strong>of</strong> seed cotton is notallowed. This type <strong>of</strong> regulation was st<strong>and</strong>ard throughout <strong>Africa</strong>n cotton sectorsbefore the early 1990s, <strong>and</strong> has cont<strong>in</strong>ued <strong>in</strong> most <strong>of</strong> Western <strong>and</strong> Central<strong>Africa</strong> (WCA) to the present.Regulated sectors <strong>in</strong>clude national monopolies <strong>and</strong> local monopolies. Inthese systems, cotton g<strong>in</strong>n<strong>in</strong>g company(ies) have an exclusive right—<strong>and</strong> aimplicit obligation to buy all cotton seed <strong>of</strong>fered by farmers either over thewhole territory <strong>of</strong> the country (national monopoly) or over a delimited geographicarea (local monopoly). They feature, <strong>in</strong> general, a s<strong>in</strong>gle-channelmarket<strong>in</strong>g system for both <strong>in</strong>puts <strong>and</strong> outputs. Monopsony would be the righteconomic denom<strong>in</strong>ation, but, because there is generally a mirror image amongthe structure <strong>of</strong> the seed cotton market, l<strong>in</strong>t sales, <strong>and</strong> <strong>in</strong>put supply, the termmonopoly is, <strong>in</strong> effect, commonly used as a shorth<strong>and</strong>. Local monopolies couldalternatively be designated as zonal or subnational monopolies. However, theterm local monopoly will be used throughout the rest <strong>of</strong> this study.45
Figure 4.1 Decision Tree for <strong>Cotton</strong> Sector TypologyIs competition allowed for thepurchase <strong>of</strong> seed cotton?YesNoMarket-basedRegulatedAre there many buy<strong>in</strong>gfirms or few?Is there more than onecotton buyer?Many Few No YesCompetitivesystemConcentratedsystemNationalmonopolyIs each firm assigned anexclusive geographical area<strong>in</strong> which to buy seed cotton?YesNoLocalmonopolyHybridsystemSource: Authors.For market-based systems, two further dist<strong>in</strong>ctions can be made: those with“many” buyers <strong>of</strong> seed cotton (competitive systems) <strong>and</strong> those with “few” suchbuyers (concentrated systems). Necessarily subjective, this dist<strong>in</strong>ction is neverthelessmean<strong>in</strong>gful when one compares a country such as Tanzania (more than30 buyers) with Zambia before 2006 (one dom<strong>in</strong>ant buyer, one large competitor,<strong>and</strong> two or three other very small buyers).COMPETITION AND COORDINATIONPoulton et al. (2004: 521) def<strong>in</strong>ed coord<strong>in</strong>ation as “effort or measures designedto make players with<strong>in</strong> a market system act <strong>in</strong> a common or complementaryway or towards a common goal.” They noted that the pursuit <strong>of</strong> effective coord<strong>in</strong>ation“may . . . require effort or measures designed to prevent players frompursu<strong>in</strong>g contrary paths or goals.” In the neoclassical ideal <strong>of</strong> perfect competition,the only coord<strong>in</strong>ation required is vertical coord<strong>in</strong>ation between players atdifferent levels <strong>of</strong> the system, <strong>and</strong> this coord<strong>in</strong>ation is fully achieved through46 POULTON AND TSCHIRLEY
the price mechanism. Coord<strong>in</strong>ation among players at one level <strong>in</strong> the system—horizontal coord<strong>in</strong>ation—does not appear <strong>in</strong> this model. Yet North (1990)argued that implicit <strong>in</strong> the perfectly competitive model, <strong>and</strong> essential to anyreal world approximation <strong>of</strong> it, is a highly sophisticated set <strong>of</strong> <strong>in</strong>stitutions thatmake <strong>in</strong>formation available <strong>and</strong> that def<strong>in</strong>e <strong>and</strong> enforce the “rules <strong>of</strong> thegame.” Poulton et al. (2004: 521) suggest that <strong>in</strong> the real world, where the perfectlycompetitive ideal never fully holds, it “becomes more likely that there willbe some form <strong>of</strong> trade-<strong>of</strong>f between competition <strong>and</strong> coord<strong>in</strong>ation.” Thishypothesized trade-<strong>of</strong>f is at the center <strong>of</strong> the proposed typology, <strong>and</strong> it is possibleto summarize expectations <strong>of</strong> the sector types with respect to their likelyperformance <strong>in</strong> each dimension.Competitive systems are characterized by large numbers <strong>of</strong> g<strong>in</strong>ners, withopen market competition for seed cotton purchase among them. These systemshave high <strong>in</strong>centives for efficiency, but they are likely to f<strong>in</strong>d it difficultto achieve horizontal coord<strong>in</strong>ation across firms to ensure <strong>in</strong>put credit, extension,<strong>and</strong> l<strong>in</strong>t quality. National monopolies (the s<strong>in</strong>gle-channel systems thathave been common <strong>in</strong> WCA) solve the coord<strong>in</strong>ation problem by consolidat<strong>in</strong>gmost downstream activities <strong>in</strong> a s<strong>in</strong>gle firm. However, this solution comesat the cost <strong>of</strong> potentially very low <strong>in</strong>centives for efficiency; for example, g<strong>in</strong>n<strong>in</strong>g<strong>and</strong> overhead costs may rise, <strong>and</strong> performance on <strong>in</strong>put credit <strong>and</strong>extension quality may also decl<strong>in</strong>e over time. Concentrated systems <strong>and</strong> localmonopolies are likely to lie toward the middle <strong>in</strong> each dimension. Concentratedsystems are dom<strong>in</strong>ated by two or perhaps three major g<strong>in</strong>ners, whichcompete directly for the right to buy seed cotton from farmers (that is, thereis no geographical segregation <strong>of</strong> their activities). The competition is focusedon gett<strong>in</strong>g producers to sign up with a particular company for a given season<strong>and</strong> tends to be based as much on the quality <strong>of</strong> services provided to producersas on seed cotton price. Once a grow<strong>in</strong>g season is under way, themajor g<strong>in</strong>ners generally respect the contracts that each has reached with particularproducers for the duration <strong>of</strong> that season. Local monopolies do notrely on this self-polic<strong>in</strong>g approach, <strong>in</strong>stead they prohibit companies fromcompet<strong>in</strong>g for seed cotton outside their specified zones. Expected differences<strong>in</strong> performance between concentrated systems <strong>and</strong> local monopolies are notlarge; however, policy, regulatory capacity, history, <strong>and</strong> other factors canheavily affect firm behavior <strong>and</strong> performance.Accord<strong>in</strong>g to figure 4.1, the basic difference between competitive <strong>and</strong> concentratedsystems lies <strong>in</strong> the number <strong>of</strong> g<strong>in</strong>n<strong>in</strong>g firms with<strong>in</strong> the sector. Thus,the concentrated sectors shown <strong>in</strong> figure 4.2 (Zambia <strong>and</strong> Zimbabwe) wereboth, until fairly recently, effectively duopolies <strong>in</strong> which the top two firmsaccounted for 90 percent or more <strong>of</strong> seed cotton purchases. By contrast, <strong>in</strong>Tanzania there are about 30 g<strong>in</strong>ners, the top five <strong>of</strong> which account for onlyabout 40 percent <strong>of</strong> seed cotton purchases (<strong>and</strong> these top five typically changefrom year to year). However, the number <strong>of</strong> g<strong>in</strong>n<strong>in</strong>g firms with<strong>in</strong> the sector isA TYPOLOGY OF AFRICAN COTTON SECTORS 47
Figure 4.2 <strong>Africa</strong>n <strong>Cotton</strong> Sector TypologyNational monopolyCameroonMaliChad*Senegal*(private)Local monopoly(“Concession”)MozambiqueBurk<strong>in</strong>a FasoCôte d’Ivoire*Ghana*Concentrated,market-based Competitive HybridZambiaZimbabweTanzaniaBen<strong>in</strong>Ug<strong>and</strong>aSource: Authors.Note: Dashed arrows mean planned or still <strong>in</strong> progress. Solid arrows mean the evolution has beencompleted.* Not <strong>in</strong>cluded <strong>in</strong> this study.essentially a cont<strong>in</strong>uum, so the divid<strong>in</strong>g l<strong>in</strong>e between the two systems is notentirely clear cut.However, as noted above, there are also important differences <strong>in</strong> the nature<strong>of</strong> competition with<strong>in</strong> competitive <strong>and</strong> concentrated systems. This differencecame <strong>in</strong>to sharp focus <strong>in</strong> Zimbabwe after 2001, where, as new firms enteredthe sector, the clash <strong>of</strong> competitive cultures arguably caused more problems forestablished firms than the fall <strong>in</strong> the concentration ratio. Dur<strong>in</strong>g this period,the share <strong>of</strong> seed cotton purchases accounted for by the top two firms has fallento between 70 <strong>and</strong> 80 percent, which is at least 10 percentage po<strong>in</strong>ts less thanbefore 2001 but is still heavily concentrated. However, the conduct <strong>of</strong> many <strong>of</strong>the new firms has resembled that <strong>of</strong> firms <strong>in</strong> the competitive Tanzanian sector(<strong>of</strong>fer<strong>in</strong>g few preharvest services <strong>and</strong> will<strong>in</strong>g to compete on price at harvesttime, thereby encourag<strong>in</strong>g side sell<strong>in</strong>g by farmers who have received creditfrom established companies) rather than that <strong>of</strong> the two established firmswith<strong>in</strong> the sector. The Zimbabwe experience shows that it is difficult for thetwo competitive cultures (<strong>and</strong> the visions for the cotton sector that underliethem) to coexist with<strong>in</strong> a s<strong>in</strong>gle sector.F<strong>in</strong>ally, hybrid systems are a potentially diverse group, emerg<strong>in</strong>g either out<strong>of</strong> attempts to liberalize a national monopoly (Ben<strong>in</strong>) or to solve the problemsunleashed by liberalization <strong>in</strong> a sector with a competitive structure(Ug<strong>and</strong>a). Thus, Ben<strong>in</strong> has fewer than 10 g<strong>in</strong>ners, each with a purchas<strong>in</strong>gquota but no fixed geographical zone <strong>in</strong> which to make those purchases. Thesector also has a complex clear<strong>in</strong>ghouse approach to the provision <strong>of</strong> <strong>in</strong>puts<strong>and</strong> purchase <strong>of</strong> seed cotton. Ug<strong>and</strong>a has about 30 g<strong>in</strong>n<strong>in</strong>g firms that <strong>in</strong>itiallycompeted aga<strong>in</strong>st each other after reform. From about 2002 through 2007, <strong>in</strong>response to <strong>in</strong>put credit problems created by that competition, each g<strong>in</strong>neroperated aga<strong>in</strong>st a purchase quota <strong>in</strong> a def<strong>in</strong>ed geographical zone that itshared with at least one other g<strong>in</strong>ner. In theory, therefore, <strong>in</strong>centives for48 POULTON AND TSCHIRLEY
efficiency <strong>and</strong> costs <strong>of</strong> coord<strong>in</strong>ation <strong>in</strong> hybrid systems depend on the details<strong>of</strong> <strong>in</strong>stitutional design, <strong>and</strong> no firm expectations can be formed. In practice,with regard to firm conduct, we expect that Ug<strong>and</strong>a <strong>and</strong> Ben<strong>in</strong> both nowresemble a local monopoly system.DYNAMIC CONSIDERATIONSAs illustrated, sectors may at times move from one type to another. Becausecompetitive systems have difficulty provid<strong>in</strong>g <strong>in</strong>put credit to farmers, <strong>and</strong>because some level <strong>of</strong> external <strong>in</strong>put use is typically required for a sector to becompetitive <strong>in</strong> the world market, there may be pressure for competitive systemsto move toward more coord<strong>in</strong>ated systems. However, because cotton g<strong>in</strong>n<strong>in</strong>gdoes not have large economies <strong>of</strong> scale (especially where roller g<strong>in</strong>s areused), a move from a well-established competitive structure toward a marketbased,concentrated system is unlikely. Therefore, if competitive systems change,it is likely to be toward one <strong>of</strong> the regulated types. Because it is impractical toimpose a national monopoly on a system with many private firms, this movementis more likely to be to a local monopoly or hybrid system.In the study’s sample <strong>of</strong> countries, Tanzania <strong>and</strong> Ug<strong>and</strong>a both have competitivestructures that underm<strong>in</strong>ed <strong>in</strong>put credit after reform. Yet they have followedvery different paths <strong>in</strong> deal<strong>in</strong>g with this challenge. Tanzania has ma<strong>in</strong>ta<strong>in</strong>ed itscommitment to a competitive system while experiment<strong>in</strong>g with <strong>in</strong>novativeapproaches to partially address the <strong>in</strong>put credit problem. Ug<strong>and</strong>a moved to ahybrid system that keeps all g<strong>in</strong>ners operat<strong>in</strong>g but that attempts to elim<strong>in</strong>ate alldirect competition among them for seed cotton, while <strong>in</strong>vest<strong>in</strong>g heavily <strong>in</strong> tra<strong>in</strong><strong>in</strong>g<strong>of</strong> farmers. Box 4.1 suggests possible explanations for these radically differentchoices <strong>in</strong> two countries with very similar prereform histories <strong>and</strong> nearlyidentical postreform competitive structures.Management theory suggests that national monopolies are likely to showgrow<strong>in</strong>g <strong>in</strong>efficiency over time. 39 This <strong>in</strong>efficiency can eventually underm<strong>in</strong>eperformance on <strong>in</strong>put credit, extension, <strong>and</strong> cost competitiveness <strong>of</strong> the enterprise.If these systems change, the direction <strong>of</strong> change depends on policychoice. In pr<strong>in</strong>ciple, a s<strong>in</strong>gle-channel system can move quickly to a competitivesystem if free entry is allowed <strong>and</strong> if competition is not regulated. In practice,the cultural norms that resulted <strong>in</strong> the s<strong>in</strong>gle-channel system will <strong>of</strong>ten(though not always) lead to a more deliberate reform, either toward a localmonopoly system (Burk<strong>in</strong>a Faso <strong>and</strong> Mali) or to a concentrated, market-basedsystem (Zambia <strong>and</strong> Zimbabwe).Figure 4.2 maps the study sectors (<strong>and</strong> a few additional examples) ontothe typology, along with <strong>in</strong>dicat<strong>in</strong>g <strong>of</strong> how sectoral structures have changed,if at all, s<strong>in</strong>ce the onset <strong>of</strong> sector reform on the cont<strong>in</strong>ent <strong>in</strong> 1994. Solid l<strong>in</strong>esdepict def<strong>in</strong>itive changes, while dashed l<strong>in</strong>es suggest changes that may beunder way.A TYPOLOGY OF AFRICAN COTTON SECTORS 49
Box 4.1 Is This Typology Specific to <strong>Africa</strong>?The typology presented <strong>in</strong> this chapter grew out <strong>of</strong> work <strong>in</strong> East <strong>and</strong> Southern<strong>Africa</strong> (ESA), <strong>and</strong> needed only m<strong>in</strong>or modifications to usefully <strong>in</strong>corporateWCA. Two questions thus emerge. First, are the sector types identified herefound <strong>in</strong> other areas <strong>of</strong> the world, <strong>and</strong> does an assessment <strong>of</strong> their strengths <strong>and</strong>weaknesses stretch beyond <strong>Africa</strong>n borders? Second, does the rest <strong>of</strong> the worldexhibit sector types not found <strong>in</strong> the typology, <strong>and</strong> do these types provide anyglimpses <strong>in</strong>to the likely future evolution <strong>of</strong> <strong>Africa</strong>n systems? More to the po<strong>in</strong>t,do other sector types provide clues about what types <strong>of</strong> change policy makers<strong>and</strong> stakeholders should be encourag<strong>in</strong>g <strong>in</strong> their sectors?Characteriz<strong>in</strong>g cotton sectors worldwide is quite complex <strong>and</strong> wouldrequire further <strong>in</strong>vestigation. Yet a number <strong>of</strong> trends can be observed <strong>in</strong> the<strong>in</strong>stitutional evolution <strong>of</strong> cotton sectors throughout the world:■■■■<strong>Cotton</strong> g<strong>in</strong>n<strong>in</strong>g is not by nature a heavy <strong>in</strong>dustry. Hence, there are numerousexamples <strong>of</strong> farmers grouped <strong>in</strong> associations, as well as farm-basedagribus<strong>in</strong>esses, that are engaged <strong>in</strong> cotton production <strong>and</strong> g<strong>in</strong>n<strong>in</strong>g <strong>in</strong>some <strong>of</strong> the major export<strong>in</strong>g countries, such as Australia, Brazil, <strong>and</strong> theUnited States. There are similar cases <strong>in</strong> <strong>Africa</strong>, such as SICOSA <strong>in</strong> Côted’Ivoire, which is the g<strong>in</strong>n<strong>in</strong>g company established by a cotton farmerunion (URECOS-CI) at the end <strong>of</strong> the 1990s. In other cases, g<strong>in</strong>n<strong>in</strong>g is aservice provided on a fee basis (toll g<strong>in</strong>n<strong>in</strong>g) to farmers, who reta<strong>in</strong> ownership<strong>of</strong> the f<strong>in</strong>al products (l<strong>in</strong>t <strong>and</strong> seeds).There are few rema<strong>in</strong><strong>in</strong>g examples <strong>of</strong> state-owned enterprises buy<strong>in</strong>g rawcotton from farmers through a s<strong>in</strong>gle-channel (national monopoly) system.Even former Soviet republics <strong>in</strong> Central Asia, which are largeexporters <strong>of</strong> raw cotton, have, with the exception <strong>of</strong> Turkmenistan, movedaway from the national monopoly system to various degrees. These countries<strong>in</strong>clude Kazakhstan, Tajikistan, <strong>and</strong> Uzbekistan.Local monopolies seem to be transitional arrangements <strong>in</strong> the evolutionfrom a s<strong>in</strong>gle-channel system rather than a permanent susta<strong>in</strong>able organizationalmodel. Most cotton sectors <strong>in</strong> the world can be characterized aseither concentrated or competitive.<strong>Cotton</strong> production <strong>and</strong> g<strong>in</strong>n<strong>in</strong>g activities are very seldom <strong>in</strong>tegrated withdownstream <strong>in</strong>dustries such as sp<strong>in</strong>n<strong>in</strong>g, weav<strong>in</strong>g, <strong>and</strong> textile manufacture,except <strong>in</strong> some particular locally favorable conditions (Ch<strong>in</strong>a, India,<strong>and</strong> Turkey).It can be <strong>in</strong>ferred from this short review that change <strong>in</strong> <strong>Africa</strong>n cotton sectorsis mov<strong>in</strong>g <strong>in</strong> similar directions to what can be observed among other majorcotton producers <strong>in</strong> the world: retreat <strong>of</strong> governments <strong>and</strong> state cooperativesfrom <strong>in</strong>dustrial <strong>and</strong> commercial activities, grow<strong>in</strong>g empowerment <strong>of</strong> farmergroups <strong>in</strong> the management <strong>of</strong> the cotton sectors <strong>and</strong> <strong>in</strong> g<strong>in</strong>n<strong>in</strong>g <strong>and</strong> export<strong>in</strong>gactivities, <strong>and</strong> sharply <strong>in</strong>creased <strong>in</strong>vestment <strong>in</strong> local cotton <strong>in</strong>dustries by(cont<strong>in</strong>ued)50 POULTON AND TSCHIRLEY
Box 4.1 (Cont<strong>in</strong>ued)<strong>in</strong>ternational cotton merchants <strong>and</strong> commodity-based mult<strong>in</strong>ationals whenthey see opportunities at the country level. However, this is not to say thatconvergence <strong>in</strong> modes <strong>of</strong> sector organization is imm<strong>in</strong>ent. The organization<strong>of</strong> cotton sectors <strong>in</strong> <strong>Africa</strong> faces specific challenges as a result <strong>of</strong> two factors:(a) the high <strong>in</strong>put <strong>in</strong>tensity <strong>of</strong> cotton production, <strong>and</strong> (b) the weakness <strong>of</strong>markets for <strong>in</strong>put <strong>and</strong>—arguably even more important, given the lack <strong>of</strong> capital<strong>of</strong> most <strong>Africa</strong>n smallholder households—seasonal f<strong>in</strong>ance <strong>in</strong> <strong>Africa</strong>. Aslong as the seasonal f<strong>in</strong>ance constra<strong>in</strong>t rema<strong>in</strong>s, the issue <strong>of</strong> the optimal form<strong>of</strong> cotton sector organization <strong>in</strong> <strong>Africa</strong> will cont<strong>in</strong>ue to be complicated, <strong>and</strong>convergence toward forms <strong>of</strong> cotton sector organization observed <strong>in</strong> otherparts <strong>of</strong> the world will rema<strong>in</strong> partial.PREDICTED STRENGTHS AND WEAKNESSES OF DIFFERENTSECTOR TYPESPoulton et al. (2004) identified four ma<strong>in</strong> challenges fac<strong>in</strong>g smallholder-based<strong>Africa</strong>n cotton sectors:■■■■provision <strong>of</strong> <strong>in</strong>put credit to farmers,ma<strong>in</strong>tenance <strong>of</strong> quality control,ma<strong>in</strong>tenance <strong>of</strong> a high-quality research system <strong>and</strong> effective extension <strong>of</strong>result<strong>in</strong>g research knowledge <strong>and</strong> products, <strong>and</strong>payment <strong>of</strong> an attractive seed cotton price.Table 4.1 summarizes some <strong>of</strong> the strengths <strong>and</strong> weaknesses hypothesizedabout different sector types. In the absence <strong>of</strong> a strong, high-capacity governmentregulatory agency, Poulton et al. (2004) hypothesized that coord<strong>in</strong>atedsectors (national <strong>and</strong> local monopoly, concentrated) will be more likely torespond effectively to the first three <strong>of</strong> these challenges, whereas competitivesectors will be more likely to generate attractive seed cotton prices for farmers.These hypotheses are further explored <strong>in</strong> this book.Although these hypotheses assume the absence <strong>of</strong> a strong, high-capacitygovernment regulatory agency, the earlier summary <strong>of</strong> historical experience<strong>in</strong> WCA <strong>and</strong> ESA serves to emphasize the importance <strong>of</strong> sector governanceto good performance <strong>in</strong> all five sector types. Concentrated sectors can performwell with m<strong>in</strong>imal <strong>in</strong>put from the state. Good performance thendepends on private coord<strong>in</strong>ation among the dom<strong>in</strong>ant g<strong>in</strong>n<strong>in</strong>g firms. However,farmers are reliant on these companies’ cont<strong>in</strong>ued ambitions forA TYPOLOGY OF AFRICAN COTTON SECTORS 51
52Table 4.1 Trad<strong>in</strong>g Off: Strengths <strong>and</strong> Weaknesses <strong>of</strong> Different Sectoral TypesCharacteristic National monopoly Local monopoly Competitive ConcentratedNature <strong>of</strong> competitionamong g<strong>in</strong>nersNoneConcession rules that maycreate competition; someemulation across zones oncosts, prices, <strong>and</strong> servicesHigh, tends to focus onseed cotton pric<strong>in</strong>gModerate, as much onservice provision as onpric<strong>in</strong>g; price leadership<strong>of</strong>ten observedPotential strengthsConditions that may beconducive to provision <strong>of</strong><strong>in</strong>put credit, quality control,extension, <strong>and</strong> researchConditions that may beconducive to provision <strong>of</strong><strong>in</strong>put credit, quality control,extension, <strong>and</strong> researchSeed cotton pric<strong>in</strong>gConditions that may beconducive to provision<strong>of</strong> <strong>in</strong>put credit, qualitycontrol, extension, <strong>and</strong>researchPotential weaknesses<strong>and</strong> major challengesCost control; ma<strong>in</strong>tenance<strong>of</strong> attractive producerprices; political <strong>in</strong>terferenceIn presence <strong>of</strong> a weak state,requires strong farmerorganizations to ensuresett<strong>in</strong>g <strong>and</strong> implementation<strong>of</strong> transparent rules forconcession allocation <strong>and</strong>performance evaluationPreharvest service delivery;quality control; accountability<strong>of</strong> government agenciesresponsible for thesefunctionsSeed cotton pric<strong>in</strong>gheavily dependent on<strong>in</strong>ternal objectives <strong>of</strong>dom<strong>in</strong>ant companies;<strong>in</strong>stability <strong>of</strong> marketstructureSource: Authors.
expansion for an attractive seed cotton price. As has been seen with newentry <strong>in</strong> both Zimbabwe <strong>and</strong> Zambia <strong>in</strong> recent years, such sectors can becontestable, which should provide an <strong>in</strong>centive to <strong>in</strong>cumbent firms to keeppay<strong>in</strong>g attractive prices to producers. However, if they cease to cont<strong>in</strong>uepay<strong>in</strong>g attractive prices <strong>and</strong> other firms enter, the change <strong>in</strong> sectoral structurebr<strong>in</strong>gs challenges as well as advantages.Failures <strong>in</strong> the market for seasonal f<strong>in</strong>ance (<strong>and</strong> hence <strong>in</strong>put access) <strong>and</strong>quality control mean that competitive sectors have had to look to governmentagencies to play an active role that goes beyond the provision <strong>of</strong> conventionalpublic goods. This exp<strong>and</strong>ed role raises the potential for government failure—<strong>and</strong>, <strong>in</strong>deed, government agencies <strong>in</strong> both Tanzania <strong>and</strong> Ug<strong>and</strong>a (classifiedhere as a hybrid system but with a large number <strong>of</strong> private g<strong>in</strong>n<strong>in</strong>g companies)have faced such challenges. Thus, the development <strong>of</strong> mechanisms by whichother stakeholders can hold government agencies accountable for their actionsbecomes critical to overall sector performance.The regulatory challenge is arguably greatest <strong>in</strong> the local monopoly system,where theory predicts that performance will be enhanced by the sett<strong>in</strong>g<strong>and</strong> impartial implementation <strong>of</strong> transparent rules for concession allocation,periodic performance evaluation, <strong>and</strong> reallocation. This is a tall ordereven <strong>in</strong> a developed economy, let alone an <strong>Africa</strong>n economy with much lessexperience at government capacity build<strong>in</strong>g. However, there may be strongpressures for a local monopoly system from cotton companies that are skeptical<strong>of</strong> their ability to make a market-based system work. In addition, thefact that a local monopoly system has a legal foundation may give it a degree<strong>of</strong> stability.A range <strong>of</strong> variants is possible on the basic local monopoly model. Specifically,decisions about pric<strong>in</strong>g may be made at a central level (through some sectorwideprice-sett<strong>in</strong>g mechanism, as currently happens <strong>in</strong> Burk<strong>in</strong>a Faso <strong>and</strong>Mozambique) or a decentralized, that is, concession, level. This arrangementmay also be true <strong>of</strong> other decisions. As with hybrid systems, the performance<strong>of</strong> a local monopoly is likely to be heavily <strong>in</strong>fluenced by the detailed rules <strong>of</strong> thegame govern<strong>in</strong>g such decision mak<strong>in</strong>g.The past history <strong>of</strong> national monopoly systems suggests that one <strong>of</strong> thebiggest challenges is how to prevent politicians from meddl<strong>in</strong>g <strong>in</strong> sector governance.Cameroon shows that this prevention can be accomplished (albeitperhaps <strong>in</strong> special circumstances), while experiences <strong>in</strong> Burk<strong>in</strong>a Faso <strong>and</strong>Tanzania show that this challenge is not conf<strong>in</strong>ed to national monopoly systems.One <strong>of</strong> the ma<strong>in</strong> justifications for <strong>in</strong>tervention by politicians is to ensurethat producers receive a fair price for their seed cotton. However, history isreplete with cases where political <strong>in</strong>tervention achieved the opposite outcome(a recent example be<strong>in</strong>g Mali from 1994 to 2002). Another key challenge fac<strong>in</strong>gnational monopoly systems, therefore, is how to ensure that farmers’<strong>in</strong>terests are safeguarded, <strong>in</strong> particular that company operat<strong>in</strong>g costs are keptunder control so that attractive prices can be paid to producers.A TYPOLOGY OF AFRICAN COTTON SECTORS 53
CONCEPTUALIZATION OF THE LINKS BETWEEN COTTONSECTOR ORGANIZATION AND PERFORMANCEThe previous section set out a number <strong>of</strong> expected strengths <strong>and</strong> weaknessesassociated with different forms <strong>of</strong> cotton sector organization. In this section,the key l<strong>in</strong>ks between cotton sector organization <strong>and</strong> various dimensions <strong>of</strong>performance are discussed more systematically. The section culm<strong>in</strong>ates <strong>in</strong> discussion<strong>of</strong> a series <strong>of</strong> <strong>in</strong>dicators by which cotton sector performance will beassessed with<strong>in</strong> this book. Figure 4.3 presents the conceptual framework thatunderlies much <strong>of</strong> the subsequent analysis <strong>in</strong> the book.Given the various l<strong>in</strong>ks <strong>in</strong> the cha<strong>in</strong>, one can th<strong>in</strong>k <strong>of</strong> cotton sector performanceat various levels. First, there are the processes <strong>and</strong> services that are underthe direct control <strong>of</strong> cotton companies <strong>and</strong> other stakeholders with<strong>in</strong> the cottonsector. These processes <strong>and</strong> services <strong>in</strong>clude the public goods generation with<strong>in</strong>the sector, the services delivered to cotton farmers, the seed cotton pric<strong>in</strong>g decisions,<strong>and</strong> the mechanisms that companies <strong>and</strong> other stakeholders put <strong>in</strong> placefor controll<strong>in</strong>g <strong>and</strong> enhanc<strong>in</strong>g cotton quality. These areas are shown <strong>in</strong> the rectangularboxes near the top <strong>of</strong> figure 4.3. <strong>Performance</strong> at this level focuses primarilyon the quality <strong>of</strong> services provided to farmers <strong>and</strong> the prices paid. Theprocess <strong>in</strong>dicators for assess<strong>in</strong>g performance at this level are analyzed <strong>in</strong> sectionIII <strong>of</strong> the book.At the company level, the extent <strong>and</strong> efficiency <strong>of</strong> these processes <strong>and</strong> services<strong>in</strong>fluence the overall cost <strong>of</strong> operations. More extensive preharvest servicesraise company costs, but so too does pay<strong>in</strong>g a higher price for seed cotton. Cost<strong>of</strong> operations is also heavily <strong>in</strong>fluenced by the efficiency <strong>of</strong> g<strong>in</strong>n<strong>in</strong>g, which, theorysuggests, is likely to be closely l<strong>in</strong>ked to cotton sector organization. Cost <strong>of</strong>operations may be thought <strong>of</strong> as an <strong>in</strong>termediate performance <strong>in</strong>dicator, butone that has a major <strong>in</strong>fluence over both company pr<strong>of</strong>itability <strong>and</strong> the competitiveness<strong>of</strong> the sector <strong>in</strong> f<strong>in</strong>al markets.Meanwhile, at the farm level, the public goods generated <strong>and</strong> the services deliveredby cotton companies are major determ<strong>in</strong>ants <strong>of</strong> seed cotton yields (althoughexogenous factors such as soil fertility also come <strong>in</strong>to play—portrayed with dottedovals <strong>in</strong> figure 4.3). 41 As with cost <strong>of</strong> company operations, seed cotton yieldsmay be thought <strong>of</strong> as an <strong>in</strong>termediate performance <strong>in</strong>dicator. Along with seed cottonprices, yields are a major determ<strong>in</strong>ant <strong>of</strong> farm-level pr<strong>of</strong>itability <strong>of</strong> cotton production.At this po<strong>in</strong>t, an important feedback loop comes <strong>in</strong>to play, whereby highpr<strong>of</strong>its <strong>and</strong> cash <strong>in</strong>comes from cotton can facilitate the acquisition <strong>of</strong> capitalassets, such as draft power <strong>and</strong> related equipment, that can further enhance thescale <strong>and</strong> efficiency <strong>of</strong> cotton production <strong>and</strong> <strong>of</strong> the whole farm enterprise.Section IV <strong>of</strong> this book analyzes performance at both company <strong>and</strong> farmlevels, focus<strong>in</strong>g on outcome <strong>in</strong>dicators. At the farm level, yields <strong>and</strong> returns t<strong>of</strong>armers are exam<strong>in</strong>ed. At the company level, the focus is on cost efficiency <strong>and</strong>then on overall competitiveness <strong>in</strong> the l<strong>in</strong>t market, which is a function <strong>of</strong> thecosts <strong>of</strong> production <strong>and</strong> the price that a sector realizes for its l<strong>in</strong>t.54 POULTON AND TSCHIRLEY
Figure 4.3 L<strong>in</strong>k<strong>in</strong>g <strong>Cotton</strong> Sector <strong>Organization</strong> <strong>and</strong> <strong>Performance</strong>ExtensionInputprovisionResearchCreditrecoveryQualitycontrolProducerpriceSoil fertilityAvailabletechnologyG<strong>in</strong>n<strong>in</strong>goutturnG<strong>in</strong>neryoverhead costsYieldAsset accumulation(animal traction, otherequipment)Cost baseTaxes/subsidiesBy-productvalorizationPr<strong>of</strong>itability<strong>of</strong> farmersPr<strong>of</strong>itability<strong>of</strong> companiesCompetitiveposition <strong>in</strong> f<strong>in</strong>almarketPoverty effects(farmer household <strong>in</strong>come,consumption multipliers,casual labor employment)Macro impact(export revenues, valueaddition, budgetary impacts)InvestmentclimateInputs to improved performance, focus <strong>of</strong> process <strong>in</strong>dicatorsF<strong>in</strong>al outcomes, focus <strong>of</strong> outcome <strong>in</strong>dicatorsFactors largely exogenous to sectorIntermediate <strong>in</strong>dicatorsIndicators (process or outcome) partly <strong>in</strong>fluenced by external factorsSource: Authors.Ultimately, the goal would be to l<strong>in</strong>k organization <strong>of</strong> a cotton sector to itscontribution to poverty reduction. However, many exogenous factors mediatethe impacts <strong>of</strong> cotton on poverty reduction with<strong>in</strong> an economy, <strong>and</strong>model<strong>in</strong>g the impact on poverty with<strong>in</strong> the focus countries is beyond thescope <strong>of</strong> this book. The analysis is, therefore, restricted to outcome <strong>in</strong>dicatorsbecause there are <strong>in</strong>dications <strong>of</strong> clear relationships between the <strong>in</strong>dicatorsA TYPOLOGY OF AFRICAN COTTON SECTORS 55
chosen <strong>in</strong> this book <strong>and</strong> the impact <strong>of</strong> the cotton sector on poverty with<strong>in</strong> agiven country.Beg<strong>in</strong>n<strong>in</strong>g at the farm level, <strong>in</strong>creas<strong>in</strong>g pr<strong>of</strong>itability <strong>of</strong> cotton production forfarmer households does not guarantee poverty reduction, but it should contributeto it. Directly, the <strong>in</strong>comes <strong>of</strong> cotton farmers (many <strong>of</strong> who may startpoor) <strong>in</strong>crease. Indirectly, higher pr<strong>of</strong>itability <strong>of</strong> cotton production shouldencourage more hir<strong>in</strong>g <strong>of</strong> labor, while higher <strong>in</strong>comes should set <strong>of</strong>f consumptionmultiplier effects with<strong>in</strong> the local economy. As pr<strong>of</strong>itability <strong>of</strong> cottonproduction <strong>in</strong>creases, it may also encourage more households to engage <strong>in</strong> cottonproduction. However, the impact on household <strong>in</strong>comes may be quitesmall, unless the cotton sector is able to susta<strong>in</strong> a higher rate <strong>of</strong> productivitygrowth over time relative to compet<strong>in</strong>g crops <strong>and</strong> activities.At the macro level, a healthy cotton sector should also contribute to economicgrowth <strong>and</strong>, thereby, to poverty reduction. It creates value with<strong>in</strong> theeconomy, has backward <strong>and</strong> forward l<strong>in</strong>ks to <strong>in</strong>put supply <strong>and</strong> textile <strong>in</strong>dustries,generates foreign exchange, <strong>and</strong> should generate tax revenue for the state thatcan be used for subsequent <strong>in</strong>vestment.Selected IndicatorsTable 4.2 summarizes the key <strong>in</strong>dicators <strong>of</strong> cotton sector performance that willbe explored with<strong>in</strong> the book <strong>and</strong> the ways each <strong>in</strong>dicator will be measured.Table 4.3 summarizes predictions about how different sector types willperform as measured by these <strong>in</strong>dicators. Predictions are clearer for theprocess <strong>in</strong>dicators <strong>and</strong> for the <strong>in</strong>termediate outcome <strong>in</strong>dicators (yield <strong>and</strong>company cost efficiency) than for the f<strong>in</strong>al outcome <strong>in</strong>dicators. There are tworeasons: First, exist<strong>in</strong>g work (Poulton et al. 2004) has focused more onprocess <strong>in</strong>dicators than on outcome, <strong>in</strong>dicators. Second, more than oneprocess can contribute to an outcome <strong>and</strong> a particular sector type may beexpected to perform strongly <strong>in</strong> one <strong>of</strong> the processes but poorly <strong>in</strong> another.This difference is seen most clearly <strong>in</strong> the case <strong>of</strong> farmer welfare, wherereturns per day <strong>of</strong> family labor are <strong>in</strong>fluenced by yields (<strong>in</strong> which coord<strong>in</strong>atedsectors are expected to outperform competitive) <strong>and</strong> by seed cottonpric<strong>in</strong>g (<strong>in</strong> which competitive sectors are expected to outperform coord<strong>in</strong>ated).In table 4.3, therefore, “no clear prediction” means that this is anempirical question worthy <strong>of</strong> additional research.This study suggests that performance on <strong>in</strong>put credit <strong>and</strong> extension islikely to be correlated across sector types: sectors perform<strong>in</strong>g well comparedwith other sector types on <strong>in</strong>put credit are likely to perform well on extension.This correlation is <strong>in</strong> large measure due to the complementarity <strong>of</strong> thetwo activities, which stems from two sources. First, agents deliver<strong>in</strong>g <strong>in</strong>putsneed to transmit at least some m<strong>in</strong>imum level <strong>of</strong> knowledge <strong>of</strong> how to usethe <strong>in</strong>puts so that the company recoups reasonable value (<strong>in</strong> the form <strong>of</strong><strong>in</strong>creased production) from the <strong>in</strong>vestment. Second, extension work can56 POULTON AND TSCHIRLEY
Table 4.2 Key Indicators <strong>of</strong> <strong>Cotton</strong> Sector <strong>Performance</strong>Type <strong>of</strong> <strong>in</strong>dicatorProcess <strong>in</strong>dicatorsQuality <strong>and</strong> market<strong>in</strong>gPric<strong>in</strong>gInput provisionExtensionValorization <strong>of</strong> by-productsResearchIntermediate outcome <strong>in</strong>dicatorsYieldCompany cost efficiencyF<strong>in</strong>al outcome <strong>in</strong>dicatorsFarmer welfareNumber <strong>of</strong> farm householdsparticipat<strong>in</strong>g <strong>in</strong> sectorOverall competitivenessMacro impactMeasurementEstimated average realized premium overthe Cotlook A Index on world markets(US$/lb l<strong>in</strong>t)Mean percentage <strong>of</strong> FOT price paid t<strong>of</strong>armersPercentage <strong>of</strong> cotton farmers receiv<strong>in</strong>g<strong>in</strong>put creditAdequacy <strong>and</strong> quality <strong>of</strong> <strong>in</strong>put creditpackage, if providedRepayment ratePercentage <strong>of</strong> companies provid<strong>in</strong>gassistanceQualitative assessmentPrice <strong>of</strong> cotton seedsNumber <strong>of</strong> varieties released <strong>and</strong> takenup <strong>in</strong> past 10 yearsKg <strong>of</strong> seed cotton produced per hectareAdjusted farm gate price to FOT cost(US$/kg l<strong>in</strong>t)Returns per day <strong>of</strong> family labor (US$/day)NumberRatio <strong>of</strong> total FOT cost to total FOTvalueTotal value added per capita (<strong>in</strong>clud<strong>in</strong>gvalue <strong>of</strong> seed sales)Net budgetary contribution per capita(taxes paid m<strong>in</strong>us transfers received)Source: Authors.Note: FOT = free on truck (i.e. ex-g<strong>in</strong>nery).“free ride” on many <strong>of</strong> the fixed costs (such as travel cost <strong>and</strong> time) associatedwith <strong>in</strong>put delivery. Yet delivery <strong>of</strong> <strong>in</strong>put <strong>and</strong> extension advice are not likely tobe perfect complements. With<strong>in</strong> any sector type, this arrangement suggeststhat performance on extension is likely to be weaker, or more fragile <strong>in</strong> theface <strong>of</strong> stress, than is performance on <strong>in</strong>put credit—for three reasons. First,deliver<strong>in</strong>g anyth<strong>in</strong>g other than the most basic extension advice directly l<strong>in</strong>kedto <strong>in</strong>put use requires a higher level <strong>of</strong> tra<strong>in</strong><strong>in</strong>g <strong>of</strong> field agents than does delivery<strong>of</strong> <strong>in</strong>put. Second, extension delivery—<strong>and</strong> especially its effectiveness—isA TYPOLOGY OF AFRICAN COTTON SECTORS 57
Table 4.3 Expected <strong>Performance</strong> along Key IndicatorsNationalmonopoly <strong>and</strong>local monopoly Concentrated CompetitiveProcess <strong>in</strong>dicatorsQuality <strong>and</strong>Medium High Lowmarket<strong>in</strong>gPric<strong>in</strong>gLow if left toLowHighcompanies aloneInput provision High Medium LowExtension High Medium LowResearch High Medium LowValorization <strong>of</strong>by-productsNo clear predictionIntermediate outcome <strong>in</strong>dicatorsYield High High LowCompany costEfficiencyLow Medium HighF<strong>in</strong>al outcome <strong>in</strong>dicatorsFarmer welfareOverallcompetitivenessMacro ImpactSource: Authors.No clear predictionNo clear predictionNo clear predictionmore difficult for companies to monitor than is <strong>in</strong>put delivery. Third, even forcompanies committed to <strong>in</strong>creas<strong>in</strong>g farm-level productivity, the return toextension is likely to take longer to appear <strong>and</strong> to be more difficult to identifythan the return to <strong>in</strong>put delivery. For all these reasons, commitment to extensionis likely to be harder to ma<strong>in</strong>ta<strong>in</strong> than commitment to <strong>in</strong>put delivery;especially where systems come under stress (for example, because <strong>of</strong> <strong>in</strong>creasedcompetition <strong>in</strong> concentrated systems), extension effort may be sacrificed fornarrower loan monitor<strong>in</strong>g <strong>and</strong> recovery.As we close this chapter, it is important to note that the type <strong>and</strong> quality <strong>of</strong>sector regulation will have a strong effect on performance for all <strong>in</strong>dicators. Thejob <strong>of</strong> regulation may be thought <strong>of</strong> as seek<strong>in</strong>g correction <strong>in</strong> areas where anunregulated sector is likely to perform poorly, while preserv<strong>in</strong>g that sector’sstrengths. The corollary is that the predictions <strong>in</strong> table 4.3 may be most accurate<strong>in</strong> situations where regulation is weak, which it typically is <strong>in</strong> <strong>Africa</strong>. However,as has already been described (chapter 3), there are ongo<strong>in</strong>g efforts to buildmore effective regulatory regimes for the cotton sector <strong>in</strong> several <strong>of</strong> the study’sfocus countries.58 POULTON AND TSCHIRLEY
Box 4.2 Factors <strong>in</strong> Addition to Structure That InfluenceBehavior <strong>and</strong> <strong>Performance</strong>The sectoral typology developed <strong>in</strong> this book focuses heavily on the structure<strong>of</strong> the market for seed cotton. This structure is seen as a key determ<strong>in</strong>ant (a)<strong>of</strong> the types <strong>of</strong> challenges that a sector will have most difficulty meet<strong>in</strong>g <strong>and</strong>thus (b) <strong>of</strong> the types <strong>of</strong> regulatory structures that are needed to safeguardgood performance <strong>and</strong> to improve poor performance. For example, thetypology suggests that highly competitive sectors will be unable to provide<strong>in</strong>put credit <strong>and</strong> extension or to safeguard quality, but they will be likely topay attractive prices. Concentrated sectors are predicted to perform well on<strong>in</strong>put credit, extension, <strong>and</strong> quality but to pay less attractive prices. Compar<strong>in</strong>gUg<strong>and</strong>a with Tanzania <strong>and</strong> Zimbabwe with Zambia highlights the usefulness<strong>of</strong> the typology while mak<strong>in</strong>g pla<strong>in</strong> that structure is not the only factorthat <strong>in</strong>fluences behavior <strong>and</strong> performance. In each case, the structure thatemerged out <strong>of</strong> reform—highly competitive <strong>in</strong> Ug<strong>and</strong>a <strong>and</strong> Tanzania, veryconcentrated <strong>in</strong> Zambia <strong>and</strong> Zimbabwe—did determ<strong>in</strong>e which challenges(<strong>in</strong>put credit, extension, productivity growth, seed cotton pric<strong>in</strong>g, l<strong>in</strong>t quality,g<strong>in</strong>n<strong>in</strong>g efficiency) countries had most difficulty <strong>in</strong> meet<strong>in</strong>g. Yet <strong>in</strong> eachcase, variations <strong>in</strong> history, management, or geography have led to importantdifferences <strong>in</strong> behavior <strong>and</strong> performance.These differences are most stark <strong>in</strong> Ug<strong>and</strong>a <strong>and</strong> Tanzania, despite remarkablysimilar structures <strong>and</strong> histories before <strong>and</strong> immediately after reform. Inboth countries, the prereform cooperative-based systems led quickly afterreform to markets with 20 to 30 buyers compet<strong>in</strong>g <strong>in</strong>tensively on price forfarmer production. Farm prices improved, but <strong>in</strong>put supply <strong>and</strong> extensioncollapsed. Initial efforts to solve the problem <strong>in</strong> both countries <strong>in</strong>volved mov<strong>in</strong>g<strong>in</strong>put supply to the public sector to allow competition among companies<strong>in</strong> the output market. In both cases these <strong>in</strong>itial efforts ultimately failedbecause <strong>of</strong> management <strong>and</strong> design problems.S<strong>in</strong>ce the failure <strong>of</strong> these <strong>in</strong>itial attempts, the two countries have moved <strong>in</strong>dramatically different directions (chapter 6). Ug<strong>and</strong>a reversed its previouscourse, us<strong>in</strong>g a zonal quota system to elim<strong>in</strong>ate competition <strong>in</strong> the outputmarket <strong>in</strong> an effort to facilitate coord<strong>in</strong>ation by g<strong>in</strong>ners on <strong>in</strong>put supply <strong>and</strong>extension. Tanzania meanwhile ma<strong>in</strong>ta<strong>in</strong>ed its competitive output market,but used an <strong>in</strong>novative approach, the so-called passbook system, thatrequired close cooperation between public <strong>and</strong> private sectors to provide seed<strong>and</strong> some m<strong>in</strong>imal level <strong>of</strong> <strong>in</strong>secticides to farmers.Several factors help expla<strong>in</strong> why Tanzania <strong>and</strong> Ug<strong>and</strong>a have chosen suchdifferent paths. First, the geographical scope for exp<strong>and</strong><strong>in</strong>g cotton productionunder a low-<strong>in</strong>put approach is greater <strong>in</strong> Tanzania than <strong>in</strong> Ug<strong>and</strong>a, at least aslong as the far north <strong>of</strong> Ug<strong>and</strong>a rema<strong>in</strong>s <strong>in</strong>secure. For now, g<strong>in</strong>ners <strong>in</strong> Ug<strong>and</strong>amust try to <strong>in</strong>crease production <strong>in</strong> relatively small areas already under production.If this l<strong>in</strong>e <strong>of</strong> reason<strong>in</strong>g is correct, once the northern region becomessecure, <strong>in</strong>centives for g<strong>in</strong>ners to operate the quota system may decrease. a(cont<strong>in</strong>ued)A TYPOLOGY OF AFRICAN COTTON SECTORS 59
Box 4.2 (Cont<strong>in</strong>ued)Second, farmers <strong>in</strong> Ug<strong>and</strong>a may have more remunerative cash cropp<strong>in</strong>goptions than <strong>in</strong> Tanzania. Provid<strong>in</strong>g some substantial <strong>in</strong>put credit or extension,or both, is thus imperative if g<strong>in</strong>ners are to attract farmers to cotton.Aga<strong>in</strong>, this provision may not be the case <strong>in</strong> the more remote north <strong>of</strong> thecountry. F<strong>in</strong>ally, greater cultural homogeneity among Ug<strong>and</strong>an g<strong>in</strong>ners mayhave facilitated collective action approaches that were <strong>in</strong>feasible <strong>in</strong> Tanzania.Differences <strong>in</strong> Zambia <strong>and</strong> Zimbabwe have less to do with regulatoryapproaches—both are attempt<strong>in</strong>g to consolidate their concentrated structures—thanwith the productivity that each has achieved. Zimbabwe’s annualmean yield from 1995 through 2004 was about 825 kg seed cotton per hectare(ha), compared to about 625 kg/ha <strong>in</strong> Zambia (chapter 10). Even <strong>in</strong> 2006,after several years <strong>of</strong> macroeconomic crisis <strong>and</strong> disrupted <strong>in</strong>put distributionresult<strong>in</strong>g from the entry <strong>of</strong> new players, the best-yield<strong>in</strong>g 20 percent <strong>of</strong> Zimbabweanfarmers achieved mean yields <strong>of</strong> 1,750 kg/ha, while the top 4 percent<strong>of</strong> Zambian farmers reached only about 1,200 kg/ha. Zimbabwe’s superiorperformance <strong>in</strong> this regard is driven by the cont<strong>in</strong>u<strong>in</strong>g <strong>in</strong>fluence <strong>of</strong> past performance.Before reform <strong>in</strong> 1994, Zambia’s L<strong>in</strong>tco was a small <strong>and</strong> decl<strong>in</strong><strong>in</strong>gcompany, <strong>and</strong> little if any cotton research took place <strong>in</strong> the country. In contrast,Zimbabwe developed its <strong>Cotton</strong> Market<strong>in</strong>g Board (CMB) <strong>and</strong> an effectiveresearch system <strong>in</strong> the 1960s <strong>and</strong> 1970s to serve commercial farmers.After Zimbabwe’s <strong>in</strong>dependence <strong>in</strong> 1980, the CMB built systems for effective<strong>in</strong>put credit <strong>and</strong> extension to new smallholder farmers; farmers not <strong>in</strong>cluded<strong>in</strong> these systems were able to self-provision at least a basic set <strong>of</strong> <strong>in</strong>put <strong>in</strong> thecountry’s relatively developed (by Sub-Saharan <strong>Africa</strong>n st<strong>and</strong>ards) private<strong>in</strong>put markets. COTTCO, the private sector successor to CMB, cont<strong>in</strong>ued thiseffective performance <strong>in</strong>to at least the early 2000s. Even today, after temporarilyscal<strong>in</strong>g back its <strong>in</strong>put credit support <strong>in</strong> 2005, the company provideshigh-quality support to many farmers.a. Indeed, the north <strong>of</strong> Ug<strong>and</strong>a is beg<strong>in</strong>n<strong>in</strong>g to open as this book is be<strong>in</strong>g f<strong>in</strong>alized(mid-2008), <strong>and</strong> Ug<strong>and</strong>a ab<strong>and</strong>oned the quota system for the 2007/08 productionseason. It is not yet clear whether this decision was driven <strong>in</strong> part by the prospect <strong>of</strong>expansion <strong>in</strong>to northern areas <strong>of</strong> the country.Place <strong>of</strong> the <strong>Cotton</strong>seed Oil Industry <strong>in</strong> the TypologyThis book considers the cotton sector as a whole, <strong>in</strong>clud<strong>in</strong>g the broad range <strong>of</strong>activities from seed cotton production through g<strong>in</strong>n<strong>in</strong>g to market<strong>in</strong>g <strong>of</strong> theresult<strong>in</strong>g products (l<strong>in</strong>t, seeds, oil, <strong>and</strong> cake). 42 As a result, the analysis <strong>in</strong>cludesa description <strong>of</strong> the way cottonseed oil <strong>in</strong>dustries are organized <strong>and</strong> how theycontribute to the sector’s performance. An argument made <strong>in</strong> this study is thatperformance <strong>of</strong> oil <strong>and</strong> cake sectors is becom<strong>in</strong>g <strong>in</strong>creas<strong>in</strong>gly important <strong>and</strong>thus requires more attention than it has received to date. Also, <strong>in</strong> some cotton60 POULTON AND TSCHIRLEY
sectors outside <strong>Africa</strong>, farmers own <strong>and</strong> reta<strong>in</strong> their cotton seeds after g<strong>in</strong>n<strong>in</strong>g,mean<strong>in</strong>g that the performance <strong>of</strong> these markets directly affects farmers.Table 4.2 features the valorization <strong>of</strong> seed cotton by-products as a process<strong>in</strong>dicator. As figure 4.3 recognizes, although the organization (<strong>and</strong> hence performance)<strong>of</strong> oil <strong>and</strong> cake markets are related to the organization <strong>of</strong> the cottonsector, the nature <strong>of</strong> this relationship is not the same as that between sectororganization <strong>and</strong> performance on, say, <strong>in</strong>put supply or quality control. Historically,<strong>in</strong> WCA, the organization <strong>of</strong> the oil sector was bound up with thenational monopoly <strong>in</strong> cotton g<strong>in</strong>n<strong>in</strong>g—all part <strong>of</strong> the overall developmentapproach to the cotton filière (supply cha<strong>in</strong>). 43 Although this is history morethan an <strong>in</strong>herent part <strong>of</strong> a national monopoly <strong>in</strong> cotton g<strong>in</strong>n<strong>in</strong>g, it has determ<strong>in</strong>edthe structure <strong>and</strong> evolution <strong>of</strong> the cottonseed oil <strong>in</strong>dustries <strong>in</strong> most <strong>of</strong>the WCA countries. Meanwhile, market-based cotton sectors are generallyassociated with more or less competitive oil markets.A TYPOLOGY OF AFRICAN COTTON SECTORS 61
SECTION THREEComparative Analysis:Core Activities <strong>and</strong>Service Delivery
CHAPTER FIVEPric<strong>in</strong>g Systems <strong>and</strong> PricesPaid to GrowersJohn Baffes, David Tschirley<strong>and</strong> Nicolas GergelyUntil recently, most cotton sectors <strong>in</strong> West <strong>and</strong> Central <strong>Africa</strong> (WCA)were national monopolies, requir<strong>in</strong>g an adm<strong>in</strong>istered approach t<strong>of</strong>armer price sett<strong>in</strong>g. Although details vary across countries, eachcountry <strong>in</strong> WCA followed broadly similar approaches to this issue. S<strong>in</strong>ce theonset <strong>of</strong> reform <strong>in</strong> East <strong>and</strong> Southern <strong>Africa</strong> (ESA), cotton sectors have <strong>in</strong>cludedall sector types described <strong>in</strong> chapter 4 except national monopolies: localmonopolies (Mozambique), concentrated systems (Zambia <strong>and</strong> Zimbabwe),competitive (Tanzania, Ug<strong>and</strong>a until the early 2000s), <strong>and</strong> hybrid (Ug<strong>and</strong>a s<strong>in</strong>ce2003). Predictably, approaches to price sett<strong>in</strong>g <strong>in</strong> ESA have been as diverse as thecountries’ sectoral <strong>and</strong> regulatory structures.The summary <strong>in</strong>dicator for pric<strong>in</strong>g performance is the percentage <strong>of</strong> thefree-on-truck (FOT; ex g<strong>in</strong>nery) l<strong>in</strong>t price paid to farmers for their seed cotton.The typology laid out <strong>in</strong> the previous chapter generates clear expectations<strong>of</strong> performance on this measure for market-based systems: competitivesystems should pay the highest FOT share, while concentrated systems arelikely to pay the lowest. <strong>Performance</strong> <strong>in</strong> national <strong>and</strong> local monopolies is notfully predictable from the typology because political factors <strong>and</strong> the strength<strong>of</strong> farmer associations weigh more heavily <strong>in</strong> these sectors. The rest <strong>of</strong> thischapter expla<strong>in</strong>s the price mechanisms <strong>in</strong> the two regions <strong>and</strong> comparestheir performance at the farmer level.65
PRICING MECHANISMS IN WCAPric<strong>in</strong>g mechanisms <strong>in</strong> WCA have a remarkably similar historical backgroundacross all countries <strong>and</strong> are based on a commonly accepted pr<strong>in</strong>ciple thats<strong>in</strong>gle-channel systems require fixed prices: unique for the entire cotton-grow<strong>in</strong>garea <strong>in</strong> the country (panterritorial), fixed throughout the cropp<strong>in</strong>g season(panseasonal), <strong>and</strong> announced publicly before sow<strong>in</strong>g. Another major featureis the guarantee <strong>of</strong> purchase by the cotton company <strong>of</strong> all quantities <strong>of</strong> seedcotton <strong>of</strong>fered at the <strong>of</strong>ficial price. Typically, dur<strong>in</strong>g the 1970s <strong>and</strong> most <strong>of</strong> the1980s, the M<strong>in</strong>istry <strong>of</strong> Agriculture announced the producer price for seed cottonbefore the plant<strong>in</strong>g season, <strong>and</strong> the cotton company was m<strong>and</strong>ated to purchasethe raw cotton from farmers throughout the country. There was <strong>in</strong>tensebarga<strong>in</strong><strong>in</strong>g each year between the government <strong>and</strong> the cotton company basedon st<strong>and</strong>ard costs for <strong>in</strong>put <strong>and</strong> services <strong>in</strong>clud<strong>in</strong>g g<strong>in</strong>n<strong>in</strong>g (barêmes) becausethe cotton company was assum<strong>in</strong>g the f<strong>in</strong>ancial risks <strong>of</strong> the guaranteed price<strong>and</strong> tried to cover risks <strong>and</strong> overhead through well-negotiated barêmes. Thisbarga<strong>in</strong><strong>in</strong>g process, which featured little transparency, was replaced at the end<strong>of</strong> the 1980s by performance contracts negotiated <strong>and</strong> signed between the government<strong>and</strong> the cotton companies that set performance targets <strong>and</strong> costs. Asnoted <strong>in</strong> chapter 3, the results <strong>of</strong> the performance contract approach were generallydisappo<strong>in</strong>t<strong>in</strong>g.S<strong>in</strong>ce the successive crises <strong>of</strong> the early to mid-2000s <strong>and</strong> so they could ga<strong>in</strong>flexibility <strong>and</strong> reduce f<strong>in</strong>ancial risks, most WCA countries reformed their pric<strong>in</strong>gsystems with a two-tier payment: a base price negotiated at the beg<strong>in</strong>n<strong>in</strong>g <strong>of</strong>the cropp<strong>in</strong>g season <strong>and</strong> a price complement to be paid at the end <strong>of</strong> the season,if the cotton company makes a pr<strong>of</strong>it (Cameroon) or if the realized salesprice is above the base price (Burk<strong>in</strong>a Faso <strong>and</strong> Mali). Initial cropp<strong>in</strong>g seasonprices, adm<strong>in</strong>istratively set until the end <strong>of</strong> the 1990s, are now typically agreedon before the plant<strong>in</strong>g season through direct negotiation between cotton companies<strong>and</strong> farmers or, <strong>in</strong> some countries (Burk<strong>in</strong>a Faso <strong>and</strong> Mali), through acommonly agreed on pric<strong>in</strong>g formula with<strong>in</strong> an <strong>in</strong>terpr<strong>of</strong>essional committee.The parameters <strong>of</strong> the pric<strong>in</strong>g formulas have been progressively improved: referencesto production cost (<strong>in</strong> Mali) have been ab<strong>and</strong>oned <strong>and</strong> have beenreplaced, <strong>in</strong> both Burk<strong>in</strong>a Faso <strong>and</strong> Mali, by a fixed percentage (60 percent) <strong>of</strong>the free-on-board (FOB) price paid to farmers, thus l<strong>in</strong>k<strong>in</strong>g producer prices toworld market prices. Even when such mechanisms are well designed <strong>and</strong>applied, the sectors still face the uncerta<strong>in</strong>ty <strong>of</strong> what the actual world price willbe nearly one year from the time the <strong>in</strong>itial producer price has to be announced.This uncerta<strong>in</strong>ty creates significant f<strong>in</strong>ancial risks for the cotton companies thathave to buy at this preset price. If actual market prices are lower than this level,cotton companies will <strong>in</strong>cur trad<strong>in</strong>g losses, eventually lead<strong>in</strong>g to the need forbailouts or f<strong>in</strong>ancial restructur<strong>in</strong>g.In all WCA countries, the pric<strong>in</strong>g mechanism had been l<strong>in</strong>ked to a stabilizationfund designed to limit fluctuations <strong>in</strong> producer prices <strong>and</strong> prevent66 BAFFES, TSCHIRLEY, AND GERGELY
Table 5.1 Summary <strong>of</strong> Pric<strong>in</strong>g Mechanisms <strong>in</strong> WCA Countries, 2006Pric<strong>in</strong>gelement Ben<strong>in</strong> Burk<strong>in</strong>a Faso Cameroon MaliAdm<strong>in</strong>isteredprice?Panterritorial,panseasonal?How is it set?Announcedbeforeplant<strong>in</strong>g?Adjusted beforeharvest?Secondarypayment aftermarket<strong>in</strong>g?L<strong>in</strong>ked toCotlook AIndex? aStabilizationfund?Sectorwidedeficits?Mixed Yes Yes YesYes Yes Yes YesGovernmentthat hasarbitraryroleNegotiatedwith<strong>in</strong> <strong>in</strong>terpr<strong>of</strong>essionalcommitteeNegotiatedwith<strong>in</strong> <strong>in</strong>terpr<strong>of</strong>essionalcommitteeNegotiatedwith<strong>in</strong> <strong>in</strong>terpr<strong>of</strong>essionalcommitteeYes Yes Yes YesYes No Yes NoYes Yes Yes YesYes <strong>in</strong> pr<strong>in</strong>ciple,not so clearly<strong>in</strong> practiceYes, butexhaustedYesYesYes, butexhaustedYes (estimated€110 million,2004/05–2005/06)Yes <strong>in</strong> pr<strong>in</strong>ciple,not so clearly<strong>in</strong> practiceYes, butexhaustedNone through2007YesYes, butexhaustedYes (estimatedUS$91million for2005 alone)Source: Authors.a. The Cotlook A Index is an <strong>in</strong>dex published by Cotlook Limited, an <strong>in</strong>dependentLiverpool-based company engaged <strong>in</strong> publish<strong>in</strong>g cotton news for more than 75 years.The A Index is widely regarded as the reliable barometer <strong>of</strong> world cotton values, <strong>and</strong> isreferred to by the major <strong>in</strong>ternational cotton organizations, such as the International<strong>Cotton</strong> Advisory Council.prices from fall<strong>in</strong>g below a “m<strong>in</strong>imum” level—at least until the 2004 crisis,when the world cotton price fell by 30 percent. Only one <strong>of</strong> these funds (<strong>in</strong>Cameroon) survived the crisis, but even it was exhausted <strong>in</strong> subsequent years.The collapse <strong>of</strong> the stabilization funds—caused by farmer prices well abovewhat was feasible given world market prices—exacerbated the f<strong>in</strong>ancial crises<strong>in</strong> the WCA cotton sectors, <strong>and</strong> required that the governments provide heavyf<strong>in</strong>ancial support <strong>in</strong> Ben<strong>in</strong>, Burk<strong>in</strong>a Faso, <strong>and</strong> Mali.Table 5.1 shows the essential elements <strong>of</strong> pric<strong>in</strong>g mechanisms <strong>in</strong> the WCAstudy countries. The traditional cotton pric<strong>in</strong>g mechanisms used <strong>in</strong> WCA havenumerous economic <strong>and</strong> f<strong>in</strong>ancial implications. First, panterritorial pricestransfer resources from growers with low transport costs to growers more distantfrom g<strong>in</strong>s or <strong>in</strong> less accessible areas. Second, when prices are announcedPRICING SYSTEMS AND PRICES PAID TO GROWERS 67
efore plant<strong>in</strong>g, price risk <strong>in</strong> the short run is borne by the cotton companiesthat will have problems operat<strong>in</strong>g pr<strong>of</strong>itably if market prices dur<strong>in</strong>g the seasonfall below the level <strong>of</strong> the announced price. In the long term, taxpayers <strong>and</strong>donors also carry risk because the companies may need to be f<strong>in</strong>ancially supportedby the governments. Follow<strong>in</strong>g the cotton price decl<strong>in</strong>e <strong>of</strong> the late1980s, along with an overvalued Communauté Française d’Afrique (CFA)franc, several cotton companies had to be bailed out; the f<strong>in</strong>ancial difficulties<strong>of</strong> most cotton companies <strong>in</strong> the region s<strong>in</strong>ce the end <strong>of</strong> the 1990s are similarto the problems experienced at that time.PRICING MECHANISMS IN ESABefore the reforms <strong>of</strong> the early 1990s, cotton pric<strong>in</strong>g mechanisms <strong>in</strong> ESAclosely resembled those <strong>of</strong> WCA <strong>in</strong> that a cotton parastatal (or cooperativeunions <strong>in</strong> Tanzania <strong>and</strong> Ug<strong>and</strong>a) was the sole buyer <strong>of</strong> cotton at a preannounced,panseasonal, <strong>and</strong> panterritorial price. Follow<strong>in</strong>g reform, pric<strong>in</strong>gmechanisms <strong>in</strong> the region became more market l<strong>in</strong>ked, flexible, <strong>and</strong> diverse, <strong>in</strong>l<strong>in</strong>e with the diverse sectoral types that have emerged (table 5.2). No country<strong>in</strong> the region operates a stabilization fund, nor have any generated sectorwidedeficits that the government had to cover.Mozambique operates the only local monopoly system <strong>in</strong> the region <strong>and</strong> isthe only country that ma<strong>in</strong>ta<strong>in</strong>s a fully adm<strong>in</strong>istered, panseasonal, <strong>and</strong> panterritorialprice. The government’s role <strong>in</strong> price sett<strong>in</strong>g is strong <strong>in</strong> Mozambique,<strong>in</strong> part because <strong>of</strong> the very weak state <strong>of</strong> farmer organizations <strong>in</strong> thecountry. In Zambia <strong>and</strong> Zimbabwe’s concentrated sectors, preplant<strong>in</strong>g priceshave been ma<strong>in</strong>ta<strong>in</strong>ed, but this practice reflects bus<strong>in</strong>ess decisions by thedom<strong>in</strong>ant firms as they exercise price leadership <strong>in</strong> the sector; the governmenthas no say <strong>in</strong> pric<strong>in</strong>g <strong>in</strong> either country. 44 Prices paid to farmers throughoutthe region are much more strongly l<strong>in</strong>ked to medium-term, <strong>and</strong> even shortterm,movements <strong>in</strong> the Cotlook A Index than they are <strong>in</strong> WCA. The way <strong>in</strong>which this l<strong>in</strong>kage happens varies greatly, however. For example, prices <strong>in</strong>Zambia largely adjust only year to year as a result <strong>of</strong> price leadership byDunavant, while <strong>in</strong> Tanzania <strong>and</strong> more recently <strong>in</strong> Zimbabwe (because <strong>of</strong>escalat<strong>in</strong>g <strong>in</strong>flation), they fluctuate throughout the market<strong>in</strong>g season. Even <strong>in</strong>Ug<strong>and</strong>a’s hybrid system, which attempts to elim<strong>in</strong>ate competition amongfirms, prices vary over the course <strong>of</strong> the market<strong>in</strong>g season.COMPARING PRICING PERFORMANCE AT THE FARMER LEVELTable 5.3 shows the share <strong>of</strong> the FOT l<strong>in</strong>t price received by farmers <strong>in</strong> each <strong>of</strong> thestudy countries over the period 1990–2005. Producer prices for seed cotton areadjusted to l<strong>in</strong>t equivalent us<strong>in</strong>g the average g<strong>in</strong>n<strong>in</strong>g outturn ratio, <strong>and</strong> any <strong>in</strong>putcosts borne by the companies are added to this result, to show the net valuereceived by farmers. The Cotlook A Index is then adjusted to FOT on the basis <strong>of</strong>68 BAFFES, TSCHIRLEY, AND GERGELY
Table 5.2 Summary <strong>of</strong> Pric<strong>in</strong>g Mechanisms <strong>in</strong> ESA Countries, 2006Pric<strong>in</strong>g element Mozambique Tanzania Ug<strong>and</strong>a Zambia ZimbabweCurrent structure Local monopoly Competitive Hybrid Concentrated ConcentratedAdm<strong>in</strong>istered price? Yes No Only preplant<strong>in</strong>g price No NoPanterritorial? Yes No Only preplant<strong>in</strong>g price Yes for <strong>in</strong>dividualNocompanies, butprices vary acrosscompaniesPanseasonal? Yes No No Yes NoHow set?Negotiated betweengovernment <strong>and</strong>g<strong>in</strong>ners; very littledirect role <strong>of</strong> farmersCompetitive marketprice, no priceleadershipCDO sets pricebefore market<strong>in</strong>g <strong>in</strong>collaboration withg<strong>in</strong>ners’ associationDunavant acts asprice leaderPrice leadership byCottco <strong>and</strong> Cargill;newer companiesgenerally pay moreAnnouncedpreplant<strong>in</strong>g?No No Yes Yes, only byDunavantYes (Cottco <strong>and</strong>Cargill only)Adjusted beforeharvest?n.a. n.a. Not formally, but actualprices paid d<strong>of</strong>luctuate overmarket<strong>in</strong>g seasonYesCont<strong>in</strong>ually adjustedover season because<strong>of</strong> hyper<strong>in</strong>flationSecondary paymentafter market<strong>in</strong>g?No No No No Yes (Cottco <strong>and</strong>Cargill only)L<strong>in</strong>ked to Cotlook A Yes <strong>in</strong> pr<strong>in</strong>ciple, not soYes Yes Yes YesIndex? aclearly <strong>in</strong> practiceStabilization fund? No No No No NoSectorwide deficits? No No No No NoSource: Authors.Note: n.a. = not applicable. CDO = cotton development organization.a. The cotlook A Index is an <strong>in</strong>dex published by Cotlook Limited, an <strong>in</strong>dependent Merseyside-based company engaged <strong>in</strong> publish<strong>in</strong>g cotton news for morethan 75 years. The A Index is widely regarded as the reliable barometer <strong>of</strong> world cotton values, <strong>and</strong> is referred to by the major <strong>in</strong>ternational cotton organizations,such as the ICAC.69
Table 5.3 Summary <strong>of</strong> Producer Shares <strong>of</strong> FOT L<strong>in</strong>t Price (percent)1990–94 1995–99 2000–051995–2005(postreform<strong>in</strong> ESA)EntirePeriod(1990–2005)Ben<strong>in</strong> 58 62 71 67 64Burk<strong>in</strong>a Faso 55 57 73 66 62Cameroon 61 61 73 68 66Mali 56 52 76 65 62Mozambique 27 52 48 50 43Tanzania 49 65 70 68 62Ug<strong>and</strong>a — 72 68 70 70Zambia — 63 55 59 58Zimbabwe 63 69 49 58 59Source: Authors.Note: — = not available.transport <strong>and</strong> port cost data. Estimates <strong>of</strong> average quality premiums for eachcountry (see chapter 7) are then added to derive the value received by theg<strong>in</strong>ner at the g<strong>in</strong>nery door. The ratio <strong>of</strong> these two values—that paid to farmersby the g<strong>in</strong>ners <strong>and</strong> that received by g<strong>in</strong>ners at the factory door—shows theshare <strong>of</strong> FOT paid to farmers. The FOT l<strong>in</strong>t price is used <strong>in</strong>stead <strong>of</strong> FOBbecause FOT is the f<strong>in</strong>al product price most with<strong>in</strong> the companies’ control.Transport costs from FOT to FOB tend to be higher <strong>in</strong> l<strong>and</strong>locked countries(Burk<strong>in</strong>a Faso, Mali, Ug<strong>and</strong>a, Zambia, <strong>and</strong> Zimbabwe) than <strong>in</strong> coastal countries(Cameroon, Mozambique, <strong>and</strong> Tanzania). Thus, for example, costs fromFOT to FOB are estimated to be 50 percent higher <strong>in</strong> Zimbabwe (US$0.157 perkg <strong>of</strong> l<strong>in</strong>t) than <strong>in</strong> Tanzania (US$0.105 per kg <strong>of</strong> l<strong>in</strong>t) entirely because <strong>of</strong> geography.(Because <strong>of</strong> different transport costs, seed cotton prices <strong>in</strong> U.S. dollarterms may be lower <strong>in</strong> Ug<strong>and</strong>a than <strong>in</strong> Tanzania, but the share <strong>of</strong> FOT paid t<strong>of</strong>armers may be larger.)Caution is required <strong>in</strong> <strong>in</strong>terpret<strong>in</strong>g the data <strong>in</strong> table 5.3 for a number <strong>of</strong> reasons.First, the cotton companies <strong>in</strong> WCA, with the exception <strong>of</strong> Cameroon,have accumulated large deficits s<strong>in</strong>ce the beg<strong>in</strong>n<strong>in</strong>g <strong>of</strong> the 2000s, so that pricesreceived by cotton growers <strong>in</strong>clude taxpayer (or donor) resources not capturedby the FOT shares. Second, even FOT figures do not account for different rates<strong>of</strong> taxation across countries (for example, Tanzania taxes its cotton sector quiteheavily while Ug<strong>and</strong>a does not). Third, there are various exchange rate issues<strong>in</strong> six <strong>of</strong> the n<strong>in</strong>e countries exam<strong>in</strong>ed, imply<strong>in</strong>g that several <strong>of</strong> the cotton sectorshave been taxed (the issues <strong>in</strong>clude, for example, a likely overvaluation <strong>of</strong>the CFA franc <strong>in</strong> WCA <strong>and</strong> the effects <strong>of</strong> local currency appreciation <strong>in</strong> Zambia).F<strong>in</strong>ally, the ratio should be <strong>in</strong>terpreted as an <strong>in</strong>dicator <strong>of</strong> how well g<strong>in</strong>ners70 BAFFES, TSCHIRLEY, AND GERGELY
are pay<strong>in</strong>g farmers compared with what they “should” be able to pay; it shouldnot be seen as <strong>in</strong>dicative <strong>of</strong> how well farmers are remunerated <strong>in</strong> an absolutesense. For example, average prices actually received by farmers have been verysimilar <strong>in</strong> Zambia <strong>and</strong> Tanzania; however, Tanzania’s performance relative toFOT is much better than Zambia’s because g<strong>in</strong>ners <strong>in</strong> Zambia have generateda very high quality premium not enjoyed <strong>in</strong> Tanzania, but they pass little <strong>of</strong> thispremium on to farmers.CONCLUSIONSFocus<strong>in</strong>g first on ESA, four patterns st<strong>and</strong> out. First, Mozambique (the region’sonly monopoly sector) paid extraord<strong>in</strong>arily low prices before 1995, <strong>in</strong> part as aresult <strong>of</strong> additional costs that the companies had to bear: ma<strong>in</strong>tenance <strong>of</strong> privatemilitias dur<strong>in</strong>g the war, <strong>and</strong> substantial costs to keep roads open. As thesecosts disappeared dur<strong>in</strong>g the f<strong>in</strong>al two periods, prices improved, but their FOTshare rema<strong>in</strong>ed the lowest <strong>in</strong> the region.Second, <strong>and</strong> perhaps a surprise, FOT shares <strong>in</strong> Zambia <strong>and</strong> Zimbabwe (concentratedsectors) were relatively high <strong>in</strong> the five years follow<strong>in</strong>g reform, evenmatch<strong>in</strong>g those <strong>in</strong> Tanzania <strong>and</strong> Ug<strong>and</strong>a, which had more competitive sectors.Shares <strong>in</strong> both Zambia <strong>and</strong> Zimbabwe, however, dropped sharply dur<strong>in</strong>g 2000to 2005, clearly underperform<strong>in</strong>g Tanzania <strong>and</strong> Ug<strong>and</strong>a. We observe that thenewly privatized sectors <strong>in</strong> both Zimbabwe <strong>and</strong> Zambia were mak<strong>in</strong>g particularefforts to attract additional smallholders to cotton dur<strong>in</strong>g 1995–99, while thefall <strong>in</strong> price shares dur<strong>in</strong>g 2000–05 can be attributed to the fact that the sectorsdid not pass on to farmers the benefits <strong>of</strong> higher quality premiums on worldmarkets (Zambia) or a major real exchange rate devaluation (Zimbabwe). The1995–99 experience shows that farmers can receive reasonable prices underconcentrated systems, while the 2000–05 experience shows that, <strong>in</strong> the absence<strong>of</strong> appropriate regulation, farmers are vulnerable to changes <strong>in</strong> the objectivesor conduct <strong>of</strong> the dom<strong>in</strong>ant firms.Third, consider<strong>in</strong>g the entire 10 years s<strong>in</strong>ce 1995 (the postreform era <strong>in</strong>ESA), Tanzania <strong>and</strong> Ug<strong>and</strong>a clearly paid a higher share <strong>of</strong> FOT to farmers thanany other country <strong>in</strong> the region. Both sectors have competitive structures. However,although competition rema<strong>in</strong>s unregulated <strong>in</strong> Tanzania, it has becomehighly regulated <strong>in</strong> Ug<strong>and</strong>a s<strong>in</strong>ce 2003. In Ug<strong>and</strong>a, the cont<strong>in</strong>u<strong>in</strong>g attractiveprices are likely the result <strong>of</strong> g<strong>in</strong>ners’ need to <strong>in</strong>crease capacity utilization (verylow at about 20 percent), their knowledge that farmers <strong>in</strong> Ug<strong>and</strong>a move <strong>in</strong> <strong>and</strong>out <strong>of</strong> cotton based largely on relative prices (a dynamic seen much less <strong>in</strong>WCA), <strong>and</strong> therefore the need to pay attractive prices if the g<strong>in</strong>ners are to attractgrowers. In Tanzania over the past few years, g<strong>in</strong>ners have become more sophisticatedregard<strong>in</strong>g knowledge <strong>of</strong> global market prices <strong>and</strong> trends, ability to negotiatewith buyers, underst<strong>and</strong><strong>in</strong>g <strong>of</strong> price exposure, <strong>and</strong> use <strong>of</strong> market-basedapproaches to mitigate that risk.PRICING SYSTEMS AND PRICES PAID TO GROWERS 71
F<strong>in</strong>ally, FOT price shares <strong>in</strong> WCA rose sharply through the 2000–05 period,reflect<strong>in</strong>g (a) the greater role <strong>of</strong> farmer organizations (supported by politicalpressures) <strong>in</strong> the price-sett<strong>in</strong>g process dur<strong>in</strong>g that time <strong>and</strong> (b) the reluctance<strong>of</strong> stakeholders to reduce producer prices. In fact, over this period, priceshares <strong>in</strong> every WCA country exceeded those <strong>in</strong> every ESA country. Clearly,however, these prices are not susta<strong>in</strong>able, as evidenced by the huge sectoraldeficits generated <strong>in</strong> every country except Cameroon. 4572 BAFFES, TSCHIRLEY, AND GERGELY
CHAPTER SIXInput Credit <strong>and</strong> ExtensionDavid TschirleyConcern about <strong>in</strong>put credit provision has long been at the center <strong>of</strong>debates regard<strong>in</strong>g cotton sector reform <strong>in</strong> Sub-Saharan <strong>Africa</strong> (SSA).This concern is underst<strong>and</strong>able <strong>in</strong> light <strong>of</strong> the widespread failure <strong>of</strong><strong>in</strong>put <strong>and</strong>, especially, credit markets <strong>in</strong> SSA. 46 The ability to supply large numbers<strong>of</strong> farmers with <strong>in</strong>put credit <strong>and</strong> extension <strong>and</strong> to recover that credit wasthe driv<strong>in</strong>g force <strong>in</strong> the spectacular expansion <strong>of</strong> cotton production <strong>in</strong> West<strong>and</strong> Central <strong>Africa</strong> (WCA) from 1955 to 1995. That ability was made all themore impressive by the region’s poor agro-ecological conditions. Such provisionhas also been a necessary condition for reestablish<strong>in</strong>g cotton <strong>in</strong> Mozambiqueafter its civil war <strong>and</strong> for the crop’s rapid expansion <strong>in</strong> Zambia s<strong>in</strong>ce1994. The typology <strong>in</strong> chapter 4 was heavily <strong>in</strong>formed by this issue, suggest<strong>in</strong>gthat more-concentrated sectors would be best able to ensure provision <strong>and</strong>repayment <strong>of</strong> <strong>in</strong>put credit <strong>and</strong> some level <strong>of</strong> extension advice, while bothwould likely be underm<strong>in</strong>ed by side sell<strong>in</strong>g <strong>in</strong> more competitive sectors. It wasfurther suggested that monopolies would perform well on <strong>in</strong>put provision <strong>and</strong>repayment, while the adequacy <strong>and</strong> efficiency <strong>of</strong> the <strong>in</strong>put <strong>and</strong> extension packagemight deteriorate over time by not adapt<strong>in</strong>g to chang<strong>in</strong>g conditions. Thecountry case studies confirm these general hypotheses while provid<strong>in</strong>g detail<strong>and</strong> nuance that are relevant to sectoral policy discussions. This chapter brieflydiscusses approaches to <strong>and</strong> performance <strong>of</strong> <strong>in</strong>put credit <strong>and</strong> extension acrossthe eight countries, 47 organized around the typology <strong>of</strong> chapter 4, before clos<strong>in</strong>gwith general lessons learned.73
MALI AND CAMEROON: GOVERNMENT MONOPOLIESTHAT SHOW SIMILAR STRENGTHS AND WEAKNESSESMali <strong>and</strong> Cameroon, along with Burk<strong>in</strong>a Faso, share similar approaches to <strong>in</strong>putcredit <strong>and</strong> extension, <strong>in</strong>spired by the “West <strong>Africa</strong>n model” <strong>of</strong> cotton promotion.The model features exhaustive coverage <strong>of</strong> farmers <strong>in</strong> agro-ecologicallysuitable areas with a st<strong>and</strong>ard <strong>in</strong>-k<strong>in</strong>d credit package that <strong>in</strong>cludes about 50 kg<strong>of</strong> urea <strong>and</strong> 100 to 150 kg <strong>of</strong> compound fertilizer per hectare (ha), about six<strong>in</strong>secticide sprays per season, herbicides for some farmers, treated <strong>and</strong> reasonablywell-ma<strong>in</strong>ta<strong>in</strong>ed seed, <strong>and</strong> widespread adoption <strong>of</strong> animal traction. For manyyears, this <strong>in</strong>put package was accompanied by a network <strong>of</strong> extension agents <strong>in</strong>charge <strong>of</strong> advis<strong>in</strong>g on agricultural best practices <strong>and</strong> technical it<strong>in</strong>eraries forimproved cotton cultivation. Most cotton sectors <strong>in</strong> WCA also now <strong>in</strong>cludean elaborate structure <strong>of</strong> village cotton farmer organizations configured <strong>in</strong>toregional <strong>and</strong> national “apex” organizations. These apex organizations, alongwith g<strong>in</strong>n<strong>in</strong>g companies, form—or are <strong>in</strong> the process <strong>of</strong> form<strong>in</strong>g—“<strong>in</strong>terpr<strong>of</strong>essional”bodies with responsibility to make jo<strong>in</strong>t decisions about <strong>in</strong>putsupply <strong>and</strong> pric<strong>in</strong>g, among other factors. Notably, the government is not part<strong>of</strong> these <strong>in</strong>terpr<strong>of</strong>essional bodies, except through its ownership stake <strong>in</strong> thecotton company.Objective <strong>in</strong>dicators <strong>of</strong> <strong>in</strong>put system performance are comparable acrossMali <strong>and</strong> Cameroon:■■■Input packages are nearly identical <strong>in</strong> composition <strong>and</strong> cost, <strong>and</strong> coverage<strong>of</strong> farmers is exhaustive <strong>in</strong> the ma<strong>in</strong> cottor zones <strong>of</strong> each country.Average yields are about 200 kg (<strong>of</strong> seed cotton) per ha higher <strong>in</strong> Cameroon,but this difference may be due to agro-ecological factors more than to <strong>in</strong>putquality (yields <strong>in</strong> the extreme north <strong>of</strong> Cameroon are nearly identical tothose <strong>in</strong> Mali).Yields are trend<strong>in</strong>g down at about the same rate <strong>in</strong> each country, related atleast <strong>in</strong> part to higher cost <strong>and</strong> thus lower use <strong>of</strong> fertilizers.Two key differences <strong>in</strong> <strong>in</strong>put <strong>and</strong> extension systems <strong>in</strong> the two countries areworth not<strong>in</strong>g. First, Cameroon’s producer organizations are substantiallystronger <strong>and</strong> play an active role, <strong>in</strong> collaboration with SODECOTON, <strong>in</strong> <strong>in</strong>putprocurement, pric<strong>in</strong>g, <strong>and</strong> distribution; credit recovery; <strong>and</strong> provision <strong>of</strong>extension services. Associations <strong>of</strong> larger, higher-yield<strong>in</strong>g farmers <strong>in</strong>Cameroon employ <strong>and</strong> pay extension staff members. Organisation des Producteursde Coton du Cameroun, the national apex organization, employs 76tra<strong>in</strong>ers to strengthen village-level associations. In Mali, the national apexorganization does not yet exist, <strong>and</strong> it will likely take several years for the systemto ga<strong>in</strong> the f<strong>in</strong>ancial <strong>and</strong> operational strength already seen <strong>in</strong> Cameroon.A second key difference is that management <strong>of</strong> SODECOTON may bemore attuned to opportunities to improve performance <strong>and</strong> reduce costs74 TSCHIRLEY
<strong>in</strong> its operations. One example is that it imports generic bulk <strong>in</strong>secticides thatfarmers mix <strong>in</strong> the field. SODECOTON claims that these products arecheaper <strong>and</strong> that it is able to use them because <strong>of</strong> the relatively dense network<strong>of</strong> field agents, who are able to dissem<strong>in</strong>ate pesticide preparation techniquesto farmers.LOCAL MONOPOLIES: VASTLY DIFFERING HISTORIESCOMPLICATE COMPARATIVE ASSESSMENT INMOZAMBIQUE AND BURKINA FASOBurk<strong>in</strong>a Faso moved to a local monopoly system with three firms <strong>in</strong> 2004, <strong>in</strong>the midst <strong>of</strong> a huge boom <strong>in</strong> cotton production made possible by many years<strong>of</strong> <strong>in</strong>vestment <strong>in</strong> research, <strong>in</strong>put credit, <strong>and</strong> extension, as well as by relativelyhigh prices paid to farmers s<strong>in</strong>ce 2000. 48 In sharp contrast, Mozambique createdits local monopoly system <strong>in</strong> the late 1980s, as civil war still raged <strong>and</strong> afternational production had fallen below 10,000 tons <strong>of</strong> seed cotton. Even beforethe civil war <strong>and</strong> the economy’s collapse, cotton production <strong>in</strong> Mozambiqueused far fewer external <strong>in</strong>puts than did the sector <strong>in</strong> Burk<strong>in</strong>a Faso. One area <strong>in</strong>which the countries show similar performance is <strong>in</strong> the share <strong>of</strong> all farmersgrow<strong>in</strong>g cotton <strong>in</strong> the cotton zones: 85 percent across Burk<strong>in</strong>a Faso’s wholecotton zone, <strong>and</strong> as high as 80 percent <strong>in</strong> Mozambique’s cotton belt.In reform<strong>in</strong>g its cotton sector, Mozambique returned to the concession (orlocal monopoly) model prevalent dur<strong>in</strong>g the colonial era. Key themes dur<strong>in</strong>gthe postreform era have been the absence <strong>of</strong> any systematic approach to evaluat<strong>in</strong>g<strong>and</strong> reaward<strong>in</strong>g concession areas, extremely weak farmer organizationsunable to negotiate with g<strong>in</strong>ners or provide services themselves, widely divergentperformance between early <strong>in</strong>vestors <strong>and</strong> new entrants (most <strong>of</strong> the latteraffiliated with <strong>in</strong>ternational cotton trad<strong>in</strong>g firms), recurrent credit defaultcrises, <strong>and</strong> the government’s openness to new <strong>in</strong>vestment, albeit always with<strong>in</strong>the concession model. Until recently, the country clearly lagged beh<strong>in</strong>d itsneighbors <strong>in</strong> productivity, though new entrants s<strong>in</strong>ce the early 2000s havebegun to change this <strong>in</strong> some areas <strong>of</strong> the country.Key lessons from Mozambique’s experience are, first, that a local monopolysystem does not elim<strong>in</strong>ate the possibility <strong>of</strong> credit default crises. If <strong>in</strong>vestmentopportunities <strong>and</strong> regulatory capacity <strong>in</strong> a country are limited, the cotton sectoris likely to attract new entrants, lead<strong>in</strong>g to side sell<strong>in</strong>g <strong>and</strong> <strong>in</strong>creased credit default.Eventual decl<strong>in</strong>e <strong>in</strong> seasonal <strong>in</strong>put credit <strong>and</strong> extension services is usually theresult; <strong>in</strong> fact, both services are weakest, with extension almost nonexistent, <strong>in</strong> theareas most affected by credit default. Second, policy makers <strong>in</strong> local monopolysystems must select <strong>in</strong>vestors carefully. All companies <strong>in</strong> Mozambique face thesame, very weak, government regulatory capacity. Yet some companies have chosento <strong>in</strong>vest <strong>in</strong> improved <strong>in</strong>put supply <strong>and</strong> some extension, while others haveoperated for many years much like the new entrants <strong>in</strong> Zimbabwe, thus provid<strong>in</strong>gm<strong>in</strong>imal quantities <strong>of</strong> poor quality <strong>in</strong>put <strong>and</strong> little or no extension advice.INPUT CREDIT AND EXTENSION 75
Significant <strong>in</strong> Mozambique, the companies mak<strong>in</strong>g the more aggressive<strong>in</strong>vestments are all affiliates <strong>of</strong> mult<strong>in</strong>ational cotton trad<strong>in</strong>g firms: Dunavant,Plexus, <strong>and</strong> Companhia Nacional de Algodão (Mozambique) (affiliated withDéveloppement des Agro-Industries du Sud). These firms have all chosen to<strong>in</strong>vest outside the traditional cotton grow<strong>in</strong>g zone <strong>of</strong> Nampula.In Burk<strong>in</strong>a Faso, the division <strong>of</strong> SOFITEX <strong>in</strong>to three companies <strong>in</strong> 2004changed very little with regard to <strong>in</strong>put credit <strong>and</strong> extension; the West <strong>Africa</strong>model discussed earlier cont<strong>in</strong>ues to be applied, though it seems likely that thesevere f<strong>in</strong>ancial difficulties <strong>of</strong> 2006 <strong>and</strong> 2007 have prevented companies frommak<strong>in</strong>g much progress on their stated desires to modify <strong>in</strong>put <strong>and</strong> extensionpackages. A key po<strong>in</strong>t to keep <strong>in</strong> m<strong>in</strong>d as Burk<strong>in</strong>a Faso moves down its reformpath is that, despite the very developed structure <strong>and</strong> strong coverage <strong>of</strong> farmergroups with<strong>in</strong> cotton areas, operational capacities rema<strong>in</strong> weak. AlthoughUnion Nationale des Producteurs de Coton du Burk<strong>in</strong>a <strong>and</strong> its regional unionsdo receive <strong>and</strong> distribute <strong>in</strong>puts to members <strong>and</strong> organize the cotton market,neither is <strong>in</strong> a position to take over the importation <strong>and</strong> distribution <strong>of</strong> <strong>in</strong>putsto villages. Until this change can happen, seasonal <strong>in</strong>put credit from cottoncompanies will be critical to the sector’s success.COMPETITIVE SECTORS: TANZANIA AND UGANDASTRUGGLE AND TAKE VERY DIFFERENT PATHS TOENSURE INPUT SUPPLY, EXTENSION, AND QUALITYThe prereform, cooperative-based cotton systems <strong>in</strong> Tanzania <strong>and</strong> Ug<strong>and</strong>a 49transformed quickly after reform <strong>in</strong>to highly competitive markets with 20 to 30<strong>in</strong>dependent buyers vy<strong>in</strong>g for farmer production. Price competition was <strong>in</strong>tense<strong>and</strong> farm prices improved, but each country witnessed the collapse <strong>of</strong> its <strong>in</strong>putsupply <strong>and</strong> extension system. As a result, the two countries <strong>in</strong> East <strong>and</strong> Southern<strong>Africa</strong> (ESA) that most closely approached the competitive ideal <strong>in</strong> market structuresaw the most direct <strong>and</strong> persistent government <strong>in</strong>volvement <strong>in</strong> efforts toensure <strong>in</strong>put provision to farmers.Initial efforts <strong>in</strong> both countries <strong>in</strong>volved sectorwide coord<strong>in</strong>ation <strong>of</strong> <strong>in</strong>putprovision—Tanzania’s <strong>Cotton</strong> Development Fund (CDF) created <strong>in</strong> 1999, <strong>and</strong>Ug<strong>and</strong>a’s similar collaborative approach between g<strong>in</strong>ners <strong>and</strong> the country’spublic <strong>Cotton</strong> Development <strong>Organization</strong>—so that g<strong>in</strong>ners could concentrateon competition <strong>in</strong> the output market. Each approach achieved some successbut failed after two years because <strong>of</strong> management <strong>and</strong> design problems.S<strong>in</strong>ce these <strong>in</strong>itial failed attempts, the two countries have moved <strong>in</strong> dramaticallydifferent directions. Start<strong>in</strong>g about 2002, first <strong>in</strong>formally <strong>and</strong> thenthrough formal agreement, Ug<strong>and</strong>a elim<strong>in</strong>ated competition <strong>in</strong> the outputmarket to facilitate <strong>in</strong>put supply <strong>and</strong> extension by g<strong>in</strong>ners (see Baffes 2008).Meanwhile, Tanzania ma<strong>in</strong>ta<strong>in</strong>ed a competitive output market <strong>and</strong> implemented<strong>in</strong>novations <strong>in</strong> its approach to provid<strong>in</strong>g some m<strong>in</strong>imal level <strong>of</strong> <strong>in</strong>putto farmers (Poulton <strong>and</strong> Maro 2007). Ug<strong>and</strong>a’s zonal quota system featuredcollaborative production plann<strong>in</strong>g among two to three g<strong>in</strong>ners <strong>in</strong> each <strong>of</strong> 1176 TSCHIRLEY
zones, prohibited movement <strong>of</strong> seed cotton across zones, <strong>and</strong> facilitated sale<strong>of</strong> <strong>in</strong>puts at 50 percent <strong>of</strong> cost, with the subsidy implicitly collected <strong>in</strong> theprice paid to farmers. Extension was a heavy focus <strong>in</strong> the system, with 7,000demonstration plots <strong>and</strong> tra<strong>in</strong><strong>in</strong>g days f<strong>in</strong>anced two-thirds by g<strong>in</strong>ners <strong>and</strong>one-third by the U.S. Agency for International Development. The consensusamong g<strong>in</strong>ners <strong>and</strong> observers was that <strong>in</strong>put supply <strong>and</strong> extension would bedrastically reduced if the zona system, or some variant <strong>of</strong> it, was not <strong>in</strong> place.Despite these major efforts at <strong>in</strong>put supply <strong>and</strong> extension, production <strong>in</strong>Ug<strong>and</strong>a did not consistently rise above 20,000 to 25,000 tons <strong>of</strong> l<strong>in</strong>t. In h<strong>in</strong>dsight,it appears clear that a short-lived production boom <strong>in</strong> 2004 <strong>and</strong> 2005 wasprimarily due to high prices <strong>in</strong> the two preced<strong>in</strong>g years (Baffes, backgroundpaper on Ug<strong>and</strong>a, 2007). As a result <strong>of</strong> the <strong>in</strong>ability to boost production, stakeholders<strong>in</strong> 2007 decided to ab<strong>and</strong>on the zonal quota system, though it is notclear at this po<strong>in</strong>t what has replaced that system.Under Tanzania’s passbook system <strong>in</strong>troduced <strong>in</strong> 2003, farmers sell<strong>in</strong>g cottonreceive a stamp <strong>in</strong> their passbooks that entitles them to seed or chemicals 50the next year proportional to the amount <strong>of</strong> cotton they sold. For most farmers,the entitlement amounts to one or two chemical sprays <strong>and</strong> some seed (notenough for a full plant<strong>in</strong>g) the follow<strong>in</strong>g year. The system is funded by a levypaid by g<strong>in</strong>ners to CDF, which funds the importation <strong>of</strong> <strong>in</strong>secticides by privatecompanies. Field <strong>in</strong>terviews by Poulton <strong>and</strong> Maro (2007) suggest that the systemhas been “one contributory factor toward the major resurgence <strong>in</strong> cottonproduction <strong>in</strong> 2004 <strong>and</strong> 2005,” but the authors conclude that “the system canmake only a limited contribution to the <strong>in</strong>tensification <strong>of</strong> cotton production <strong>in</strong>Tanzania,” because it can f<strong>in</strong>ance only limited <strong>in</strong>secticide sprays <strong>and</strong> no fertilizerapplications, <strong>and</strong> it does noth<strong>in</strong>g to provide extension assistance.Geographical factors may provide some explanation for why these twocountries, with very similar prereform histories <strong>and</strong> nearly identical structuresafter reform, chose (for a time) such different approaches to solv<strong>in</strong>g the <strong>in</strong>putcredit <strong>and</strong> extension problem. As long as the north <strong>of</strong> Ug<strong>and</strong>a was closed, thescope for exp<strong>and</strong><strong>in</strong>g cotton production under a low <strong>in</strong>put approach was farlower than <strong>in</strong> Tanzania. G<strong>in</strong>ners <strong>in</strong> Ug<strong>and</strong>a were thus forced to <strong>in</strong>crease production<strong>in</strong> relatively small areas already under production. The fact that thesector ab<strong>and</strong>oned the quota system at the same time that the north began toopen up lends some support to this argument.CONCENTRATED, MARKET-BASED SECTORS: ZIMBABWEAND ZAMBIA PERFORM WELL ON INPUT CREDIT ANDEXTENSION, BUT FACE INSTABILITYThe two countries <strong>in</strong> ESA with s<strong>in</strong>gle-channel market<strong>in</strong>g systems before reformma<strong>in</strong>ta<strong>in</strong>ed relatively concentrated sectors for several years after reform. Each hasperformed much better on <strong>in</strong>put provision <strong>and</strong> extension than have Tanzania<strong>and</strong> Ug<strong>and</strong>a. However, each has faced substantial structural <strong>in</strong>stability that hasaffected both services.INPUT CREDIT AND EXTENSION 77
Zimbabwe transitioned dur<strong>in</strong>g the 1980s from a sector dom<strong>in</strong>ated by whitecommercial farmers to one with almost no such farmers, while build<strong>in</strong>g systemsfor effective <strong>in</strong>put credit supply <strong>and</strong> extension assistance to a substantialm<strong>in</strong>ority <strong>of</strong> the new smallholder farmers. The cotton company <strong>of</strong> Zimbabwe(COTTCO), the private company that emerged out <strong>of</strong> the government-owned<strong>Cotton</strong> Market<strong>in</strong>g Board with a market share <strong>of</strong> around 70 percent, cont<strong>in</strong>uedthis effective performance <strong>in</strong>to at least the early 2000s <strong>and</strong> enjoyed creditrepayment <strong>of</strong> 95 percent or higher <strong>in</strong> most years. Cargill, its ma<strong>in</strong> competitor,did not develop a credit system until 2002/03 but <strong>in</strong>vested <strong>in</strong> extension supportthat encouraged loyalty from beneficiary farmers.Between 2001 <strong>and</strong> 2006, the number <strong>of</strong> seed cotton buyers <strong>in</strong> Zimbabwe rosefrom 5 to 17, spurred by a fall <strong>in</strong> the real prices paid to farmers by the majorplayers. 51 Credit default <strong>in</strong>creased, <strong>and</strong> COTTCO dramatically reduced <strong>in</strong>putcredit <strong>in</strong> 2004/05. Though the company has s<strong>in</strong>ce exp<strong>and</strong>ed its system aga<strong>in</strong>,credit default rema<strong>in</strong>s a major problem. Draft regulations to deal with the situationwere developed <strong>in</strong> 2004 but were never enacted. Dur<strong>in</strong>g the 2006/07season, the sector <strong>in</strong>troduced a requirement that cotton companies must providesome <strong>in</strong>put to producers to receive an export permit <strong>in</strong> future years.An unusual result <strong>of</strong> Zimbabwe’s move to a less concentrated system is thata substantially larger share <strong>of</strong> farmers received some form <strong>of</strong> <strong>in</strong>put credit <strong>in</strong>2006 than <strong>in</strong> the early 2000s. Whereas about 40 percent <strong>of</strong> growers receivedcredit from COTTCO or another company <strong>in</strong> 2002, nearly 95 percent receivedsome type <strong>of</strong> support <strong>in</strong> 2006. However, regulation was a key driver <strong>of</strong> thisresult, <strong>and</strong> newer companies tend to provide seed <strong>of</strong> uncerta<strong>in</strong> quality, little orno <strong>in</strong>secticide, <strong>and</strong> no extension advice. As noted earlier, the entry <strong>of</strong> these newcompanies was also accompanied by large <strong>in</strong>creases <strong>in</strong> credit default amongfarmers. In an echo <strong>of</strong> patterns seen <strong>in</strong> Zambia <strong>and</strong> especially <strong>in</strong> Mozambique,widespread provision <strong>of</strong> very <strong>in</strong>adequate <strong>in</strong>put packages (<strong>and</strong> no extensionadvice) has <strong>of</strong>ten been used as pretext to buy <strong>in</strong>discrim<strong>in</strong>ately dur<strong>in</strong>g the harvest.To the extent that this practice is happen<strong>in</strong>g <strong>in</strong> Zimbabwe, the apparent<strong>in</strong>crease <strong>in</strong> credit provision may underm<strong>in</strong>e such <strong>in</strong>put credit <strong>and</strong> extensionprovision <strong>in</strong> the longer term.Zambia’s cotton sector built relatively effective <strong>in</strong>put credit <strong>and</strong> extensionsystems <strong>in</strong> the years follow<strong>in</strong>g reform <strong>in</strong> 1994, consistently provid<strong>in</strong>g farmerswith high-quality treated seed, four to six annual <strong>in</strong>secticide treatments,<strong>and</strong> (for the 20 percent or 30 percent <strong>of</strong> farmers that the ma<strong>in</strong> companiesconsider their best <strong>and</strong> most reliable) foliar feed fertilizers on 100 percentcredit terms. Both major firms also stressed fundamentally sound agronomicpractices with farmers, <strong>and</strong> Dunavant has attracted outside fund<strong>in</strong>g to supportextension. Typical credit repayment was above 95 percent for Clark <strong>and</strong>above 85 percent for Dunavant. As a result, the sector has seen slow butsteady <strong>in</strong>creases <strong>in</strong> the yields <strong>of</strong> established farmers <strong>and</strong> a near tripl<strong>in</strong>g <strong>of</strong> thetotal number <strong>of</strong> farmers grow<strong>in</strong>g cotton s<strong>in</strong>ce 2000 (Tschirley, Zulu, <strong>and</strong>Shaffer 2004).78 TSCHIRLEY
Despite the f<strong>in</strong>ancial strength <strong>and</strong> high market shares <strong>of</strong> the two ma<strong>in</strong>companies, Zambia’s cotton sector has experienced two severe credit defaultcrises s<strong>in</strong>ce reform. The crisis <strong>of</strong> 1998–2000 was overcome when Dunavant <strong>and</strong>Clark strengthened their <strong>in</strong>put credit supply <strong>and</strong> recovery <strong>and</strong> (especially forClark/Cargill 52 ) extension systems, <strong>and</strong> when they demonstrated to most farmersthe benefits <strong>of</strong> rema<strong>in</strong><strong>in</strong>g loyal to the company. As a result, the credit defaultproblem receded, <strong>and</strong> production boomed through the 2006 harvest season. Thesecond credit default crisis occurred <strong>in</strong> 2006 <strong>and</strong> 2007, aga<strong>in</strong> spurred by the entry<strong>of</strong> new companies. 53 Unlike <strong>in</strong> 1998–2000, it appears likely that at least some <strong>of</strong>these new companies will be able to rema<strong>in</strong> important players <strong>in</strong> the sector.As <strong>in</strong> Zimbabwe, the sector is struggl<strong>in</strong>g to f<strong>in</strong>d a regulatory approach to dealwith these stresses. Dunavant <strong>and</strong> Cargill, along with two <strong>of</strong> the emerg<strong>in</strong>g companies<strong>and</strong> farmers (represented by the <strong>Cotton</strong> Association <strong>of</strong> Zambia), arepush<strong>in</strong>g for submission by the government to Parliament <strong>of</strong> the revised <strong>Cotton</strong>Act, which would create a cotton board with power to regulate the sector butnot to participate as a buyer or seller. Also as proposed <strong>in</strong> Zimbabwe, g<strong>in</strong>ners<strong>and</strong> buyers would have to abide by specified rules <strong>of</strong> conduct to be granted alicense, <strong>and</strong> they could be subject to f<strong>in</strong>es <strong>and</strong> seizure <strong>of</strong> cotton if shown to be<strong>in</strong>volved <strong>in</strong> the promotion <strong>of</strong> side sell<strong>in</strong>g.A key po<strong>in</strong>t emerg<strong>in</strong>g from this review is that—<strong>in</strong> the weak <strong>in</strong>stitutional <strong>and</strong>regulatory environment typical <strong>of</strong> SSA—concentrated, market-based systemsmay be unstable, with a recurr<strong>in</strong>g tendency to move to a more competitivestructure (box 6.1). Tipp<strong>in</strong>g po<strong>in</strong>ts may exist, <strong>in</strong> which the entry <strong>of</strong> two or threeadditional companies can dramatically change the prospects <strong>of</strong> coord<strong>in</strong>ationBox 6.1The Instability <strong>of</strong> Concentrated SystemsConcentrated sectors <strong>of</strong>fer great advantages <strong>in</strong> SSA but have tended to beunstable. The two concentrated sectors <strong>in</strong> this study—Zimbabwe <strong>and</strong> Zambia—have performed well on <strong>in</strong>put credit <strong>and</strong> l<strong>in</strong>t quality but unevenly over time onseed cotton pric<strong>in</strong>g. This observation suggests that, over the medium term <strong>in</strong>most <strong>of</strong> SSA, a concentrated sector is likely to be a more attractive optionthan national monopolies or highly competitive systems, especially if an appropriateregulatory framework can be put <strong>in</strong> place to encourage consistently remunerativepric<strong>in</strong>g. Both Zambia <strong>and</strong> Zimbabwe have had difficulty ma<strong>in</strong>ta<strong>in</strong><strong>in</strong>gconcentrated structures s<strong>in</strong>ce 2000; this problem appears to have been related tothe pric<strong>in</strong>g <strong>of</strong> seed cotton. In Zimbabwe, the duopoly that emerged out <strong>of</strong>reform <strong>in</strong> 1994 has, s<strong>in</strong>ce 2002, been <strong>in</strong>creas<strong>in</strong>gly challenged by new competitors.These competitors now number at least 15 <strong>and</strong> had a comb<strong>in</strong>ed marketshare <strong>of</strong> 25 percent <strong>in</strong> 2006. Zambia also emerged from reform with a duopoly,went through one period <strong>of</strong> <strong>in</strong>tense competition from new entrants <strong>in</strong> the late1990s, <strong>and</strong> has been <strong>in</strong> the midst <strong>of</strong> another such episode s<strong>in</strong>ce 2006 .(cont<strong>in</strong>ued)INPUT CREDIT AND EXTENSION 79
Box 6.1 (Cont<strong>in</strong>ued)A move from a concentrated system toward a competitive one <strong>in</strong>volves aqualitative change <strong>in</strong> the nature <strong>of</strong> competition with<strong>in</strong> the sector: from competitionfor producers at the start <strong>of</strong> the season (with those producers thenreceiv<strong>in</strong>g a range <strong>of</strong> preharvest services to assist their production) to pricecompetition for seed cotton at harvest time (with <strong>in</strong>centives for provid<strong>in</strong>g preharvestsupport underm<strong>in</strong>ed by side sell<strong>in</strong>g). In both Zimbabwe <strong>and</strong> Zambia,<strong>in</strong>creased competition has underm<strong>in</strong>ed <strong>in</strong>put credit provision; <strong>in</strong> Zimbabwe,it also underm<strong>in</strong>ed the country’s previous reputation for high-quality l<strong>in</strong>t(chapter 7). Worse, competition may underm<strong>in</strong>e <strong>in</strong>put credit or l<strong>in</strong>t quality—with long-term consequences for the <strong>in</strong>dustry—before it has any positiveeffect on prices paid to farmers. For example, there is little evidence that<strong>in</strong>creased competition <strong>in</strong> Zimbabwe has yet improved the seed cotton pricesreceived by the majority <strong>of</strong> farmers. F<strong>in</strong>ally, while movement from a concentratedto a more competitive system can happen quickly <strong>in</strong> the absence <strong>of</strong>appropriate regulation (see next section <strong>of</strong> this box), revers<strong>in</strong>g that changemay be more difficult (see text <strong>of</strong> this chapter). If, as this study suggests,highly competitive sectors are likely to perform poorly <strong>in</strong> most <strong>of</strong> SSA, thensuch structural change may impose long-term losses on these countries.Inadequate regulatory structures are a key reason for <strong>in</strong>stability. A key<strong>in</strong>sight from the typology <strong>in</strong> this book is that the appropriate roles <strong>of</strong> g<strong>in</strong>ners,farmers, <strong>and</strong> the government differ markedly across sector types. In concentratedsystems, governments need to provide an environment <strong>in</strong> which thesmall number <strong>of</strong> buyers can coord<strong>in</strong>ate <strong>in</strong>put credit provision <strong>and</strong> qualityenhancement, while ensur<strong>in</strong>g that farmers receive remunerative prices. Thissituation could suggest that limited barriers to entry be established <strong>in</strong> theform <strong>of</strong> conditional buy<strong>in</strong>g licenses so that only companies with a demonstratedcommitment to productivity <strong>and</strong> quality should be allowed <strong>in</strong>. Suchbarriers would avoid many <strong>of</strong> the damag<strong>in</strong>g consequences <strong>of</strong> uncontrollednew entry <strong>in</strong>to concentrated sectors, but barriers could also further reducethe effectiveness <strong>of</strong> new entry <strong>in</strong> rais<strong>in</strong>g seed cotton prices. For this reason, itis also suggested that more formalized approaches to price sett<strong>in</strong>g may beneeded to ensure remunerative prices to farmers. In the latter, strengthenedfarmer associations would be much preferred to direct government <strong>in</strong>volvement<strong>in</strong> price sett<strong>in</strong>g. In all cases, a government needs to carry out its rolecollaboratively with private <strong>in</strong>vestors <strong>and</strong> farmers.Though governments <strong>in</strong> ESA have a limited history <strong>of</strong> work<strong>in</strong>g <strong>in</strong> thisway, positive signs are emerg<strong>in</strong>g <strong>in</strong> both Zambia <strong>and</strong> Zimbabwe. In the former,the government worked closely with g<strong>in</strong>ners <strong>and</strong> farmers to proposerevisions to the <strong>Cotton</strong> Act, which is now await<strong>in</strong>g submission to Parliament.If enacted, the act would establish a reasonably balanced public–privateapproach to sector management. In Zimbabwe, actors are consider<strong>in</strong>g a code<strong>of</strong> good conduct that cotton companies must adhere to if they are to receivean export permit.(cont<strong>in</strong>ued)80 TSCHIRLEY
Box 6.1 (Cont<strong>in</strong>ued)This analysis suggests that lower prices (as a share <strong>of</strong> free-on-truck l<strong>in</strong>tvalue) paid by exist<strong>in</strong>g firms have been the major factor encourag<strong>in</strong>g newentry <strong>in</strong> Zimbabwe <strong>and</strong> Zambia. Because economies <strong>of</strong> scale <strong>in</strong> cotton process<strong>in</strong>gare relatively modest (especially where Indian roller g<strong>in</strong>n<strong>in</strong>g technologyis used), new <strong>in</strong>vestors can enter the sector quickly, even if they have nocapacity or background <strong>in</strong> promot<strong>in</strong>g <strong>in</strong>put use <strong>and</strong> farm-level productivity.In addition, government policy sometimes promotes new <strong>in</strong>vestment <strong>in</strong> g<strong>in</strong>n<strong>in</strong>gwithout underst<strong>and</strong><strong>in</strong>g the negative consequences this policy can br<strong>in</strong>g.This issue is an emerg<strong>in</strong>g are <strong>in</strong> Zambia, where the government has welcomedsubstantial new <strong>in</strong>vestment. The type <strong>of</strong> regulatory structure suggested earlierwould establish st<strong>and</strong>ards other than the theoretical competitive ideal forevaluat<strong>in</strong>g whether such <strong>in</strong>vestment will be healthy for the sector.for <strong>in</strong>put supply <strong>and</strong> extension (<strong>and</strong> quality control; see chapter 7). As thenumber <strong>of</strong> players rises, extension <strong>and</strong> <strong>in</strong>put credit are the first services to suffer,certa<strong>in</strong>ly <strong>in</strong> quality (<strong>in</strong> Zimbabwe) <strong>and</strong> also <strong>in</strong> the number <strong>of</strong> farmersserved (<strong>in</strong> Zambia). A key question that emerges is whether these systems willbe successful <strong>in</strong> their efforts to establish enforceable rules <strong>of</strong> the game thatallow enough competition to ensure good pric<strong>in</strong>g performance (see chapter 5)while safeguard<strong>in</strong>g credit repayment.CONCLUSIONSTable 6.1 summarizes the assessment <strong>of</strong> <strong>in</strong>put credit <strong>and</strong> extension performanceacross sector types. Realized performance matches expected performance mostclosely for competitive sectors <strong>and</strong> national monopolies. Ug<strong>and</strong>a, which defiedexpectations for competitively structured systems, did so only by elim<strong>in</strong>at<strong>in</strong>gcompetition among firms, at least until 2007. Concentrated, market-based systems<strong>and</strong> local monopolies show the greatest diversity <strong>in</strong> performance. The formercan perform quite well on <strong>in</strong>put credit <strong>and</strong> relatively well on extension, butthat performance can suddenly decl<strong>in</strong>e as a result <strong>of</strong> the <strong>in</strong>stability referred toabove. The sample <strong>of</strong> countries <strong>in</strong>cludes only one (Mozambique) where localmonopolies had existed for a sufficiently long time to allow reasonable assessment.Highly variable performance across concession companies <strong>in</strong> Mozambiquesuggests that policy makers must carefully select new <strong>in</strong>vestors with an eyetoward productivity <strong>and</strong> quality; affiliates <strong>of</strong> mult<strong>in</strong>ational cotton trad<strong>in</strong>g firmshave performed best <strong>in</strong> this regard <strong>in</strong> Mozambique.A key question that cuts across local monopolies <strong>and</strong> concentrated systemsconcerns the factors that favor or h<strong>in</strong>der the emergence <strong>of</strong> an effectiveregulatory approach featur<strong>in</strong>g active collaboration among g<strong>in</strong>ners <strong>and</strong>INPUT CREDIT AND EXTENSION 81
82Table 6.1 Summary <strong>of</strong> Input Supply <strong>and</strong> Extension SystemsIndicatorsCountryCurrentsectorstructure <strong>and</strong>governanceMechanisms forextension <strong>and</strong><strong>in</strong>put creditsupplyPercentage <strong>of</strong>cotton <strong>in</strong>putsourced<strong>in</strong>dependentlyby farmersReceiv<strong>in</strong>g somecotton <strong>in</strong>putcreditReceiv<strong>in</strong>g someextension advice;quality <strong>of</strong> adviceUs<strong>in</strong>g<strong>in</strong>organicfertilizersAdequacy <strong>and</strong>quality <strong>of</strong>packagereceived oncreditCostCreditrepaymentratesËËËËËLESS COMPETITIVEMaliCameroonNationalmonopolyNationalmonopolyExtension <strong>and</strong> <strong>in</strong>k<strong>in</strong>dcredit byCMDT t<strong>of</strong>armer throughcooperatives;littleoperational<strong>in</strong>volvement byfarmersExtension <strong>and</strong> <strong>in</strong>k<strong>in</strong>dcreditjo<strong>in</strong>tly managed<strong>and</strong> f<strong>in</strong>anced bySODECOTON<strong>and</strong> farmerapex; decreas<strong>in</strong>g<strong>in</strong>volvement <strong>of</strong>SODECOTONNegligibleNegligible, butreliance onSODECOTONis decreas<strong>in</strong>g≈ 100% cottonfarmers, >90%all farmers <strong>in</strong>cotton zones≈ 100% cottonfarmers, >90%all farmers <strong>in</strong>cotton zonesProvision comparableto <strong>in</strong>put credit;quality decl<strong>in</strong><strong>in</strong>gover timeProvision comparableto <strong>in</strong>put credit;quality trend notclear≈ 100%≈ 100%Treated seed, urea,compound,pesticides, someherbicides;questions aboutseed quality <strong>and</strong>appropriateness<strong>of</strong> fertilizerreceivedTreated seed, urea,compound,pesticides, someherbicides; littleor noadjustment todiffer<strong>in</strong>g agroecologicalconditionsSt<strong>and</strong>ard packageUS$119/ha(“at cost”)35%–45% <strong>of</strong>meanproductionvalueSt<strong>and</strong>ard packageUS$123/ha(“at cost”)35%–45% <strong>of</strong>meanproductionvalue95%; fell to90% asearly as200195%–99%.;fell to90% 2006Burk<strong>in</strong>a Faso Local monopoly Extension <strong>and</strong> <strong>in</strong>k<strong>in</strong>dcredit by3 companies t<strong>of</strong>armers, withsome limitedoperationalNegligible;<strong>in</strong>tention totransfer task t<strong>of</strong>armers, butlimited progress≈ 100% cottonfarmers, 85% <strong>of</strong>all farmersacross wholecotton zoneProvision comparableto <strong>in</strong>put credit;quality trend notclear≈ 100%Treated seed, urea,compound,pesticides, someherbicides; littleor noadjustmentSt<strong>and</strong>ard packageUS$171/ha45%–55%meanproductionvalue; seed95%
<strong>in</strong>volvement <strong>of</strong>farmerorganizationsto differ<strong>in</strong>gagro-ecologicalconditionssold at 55% <strong>of</strong>costMozambique Local monopoly Extension <strong>and</strong> <strong>in</strong>k<strong>in</strong>dcreditfrom g<strong>in</strong>n<strong>in</strong>gcompanies;highly variablequality;negligible<strong>in</strong>volvement <strong>of</strong>farmerorganizationsNegligible≈ 100% cottonfarmers, >80%all farmers <strong>in</strong>key cottonzonesNegligible <strong>in</strong> Nampula(center <strong>of</strong> creditdefault problems);substantially higheroutside Nampula≈ 0%Highly variableacrosscompanies; mix<strong>of</strong> treated <strong>and</strong>untreated seed;somepesticides; littleor no fertilizerHighly variable.TypicallyUS$10–US$3/ha, 10%–20%meanproductionvalue. Seedfree.Highlyvariable:60%–90%ËËËËËZambia Concentrated Extension <strong>and</strong><strong>in</strong>-k<strong>in</strong>d creditfrom ma<strong>in</strong>g<strong>in</strong>n<strong>in</strong>gcompanies; nooperational roleto date forfarmerorganizationsNegligible≈ 100% cottonfarmers,30%–35% allfarmers <strong>in</strong>cotton districtsProvision comparableto <strong>in</strong>put credit;quality typicallybetter fromCargill, thoughDunavant attractsoutside fund<strong>in</strong>g20%–30%(foliaronly,thoughnot justformicronutrients)Treated seed,pesticides (5–6sprays), somefoliar fertilizerfor 2 or 3 ma<strong>in</strong>companies; seed<strong>and</strong> limitedpesticides fromothersUS$20–US$30/ha, 10%–20%meanproductionvalue; someevidence thatsold abovemarket ratesTypically85%–98%.Fallsbelow70%dur<strong>in</strong>gperiodiccrisesZimbabweConcentrated(becom<strong>in</strong>gcompetitive)Extension <strong>and</strong> <strong>in</strong>k<strong>in</strong>dcreditfrom g<strong>in</strong>ners;highly variablequality; ma<strong>in</strong>companies(COTTCO,Cargill) highlyselective <strong>of</strong> bestfarmers, othersto get mostlypoor farmersUp to 60% early2000s, nowfall<strong>in</strong>g90%–95% cottonfarmers (upfrom 40% early2000s);70%–80% <strong>of</strong> allfarmers <strong>in</strong> ma<strong>in</strong>cotton zonesPrimarily fromCOTTCO <strong>and</strong>Cargill plus somefrom state beforeeconomic crisis;quality that washigh but moreattention to loanrecovery s<strong>in</strong>cenew entry45%,cover<strong>in</strong>gnearly90% <strong>of</strong>cottonareaCOTTCO: treatedseed, fertilizers,chemicals; somenewercompanies: onlyseed <strong>and</strong>limitedchemicalsCOTTCO:US$237/ha,43% meanproductionvalue;others:US$50–US$90/ha, 33%–39%meanproductionvalue90% hasfallens<strong>in</strong>ceearly2000s(cont<strong>in</strong>ued)83
84Table 6.1 (Cont<strong>in</strong>ued)IndicatorsCountryCurrentsectorstructure <strong>and</strong>governanceMechanisms forextension <strong>and</strong><strong>in</strong>put creditsupplyPercentage <strong>of</strong>cotton <strong>in</strong>putsourced<strong>in</strong>dependentlyby farmersReceiv<strong>in</strong>g somecotton <strong>in</strong>putcreditReceiv<strong>in</strong>g someextension advice;quality <strong>of</strong> adviceUs<strong>in</strong>g<strong>in</strong>organicfertilizersAdequacy <strong>and</strong>quality <strong>of</strong>packagereceived oncreditCostCreditrepaymentratesMORE COMPETITIVE ËËËËËTanzania Competitive No extension or<strong>in</strong>put credit;passbooksystem for<strong>in</strong>put supplyl<strong>in</strong>ked to“forced sav<strong>in</strong>gs”Ug<strong>and</strong>aHybrid(competitive)Cash sale byg<strong>in</strong>ners at 50%cost, implicitrecovery <strong>of</strong>subsidy <strong>in</strong> price;extensioncovered jo<strong>in</strong>tlyby g<strong>in</strong>ners <strong>and</strong>donors% outsidepassbook: seed75%, chemicals50%–75%≈ 20%; activesecondarymarket <strong>in</strong>subsidizedchemicals0% No private extension;public systemdrasticallyunderfunded(subsidized cashsale) ≈ 100%cotton farmersWidespreadextension <strong>and</strong>tra<strong>in</strong><strong>in</strong>g organizedarounddemonstrationplots, jo<strong>in</strong>tlyfunded by g<strong>in</strong>ners<strong>and</strong> donors1%–2% (Passbook, notcredit) Notreated seed;chemicalquantities<strong>in</strong>adequate forfull spray<strong>in</strong>gregime (2–3sprays for mostfarmers) (Implicit credit)Highly variable,as farmers freeto purchase<strong>in</strong>put they wish;all use treatedseed; nearly alluse some<strong>in</strong>secticidesSeedUS$1–US$2/ha; chemicalsvariable,depend<strong>in</strong>g onpassbookentitlement<strong>and</strong> cashpurchasesUS$6–US$8 formost farmers,6%–18% <strong>of</strong>productionvaluen.a.n.a.Source: Author’s compilation.Note: n.a. = Not applicable. Ug<strong>and</strong>a’s structure is competitive but its conduct through 2007 was not, as a result <strong>of</strong> the regional quota system. Its cotton sector is, therefore,classified as a hybrid <strong>in</strong> this book.CMDT = Compagnie Malienne de Développement des Fibres Textiles; ha = hectare; SODECOTON = .
farmers, <strong>and</strong> balanced <strong>in</strong>volvement <strong>of</strong> the government. The hypothesis isthat firms are motivated to collaborate by both fear <strong>of</strong> loss <strong>and</strong> desire for ga<strong>in</strong>,but that fear <strong>of</strong> loss may be the strongest motivator. 54 If this hypothesis is thecase, concentrated market-based systems, which provide the prospect <strong>of</strong> lossthrough competition, may provide better <strong>in</strong>centives for effective regulatoryapproaches. This expectation is conditioned by two factors. First, a history <strong>of</strong>collaborative decision mak<strong>in</strong>g matters. Second, strong farmer organizationscan impose losses on g<strong>in</strong>ners under local monopolies by boycott<strong>in</strong>g or otherwiseconfront<strong>in</strong>g behavior to which they object. In both situations, countries<strong>in</strong> WCA are <strong>in</strong> a better position to achieve effective collaborative regulationunder local monopoly set-ups than are countries <strong>in</strong> ESA.INPUT CREDIT AND EXTENSION 85
CHAPTER SEVENQuality ControlGérald Estur, Col<strong>in</strong> Poulton,<strong>and</strong> David TschirleyAs discussed <strong>in</strong> chapter 2, the fiber characteristics <strong>of</strong> <strong>Africa</strong>n cottons aretypically superior to those <strong>of</strong> the cottons used <strong>in</strong> the calculation <strong>of</strong> theCotlook A Index. Because it is nearly all h<strong>and</strong>picked, <strong>Africa</strong>n cotton isalso cleaner <strong>and</strong> has fewer neps than cotton <strong>of</strong> most other orig<strong>in</strong>s. For thesereasons, <strong>Africa</strong>n cotton could comm<strong>and</strong> as much as a US$0.10/lb premium on<strong>in</strong>ternational markets if the region could develop a reliable reputation for l<strong>in</strong>tuncontam<strong>in</strong>ated with foreign matter. 55 The typology suggests that concentratedsystems will be best able to achieve this potential premium, whereascompetitive systems are expected to show very limited ability to protect fiberquality <strong>and</strong> thus will achieve the lowest quality premiums (table 7.1). Thetypology predicts medium performance for national <strong>and</strong> local monopolies,with the ma<strong>in</strong> po<strong>in</strong>t be<strong>in</strong>g that actual performance depends critically on managementculture <strong>and</strong>, <strong>in</strong> local monopolies, regulatory effectiveness.Underly<strong>in</strong>g these predictions is an underst<strong>and</strong><strong>in</strong>g that two conditions mustbe satisfied if a sector is to produce high-quality l<strong>in</strong>t. First, g<strong>in</strong>ners must be ableto control their supply cha<strong>in</strong>s to receive high-quality seed cotton. G<strong>in</strong>n<strong>in</strong>g canonly protect or damage fiber quality; it cannot enhance it. Second, the farmersmust have the <strong>in</strong>centives to achieve high-quality l<strong>in</strong>t. This chapter <strong>in</strong>vestigatesthe extent to which these conditions hold <strong>in</strong> the study countries.The chapter first reviews common practices <strong>in</strong> each study country thataffect cotton quality, then develops estimates <strong>of</strong> the key quality <strong>in</strong>dicator foreach country—the average realized premium achieved <strong>in</strong> <strong>in</strong>ternational markets.It then exam<strong>in</strong>es performance across sector types <strong>and</strong> closes by compar<strong>in</strong>gexpected with realized performance.87
88Table 7.1 Summary Information on Quality Control Mechanisms <strong>and</strong> Results <strong>in</strong> Study CountriesCountrySector typeNumber<strong>of</strong>varietiesNumber<strong>of</strong> seedcottongradesStrictness<strong>of</strong> seedcottongrad<strong>in</strong>gShare <strong>of</strong> l<strong>in</strong>tclassed by<strong>in</strong>strumenttest<strong>in</strong>g(percent)Classificationrat<strong>in</strong>gShare <strong>of</strong>l<strong>in</strong>t classed1 1 ⁄8 <strong>in</strong>ches<strong>and</strong> above(percent)Reputation forcontam<strong>in</strong>ationOverallreputation<strong>and</strong> trendEstimatedweightedaveragepremiumoverCotlookA Index(US¢/lb)Ben<strong>in</strong> Hybrid 1 2 Lax 5 Average 76 Moderatelycontam<strong>in</strong>atedBurk<strong>in</strong>a FasoCameroonMaliMozambiqueLocalmonopolyNationalmonopolyNationalmonopolyLocalmonopoly3 3 Lax n.a. (samplebasis)2 2 Strict 0, butmicronairetests foreach baleGood 80 Moderatelycontam<strong>in</strong>ated<strong>and</strong> improv<strong>in</strong>gGood 65 Among mostaffected bystick<strong>in</strong>ess butimprov<strong>in</strong>gsharply2 3 Very lax 6 Average 98 Among themostcontam<strong>in</strong>ated8 2 Lax 0 Poor ~ 15–20 Moderatelycontam<strong>in</strong>atedGood butirregularGood,improv<strong>in</strong>gGood,improv<strong>in</strong>g(enteredf<strong>in</strong>e cottonmarketsegment)Average,improv<strong>in</strong>gPoor, possiblyimprov<strong>in</strong>g+1+1+20–2
Tanzania Competitive 1 2 Very lax n.a. (samplebasis)Average ~ 30–40 Among themostcontam<strong>in</strong>atedPoor, fell s<strong>in</strong>cereform–2Ug<strong>and</strong>aHybrid(competitivestructure)1 2 Very lax n.a. (samplebasis)Average 93 Among themostcontam<strong>in</strong>atedHigh butmuch lowerthan <strong>in</strong>1970sZambia Concentrated 3 3 Strict 70–80 Very good ~ 70–80 Very good High <strong>and</strong>improv<strong>in</strong>gZimbabweConcentrated(becom<strong>in</strong>gcompetitive)2 4 Very lax n.a. (samplebasis)Mixed ~ 70–80 Moderatelycontam<strong>in</strong>atedFell sharplys<strong>in</strong>ce 2002+1+4+3Sources: SONAPRA, SOFITEX, SODECOTON, Compagnie Malienne de Développement des Fibres Textiles, IAM, Tanzania <strong>Cotton</strong> Association,<strong>Cotton</strong> Development <strong>Organization</strong>, Dunavant, C. Poulton, <strong>in</strong>ternational traders.Note: n.a. = not applicable.89
IMPACT OF QUALITY ON EXPORT PRICES<strong>Cotton</strong> production has similar characteristics across Sub-Saharan <strong>Africa</strong> (SSA)countries that impact quality. Upl<strong>and</strong> cotton, grown on small-scale farms, isentirely ra<strong>in</strong> fed. Production is labor <strong>in</strong>tensive, us<strong>in</strong>g manual or ox-drawnimplements <strong>and</strong> relatively few purchased <strong>in</strong>puts, <strong>and</strong> all seed cotton is harvestedby h<strong>and</strong>. At national levels, <strong>Africa</strong>n cotton is relatively homogeneous <strong>in</strong>fiber characteristics, as a result <strong>of</strong> similar grow<strong>in</strong>g conditions <strong>and</strong> the low number<strong>of</strong> varieties planted <strong>in</strong> most countries. 56 However, variability with<strong>in</strong> balesis greater than <strong>in</strong> developed countries because the production <strong>of</strong> several farmerscan be mixed <strong>in</strong> a s<strong>in</strong>gle bale.The price <strong>of</strong> <strong>Africa</strong>n cotton on world markets is penalized by the way it ismarketed <strong>and</strong> shipped. <strong>Africa</strong>n shipments are less reliable, are less homogeneous<strong>in</strong> quality <strong>and</strong> packag<strong>in</strong>g, <strong>and</strong> have longer transit times than those <strong>of</strong> themajor competitors from other world regions. Instrument test<strong>in</strong>g is <strong>in</strong>creas<strong>in</strong>glyimportant <strong>in</strong> the global l<strong>in</strong>t market, but most l<strong>in</strong>t <strong>in</strong> <strong>Africa</strong> cont<strong>in</strong>ues to beclassified through visual <strong>and</strong> manual <strong>in</strong>spection, with <strong>in</strong>strument classificationdone only on a sample basis, if at all. International cotton merchants put greatimportance on the reliability <strong>of</strong> l<strong>in</strong>t classification, <strong>in</strong>dependent <strong>of</strong> the actualquality <strong>of</strong> the l<strong>in</strong>t; l<strong>in</strong>t that is typically high quality but not reliably classifiedwill not earn the premium that it otherwise would.Because <strong>Africa</strong>n cottons show little variability <strong>in</strong> basic fiber parameters,price differentials between different orig<strong>in</strong>s primarily reflect their level <strong>of</strong>contam<strong>in</strong>ation (real or perceived). In 2006/07, the average premium <strong>of</strong> thequotation for the top type <strong>of</strong> each country <strong>in</strong> <strong>Cotton</strong> Outlook over the CotlookA Index ranged from 1 to 7 U.S. cents per pound (¢/lb), with Zimbabwe <strong>and</strong>Zambia receiv<strong>in</strong>g the highest premium <strong>and</strong> Tanzania <strong>and</strong> Mozambique thelowest (figure 7.1).From the mid-1990s to the 2006/07 season, premiums for top types<strong>in</strong>creased <strong>in</strong> Zambia (plus 5.0¢/lb), Cameroon (plus 4.5¢/lb), Mozambique(plus 2.0¢/lb), <strong>and</strong> Burk<strong>in</strong>a Faso (plus 1.0¢/lb). Progress made <strong>in</strong> Zambia <strong>and</strong>Cameroon is due to successful reductions <strong>in</strong> contam<strong>in</strong>ation <strong>and</strong> stick<strong>in</strong>ess,respectively. In Mozambique, newer concessionaire companies, such as Plexus<strong>and</strong> Dunavant, provided high-quality cultures that were lack<strong>in</strong>g <strong>in</strong> the oldercompanies. In contrast, differentials for top types aga<strong>in</strong>st the Cotlook A Indexdecl<strong>in</strong>ed by 1.5¢/lb <strong>in</strong> Tanzania, 1.0¢/lb <strong>in</strong> Ug<strong>and</strong>a <strong>and</strong> Zimbabwe, <strong>and</strong> 0.5¢/lb<strong>in</strong> Ben<strong>in</strong> <strong>and</strong> Mali. The decl<strong>in</strong>es reflect <strong>in</strong>creased competition between g<strong>in</strong>ners<strong>in</strong> all three East <strong>and</strong> Southern <strong>Africa</strong> (ESA) countries, <strong>and</strong> lax seed cotton grad<strong>in</strong>g<strong>and</strong> contam<strong>in</strong>ation result<strong>in</strong>g from poor management <strong>in</strong> the two West <strong>and</strong>Central <strong>Africa</strong> (WCA) countries.The premium paid for the top types <strong>in</strong> each country does not necessarilyreflect the overall effectiveness <strong>of</strong> quality control <strong>in</strong> those systems, because itdoes not <strong>in</strong>dicate the share <strong>of</strong> those types <strong>in</strong> total production. Calculat<strong>in</strong>g anaverage realized price—which would more accurately reflect the success <strong>of</strong>90 ESTUR, POULTON, AND TSCHIRLEY
Figure 7.1 Estimated Premium for Top Type <strong>of</strong> L<strong>in</strong>t dur<strong>in</strong>g 2006/07, byCountryBen<strong>in</strong>Burk<strong>in</strong>a FasoCameroonMaliMozambique*TanzaniaUg<strong>and</strong>aZambiaZimbabwe0 1 2 3 4 5 6 7 8average quotation m<strong>in</strong>us Cotlook A Index (US¢/lb)Source: Author’s calculations based on quotations <strong>in</strong> <strong>Cotton</strong> Outlook <strong>and</strong> <strong>in</strong>ternational traders’price estimates for Mozambique.*Not quoted <strong>in</strong> <strong>Cotton</strong> Outlook.quality control <strong>in</strong> the sectors—requires data on the share <strong>of</strong> each type <strong>in</strong> totalproduction <strong>and</strong> the premium received by each <strong>of</strong> these types. Such data arevery difficult to obta<strong>in</strong>. Therefore, a theoretical average quotation by country 57is calculated on the basis <strong>of</strong> the follow<strong>in</strong>g data:■ average premium for the quotation <strong>of</strong> the top type, as shown <strong>in</strong> figure 7.1■ usual world market price differences for grade compared with Middl<strong>in</strong>g, asfollows: Good Middl<strong>in</strong>g, plus 1.5–2.5¢/lb; Strict Middl<strong>in</strong>g, plus0.75–1.0¢/lb; Middl<strong>in</strong>g, 0; <strong>and</strong> Strict Low Middl<strong>in</strong>g, m<strong>in</strong>us 0.5–2.0¢/lb■ usual world market price differences for staple length, relative to 1 3 / 32<strong>in</strong>ches <strong>of</strong>– 1 5 / 32 <strong>in</strong>ches: plus 1.5–2.0¢/lb– 1 1 / 8 <strong>in</strong>ches: plus 0.5–1.0¢/lb– 1 3 / 32 <strong>in</strong>ches: 0– 1 1 / 16 <strong>in</strong>ches: m<strong>in</strong>us 1.75–4.0¢/lb■ actual 2005/06 class<strong>in</strong>g data for WCA countries <strong>and</strong> most recent availabledata or estimates for ESA countriesFor one to calculate the theoretical average export price <strong>of</strong> the crop, a deduction<strong>of</strong> one cent per pound is applied to the weighted average quotation toreflect the usual difference between the seller’s <strong>of</strong>fer<strong>in</strong>g price <strong>and</strong> the actualnegotiated contract price. Accord<strong>in</strong>g to these calculations, theoretical weightedaverage export price differentials compared with the Cotlook A Index rangefrom m<strong>in</strong>us US$0.02/lb to plus US$0.04/lb (figure 7.2). 58 QUALITY CONTROL 91
Figure 7.2 Estimated Premium Weighted Average Basis, - by Country, U.S.cents/lb–3 –2 –1 0 1 2 3 4 5Ben<strong>in</strong>Burk<strong>in</strong>a FasoCameroonMaliMozambique*TanzaniaUg<strong>and</strong>aZambiaZimbabwetheoretical average price m<strong>in</strong>us Cotlook A Index (US¢/lb)Source: Author’s calculations based on 2005/06 season class<strong>in</strong>g data by country, quotations <strong>in</strong><strong>Cotton</strong> Outlook, <strong>and</strong> <strong>in</strong>ternational traders’ price estimates for Mozambique.*Not quoted <strong>in</strong> <strong>Cotton</strong> Outlook.IMPACT OF SECTOR ORGANIZATION ON QUALITYZambia’s concentrated sector st<strong>and</strong>s out as the best performer <strong>in</strong> figure 7.2. Ithas also seen the greatest <strong>in</strong>crease <strong>in</strong> premium s<strong>in</strong>ce the mid-1990s. Thereduction <strong>in</strong> l<strong>in</strong>t contam<strong>in</strong>ation over this period was achieved through strictcontrol over the quality <strong>of</strong> seed cotton admitted to the g<strong>in</strong>neries <strong>of</strong> the twodom<strong>in</strong>ant companies. Dunavant <strong>in</strong>stalled clean<strong>in</strong>g stations at its buy<strong>in</strong>g posts,at which all seed cotton is h<strong>and</strong>-sorted before be<strong>in</strong>g sent to the g<strong>in</strong>nery. Thecompany has also refused to accept seed cotton brought to buy<strong>in</strong>g posts <strong>in</strong>polypropylene bags. Moreover, it has <strong>in</strong>troduced a third grade for seed cottonpurchas<strong>in</strong>g (A+) that rewards farmers who deliver contam<strong>in</strong>ation-free l<strong>in</strong>t.Similarly, Clark/Cargill sought to <strong>in</strong>still <strong>in</strong> the farmers it works with theimportance <strong>of</strong> deliver<strong>in</strong>g high-quality seed cotton. As a result, farmers whodisregard quality or who seek to adulterate their seed cotton have few outletsat which to sell it. Both Dunavant <strong>and</strong> Clark/Cargill are directly engaged <strong>in</strong>l<strong>in</strong>t market<strong>in</strong>g to regional or <strong>in</strong>ternational sp<strong>in</strong>ners, so are fully aware <strong>of</strong>, <strong>and</strong>capture, the benefits <strong>of</strong> high-quality l<strong>in</strong>t. This, comb<strong>in</strong>ed with their controlover their supply cha<strong>in</strong>s, lies beh<strong>in</strong>d the strong quality performance observed<strong>in</strong> the Zambian sector.National <strong>and</strong> local monopoly systems exhibited vary<strong>in</strong>g performance s<strong>in</strong>cethe mid-1990s. With<strong>in</strong> WCA, Cameroon shows what a national monopoly c<strong>and</strong>o when political <strong>in</strong>terference is kept to a m<strong>in</strong>imum <strong>and</strong> the company is left torun along fairly strict commercial l<strong>in</strong>es. By contrast, Mali’s zero premium isunimpressive when one recalls that its fiber characteristics—like those <strong>of</strong> nearly92 ESTUR, POULTON, AND TSCHIRLEY
all fiber com<strong>in</strong>g from <strong>Africa</strong>—are typically superior to those <strong>of</strong> the cottons used<strong>in</strong> the calculation <strong>of</strong> the Cotlook A Index. Political <strong>in</strong>terference has played somerole <strong>in</strong> Mali’s poor performance. Mozambique’s poor performance reflects thelegacy <strong>of</strong> a nearly unregulated local monopoly system with orig<strong>in</strong>al concessioncompanies uncommitted to productivity <strong>and</strong> quality; while quality is likely betteramong the newer affiliated g<strong>in</strong>ners (Dunavant, Plexus, Companhia Nacionalde Algodão (Mozambique)/Développement des Agro-Industries du Sud), it willtake time for them to overcome the country’s poor reputation.In theory, monopoly systems should be able to exert the same control overtheir supply cha<strong>in</strong>s as concentrated sectors. If they take a hard l<strong>in</strong>e on thequality <strong>of</strong> seed cotton received, thereby penaliz<strong>in</strong>g poor quality through pricediscounts or, <strong>in</strong> extreme cases, refusal to accept delivery at all, farmers have noalternative outlet at which to sell. However, the social <strong>and</strong> political context isalso important. Unlike <strong>in</strong> concentrated sectors, where the notion <strong>of</strong> competitionis extremely helpful <strong>in</strong> this regard, there is an expectation that the companies,as monopolies, will accept all seed cotton delivered to them. This ideais particularly strong with<strong>in</strong> the national monopoly system <strong>in</strong> Mali, whereresponsibility for grad<strong>in</strong>g has been transferred to producers’ associations. Asa result, grad<strong>in</strong>g is very lax. There are large stated price differentials betweengrades, but these differences result <strong>in</strong> 99 percent <strong>of</strong> the crop be<strong>in</strong>g purchasedas First grade regardless <strong>of</strong> the subsequent l<strong>in</strong>t classify<strong>in</strong>g results. Contam<strong>in</strong>ationis <strong>of</strong>ten not taken <strong>in</strong>to account, <strong>and</strong> little care is given to the cleanl<strong>in</strong>ess<strong>of</strong> cotton before it reaches the g<strong>in</strong>.The effect <strong>of</strong> Tanzania’s competitive system is clearly seen <strong>in</strong> the decl<strong>in</strong>e <strong>in</strong> itspremium s<strong>in</strong>ce liberalization <strong>and</strong> its result<strong>in</strong>g 2.0¢/lb average discount relative tothe Cotlook A Index (figure 7.2). The negative impact <strong>of</strong> competition on cottonquality <strong>in</strong> Tanzania was first highlighted by Gibbon (1999). Unregulated competitionunderm<strong>in</strong>es the ability <strong>of</strong> g<strong>in</strong>ners to control their supply cha<strong>in</strong>s, whilethe limited vertical coord<strong>in</strong>ation between the large number <strong>of</strong> small, <strong>in</strong>dependentg<strong>in</strong>ners <strong>and</strong> the country’s l<strong>in</strong>t exporters weakens the <strong>in</strong>centives that g<strong>in</strong>nersface to produce high-quality l<strong>in</strong>t. For most <strong>of</strong> the postliberalization period(exclud<strong>in</strong>g the bumper years 2004 <strong>and</strong> 2005), the large number <strong>of</strong> g<strong>in</strong>ners wasassociated with serious excess g<strong>in</strong>n<strong>in</strong>g capacity. Thus, g<strong>in</strong>ners scrambled to buyavailable seed cotton. As a result, if one g<strong>in</strong>ner seeks to impose strict grad<strong>in</strong>grequirements dur<strong>in</strong>g seed cotton buy<strong>in</strong>g, farmers take their cotton to a compet<strong>in</strong>gbuyer who is more lenient. 59 The laxity <strong>of</strong> grad<strong>in</strong>g means that unscrupulousfarmers can also adulterate their seed cotton with s<strong>and</strong>, water, rocks, or otheritems to <strong>in</strong>crease the weight <strong>of</strong> their bales. Farmers claim that they do this <strong>in</strong>response to buyers’ practices <strong>of</strong> tamper<strong>in</strong>g with the weigh<strong>in</strong>g scales. Meanwhile,an exporter buy<strong>in</strong>g l<strong>in</strong>t from a number <strong>of</strong> g<strong>in</strong>neries cannot be sure <strong>of</strong> gett<strong>in</strong>g ahigher price for better quality, especially if sell<strong>in</strong>g forward. However, if exportersdo obta<strong>in</strong> a good price, they do not necessarily pass that on to the g<strong>in</strong>ner <strong>in</strong>question. Many g<strong>in</strong>ners, therefore, place more emphasis on <strong>in</strong>creas<strong>in</strong>g turnoverthan on rais<strong>in</strong>g quality. Box 7.1 explores these issues <strong>in</strong> more detail.QUALITY CONTROL 93
Box 7.1 Why Is Quality Management So Hard with<strong>in</strong>Competitive <strong>Sectors</strong>?It is estimated that the efforts made by the two ma<strong>in</strong> companies <strong>in</strong> the Zambiancotton sector to control contam<strong>in</strong>ation <strong>in</strong> seed cotton cost about 1.0¢/lb<strong>of</strong> l<strong>in</strong>t produced, whereas the benefit has been an <strong>in</strong>crease <strong>in</strong> the premium<strong>of</strong> around 5.0¢/lb <strong>of</strong> l<strong>in</strong>t s<strong>in</strong>ce the mid-1990s. In this case, quality pays. InTanzania <strong>and</strong> Zimbabwe, one can argue that small, <strong>in</strong>dependent g<strong>in</strong>nersmay not be rewarded by exporters for deliver<strong>in</strong>g higher quality l<strong>in</strong>t. However,<strong>in</strong> both countries’ sectors, g<strong>in</strong>ners that are part <strong>of</strong> vertically <strong>in</strong>tegratedcompanies would benefit from be<strong>in</strong>g able to sell higher quality l<strong>in</strong>t. Butexperience <strong>in</strong> both countries <strong>in</strong>dicates that quality-conscious cotton buyersare unable to unilaterally <strong>in</strong>sist on grad<strong>in</strong>g <strong>and</strong> associated price differentialsat primary market<strong>in</strong>g <strong>in</strong> highly competitive markets because they areundercut by competitors that put quantity before quality. The question,therefore, arises: why would higher prices achieved on the world l<strong>in</strong>t marketnot allow these quality-conscious firms to pay higher prices for good qualityseed cotton?One answer is that competitors may achieve higher capacity utilization attheir g<strong>in</strong>neries by be<strong>in</strong>g less selective <strong>in</strong> their seed cotton purchases, thusboost<strong>in</strong>g the prices that they can pay. Interviews with the manager <strong>of</strong> the mostquality-conscious cotton company <strong>in</strong> Tanzania <strong>in</strong>dicated that (at least, beforethe bumper harvest <strong>in</strong> 2004) their <strong>in</strong>sistence on quality control had causedthem to forgo seed cotton volume. This explanation then focuses attention onthe size <strong>of</strong> the premium obta<strong>in</strong>ed by sell<strong>in</strong>g a higher quality product <strong>in</strong> relationto the cost sav<strong>in</strong>gs from achiev<strong>in</strong>g higher capacity utilization. Althoughcotton l<strong>in</strong>t quality is important, the price differentials for l<strong>in</strong>t <strong>of</strong> different qualitiesare not <strong>of</strong> the magnitude <strong>of</strong> those witnessed <strong>in</strong>, say, c<strong>of</strong>fee.Furthermore, there may be other reasons—generally but not always <strong>of</strong> atransitory nature—that distort competition between quality-conscious buyers<strong>and</strong> others. For example, widespread evasion <strong>of</strong> the high taxes <strong>and</strong> leviesimposed on cotton buy<strong>in</strong>g <strong>and</strong> g<strong>in</strong>n<strong>in</strong>g <strong>in</strong> Tanzania is alleged. However, companieswith an <strong>in</strong>ternational br<strong>and</strong> reputation (which tend to be among themore quality conscious) perceive it as too risky to their wider br<strong>and</strong> reputationto be caught <strong>in</strong> flagrant tax or levy avoidance. They may, therefore, endup pay<strong>in</strong>g more <strong>in</strong> levies <strong>and</strong> taxes than some <strong>of</strong> their less quality-consciouscompetitors. Similarly, <strong>in</strong> Zimbabwe <strong>in</strong> recent years, the cotton company <strong>of</strong>Zimbabwe (COTTCO), the ma<strong>in</strong> company, argued that it was unable to matchthe prices <strong>of</strong>fered by new entrants, even though it had a long-established reputationfor quality on <strong>in</strong>ternational markets, because it was much more visibleto government agencies that were seek<strong>in</strong>g to stamp out “abuse” <strong>of</strong> therampant parallel foreign exchange market that developed <strong>in</strong> the country after2001. In a similar ve<strong>in</strong>, Tollens <strong>and</strong> Gilbert (2003) argue that shortages <strong>of</strong> foreignexchange <strong>in</strong> Nigeria <strong>in</strong> 1986/87 caused traders to scramble for cocoa <strong>in</strong> the(cont<strong>in</strong>ued)94 ESTUR, POULTON, AND TSCHIRLEY
Box 7.1 (Cont<strong>in</strong>ued)newly liberalized market, thus sacrific<strong>in</strong>g quality <strong>in</strong> the process. The parallelmarket mark-up on the scarce foreign exchange that could be generatedthrough cocoa export exceeded the quality premium obta<strong>in</strong>ed from higherquality cocoa. Tollens <strong>and</strong> Gilbert (2003) argue that the Nigeria cocoa case isa special case. However, the Zimbabwe <strong>and</strong> Tanzania cotton cases suggest thatthese “special cases” may actually be quite common.Although Ug<strong>and</strong>a has a large number <strong>of</strong> g<strong>in</strong>ners, as does Tanzania, 60 theUg<strong>and</strong>an sector is heavily regulated, with a quota system for seed cottonpurchase elim<strong>in</strong>at<strong>in</strong>g the direct competition for cotton that has been sodetrimental to quality <strong>in</strong> Tanzania. S<strong>in</strong>ce the mid-1990s, Ug<strong>and</strong>a’s premiumhas, nevertheless, fallen, although it rema<strong>in</strong>s above Tanzania’s. Some <strong>of</strong> thisdifference is due to the larger share <strong>of</strong> roller-g<strong>in</strong>ned cotton <strong>in</strong> Ug<strong>and</strong>a. However,another factor may be the much smaller size <strong>of</strong> the sector, which allowsUg<strong>and</strong>a’s <strong>Cotton</strong> Development <strong>Organization</strong> to monitor grad<strong>in</strong>g <strong>and</strong> otherquality practices <strong>in</strong> a way that the Tanzania <strong>Cotton</strong> Board cannot hope todo. In Tanzania, there are <strong>in</strong> excess <strong>of</strong> 5,000 registered buy<strong>in</strong>g posts spreadover a huge area <strong>of</strong> the country.F<strong>in</strong>ally, Zimbabwe appears to perform well, accord<strong>in</strong>g to figures 7.1 <strong>and</strong> 7.2.However, this is a legacy <strong>of</strong> the outst<strong>and</strong><strong>in</strong>g performance delivered first by thenational monopoly <strong>Cotton</strong> Market<strong>in</strong>g Board, then by the concentrated systemthrough 2001. Follow<strong>in</strong>g the rapid entry <strong>of</strong> new firms s<strong>in</strong>ce 2001, system-widequality control has suffered, even though COTTCO <strong>and</strong> Cargill, firms with anestablished reputation for quality consciousness, still account for 70–80 percent<strong>of</strong> the market. In 2002/03 one <strong>of</strong> the new companies <strong>in</strong> Zimbabwe (fromTanzania) was the first to <strong>of</strong>fer flat rate prices for all its seed cotton purchases(irrespective <strong>of</strong> grade) <strong>and</strong> even the established companies felt obliged to followsuit. Dur<strong>in</strong>g 2003/04 <strong>and</strong> subsequent seasons, the majority <strong>of</strong> primarymarket<strong>in</strong>g transactions were completed either without grad<strong>in</strong>g or with grad<strong>in</strong>gbe<strong>in</strong>g merely a formality from the farmer’s perspective because <strong>of</strong> the flat-ratepric<strong>in</strong>g. Almost immediately, the average quality <strong>of</strong> seed cotton delivered byfarmers decl<strong>in</strong>ed because they no longer felt the need to grade their cotton. 61Dur<strong>in</strong>g fieldwork <strong>in</strong> Zimbabwe, Cargill reported that, <strong>in</strong> the mid-1990s,around two-thirds <strong>of</strong> all seed cotton would have received an A or B grade. Inturn, all grade A <strong>and</strong> B cotton would have fed through to l<strong>in</strong>t <strong>of</strong> the top threegrades. In 2006, accord<strong>in</strong>g to buy<strong>in</strong>g slips, 35 percent <strong>of</strong> Cargill’s seed cottonreceived an A or B grade, but more rigorous grad<strong>in</strong>g at the company’s g<strong>in</strong>neriesreduced this figure to less than 1 percent. As a result, even with the use <strong>of</strong>l<strong>in</strong>t cleaners, only 3 percent <strong>of</strong> l<strong>in</strong>t achieved the top grade (compared withQUALITY CONTROL 95
20–25 percent <strong>in</strong> the late 1990s) <strong>and</strong> less than 50 percent could be sold as one<strong>of</strong> the top three grades. Similarly, at COTTCO’s Gokwe g<strong>in</strong>nery, a strik<strong>in</strong>g decl<strong>in</strong>ewas recorded <strong>in</strong> the proportion <strong>of</strong> seed cotton supplies classed as grade Abetween 2003 (26 percent) <strong>and</strong> 2004 (5 percent). Because 2003 was the year <strong>in</strong>which flat-rate buy<strong>in</strong>g was <strong>in</strong>troduced with<strong>in</strong> the sector, this dramatic decl<strong>in</strong>e<strong>in</strong> quality shows that farmers adapted to the new <strong>in</strong>centive system <strong>in</strong> a s<strong>in</strong>gleseason. Another notable drop <strong>in</strong> quality (pr<strong>in</strong>cipally affect<strong>in</strong>g the proportion<strong>of</strong> B grade cotton) occurred <strong>in</strong> 2006, a year <strong>of</strong> exceptional price competitionbetween companies. Thus, the share <strong>of</strong> seed cotton achiev<strong>in</strong>g grades A or B fellfrom 65 percent <strong>in</strong> 2003 to 20 percent <strong>in</strong> 2006. Return<strong>in</strong>g to figures 7.1 <strong>and</strong> 7.2,the country’s premium would have been substantially higher <strong>in</strong> the early2000s—before the <strong>in</strong>tensified competition with<strong>in</strong> the sector—<strong>and</strong> is likely t<strong>of</strong>all <strong>in</strong> the latter years <strong>of</strong> the 2000s if quality control measures are not improved.CONCLUSIONSOverall, quality performance is remarkably consistent with the expectationsgenerated from the typology: Zambia’s concentrated system delivers the bestperformance, comparable to what Zimbabwe delivered before the entry <strong>of</strong> newcompetitors. Zimbabwe’s premium is still high but is fall<strong>in</strong>g as a result <strong>of</strong><strong>in</strong>creased competition. Cameroon, with a national monopoly largely free <strong>of</strong>political meddl<strong>in</strong>g, also performs well, though not up to the st<strong>and</strong>ards <strong>of</strong> Zambia.The other national <strong>and</strong> local monopolies show highly variable performance,while Tanzania’s competitive system is, along with Mozambique, the worstquality performer.Table 7.1 summarizes available quality <strong>in</strong>formation for each country <strong>in</strong> thisstudy. Grow<strong>in</strong>g fewer varieties <strong>in</strong> a country makes it easier to ma<strong>in</strong>ta<strong>in</strong> homogeneity<strong>of</strong> quality, though proper controls (as <strong>in</strong> Zambia, which grows at leasttwo varieties) <strong>and</strong> good classification can ensure good performance even whenseveral varieties are grown. Hav<strong>in</strong>g more seed cotton grades is generally goodbut only if strictly l<strong>in</strong>ked to l<strong>in</strong>t classification outcomes. Instrument test<strong>in</strong>g is<strong>in</strong>creas<strong>in</strong>gly important <strong>in</strong> the global l<strong>in</strong>t market but is rarely used <strong>in</strong> <strong>Africa</strong>.International cotton merchants put great importance on the reliability <strong>of</strong> l<strong>in</strong>tclassification <strong>in</strong> a country, <strong>in</strong>dependent <strong>of</strong> the actual quality <strong>of</strong> the l<strong>in</strong>t. L<strong>in</strong>tthat is typically high quality but not reliably classified will not earn the premiumthat it otherwise would. Longer staple length is always good, <strong>and</strong><strong>in</strong>ch is a typical benchmark. Contam<strong>in</strong>ation is crucial <strong>in</strong> pric<strong>in</strong>g, <strong>and</strong> a reputationfor high contam<strong>in</strong>ation is difficult to overcome. All <strong>of</strong> these factors contributeto the average premium a country is able to earn over the Cotlook AIndex; these estimates are presented <strong>in</strong> the f<strong>in</strong>al column <strong>of</strong> table 7.1 <strong>and</strong> are discussed<strong>in</strong> more detail <strong>in</strong> the next chapters.96 ESTUR, POULTON, AND TSCHIRLEY
CHAPTER EIGHTValorization <strong>of</strong> Seed<strong>Cotton</strong> By-ProductsNicolas Gergely <strong>and</strong> Col<strong>in</strong> PoultonAs po<strong>in</strong>ted out <strong>in</strong> chapter 2, by-products derived from cotton seedprocess<strong>in</strong>g have grow<strong>in</strong>g markets <strong>and</strong> are potentially an importantcomplementary source <strong>of</strong> revenue for cotton sectors <strong>in</strong> <strong>Africa</strong>. Accord<strong>in</strong>gto st<strong>and</strong>ards worldwide, seed cotton by-products (cottonseed oil <strong>and</strong> cake)typically represent 20–25 percent <strong>of</strong> the total value <strong>of</strong> seed cotton. However, onestark f<strong>in</strong>d<strong>in</strong>g <strong>in</strong> this study is that the markets for these products are not welldeveloped <strong>in</strong> <strong>Africa</strong> <strong>and</strong> that prices received by g<strong>in</strong>ners are <strong>of</strong>ten low; thus, farmersare generally not gett<strong>in</strong>g the full returns from the process<strong>in</strong>g <strong>of</strong> cotton seeds.STRUCTURE AND ORGANIZATION OF OIL SECTORSThe study countries show important differences <strong>in</strong> the organization <strong>and</strong>performance <strong>of</strong> their cottonseed oil sectors. These differences exhibit someparallels with the differences <strong>in</strong> organization across the cotton sectors. However,because the organization <strong>of</strong> the oil sector is not the major focus <strong>of</strong> this study, itwill be discussed only briefly. Meanwhile, differences <strong>in</strong> the performance <strong>of</strong> oilsectors have important consequences for the pr<strong>of</strong>itability <strong>and</strong> competitiveness<strong>of</strong> each national cotton sector.Table 8.1 shows considerable variation <strong>in</strong> the number <strong>of</strong> cottonseed oilprocessors across the study countries. There is no domestic <strong>in</strong>dustry <strong>in</strong> Mozambique(where dem<strong>and</strong> for cake is extremely limited), a monopoly <strong>in</strong> Cameroon,one dom<strong>in</strong>ant price setter <strong>in</strong> both Burk<strong>in</strong>a Faso <strong>and</strong> Mali, <strong>and</strong> an <strong>in</strong>creas<strong>in</strong>gly97
98Table 8.1 <strong>Cotton</strong> Seed Production <strong>and</strong> Process<strong>in</strong>g <strong>in</strong> Study CountriesIndicatorBen<strong>in</strong>Burk<strong>in</strong>aFaso Cameroon Mali Mozambique Tanzania Ug<strong>and</strong>a Zambia ZimbabweAverage national seedcotton production(tons), 2001–06 339,500 557,833 242,966 488,281 72,178 235,000 78,410 160,000 246,350<strong>Cotton</strong>seed oil productionas percentage <strong>of</strong> nationaloil consumption a 53 57 18 50 6 (potential) 8 4 20 27Number <strong>of</strong> cottonseed oilprocessors, 2006 2 11 1 2 0 13 or more 4 3 6 or moreRetail price <strong>of</strong> oil(US$/liter), 2006–07 — 0.95 b 1.28 — — 0.83 b — 1.29 1.55Seed price (US$/ton), 2006 63 44 59 c 50 e 55 27–117 d 86 71 95L<strong>and</strong>locked No Yes No Yes No No Yes Yes YesSource: Authors.Note: — = not available.a. Estimated from the quantity <strong>of</strong> seed available for crush<strong>in</strong>g (2001–06 average), after subtraction <strong>of</strong> seed reta<strong>in</strong>ed for redistribution to farmers, us<strong>in</strong>g an oiloutturn <strong>of</strong> 18 percent <strong>and</strong> an average annual oil consumption <strong>of</strong> 7 kg per person.b. Some <strong>of</strong> these prices have surged <strong>in</strong> 2007/08, such as the retail price <strong>of</strong> cotton oil <strong>in</strong> Burk<strong>in</strong>a Faso, which went up to US$2.00 per liter.c. Tanzania figure is wholesale price, so estimated retail price = US$1.00 to US$1.08 per liter.d. Account<strong>in</strong>g price recorded with<strong>in</strong> the <strong>in</strong>tegrated company.e. US$27 per ton is the lowest price reached <strong>in</strong> 2005 (bumper harvest), while US$117 per ton is highest price reached dur<strong>in</strong>g 2006 (drought year). Averagefigure is not available, but some respondents reported that a “normal” price would be about US$50.
competitive market <strong>in</strong> some <strong>of</strong> the other countries. Vertical relationships cover awide spectrum, from full <strong>in</strong>tegration with cotton g<strong>in</strong>n<strong>in</strong>g (as <strong>in</strong> Cameroon, mostcottonseed oil processors <strong>in</strong> Tanzania, <strong>and</strong> three new companies <strong>in</strong> Zimbabwe),through various forms <strong>of</strong> vertical coord<strong>in</strong>ation (Société Nouvelle CITEC <strong>in</strong>Burk<strong>in</strong>a Faso <strong>and</strong> larger companies <strong>in</strong> Zimbabwe), to market relationships.Transaction cost economics (Williamson 1985) can provide <strong>in</strong>sights <strong>in</strong>tothe vary<strong>in</strong>g vertical relationships. In the <strong>Africa</strong>n context, large-scale process<strong>in</strong>gequipment for high-quality oil (deodorized, neutralized, cleaned, withgossypol removed) is a fairly specific asset. In <strong>Africa</strong>, either vertical <strong>in</strong>tegrationor coord<strong>in</strong>ation could strengthen the <strong>in</strong>centives for <strong>in</strong>vestment <strong>in</strong> oil process<strong>in</strong>g.Thus, <strong>in</strong> Zimbabwe three large-scale oil processors have ma<strong>in</strong>ta<strong>in</strong>ed closerelationships with the two largest cotton companies through regular <strong>in</strong>teractionon the National <strong>Cotton</strong> Council (NCC). 62 By contrast, outside <strong>of</strong> West<strong>and</strong> Central <strong>Africa</strong> (WCA) <strong>and</strong> Zimbabwe, process<strong>in</strong>g operations are muchsmaller <strong>and</strong> <strong>of</strong>ten produce lower quality oil. Many <strong>of</strong> the new process<strong>in</strong>gplants be<strong>in</strong>g <strong>in</strong>stalled <strong>in</strong> Burk<strong>in</strong>a Faso, Mali, Tanzania, <strong>and</strong> Zimbabwe uselow-cost Indian equipment. For such plants, rely<strong>in</strong>g on spot market purchases<strong>of</strong> seed presents only a modest risk.However, the ma<strong>in</strong> factor expla<strong>in</strong><strong>in</strong>g observed variations <strong>in</strong> sector structure isnot the techno-economic attributes <strong>of</strong> different types <strong>of</strong> process<strong>in</strong>g equipment,but policy choice. Until the 1990s, <strong>in</strong> WCA countries vertical <strong>in</strong>tegration <strong>of</strong>large-scale oil process<strong>in</strong>g with<strong>in</strong> the parastatal cotton company was part <strong>of</strong> thedevelopment model for the national cotton sector. In subsequent years, an earlypart <strong>of</strong> the reform process was the privatization <strong>of</strong> the oil process<strong>in</strong>g activities.These privatizations have rarely been open <strong>and</strong> transparent, however. In Mali, aprivate monopoly was created by the divestment <strong>of</strong> the state from HuileriesCotonnières du Mali (HUICOMA). The new company has performed so farpoorly <strong>and</strong> is now <strong>in</strong> dire f<strong>in</strong>ancial straits, with smaller operators enter<strong>in</strong>g themarket <strong>in</strong> competition. In Burk<strong>in</strong>a Faso, the French company Développement desAgro-Industries du Sud, a shareholder <strong>in</strong> the ma<strong>in</strong> cotton company SOFITEX, isalso the majority shareholder <strong>in</strong> the ma<strong>in</strong> private oil processor. Cameroon, theone country <strong>in</strong> the sample where little significant reform <strong>of</strong> the cotton sector hastaken place, is also the one country where g<strong>in</strong>n<strong>in</strong>g <strong>and</strong> oil process<strong>in</strong>g haverema<strong>in</strong>ed <strong>in</strong>tegrated. Oil process<strong>in</strong>g <strong>in</strong> Cameroon is managed <strong>in</strong> an entrepreneurialmanner <strong>and</strong> contributes to the overall stability <strong>of</strong> the cotton operation.In East <strong>and</strong> Southern <strong>Africa</strong> (ESA), where the cotton market has been liberalizeds<strong>in</strong>ce 1994/95 (earlier <strong>in</strong> Mozambique), oil process<strong>in</strong>g is entirely <strong>in</strong> privateh<strong>and</strong>s. Given the small proportion <strong>of</strong> national edible oil consumption thatcottonseed oil supplies <strong>in</strong> these countries (table 8.1), its process<strong>in</strong>g has limitedstrategic importance. As a general rule, where mult<strong>in</strong>ational trad<strong>in</strong>g companieshave <strong>in</strong>vested <strong>in</strong> cotton production <strong>in</strong> these countries, they have shown little<strong>in</strong>terest <strong>in</strong> cottonseed oil process<strong>in</strong>g because volumes are too small for companiesprimarily <strong>in</strong>terested <strong>in</strong> <strong>in</strong>ternational markets. Oil process<strong>in</strong>g has thus beenleft to domestic or Asian entrepreneurs.VALORIZATION OF SEED COTTON BY-PRODUCTS 99
In Tanzania, the first private oil processors entered the cotton sector soonafter liberalization as a way to guarantee access to seed supplies. Several cottong<strong>in</strong>ners recently entered oil process<strong>in</strong>g, although it is not clear whether theseg<strong>in</strong>ners are seek<strong>in</strong>g to stabilize the price they realize from their seed (see therecent price fluctuations reported <strong>in</strong> table 8.1) or are respond<strong>in</strong>g to the attractivepr<strong>of</strong>its obta<strong>in</strong>ed by the exist<strong>in</strong>g oil processors.In Zimbabwe, <strong>in</strong>vestment <strong>in</strong> oil process<strong>in</strong>g equipment by Indian- <strong>and</strong> Tanzanian-ownedcotton companies has been observed dur<strong>in</strong>g 2005–07. This<strong>in</strong>vestment is a response to a national shortage <strong>of</strong> edible oil, part <strong>of</strong> the ongo<strong>in</strong>geconomic crisis <strong>in</strong> the country. Until 2000, the three established oil processorssupplied about 80 percent <strong>of</strong> national oil requirements us<strong>in</strong>g a blend <strong>of</strong> soybeanoil <strong>and</strong> cottonseed oil <strong>in</strong> roughly equal proportions. With the onset <strong>of</strong> the fasttrackl<strong>and</strong> redistribution program, however, soy production contracted rapidly,while cotton production has recently been lower than it was dur<strong>in</strong>g 1999–2001.The shortage <strong>of</strong> local raw materials has been compounded by a lack <strong>of</strong> foreignexchange for either imported materials or edible oil. Thus, attractive pr<strong>of</strong>its canbe obta<strong>in</strong>ed by those who control the supply <strong>of</strong> scarce cotton seeds.In general <strong>in</strong> <strong>Africa</strong> (except possibly South <strong>Africa</strong>) farmers do not own thecotton seed. To “own the cotton seed,” farmers either need to own g<strong>in</strong>neries orto toll g<strong>in</strong>. The latter option is easier but still requires significant volumes perconsignment—m<strong>and</strong>at<strong>in</strong>g a degree <strong>of</strong> farmer organization that is lack<strong>in</strong>g <strong>in</strong>most countries. Farmers also need to be able to f<strong>in</strong>ance their own productionwithout cotton company credit, thus rema<strong>in</strong><strong>in</strong>g free <strong>of</strong> obligations to thesecompanies. However, <strong>in</strong> Zimbabwe a company called Cottrade did set up a tollg<strong>in</strong>ner operation (see box 8.1). Even though Cottrade’s experience lasted onlyBox 8.1 Toll G<strong>in</strong>n<strong>in</strong>g <strong>in</strong> ZimbabweIn Zimbabwe, Cottrade <strong>of</strong>fered a brokerage service for farmers dur<strong>in</strong>g theperiod 2000–04 whereby they arranged toll g<strong>in</strong>n<strong>in</strong>g contracts <strong>and</strong> assistancewith the sale <strong>of</strong> both l<strong>in</strong>t <strong>and</strong> seed, for a 2 percent commission. With the exit<strong>of</strong> commercial farmers, Cottrade tried to work with groups <strong>of</strong> smaller producers.In the years when COTTCO <strong>and</strong> Cargill failed to pass the benefits <strong>of</strong>exchange rate depreciation on to producers, organized producers could getmuch more money through Cottrade than through traditional channels.However, few were sufficiently organized or could produce the necessary volumeswithout company credit. In 2004, the exchange rate stabilized <strong>and</strong> thegap between what farmers could achieve through Cottrade <strong>and</strong> normal channelsnarrowed significantly. This narrow<strong>in</strong>g seems to be what persuaded Cottradeto cease brokerage operations, but lack <strong>of</strong> progress with farmer organizationmay have been a contributory factor. In 2006, Cottrade beganoperat<strong>in</strong>g more like a traditional g<strong>in</strong>n<strong>in</strong>g company <strong>in</strong> Zimbabwe, purchas<strong>in</strong>gseed cotton <strong>and</strong> process<strong>in</strong>g it.100 GERGELY AND POULTON
a few years, it <strong>in</strong>dicates that some <strong>of</strong> the obstacles mentioned above could beovercome <strong>and</strong> that new ways <strong>of</strong> do<strong>in</strong>g bus<strong>in</strong>ess could emerge.PERFORMANCE OF OIL SECTORS, SEED PRICING,AND RETURNS TO FARMERSFor this study, a key performance <strong>in</strong>dicator for the oil sector is the price thatg<strong>in</strong>ners pay (or receive) for cotton seed. Given the competition from importedpalm oil <strong>in</strong> all the study countries, the ma<strong>in</strong> determ<strong>in</strong>ants <strong>of</strong> the cotton seedprice are expected to be the follow<strong>in</strong>g:■■■■■■Whether the country is l<strong>and</strong>locked (a major determ<strong>in</strong>ant <strong>of</strong> the overl<strong>and</strong>transport cost <strong>in</strong>curred by imported palm oil). Note that this partially compensatesg<strong>in</strong>n<strong>in</strong>g companies <strong>in</strong> l<strong>and</strong>locked countries for the high free-on-truckm<strong>in</strong>us free-on-board costs they <strong>in</strong>cur when export<strong>in</strong>g their l<strong>in</strong>t.The level <strong>of</strong> tariff protection (if any) <strong>of</strong>fered to domestically produced edibleoils. In Ben<strong>in</strong>, Burk<strong>in</strong>a Faso, <strong>and</strong> Mali, a common external tariff <strong>of</strong> 5percent applies to edible oil imports. However, some smuggled oil importsavoid this tariff <strong>and</strong> also avoid the 20 percent value added tax that is appliedto domestically produced oils. Thus, domestically produced oils are at a netdisadvantage when compared with these smuggled oils.Whether oil processors are able to br<strong>and</strong> cottonseed oil so as to raise itsprice above that <strong>of</strong> imported palm oil.The quality <strong>of</strong> oil produced <strong>in</strong>s<strong>of</strong>ar as this quality reflects the degree <strong>of</strong> process<strong>in</strong>g.Discussions <strong>in</strong> Tanzania suggest that it could cost twice as much toproduce high-quality oil (deodorized, neutralized, cleaned, <strong>and</strong> gossypolremoved) as to produce a semi-ref<strong>in</strong>ed oil.The strength <strong>of</strong> dem<strong>and</strong> for cottonseed cake from the domestic livestock<strong>in</strong>dustry.The efficiency <strong>of</strong> the oil process<strong>in</strong>g sector.A recent survey by the International <strong>Cotton</strong> Advisory Committee (ICAC) providesuseful <strong>in</strong>formation with which to benchmark the valorization <strong>of</strong> cottonseeds with world market st<strong>and</strong>ards. Accord<strong>in</strong>g to the ICAC survey, globally a kilogram<strong>of</strong> seeds fetches on average 18 U.S. cents/kg, which represents a good <strong>in</strong>comefor the grower. The data by region show that cotton seed has a higher value <strong>in</strong>non-WCA <strong>Africa</strong>n countries <strong>and</strong> <strong>in</strong> Asia, where a kilogram is sold at 22 U.S.¢/kg<strong>and</strong> 20 U.S.¢/kg, respectively. A kilogram <strong>of</strong> cotton seed after g<strong>in</strong>n<strong>in</strong>g is sold at13 U.S.¢/kg <strong>in</strong> North America (average <strong>of</strong> Mexico <strong>and</strong> the United States) <strong>and</strong>10 U.S.¢/kg <strong>in</strong> South America. <strong>Cotton</strong> seed prices are the lowest <strong>in</strong> West <strong>Africa</strong>ncountries, where a kilogram <strong>of</strong> seed is sold at 7 U.S.¢/kg (Chaudhry 2007).Table 8.1 shows the cotton seed prices paid by oil processors <strong>in</strong> the n<strong>in</strong>estudy countries <strong>in</strong> 2006. The table shows that the price paid <strong>in</strong> Zimbabwe wasmore than twice the price paid <strong>in</strong> Burk<strong>in</strong>a Faso (the lowest recorded with<strong>in</strong> theVALORIZATION OF SEED COTTON BY-PRODUCTS 101
group). This degree <strong>of</strong> variation cannot be justified by economic fundamentals.The follow<strong>in</strong>g can be observed:■■■■■L<strong>and</strong>locked countries <strong>in</strong> East <strong>and</strong> Southern <strong>Africa</strong> (ESA; Ug<strong>and</strong>a, Zambia,<strong>and</strong> Zimbabwe) record high prices for seed, as expected. In Zimbabwe, theobserved price is higher than otherwise, most likely a reflection <strong>of</strong> the currentexacerbated oil shortage.Coastal countries <strong>in</strong> both ESA <strong>and</strong> WCA record modest prices for seed,aga<strong>in</strong> as expected. A range <strong>of</strong> US$55–US$63 per ton is observed, withBen<strong>in</strong> the highest, followed by Cameroon. However, as noted <strong>in</strong> table 8.1,the price <strong>in</strong> Tanzania can go well above this price range when seed suppliesare limited.It is more difficult to br<strong>and</strong> cottonseed oil as a superior product (comm<strong>and</strong><strong>in</strong>ga price premium over imported palm oil) when it accounts for themajority <strong>of</strong> the total oil market than when it accounts for a much smallershare. With<strong>in</strong> the four WCA countries, the only one where cottonseed oilhas been successfully br<strong>and</strong>ed <strong>and</strong> promoted is Cameroon. Likewise, <strong>in</strong>Tanzania some <strong>of</strong> the early private oil processors established br<strong>and</strong>s that arewell known with<strong>in</strong> the cotton-grow<strong>in</strong>g regions around Lake Victoria. <strong>Cotton</strong>seedoil is preferred over palm oil for the fry<strong>in</strong>g <strong>of</strong> fish <strong>and</strong> doughnutsbecause it burns at a higher temperature.Dem<strong>and</strong> for cottonseed cake from the domestic livestock <strong>in</strong>dustry is muchstronger <strong>in</strong> the Sahelian countries (Burk<strong>in</strong>a Faso <strong>and</strong> Mali), plus possiblyZimbabwe, 63 than <strong>in</strong> the other countries <strong>in</strong> the sample. In the Saheliancountries, cake is sold for around Communauté Française d’Afrique (Frenchcommunity <strong>of</strong> <strong>Africa</strong>) franc 50/kg (US$0.1/kg) ex factory, which makes thevalue <strong>of</strong> cake about half that <strong>of</strong> oil (given a cake outturn <strong>of</strong> 80 percent per kg<strong>of</strong> seed processed).Oil produced by the established companies <strong>in</strong> the four WCA countries plusZimbabwe is <strong>of</strong> a higher quality (with commensurately higher process<strong>in</strong>gcosts) than that produced <strong>in</strong> Tanzania or by the newer companies <strong>in</strong> WCA<strong>and</strong> Zimbabwe.If one takes these observations together, the clear outliers <strong>in</strong> cotton seedpric<strong>in</strong>g are Burk<strong>in</strong>a Faso <strong>and</strong> Mali. Both are l<strong>and</strong>locked <strong>and</strong> exhibit strongdem<strong>and</strong> for cottonseed cake, but <strong>in</strong> 2006 seed prices were only US$44/ton <strong>and</strong>US$50/ton, respectively. The retail oil price <strong>in</strong> Burk<strong>in</strong>a Faso is also low for al<strong>and</strong>locked country, which may reflect the impact <strong>of</strong> oil smuggled <strong>in</strong> throughTogo. However, <strong>in</strong> both Burk<strong>in</strong>a Faso <strong>and</strong> Mali, the fundamental problemappears to be monopsony power. In Mali, where the privatization <strong>of</strong> theparastatal processor has already been commented upon, even US$50/ton wasan improvement over the price paid <strong>in</strong> the previous two years. In Burk<strong>in</strong>aFaso, the privatized former parastatal SN CITEC still accounts for around twothirds<strong>of</strong> seed purchases <strong>and</strong> acts as a price leader. The 10 smaller new entrants102 GERGELY AND POULTON
should eventually make a difference to the seed price, but currently they donot appear to account for enough <strong>of</strong> the market (or have enough work<strong>in</strong>gcapital) to push the price up significantly.Overall, a limited, but variable, degree <strong>of</strong> development <strong>of</strong> domestic oil <strong>and</strong>cake markets is observed. From the perspective <strong>of</strong> cotton g<strong>in</strong>ners, the ma<strong>in</strong> problemis the monopsony power exercised by oil processors <strong>in</strong> Burk<strong>in</strong>a Faso <strong>and</strong>Mali, as well as a lack <strong>of</strong> transparency <strong>and</strong> contestability on the transfer price <strong>of</strong>cotton seeds established through long-st<strong>and</strong><strong>in</strong>g arrangements between the cottoncompany <strong>and</strong> the oil processor—the latter <strong>of</strong>ten a subsidiary <strong>of</strong> the former—<strong>of</strong>ficially justified by the need to protect domestic <strong>in</strong>dustries. Nevertheless, oilconsumers may ga<strong>in</strong> at the expense <strong>of</strong> seed cotton producers <strong>in</strong> Burk<strong>in</strong>a Faso.Given the <strong>of</strong>ten tight marg<strong>in</strong>s obta<strong>in</strong>able from l<strong>in</strong>t production, moreresearch would be worthwhile on measures to improve the efficiency <strong>of</strong> themarkets for oil <strong>and</strong> cake. Accord<strong>in</strong>g to crude estimates <strong>of</strong> oil process<strong>in</strong>g costs,there are reasons to believe that many <strong>of</strong> the observed seed prices could beraised by additional competition. On the consumer side, this belief does raisea quality issue: oils from newer, smaller process<strong>in</strong>g units are typically lessref<strong>in</strong>ed than oils from larger, established companies. However, as long as basicfood safety requirements are met, it may well be that a significant proportion<strong>of</strong> poor consumers would will<strong>in</strong>gly accept lower quality oil if its price was alsolower. In this regard, there would appear to be parallels with the liberalization<strong>of</strong> maize markets <strong>in</strong> ESA <strong>in</strong> the 1980s, lead<strong>in</strong>g to rapid new entry <strong>of</strong> smallscalehammer mills <strong>in</strong> competition with established, large-scale roller mills(Jayne et al. 1995).The other major challenge for the regulation <strong>of</strong> liberalized oil markets is theenforcement <strong>of</strong> tariffs <strong>and</strong> other taxes on imported oils. <strong>Cotton</strong>seed oil producedlocally suffers <strong>in</strong> a number <strong>of</strong> <strong>Africa</strong>n countries from unfair competitionfrom massive imports <strong>of</strong> vegetable oils orig<strong>in</strong>at<strong>in</strong>g from Southeast Asia that are<strong>of</strong>ten imported fraudulently or without pay<strong>in</strong>g the full amount <strong>of</strong> legally duetariffs <strong>and</strong> taxes.CONCLUSIONThe analysis reveals that there are significant differences <strong>in</strong> the valorization<strong>of</strong> cotton seeds across the study countries. Burk<strong>in</strong>a Faso <strong>and</strong> Mali are l<strong>and</strong>locked,have a deficit <strong>in</strong> edible oil, <strong>and</strong> have strong dem<strong>and</strong> for cake fromtheir livestock sector, yet prices paid to cotton companies for seed are thelowest <strong>of</strong> the n<strong>in</strong>e countries because <strong>of</strong> monopsony power <strong>in</strong> the oil sectors,whether public or private. In contrast, Ug<strong>and</strong>a’s competitive oil sector makesa significant contribution to g<strong>in</strong>n<strong>in</strong>g company pr<strong>of</strong>itability as a result <strong>of</strong> thehigh prices paid for cotton seed. Small-scale <strong>in</strong>vestment <strong>in</strong> Tanzania has alsoled to more attractive prices for cotton seed. Similar <strong>in</strong>vestment is start<strong>in</strong>g totake place <strong>in</strong> Mali <strong>and</strong> should not be discouraged.VALORIZATION OF SEED COTTON BY-PRODUCTS 103
Globally, changes <strong>in</strong> <strong>in</strong>stitutional structure can be expected <strong>in</strong> many countries,result<strong>in</strong>g from the grow<strong>in</strong>g importance <strong>of</strong> by-products <strong>and</strong> coproducts. Thesechanges could <strong>in</strong>clude either <strong>in</strong>creased farmer ownership <strong>of</strong> g<strong>in</strong>s or <strong>in</strong>creasedtoll g<strong>in</strong>n<strong>in</strong>g, so that farmers can directly sell the seed. These changes will proceedmost rapidly where farmers have reasonable organizational capacity <strong>and</strong><strong>in</strong>dependent access to f<strong>in</strong>ance. In this respect, <strong>Africa</strong>n cotton sectors could bevery slow to adopt these changes, <strong>and</strong> <strong>Africa</strong>n farmers could thus be slow tobenefit from these grow<strong>in</strong>g markets.104 GERGELY AND POULTON
CHAPTER NINE<strong>Cotton</strong> ResearchDuncan Boughton <strong>and</strong> Col<strong>in</strong> PoultonFarm-level productivity ga<strong>in</strong>s are critically important for <strong>Africa</strong>’s cottonsectors to improve their <strong>in</strong>ternational competitiveness <strong>and</strong> contributemore effectively to rais<strong>in</strong>g rural <strong>in</strong>comes <strong>and</strong> reduc<strong>in</strong>g poverty. Figure10.1 (see page 118) shows that while world average yields for ra<strong>in</strong>fed cottonproduction have <strong>in</strong>creased by more than 150 percent s<strong>in</strong>ce 1980, yields <strong>in</strong><strong>Africa</strong> over the same period have risen by much less <strong>and</strong> have been essentiallyflat <strong>in</strong> West <strong>and</strong> Central <strong>Africa</strong> (WCA) s<strong>in</strong>ce 1985. Lagg<strong>in</strong>g yields are an <strong>in</strong>dicator<strong>of</strong> possible weaknesses <strong>in</strong> the technology development <strong>and</strong> deliveryvalue cha<strong>in</strong> that, if carefully diagnosed <strong>and</strong> corrected, signal a potentialopportunity for rais<strong>in</strong>g competitiveness <strong>in</strong> the future. Although a completediagnostic is beyond the scope <strong>of</strong> the current study, this chapter provides an<strong>in</strong>itial assessment <strong>of</strong> the current state <strong>of</strong> research <strong>and</strong> its contribution tocompetitiveness on the basis <strong>of</strong> the case study countries.The next chapter also shows a high level <strong>of</strong> variation <strong>in</strong> productivity amongsome <strong>Africa</strong>n cotton farmers. The most productive farmers achieve cottonyields close to or above the world ra<strong>in</strong>fed average, suggest<strong>in</strong>g that a major cause<strong>of</strong> low average yields <strong>in</strong> <strong>Africa</strong> is the <strong>in</strong>ability <strong>of</strong> the majority <strong>of</strong> farmers toaccess or use exist<strong>in</strong>g technology packages effectively. Research is generallythought <strong>of</strong> as push<strong>in</strong>g out the production frontier, but the fact cannot beignored that many cotton farmers <strong>in</strong> <strong>Africa</strong> are achiev<strong>in</strong>g yields far short <strong>of</strong> theexist<strong>in</strong>g frontier. At a m<strong>in</strong>imum, socioeconomic research can help improve theunderst<strong>and</strong><strong>in</strong>g <strong>of</strong> the reasons for the yield performance gap, even if researchers105
may not be able to solve the underly<strong>in</strong>g problems. For example, if clos<strong>in</strong>g theyield gap us<strong>in</strong>g exist<strong>in</strong>g technology requires additional <strong>in</strong>vestments <strong>in</strong> farmers’asset bases (biological, physical, <strong>and</strong> human capital), then additional resourcesbeyond technical research <strong>and</strong>, <strong>in</strong>deed, from outside the cotton sector may beneeded to achieve high yields. Improved technology, such as Bt cotton seed orweedicides, as part <strong>of</strong> an <strong>in</strong>tegrated pest management strategy may reducesome management requirements for asset-poor farmers, but technology mayalso <strong>in</strong>crease the farmers’ perception <strong>of</strong> risk from higher costs for purchased<strong>in</strong>puts. A first step toward def<strong>in</strong><strong>in</strong>g the role <strong>of</strong> research <strong>in</strong> improv<strong>in</strong>g yields willbe to underst<strong>and</strong> the causes <strong>of</strong> low productivity <strong>in</strong> specific agro-ecologies <strong>and</strong>farm types to determ<strong>in</strong>e the mix <strong>of</strong> <strong>in</strong>vestments necessary. For the most assetpoorcotton farmers, an important contribution <strong>of</strong> research may be to identifymore pr<strong>of</strong>itable alternative crops or <strong>of</strong>f-farm activities for them to take up<strong>in</strong>stead <strong>of</strong> grow<strong>in</strong>g cotton.COTTON RESEARCH ORGANIZATION AND PERFORMANCEThe organization <strong>and</strong> f<strong>in</strong>anc<strong>in</strong>g <strong>of</strong> cotton research is highly dependent on thehistorical context at both regional <strong>and</strong> country levels. In Francophone WCA,cotton research reflects a long history <strong>of</strong> <strong>in</strong>vestment by the former French cottonresearch <strong>in</strong>stitute IRCT (Institut de Recherches sur le Coton et les Textiles),with c<strong>of</strong><strong>in</strong>anc<strong>in</strong>g at the country level by the former cotton parastatal CFDT(Compagnie Française pour le Développement des Fibres Textiles) <strong>and</strong> withgood <strong>in</strong>formation exchange among researchers <strong>in</strong> the region. C<strong>of</strong><strong>in</strong>anc<strong>in</strong>g <strong>of</strong>cotton research by cotton companies <strong>in</strong> Francophone countries cont<strong>in</strong>ued after<strong>in</strong>dependence, <strong>of</strong>ten supplemented by development loans or grants, becausecotton was seen as an “eng<strong>in</strong>e <strong>of</strong> development” that enabled the capitalization<strong>of</strong> smallholder farm<strong>in</strong>g. The persistence <strong>of</strong> the parastatal monopoly model <strong>of</strong>cotton sector management <strong>in</strong> WCA countries clearly contributed to organizationalstability for cotton research when compared with East <strong>and</strong> Southern<strong>Africa</strong> (ESA), <strong>in</strong> addition to provid<strong>in</strong>g farmers with equipment <strong>and</strong> extensionadvice so they could adopt research recommendations. Most cotton researchprograms <strong>in</strong> WCA cont<strong>in</strong>ue to be organized along the l<strong>in</strong>es <strong>of</strong> <strong>in</strong>dividual discipl<strong>in</strong>es,with variety, pest control, <strong>and</strong> agronomy subprograms. The researchprograms <strong>in</strong> Burk<strong>in</strong>a Faso <strong>and</strong> Mali are the only ones <strong>in</strong> the study sample thatappear to <strong>in</strong>tegrate a socioeconomic component on a systematic basis.By contrast, the United K<strong>in</strong>gdom focused its colonial era research <strong>in</strong>vestments<strong>in</strong> regional commodity research programs (Be<strong>in</strong>tema <strong>and</strong> Stads 2006),but cotton was not among them. Instead, <strong>in</strong>dividual colonies were left t<strong>of</strong><strong>in</strong>ance cotton research through <strong>in</strong>dustry levies <strong>in</strong> those colonies where cottonwas an important crop for the economy. This problem <strong>in</strong>evitably led to unevenperformance across countries. However, Zimbabwe <strong>and</strong> Ug<strong>and</strong>a <strong>in</strong> particularhave strong traditions <strong>of</strong> cotton research.106 BOUGHTON AND POULTON
With regard to human <strong>and</strong> f<strong>in</strong>ancial resources, cotton research programs <strong>in</strong>WCA case study countries range from 9 to 25 research staff members withannual budgets vary<strong>in</strong>g from US$300,000 to US$500,000 per year. Similar topublicly funded agricultural research <strong>in</strong> general, researchers <strong>of</strong>ten compla<strong>in</strong>that high fixed costs, <strong>in</strong> part related to high support staff levels, <strong>of</strong>ten do notleave sufficient operational resources for field research activities. 64 Researchprograms <strong>in</strong> ESA case study countries are smaller than <strong>in</strong> WCA <strong>in</strong> absoluteterms (rang<strong>in</strong>g from 3 to 11 research staff members). Although these resourcesmay not be smaller <strong>in</strong> proportion to the production <strong>of</strong> the national cotton sector,critical mass can be important <strong>in</strong> susta<strong>in</strong><strong>in</strong>g a dynamic research program.As <strong>in</strong> WCA, there is great variability among countries <strong>in</strong> the ESA region, withZimbabwe hav<strong>in</strong>g the most <strong>and</strong> Mozambique hav<strong>in</strong>g the fewest researchers.Internal <strong>and</strong> external l<strong>in</strong>ks are important to the effectiveness <strong>and</strong> impact <strong>of</strong>agricultural research. Internal l<strong>in</strong>ks refer to relationships among nationalstakeholders, particularly <strong>in</strong>stitutional l<strong>in</strong>ks between research <strong>and</strong> extension, aswell as direct contact between researchers <strong>and</strong> company <strong>and</strong> farmer clients(considered <strong>in</strong> more detail later <strong>in</strong> this chapter). Virtually all countries havebeen trend<strong>in</strong>g toward lower extension worker–farmer ratios, with a high share<strong>of</strong> extension workers’ time devoted to <strong>in</strong>put delivery <strong>and</strong> credit management(chapter 6). External l<strong>in</strong>ks, such as regional research networks, are importantfor leverag<strong>in</strong>g the impact <strong>of</strong> country-level research resources. These l<strong>in</strong>ks werestrong <strong>in</strong> Francophone countries <strong>in</strong> previous decades, but they have s<strong>in</strong>ceweakened, while they are nonexistent or weak <strong>in</strong> ESA. The Association forStrengthen<strong>in</strong>g Agricultural Research <strong>in</strong> Eastern <strong>and</strong> Central <strong>Africa</strong> has no cottonresearch network, while the West <strong>and</strong> Central <strong>Africa</strong>n Council for AgriculturalResearch <strong>and</strong> Development has recognized the need to rejuvenate cotton<strong>in</strong> its strategic plan. Reports <strong>of</strong> the International <strong>Cotton</strong> Advisory Council triannual<strong>in</strong>ternational research meet<strong>in</strong>gs <strong>in</strong>dicate that participation by <strong>Africa</strong>nresearchers is very limited.As one <strong>in</strong>dicator <strong>of</strong> research performance, table 9.1 shows the cumulativenumber <strong>of</strong> new seed varieties released by the research systems <strong>in</strong> this book’sfocus countries over the period <strong>of</strong> 1985–2005. 65 WCA countries made manyvarietal <strong>in</strong>troductions <strong>in</strong> the 1980s <strong>and</strong> early 1990s. However, the rate <strong>of</strong> <strong>in</strong>troduction<strong>of</strong> new cultivars has slowed s<strong>in</strong>ce 1995 <strong>in</strong> all three WCA countries forwhich data are shown. This evidence is consistent with the general loss <strong>of</strong> efficiencyobserved with<strong>in</strong> WCA cotton sectors over the same period as the CommunautéFrançaise d’Afrique (French community <strong>of</strong> <strong>Africa</strong>) franc devaluationfirst eased f<strong>in</strong>ancial pressure on the sectors <strong>and</strong> as the exp<strong>and</strong><strong>in</strong>g size <strong>of</strong> the sectorsmade them <strong>in</strong>creas<strong>in</strong>gly susceptible to political pressures. Meanwhile,with<strong>in</strong> ESA, Ug<strong>and</strong>a <strong>and</strong> Zimbabwe have produced a steady stream <strong>of</strong> varietalreleases, although no new varieties have been released <strong>in</strong> Ug<strong>and</strong>a <strong>in</strong> the past fiveyears. By contrast, cotton research <strong>in</strong> Mozambique, Tanzania, <strong>and</strong> Zambia has apoor record over the past 20 years, as measured by varieties <strong>of</strong>ficially released,although there is some evidence <strong>of</strong> renewed vitality s<strong>in</strong>ce the early 2000s.COTTON RESEARCH 107
Table 9.1 Number <strong>of</strong> Varietal Releases <strong>in</strong> Study CountriesCumulative number <strong>of</strong> varietal releasesCountry2000–05 1995–2005 1985–2005Burk<strong>in</strong>a Faso 1 1 10Cameroon 1 2 7Mali 4 6 27Mozambique 2 a 2 2Tanzania 0 0 1Ug<strong>and</strong>a 0 3 6Zambia 1 b 1 3Zimbabwe 2 at least 4 at least 8Source: Country case study reports.a. These two varieties were <strong>in</strong>troduced with support from the Mozambique <strong>Cotton</strong>Institute <strong>in</strong> collaboration with g<strong>in</strong>n<strong>in</strong>g companies, but they were not <strong>of</strong>ficially released bythe research system.b. In addition to the one variety released, up to six promis<strong>in</strong>g varieties are <strong>in</strong> the pipel<strong>in</strong>e.In addition to varietal development, WCA countries <strong>in</strong>vested considerableeffort <strong>in</strong> the development <strong>of</strong> <strong>in</strong>tegrated pest management (IPM) <strong>and</strong> pestscout<strong>in</strong>g methods to reduce costs <strong>and</strong> pest resistance buildup. Unlike varieties,where companies can enforce adoption, uptake <strong>of</strong> IPM methods by farmershas tended to be slow despite potential <strong>in</strong>creased returns to adoption. Othercrop management <strong>in</strong>novations have met with greater acceptance by farmers.The use <strong>of</strong> organic fertilizer <strong>in</strong> Mali <strong>and</strong> the rapid uptake <strong>of</strong> herbicides <strong>and</strong>direct sow<strong>in</strong>g <strong>in</strong> Cameroon are examples <strong>of</strong> emerg<strong>in</strong>g success stories. The variableadoption rates <strong>of</strong> different technologies <strong>in</strong>dicate the need for greater <strong>in</strong>tegration<strong>of</strong> social scientists <strong>in</strong> on-farm test<strong>in</strong>g <strong>and</strong> early adoption studies.ARTICULATING RESEARCH DEMAND: INSIGHTS FROMTHE TYPOLOGY?Despite historical <strong>in</strong>fluences on the performance <strong>of</strong> research <strong>in</strong> <strong>Africa</strong>, thepositive engagement <strong>of</strong> the private sector <strong>in</strong> cotton research <strong>in</strong> other parts <strong>of</strong>the world (for example, Australia <strong>and</strong> Brazil) suggests that the g<strong>in</strong>n<strong>in</strong>g <strong>in</strong>dustrycould also <strong>in</strong>fluence performance <strong>in</strong> <strong>Africa</strong> if g<strong>in</strong>ners were encouraged tocontribute to research management, perhaps as part <strong>of</strong> a wider public-privatepartnership for cotton sector research. Under such circumstances, g<strong>in</strong>nerscould do the follow<strong>in</strong>g:■■Fund research through direct contributions. Alternatively, g<strong>in</strong>ners might bethe conduit for levies on cotton production activities to support research.Work to attract complementary donor fund<strong>in</strong>g for research efforts.108 BOUGHTON AND POULTON
■■■Be <strong>in</strong>volved <strong>in</strong> sett<strong>in</strong>g research priorities.Monitor research performance <strong>and</strong> dem<strong>and</strong> an account<strong>in</strong>g <strong>of</strong> how researchfunds have been used.Given that cotton research is <strong>of</strong>ten underfunded <strong>and</strong> suffers from the weakmanagement characteristics <strong>of</strong> many <strong>Africa</strong>n public sector organizations,significant improvements <strong>in</strong> research performance could be expected ifg<strong>in</strong>ners were to be so <strong>in</strong>volved. 66The ma<strong>in</strong> hypothesis derived from the typology <strong>of</strong> cotton sectors is thatsmaller numbers <strong>of</strong> g<strong>in</strong>ners (with<strong>in</strong> concentrated sectors or monopoly systems)should f<strong>in</strong>d it easier than large numbers <strong>of</strong> players <strong>in</strong> a competitive sectorto agree on their relative contributions to the fund<strong>in</strong>g <strong>of</strong> research. Thoseg<strong>in</strong>ners should have stronger <strong>in</strong>centives to monitor research performance <strong>in</strong>the detail <strong>and</strong> for the length <strong>of</strong> time required to beg<strong>in</strong> to see improvements <strong>in</strong>the efficiency with which funds are used. 67 Thus, concentrated sectors <strong>and</strong>monopoly systems could be expected to perform better than competitive ones<strong>in</strong> research. 68 However, competitive sectors with many players could overcomethis weakness through an effectively managed research fund to which all arerequired to contribute.In practice, the l<strong>in</strong>k between current cotton sector structure <strong>and</strong> researchperformance is weak (table 9.1). A key reason is that, despite much <strong>in</strong>vestmentaimed at improv<strong>in</strong>g the performance <strong>of</strong> public research <strong>in</strong>stitutions, overhaul<strong>in</strong>gthe systems <strong>of</strong> <strong>in</strong>centives <strong>and</strong> accountability for scientists has not been possible.Most research programs rema<strong>in</strong> firmly with<strong>in</strong> the public sector, withresearchers appo<strong>in</strong>ted through normal public sector channels, paid on publicsector salary scales, <strong>and</strong> accountable primarily to national public sectorresearch managers. Some signs <strong>of</strong> renewed research vitality are observed wherethese conditions have been slightly relaxed. However, there is still a long way togo <strong>in</strong> most cases. At the same time, governments have been slow to allow privateg<strong>in</strong>ners to contribute to research management, even where g<strong>in</strong>ners havebeen allowed to assume responsibility for most other aspects <strong>of</strong> national cottonproduction <strong>and</strong> market<strong>in</strong>g.In Tanzania <strong>and</strong> Mozambique, cotton companies have contributed toresearch fund<strong>in</strong>g through levies on seed cotton purchased or on l<strong>in</strong>t exported.In Mozambique, there has been periodic pressure from some companies toreduce the value <strong>of</strong> the levy, which has contributed to a sense <strong>of</strong> <strong>in</strong>stability <strong>and</strong><strong>in</strong>security with<strong>in</strong> the research program; such <strong>in</strong>stability is clearly detrimental toperformance. Meanwhile, other companies have opted to work directly withresearchers (both national <strong>and</strong> <strong>in</strong>ternational), <strong>in</strong>clud<strong>in</strong>g on test<strong>in</strong>g new seed varieties.The Mozambican company LOMACO was the ma<strong>in</strong> example dur<strong>in</strong>g the late1990s, but its <strong>in</strong>itiative was abruptly ended when parent company LONRHOceased its <strong>in</strong>volvement <strong>in</strong> <strong>Africa</strong> <strong>in</strong> the late 1990s. In a promis<strong>in</strong>g development,the Mozambique <strong>Cotton</strong> Institute brought together researchers (government<strong>and</strong> university) <strong>and</strong> <strong>in</strong>terested companies to multiply <strong>and</strong> dissem<strong>in</strong>ate seedCOTTON RESEARCH 109
varieties developed for similar agro-ecological conditions <strong>in</strong> other countries, aswell as to test improved crop management practices. Stakeholders meet oneday a year to report on <strong>and</strong> plan research activities. This low transaction costapproach, plus company <strong>in</strong>put <strong>in</strong>to the subsequent work, seems to have conv<strong>in</strong>cedcompanies that it is an <strong>in</strong>itiative worth their participation.In Tanzania, despite the existence <strong>of</strong> the Tanzania <strong>Cotton</strong> Association(TCA), g<strong>in</strong>ners’ participation <strong>in</strong> the management <strong>of</strong> the sectorwide <strong>Cotton</strong>Development Fund <strong>and</strong> despite several years <strong>of</strong> uncerta<strong>in</strong>ty over the status <strong>and</strong>quality <strong>of</strong> the new UK91 seed, g<strong>in</strong>ners have not organized to dem<strong>and</strong> greateraccountability <strong>of</strong> the cotton research system to <strong>in</strong>dustry stakeholders. In 2006,TCA set up a Crop Development Committee to consider all matters related toproduction enhancement (presumably <strong>in</strong>clud<strong>in</strong>g research). However, as <strong>of</strong>early 2007 the committee had not held its first meet<strong>in</strong>g. This lack is perhapssymptomatic <strong>of</strong> the <strong>in</strong>centive problem (free-rid<strong>in</strong>g) <strong>in</strong> a competitive marketstructure. Nevertheless, the fact that much research fund<strong>in</strong>g came through<strong>Cotton</strong> Development Fund levies for a few years may have raised expectationsabout performance. In 2006, the government committed once aga<strong>in</strong> to pay forresearch directly as a way <strong>of</strong> reduc<strong>in</strong>g levies with<strong>in</strong> the sector. As a result, theflow <strong>of</strong> funds became too unreliable to susta<strong>in</strong> serious research activity. Break<strong>in</strong>gthe stakeholder-fund<strong>in</strong>g l<strong>in</strong>k was a step backward.In Zambia s<strong>in</strong>ce 1999, research has been the responsibility <strong>of</strong> the <strong>Cotton</strong>Development Trust (CDT), which is <strong>in</strong>tended to be semi-autonomous toencourage greater participation by other stakeholders, <strong>in</strong>clud<strong>in</strong>g farmers <strong>and</strong>g<strong>in</strong>ners. G<strong>in</strong>ners were skeptical <strong>of</strong> CDT at its <strong>in</strong>ception, given the moribundnature <strong>of</strong> the state research apparatus that it replaced <strong>and</strong> the fact that many <strong>of</strong>the staff members were the same. To counter this overlap, CDT sought to buildrelationships with g<strong>in</strong>ners <strong>and</strong> farmers, <strong>in</strong>clud<strong>in</strong>g <strong>in</strong>volv<strong>in</strong>g them <strong>in</strong> researchpriority sett<strong>in</strong>g <strong>and</strong> farm trials. However, g<strong>in</strong>ners resisted the notion <strong>of</strong> a levyto fund research with<strong>in</strong> the sector until they could see that funds might be usedeffectively. This resistance highlights the po<strong>in</strong>t that g<strong>in</strong>ners expect to monitorresearch performance <strong>and</strong> to see an account<strong>in</strong>g <strong>of</strong> how research funds are used<strong>in</strong> return for their contributions to fund<strong>in</strong>g the research. As <strong>of</strong> mid-2008, littleactive collaboration existed between the major g<strong>in</strong>ners <strong>and</strong> CDT.With<strong>in</strong> ESA the greatest <strong>in</strong>volvement <strong>of</strong> the private sector <strong>in</strong> cotton researchhas occurred <strong>in</strong> Zimbabwe. As noted above, Zimbabwe has a strong tradition<strong>of</strong> public sector cotton research conducted <strong>in</strong> collaboration with the privatesector. This approach dates back to an era when the Commercial Farmers’Union advocated strongly for public <strong>in</strong>vestment to support the <strong>in</strong>terests <strong>and</strong>competitiveness <strong>of</strong> the country’s white commercial farmers. After <strong>in</strong>dependence,close l<strong>in</strong>ks were ma<strong>in</strong>ta<strong>in</strong>ed between the parastatal <strong>Cotton</strong> Market<strong>in</strong>gBoard (CMB) <strong>and</strong> the <strong>Cotton</strong> Research Institute (CRI). Follow<strong>in</strong>g liberalization,Quton Seed Company, a wholly owned subsidiary <strong>of</strong> CMB’s privatizedsuccessor COTTCO, was granted monopoly rights to multiply <strong>and</strong> sell to thewhole sector seed varieties produced by CRI, <strong>in</strong> exchange for which Quton110 BOUGHTON AND POULTON
made royalty payments to CRI. When state fund<strong>in</strong>g for CRI collapsed after2001, these royalty payments became <strong>in</strong>creas<strong>in</strong>gly important, albeit <strong>in</strong>adequateto susta<strong>in</strong> a dynamic program. Quton, therefore, began to <strong>in</strong>vest <strong>in</strong> its ownresearch capability, which is now reckoned to surpass that <strong>of</strong> CRI. As <strong>of</strong> early2007, Quton was prepar<strong>in</strong>g to release the first products <strong>of</strong> its <strong>in</strong>-house researchactivity, <strong>and</strong> there was also talk <strong>of</strong> Quton tak<strong>in</strong>g over the assets <strong>of</strong> CRI. Quton’s<strong>in</strong>vestment first <strong>in</strong> CRI <strong>and</strong> later <strong>in</strong> its own research capacity reflects the strongrecognition with<strong>in</strong> Zimbabwe <strong>of</strong> the importance <strong>of</strong> productivity-enhanc<strong>in</strong>gresearch. However, it is no co<strong>in</strong>cidence that it has occurred <strong>in</strong> a concentratedsector where COTTCO, as the largest firm, is also the biggest beneficiary <strong>of</strong>national research outputs.Historically, the parastatals <strong>in</strong> WCA were heavily <strong>in</strong>volved <strong>in</strong> fund<strong>in</strong>g cottonresearch. One consequence <strong>of</strong> this <strong>in</strong>volvement was the focus with<strong>in</strong> breed<strong>in</strong>gprograms on varieties with higher g<strong>in</strong>n<strong>in</strong>g outturn ratios (GORs) that lead toimproved g<strong>in</strong>n<strong>in</strong>g marg<strong>in</strong>s, rather than on farm yield. In theory, higher g<strong>in</strong>n<strong>in</strong>gmarg<strong>in</strong>s can be passed on to farmers, but it is not clear that farmers wouldhave made this their breed<strong>in</strong>g priority had they been consulted at the time.Also, GOR is less visible to farmers than it is to g<strong>in</strong>ners <strong>and</strong> is less visible t<strong>of</strong>armers than is farm yield. Both these characteristics suggest that, especiallywhere g<strong>in</strong>ners have some market power, farmers will benefit more from<strong>in</strong>creases <strong>in</strong> farm yields than from <strong>in</strong>creases <strong>in</strong> GOR. S<strong>in</strong>ce 2000, the ma<strong>in</strong>organizational change <strong>in</strong> WCA has been a trend toward jo<strong>in</strong>t f<strong>in</strong>anc<strong>in</strong>g <strong>of</strong>research by all stakeholders through the <strong>in</strong>terpr<strong>of</strong>essional organizations set up<strong>in</strong> response to f<strong>in</strong>ancial crises.Research systems <strong>in</strong> WCA <strong>and</strong> ESA will <strong>in</strong>creas<strong>in</strong>gly have to respond todem<strong>and</strong> from <strong>in</strong>ternational traders <strong>and</strong> sp<strong>in</strong>ners to take <strong>in</strong>to account a morecomplex set <strong>of</strong> fiber quality parameters <strong>in</strong> variety selection (chapter 7).Increas<strong>in</strong>g the number <strong>of</strong> parameters can dramatically complicate breed<strong>in</strong>gprograms, suggest<strong>in</strong>g even greater need for <strong>in</strong>creased resources for varietalresearch <strong>in</strong> these countries. 69 Also, because economies <strong>of</strong> scale <strong>in</strong> research maybe high where several countries share common agro-ecological conditions,these more complex dem<strong>and</strong>s on breeders provide additional arguments forstrengthen<strong>in</strong>g regional collaboration <strong>in</strong> these programs.CONCLUSIONSOverall, research <strong>in</strong> <strong>Africa</strong>n cotton systems is underperform<strong>in</strong>g, as evidencedprimarily by the slow rate <strong>of</strong> yield growth <strong>and</strong> technology adoption <strong>in</strong> Sub-Saharan <strong>Africa</strong> relative to other major cotton grow<strong>in</strong>g areas <strong>of</strong> the world. Reasonsfor this poor performance <strong>in</strong>clude the limited resources <strong>in</strong>vested <strong>in</strong> cottonresearch, lack <strong>of</strong> <strong>in</strong>centives <strong>and</strong> accountability for publicly funded researchers,weak l<strong>in</strong>ks among researchers <strong>in</strong> different countries, <strong>and</strong> the limited responsiveness<strong>of</strong> cotton research programs to g<strong>in</strong>ners <strong>and</strong> farmers. Governments haveCOTTON RESEARCH 111
een slow to allow private g<strong>in</strong>ners to contribute to research management, whilefarmer associations are rarely strong enough, especially <strong>in</strong> ESA, to articulatefirm dem<strong>and</strong>s for high-quality research effort.The reluctance <strong>of</strong> the public sector to rel<strong>in</strong>quish or share control over cottonresearch, plus the long lags <strong>in</strong>herent <strong>in</strong> agricultural research, mean (a) that thecurrent structure <strong>of</strong> the g<strong>in</strong>n<strong>in</strong>g <strong>in</strong>dustry exerts a weaker <strong>in</strong>fluence over researchperformance than has been hypothesized <strong>in</strong> this analysis <strong>and</strong> (b) that historyexerts a relatively greater <strong>in</strong>fluence. However, recent experience <strong>in</strong> Mozambique,Zambia, <strong>and</strong> Zimbabwe, comb<strong>in</strong>ed with the trend <strong>in</strong> WCA toward jo<strong>in</strong>t f<strong>in</strong>anc<strong>in</strong>g<strong>of</strong> research by all stakeholders through the <strong>in</strong>terpr<strong>of</strong>essional organizations, suggeststhat concentrated sectors <strong>and</strong> monopoly systems may, over time, beg<strong>in</strong> toperform better than competitive ones with regard to research.Irrespective <strong>of</strong> sector type, a high policy priority should be to move towardgreater <strong>in</strong>volvement <strong>of</strong> both g<strong>in</strong>ners <strong>and</strong> farmers <strong>in</strong> research management. Theprecise model, which can <strong>in</strong>volve a greater or lesser role for state agents, can beworked out locally. However, ideally it should do the follow<strong>in</strong>g:■■■■■Include <strong>in</strong>volv<strong>in</strong>g stakeholders <strong>in</strong> sett<strong>in</strong>g research priorities, monitor<strong>in</strong>gresearch performance, <strong>and</strong> account<strong>in</strong>g for how research funds have beenused.Reward researchers who achieve high performance <strong>and</strong> meet stakeholders’expectations.Include majority fund<strong>in</strong>g <strong>of</strong> research effort by the <strong>in</strong>dustry through directcontributions or levies. Stakeholders should also work together to attractoutside fund<strong>in</strong>g to complement <strong>in</strong>ternal resources, <strong>and</strong> such collaborationwill be facilitated by the confidence that comes from work<strong>in</strong>g together to setpriorities <strong>and</strong> to monitor performance.Allow stakeholders, through whatever management regime is put <strong>in</strong> place,to play a key role <strong>in</strong> researchers’ evaluation, pay, <strong>and</strong> promotion (or term<strong>in</strong>ation),rather than rely<strong>in</strong>g on public sector practices <strong>and</strong> scales.Feature more active regional <strong>in</strong>formation shar<strong>in</strong>g, strategic priority sett<strong>in</strong>g,<strong>and</strong> eventually f<strong>in</strong>anc<strong>in</strong>g across countries <strong>in</strong> similar agro-ecological zones.With improved fund<strong>in</strong>g, human resources, <strong>and</strong> management, cottonresearch could yet play a vital role <strong>in</strong> help<strong>in</strong>g <strong>Africa</strong>’s cotton sectors improvecompetitiveness. Specific opportunities for technological progress <strong>in</strong>clude theidentification <strong>of</strong> well-adapted varieties with stacked genes <strong>in</strong>corporat<strong>in</strong>g Bt<strong>and</strong> herbicide resistance, <strong>in</strong>tegrated soil <strong>and</strong> water management strategies toreduce the impact <strong>of</strong> ra<strong>in</strong>fall variability <strong>and</strong> to adapt to rapidly <strong>in</strong>creas<strong>in</strong>g costs<strong>of</strong> <strong>in</strong>organic fertilizers, <strong>and</strong> improved <strong>in</strong>tegrated pest management packages(<strong>in</strong>clud<strong>in</strong>g herbicides for farmers without animal traction). The extent towhich these technologies improve the productivity <strong>of</strong> farmers with differentasset bases needs to be carefully analyzed to avoid a one-size-fits-all approach112 BOUGHTON AND POULTON
<strong>and</strong> to identify complementary <strong>in</strong>vestments that may be needed to enablefarmers to use technology effectively.F<strong>in</strong>ally, while renewed attention to research fund<strong>in</strong>g <strong>and</strong> management areessential if <strong>Africa</strong>n cotton sectors are to shift their productivity frontier <strong>and</strong>rema<strong>in</strong> competitive <strong>in</strong> a dynamic world, attention must also be given to assess<strong>in</strong>gthe potential to raise the productivity <strong>of</strong> farmers who are currently wellbelow the frontier. As the next chapter argues, these efforts are likely to be longterm <strong>and</strong> to <strong>in</strong>volve the promotion <strong>of</strong> asset accumulation (especially animaltraction), along with the design <strong>of</strong> systems that are able to supply credit evento poorer farm<strong>in</strong>g households.COTTON RESEARCH 113
SECTION FOURComparative Analysis:Outcomes
CHAPTER TENYields <strong>and</strong> Returns toFarmersCol<strong>in</strong> Poulton, Patrick Labaste, <strong>and</strong>Duncan BoughtonPr<strong>of</strong>itability <strong>of</strong> cotton cultivation at the farm level is one <strong>of</strong> the keyexpected outcomes <strong>of</strong> a viable <strong>and</strong> susta<strong>in</strong>able cotton sector <strong>and</strong> as suchis a fundamental <strong>in</strong>dicator <strong>of</strong> sector performance. Pr<strong>of</strong>itability, <strong>in</strong> turn,depends on several ma<strong>in</strong> variables: productivity at field level, as reflected <strong>in</strong>seed cotton yields; prices paid to farmers for their seed cotton (already analyzed<strong>in</strong> chapter 6), eventually <strong>in</strong>clud<strong>in</strong>g quality premiums; <strong>and</strong> costs <strong>in</strong>curredby farmers <strong>in</strong> the production process. Pr<strong>of</strong>itability should also <strong>in</strong>clude thevalorization <strong>of</strong> cotton seed, even though, as discussed <strong>in</strong> chapter 8, <strong>Africa</strong>nfarmers generally do not receive a specific payment for the seeds.As po<strong>in</strong>ted out <strong>in</strong> the previous chapter, farm-level world average yieldsfor ra<strong>in</strong>fed cotton have <strong>in</strong>creased sharply <strong>and</strong> steadily s<strong>in</strong>ce 1980, whileaverage yields <strong>in</strong> Sub-Saharan <strong>Africa</strong> (SSA) have not kept pace dur<strong>in</strong>g thesame period. This chapter first exam<strong>in</strong>es the data on yields across countries<strong>and</strong> sector types. It then assesses returns to farmers on the basis <strong>of</strong> cropbudgets evaluated accord<strong>in</strong>g to categories <strong>of</strong> farmers identified us<strong>in</strong>g theparticipatory rural appraisal focus group methodology as shown <strong>in</strong> theannex to this chapter. 70COTTON YIELDS<strong>Cotton</strong> yields on farmer fields are an important determ<strong>in</strong>ant <strong>of</strong> sector competitiveness<strong>and</strong> its impact on poverty reduction. This section focuses on yield117
trends <strong>in</strong> global <strong>and</strong> regional contexts, factors underly<strong>in</strong>g those trends, <strong>and</strong>their relationship to different ways <strong>of</strong> organiz<strong>in</strong>g the cotton sector. When onecompares across sector types, it is helpful to consider average yields <strong>and</strong> yieldtrends. The typology <strong>in</strong> chapter 4 suggests that average yields will be strongly<strong>in</strong>fluenced by performance on <strong>in</strong>put provision <strong>and</strong> extension (expected to bebest <strong>in</strong> monopolies <strong>and</strong> concentrated sectors), but yields will also depend heavilyon past <strong>in</strong>vestments, especially <strong>in</strong> research.<strong>Cotton</strong> Yields <strong>in</strong> a Global ContextWorld cotton yields expressed <strong>in</strong> l<strong>in</strong>t equivalent have <strong>in</strong>creased from an average<strong>of</strong> 300 kg per hectare (ha) <strong>in</strong> the early 1960s to more than 700 kg/ha <strong>in</strong>2005, equivalent to a 1.9 percent annual <strong>in</strong>crease (figure 10.1). Yields <strong>in</strong> West<strong>and</strong> Central <strong>Africa</strong> (WCA) <strong>in</strong>creased at an annual rate <strong>of</strong> 5 percent until theearly 1980s, reach<strong>in</strong>g about 450 kg/ha at that time, ma<strong>in</strong>ly <strong>in</strong> response to the<strong>in</strong>troduction <strong>of</strong> fertilizer (a characteristic <strong>in</strong> all cotton produc<strong>in</strong>g WCA countries).Yields <strong>in</strong> this region, however, have stagnated or even decl<strong>in</strong>ed slowlyover the past 20 years. 71 Yields <strong>in</strong> East <strong>and</strong> Southern <strong>Africa</strong> (ESA) have been<strong>in</strong>creas<strong>in</strong>g at the same rate as the world average s<strong>in</strong>ce the early 1970s, albeitfrom a very low base. Average yields <strong>in</strong> ESA as <strong>of</strong> mid-2008 are slightly morethan one-half the WCA average <strong>and</strong> one-third the world average.If one is to underst<strong>and</strong> the factors underly<strong>in</strong>g long-term yield trends, a dist<strong>in</strong>ctionmust first be made between irrigated <strong>and</strong> ra<strong>in</strong>fed production systems.<strong>Africa</strong>’s cotton is almost entirely ra<strong>in</strong>fed, while world average yields reflect theFigure 10.1 <strong>Cotton</strong> Yield Trends <strong>in</strong> World, WCA, <strong>and</strong> ESA (1970–2008)800yields <strong>of</strong> l<strong>in</strong>t (kg/hectare)60040020001970–711974–751978–791982–831986–871990–911994–951998–992002–032006–07World WCA ESASource: Authors.118 POULTON, LABASTE, AND BOUGHTON
fact that 55 percent <strong>of</strong> cotton is produced under irrigated conditions. Thoughaverage yields under irrigation are much higher than under ra<strong>in</strong>fed conditions,worldwide yield growth has been much greater <strong>in</strong> the latter: average yield <strong>in</strong>ra<strong>in</strong>fed cultivation more than doubled between 1980 <strong>and</strong> 2005, grow<strong>in</strong>g 3.9percent per year, while yield <strong>in</strong> irrigated systems <strong>in</strong>creased by only 60 percent,or 1.8 percent per year (figure 10.2). Yet <strong>Africa</strong>, where nearly all production isra<strong>in</strong>fed, has not seen this k<strong>in</strong>d <strong>of</strong> growth: ESA yields have risen only about 2.1percent per year, while WCA yields have stagnated or decl<strong>in</strong>ed. As a result, whileWCA yields were well above world average ra<strong>in</strong>fed yields <strong>in</strong> 1980/81, the rest <strong>of</strong>the world’s ra<strong>in</strong>fed cotton production systems have now surpassed WCA. Whathas been driv<strong>in</strong>g these divergent yield trends?Evolution <strong>of</strong> <strong>Cotton</strong> Yields <strong>in</strong> WCA <strong>and</strong> ESADecl<strong>in</strong><strong>in</strong>g cotton yields <strong>in</strong> WCA are commonly expla<strong>in</strong>ed by (a) a decl<strong>in</strong>e <strong>in</strong>fertilizer use, partly result<strong>in</strong>g from a reallocation to food crops; (b) a decl<strong>in</strong>e<strong>in</strong> the number <strong>of</strong> <strong>in</strong>secticide applications, lead<strong>in</strong>g to higher <strong>in</strong>festation levels;(c) problems with seed quality, <strong>of</strong>ten quoted as a reason for decl<strong>in</strong><strong>in</strong>g yields <strong>in</strong><strong>in</strong>terviews with farmers <strong>in</strong> Mali <strong>in</strong> 2007; <strong>and</strong> (d) a degradation <strong>of</strong> soil fertilityfrom cont<strong>in</strong>uous cultivation <strong>and</strong> <strong>in</strong>sufficiently adapted fertilization formulas.These factors are discussed <strong>in</strong> more detail later <strong>in</strong> this chapter.Country average yields over time mask variation with<strong>in</strong> countries fromspatial <strong>and</strong> socioeconomic factors. In Ben<strong>in</strong>, for example, dur<strong>in</strong>g the 2001/02Figure 10.2 Average Worldwide Yields <strong>of</strong> Irrigated <strong>and</strong> Ra<strong>in</strong>fed <strong>Cotton</strong>1,2001,000956yields <strong>of</strong> l<strong>in</strong>t (kg/hectare)80060040060944920017201980/81 2005/06yearIrrigatedDryl<strong>and</strong>Source: Authors.YIELDS AND RETURNS TO FARMERS 119
cropp<strong>in</strong>g season, seed cotton yields ranged from 810 kg/ha <strong>in</strong> the south to1,318 kg/ha <strong>in</strong> the north, primarily as a result <strong>of</strong> the <strong>in</strong>troduction <strong>of</strong> a moreproductive variety <strong>in</strong> the north. Spatial factors l<strong>in</strong>ked to climatic <strong>and</strong> soilconditions also contribute to large differences <strong>in</strong> yields between southern <strong>and</strong>northern Cameroon (670 kg/ha <strong>and</strong> 1,500 kg/ha, respectively). In both regions<strong>of</strong> the country, yields decl<strong>in</strong>ed follow<strong>in</strong>g the reduction <strong>of</strong> fertilizer subsidies.The role <strong>of</strong> socioeconomic differentiation can be illustrated by Mali, wherefarm yields <strong>in</strong> 2002/03 ranged from 1,090 kg/ha with manual cultivation to1,259 kg/ha for farms equipped with their own animal traction.Figure 10.3 illustrates differences <strong>in</strong> cotton yields (l<strong>in</strong>t equivalent) amongthe major ESA cotton producers, based on a 20-year average. ESA countryaverages are well below world <strong>and</strong> WCA levels, <strong>and</strong> vary by a factor <strong>of</strong> morethan two between Mozambique (lowest) Zimbabwe (highest). Most cottonsectors <strong>in</strong> ESA are based on a low <strong>in</strong>put–low output system. For example, outsideZimbabwe virtually no fertilizer is applied by ESA cotton farmers, whobenefit from better soils than farmers <strong>in</strong> WCA. Countries <strong>in</strong> ESA generallyshow greater <strong>in</strong>ter-annual yield variability from climatic events than countries<strong>in</strong> WCA.The steady yield improvement <strong>in</strong> ESA is due to improved varieties <strong>and</strong>, <strong>in</strong>some countries, improved <strong>in</strong>put use. Zambia has shown a steady (but slow)upward yield trend s<strong>in</strong>ce liberalization; the <strong>in</strong>put distribution <strong>and</strong> extensionefforts <strong>of</strong> the two dom<strong>in</strong>ant companies are the ma<strong>in</strong> reasons. However, ESAhas not seen rapid <strong>in</strong>creases <strong>in</strong> productivity like those <strong>in</strong> Ch<strong>in</strong>a, India, <strong>and</strong> Pakistan,where genetically modified cotton varieties were <strong>in</strong>troduced.Figure 10.3 Average Yields <strong>of</strong> Ra<strong>in</strong>fed <strong>Cotton</strong> <strong>in</strong> ESA Countries, WCA,<strong>and</strong> World, 1994/95–2003/04700600yields <strong>of</strong> l<strong>in</strong>t (kg/hectare)5004003002001000Mozambique Tanzania Ug<strong>and</strong>a Zambia ZimbabweSource: International <strong>Cotton</strong> Advisory Committee.Note: ESA = East <strong>and</strong> Southern <strong>Africa</strong>; WCA = West <strong>and</strong> Central <strong>Africa</strong>.WCAWorld120 POULTON, LABASTE, AND BOUGHTON
Yields by Farmer TypeTo assess performance <strong>of</strong> different categories <strong>of</strong> farmers, focus groups undertookdiscussions as part <strong>of</strong> this study <strong>in</strong> seven <strong>of</strong> the n<strong>in</strong>e study countries (allexcept Ben<strong>in</strong> <strong>and</strong> Cameroon). Respondents were asked to group farmers <strong>in</strong>their area accord<strong>in</strong>g to volumes <strong>of</strong> production. Generally speak<strong>in</strong>g, the groupscan be thought <strong>of</strong> as large (group 1), medium (group 2), small (group 3), <strong>and</strong>very small (group 4) producers. In some countries, respondents identified onlythree groups (large, medium, <strong>and</strong> small) although what constitutes each categoryvaries by country context. Additional details about the methodology <strong>of</strong>this research—<strong>and</strong> its limitations—can be found <strong>in</strong> the annex to this chapter.A key <strong>in</strong>sight emerg<strong>in</strong>g from the farmer group <strong>in</strong>terviews concerns the variation<strong>in</strong> yields across groups with<strong>in</strong> <strong>in</strong>dividual countries, which are at least asgreat as the variations across countries. These variants are shown <strong>in</strong> figure 10.4.There are two ma<strong>in</strong> causes <strong>of</strong> this variation across groups with<strong>in</strong> a country.First, differences <strong>in</strong> access to <strong>in</strong>put are an important factor <strong>in</strong> ESA, but much lessso <strong>in</strong> WCA. Largely as a result, the variation <strong>in</strong> yields across groups is less pronounced<strong>in</strong> WCA than <strong>in</strong> ESA. The average ratio <strong>of</strong> yields between the top <strong>and</strong>bottom groups <strong>in</strong> the three WCA cotton sectors is 1.65, compared with 6.4 <strong>in</strong> thefive ESA sectors. A second reason is differences <strong>in</strong> ownership <strong>of</strong> assets, <strong>of</strong> whichthe most important are arguably oxen <strong>and</strong> plow<strong>in</strong>g equipment. Households thatFigure 10.4 Variation <strong>in</strong> Yields across Farmer Groups2,500yields <strong>of</strong> seed cotton by producer (kg/ha)2,0001,5001,0005000Burk<strong>in</strong>a FasoCameroonMaliMozambiqueTanzaniaUg<strong>and</strong>aZambiaZimbabweGroup 1 Group 2 Group 3 Group 4Source: Authors.YIELDS AND RETURNS TO FARMERS 121
own their own animals <strong>and</strong> plows can prepare their l<strong>and</strong> as soon as the ra<strong>in</strong>sbeg<strong>in</strong>, thus permitt<strong>in</strong>g timely plant<strong>in</strong>g (a prerequisite for good yields) <strong>and</strong> thecultivation <strong>of</strong> larger areas <strong>of</strong> l<strong>and</strong>. Larger producers also tend to have family laboror the work<strong>in</strong>g capital to hire labor <strong>in</strong> a timely fashion. The poorest farmers are<strong>of</strong>ten caught <strong>in</strong> a food <strong>in</strong>security trap, which causes them to hire out their laborfor immediate cash <strong>in</strong>come <strong>in</strong>stead <strong>of</strong> work<strong>in</strong>g on their cotton plots.SummaryYield levels <strong>and</strong> trends at regional <strong>and</strong> country levels are correlated with cottonsector organization. The national monopoly systems established <strong>in</strong> the Francophonecountries <strong>of</strong> WCA delivered impressive <strong>and</strong> susta<strong>in</strong>ed yield growthover a period <strong>of</strong> three decades, from very low yields <strong>in</strong> the 1950s to well abovethe world ra<strong>in</strong>fed average yield <strong>in</strong> the 1980s (around 1,200 to 1,400 kg/ha <strong>of</strong>seed cotton). This achievement was due to a reliable system for varietal development,<strong>in</strong>put supply <strong>and</strong> credit, quality extension services, <strong>and</strong> logisticalorganization provided by the cotton companies. S<strong>in</strong>ce the mid-1980s, thistrend has not been susta<strong>in</strong>ed <strong>and</strong> the productivity gap has started to widen.The system has not demonstrated a capacity to adapt to chang<strong>in</strong>g technical <strong>and</strong>economic circumstances, particularly with regard to mak<strong>in</strong>g improved technicalpackages available to farmers.In ESA countries, the trend has been slow but steady <strong>in</strong>creases <strong>in</strong> yields froma low base, based on low <strong>in</strong>put–low output production systems, reach<strong>in</strong>g abouthalf the world average for ra<strong>in</strong>fed cotton today. Variation <strong>in</strong> yield performanceamong ESA countries is also correlated with sector organization. Yields arehigher <strong>in</strong> the more concentrated systems (Zambia <strong>and</strong> Zimbabwe) than <strong>in</strong> themore competitive models (Tanzania <strong>and</strong> Ug<strong>and</strong>a), which have found it verydifficult to provide the services farmers need to raise their yields (figure 10.3).RETURNS TO FARMERSThe evolution <strong>and</strong> typology <strong>of</strong> cotton sectors presented <strong>in</strong> chapter 4 gives riseto an important question given the study objectives: from which type <strong>of</strong> systemdo farmers consistently benefit more? Is it a competitive system that pays thema higher share <strong>of</strong> world l<strong>in</strong>t prices but is less effective at deliver<strong>in</strong>g support servicesthat help them raise yields? Or is it a more coord<strong>in</strong>ated sector that deliversreasonable support services but a lower share <strong>of</strong> the world price? A corollaryquestion is whether some types <strong>of</strong> farmers do better under one system <strong>and</strong> othersunder another. Because farmer welfare depends on several factors <strong>and</strong>because no one sector is expected to perform best on all these factors, the typologydelivers no clear direction on how farmers will fare under different sectortypes. Yet answers to these questions are crucial to <strong>in</strong>form<strong>in</strong>g the design <strong>of</strong>reforms that improve competitiveness <strong>and</strong> accelerate poverty reduction.122 POULTON, LABASTE, AND BOUGHTON
Factors beyond company services also <strong>in</strong>fluence returns to farmers <strong>and</strong> theircosts <strong>of</strong> production. The analytical challenge is to disentangle these factorsfrom the impacts <strong>of</strong> the type <strong>of</strong> sector organization. In particular, the discussionthat follows notes the impact <strong>of</strong>■■historical <strong>in</strong>vestment by cotton sector stakeholders, especially <strong>in</strong>vestmentsby companies to promote—<strong>and</strong> by farmers to adopt—animal traction; <strong>and</strong>differences <strong>in</strong> soil fertility across cotton grow<strong>in</strong>g regions <strong>and</strong> countries.This section uses crop budget data to generate two key <strong>in</strong>dicators: returns t<strong>of</strong>amily labor <strong>and</strong> returns to total labor (<strong>in</strong>clud<strong>in</strong>g hired). Unlike <strong>in</strong> previouswork (for example, Poulton et al. 2004), crop budgets are disaggregated bytypes <strong>of</strong> farmer <strong>in</strong> each country. The types or groups <strong>of</strong> farmers are those identifiedby focus group discussions <strong>in</strong> seven <strong>of</strong> the sample countries. InCameroon, where no focus group discussions were undertaken, data fromSODECOTON monitor<strong>in</strong>g surveys were used. Figure 10.5 shows estimates <strong>of</strong>the proportion <strong>of</strong> cotton produc<strong>in</strong>g households by group <strong>in</strong> each country.Impact <strong>of</strong> Input on Crop BudgetsTable 10.1 presents summary crop budgets by farmer type. The focus is on theuse <strong>of</strong> labor <strong>and</strong> other <strong>in</strong>puts <strong>and</strong> the two key farm-level <strong>in</strong>dicators: returns t<strong>of</strong>amily labor <strong>and</strong> returns to total labor. Table 10.1 also presents data on costs <strong>of</strong>seed cotton production across groups <strong>and</strong> countries. The most strik<strong>in</strong>g f<strong>in</strong>d<strong>in</strong>gis the <strong>in</strong>crease <strong>in</strong> unit costs <strong>of</strong> production as one moves from the top producers(group 1) to the poor <strong>and</strong> less efficient ones (group 3 or 4).Figure 10.5 Proportion <strong>of</strong> <strong>Cotton</strong> Farmers by Farmer Group0.80% <strong>of</strong> farmers0.600.400.200.00Burk<strong>in</strong>a FasoCameroonMaliTanzaniaZimbabweZambiaUg<strong>and</strong>aMozambiqueGroup 1 Group 2 Group 3 Group 4Source: Authors.YIELDS AND RETURNS TO FARMERS 123
124Table 10.1 Summary Crop Budgets by Farmer Type <strong>and</strong> CountryBudget elementBurk<strong>in</strong>aFaso Cameroon a Mali Mozambique Tanzania Ug<strong>and</strong>a Zambia ZimbabweGroup 1Yield (kg/ha) 1,350 1,259 1,429 1,519 1,125 2,188 1,200 1,750Seed cotton price (US$/kg) 0.33 0.32 0.32 0.21 0.28 0.25 0.25 0.31Gross revenue (US$/kg) 441.45 399.10 452.99 322.03 314.06 547.00 300.00 542.50Cost <strong>of</strong> <strong>in</strong>put (US$/ha) 172.89 141.44 168.61 36.50 35.83 111.11 31.07 236.85Cost <strong>of</strong> hired services(US$/ha) 28.52 48.83 33.69 22.25 54.18 72.22 17.06 32.98Cost <strong>of</strong> hired labor (US$/ha) 0 0 0 136.70 122.90 116.27 150.71 65.10Gross marg<strong>in</strong>, exclud<strong>in</strong>g labor(US$/ha) 240.04 208.83 250.69 263.28 224.06 363.67 251.87 272.67Returns to all labor b (US$/day) 2.38 1.37 2.63 1.36 1.60 2.76 1.73 2.19Returns to family labor(US$/day) n.a. n.a. n.a. 2.56 3.37 3.81 2.68 6.15Cost per kg c (US$) 0.22 0.32 0.21 0.15 0.22 0.19 0.20 0.21Family labor <strong>in</strong>put (days/ha) 100.7 152 95.4 49.5 30.0 65.0 37.8 33.8Hired labor <strong>in</strong>put (days/ha) 0 0 0 144.8 110.0 67.0 108.0 90.7Net marg<strong>in</strong> (US$/ha) 140.34 –1.86 156.24 91.93 71.16 137.55 56.16 173.82Input cost/gross revenue 0.39 0.35 0.37 0.11 0.11 0.20 0.10 0.44Group 2Yield (kg/ha) 1,100 1,120 1,011 935 750 1,125 1,050 800Seed cotton price (US$/kg) 0.33 0.32 0.32 0.21 0.26 0.25 0.25 0.29Gross revenue (US$/kg) 359.70 355.04 320.49 198.22 196.88 281.25 262.50 232.00Cost <strong>of</strong> <strong>in</strong>put (US$/ha) 164.89 132.76 159.58 36.00 18.00 8.33 31.07 90.08Cost <strong>of</strong> hired services(US$/ha) 34.55 15.91 31.30 4.76 40.83 71.11 39.36 25.38
Table 10.1 Summary Crop Budgets by Farmer Type <strong>and</strong> CountryBudget elementBurk<strong>in</strong>aFaso Cameroon a Mali Mozambique Tanzania Ug<strong>and</strong>a Zambia ZimbabweCost <strong>of</strong> hired labor (US$/ha) 0 0 0 116.80 42.71 62.50 109.52 35.85Gross marg<strong>in</strong>, exclud<strong>in</strong>g labor(US$/ha) 160.26 206.37 129.61 157.46 138.05 201.81 192.07 116.55Returns to all labor b (US$/day) 1.78 1.36 1.64 0.66 1.16 2.15 1.44 1.08Returns to family labor(US$/day) n.a. n.a. n.a. 0.28 1.19 2.49 2.65 1.31Cost per kg c (US$) 0.26 0.32 0.27 0.28 0.24 0.21 0.21 0.27Family labor <strong>in</strong>put (days/ha) 90.2 152 79.1 143.0 80.0 56.0 31.2 61.4Hired labor <strong>in</strong>put (days/ha) 0 0 0 95.8 39.5 38.0 102.0 46.1Net marg<strong>in</strong> (US$/ha) 70.95 –4.32 51.29 –59.44 15.335 44.67 45.41 19.33Input cost/gross revenue 0.46 0.37 0.50 0.18 0.09 0.03 0.12 0.39Group 3Yield (kg/ha) 750 1,090 711 438 600 600 563 565Seed cotton price (US$/kg) 0.33 0.32 0.32 0.24 0.24 0.25 0.25 0.21Gross revenue (US$/kg) 245.25 345.53 225.39 103.91 144.00 150.00 140.75 119.78Cost <strong>of</strong> <strong>in</strong>put (US$/ha) 156.89 141.44 146.04 5.50 48.55 20.41 8.33 13.50Cost <strong>of</strong> hired services(US$/ha) 75.87 11.61 23.10 1.04 0 9.93 71.11 0.80Cost <strong>of</strong> hired labor (US$/ha) 0 0 0 0 0 28.57 5.21 6.70Gross marg<strong>in</strong>, exclud<strong>in</strong>g labor(US$/ha) 12.49 192.48 56.25 97.37 95.45 119.66 61.31 105.48Returns to all labor b (US$/day) 0.17 1.27 0.99 1.02 0.90 0.78 0.72 0.49Returns to family labor(US$/day) n.a. n.a. n.a. 1.02 0.90 0.72 0.74 0.49Cost per kg c (US$) 0.41 0.33 0.32 0.23 0.26 0.35 0.38 0.29Family labor <strong>in</strong>put (days/ha) 75.3 152.0 57.0 95.0 106.3 126.0 76.0 200.8Hired labor <strong>in</strong>put (days/ha) 0 0 0 0 0 27.0 9.0 13.1Net marg<strong>in</strong> (US$/ha) –62.06 –18.21 –0.19 2.37 –10.80 –58.91 –72.34 –41.78Input cost/gross revenue 0.64 0.41 0.65 0.05 0.34 0.14 0.06 0.11(cont<strong>in</strong>ued)125
126Table 10.1 (Cont<strong>in</strong>ued)Budget elementBurk<strong>in</strong>aFaso Cameroon a Mali Mozambique Tanzania Ug<strong>and</strong>a Zambia ZimbabweGroup 4Yield (kg/ha) 240 125 450Seed cotton price (US$/kg) 0.21 0.25 0.25Gross revenue (US$/kg) 50.88 31.25 112.50Cost <strong>of</strong> <strong>in</strong>put (US$/ha) 13.50 5.56 16.86Cost <strong>of</strong> hired services(US$/ha) 2.00 0 10.33Cost <strong>of</strong> hired labor (US$/ha) 5.30 0 0Gross marg<strong>in</strong>, exclud<strong>in</strong>g labor(US$/ha) 35.38 25.69 85.31Returns to all labor b (US$/day) 0.24 0.28 0.70Returns to family labor(US$/day) 0.24 0.28 0.70Cost per kg c (US$) 0.45 1.27 0.38Family labor <strong>in</strong>put (days/ha) 123.7 91.0 122.5Hired labor <strong>in</strong>put (days/ha) 25 0 0Net marg<strong>in</strong> (US$/ha) –56.51 –128.10 –60.52Input cost/gross revenue 0.27 0.18 0.15Source: Authors.Note: n.a. = not applicable.a. Because no focus groups were undertaken, Cameroon data are from monitor<strong>in</strong>g surveys by SODECOTON. Labor data are not disaggregated by farmer type <strong>and</strong> aregenerally considered too high.b. Calculations <strong>of</strong> returns to all labor assume no payment for hired labor.c. For calculations <strong>of</strong> cost per kg, all labor <strong>in</strong>put is costed at an average casual labor wage.
Accord<strong>in</strong>g to the focus group <strong>in</strong>formants, average labor <strong>in</strong>put per hectare <strong>of</strong>cotton production is 40 percent higher <strong>in</strong> ESA than <strong>in</strong> WCA. 72 The ma<strong>in</strong> reasonis the greater penetration <strong>of</strong> animal traction technology with<strong>in</strong> WCA, where itis used by nearly all farmers for l<strong>and</strong> preparation <strong>and</strong> by many for weed<strong>in</strong>g.Efforts are also be<strong>in</strong>g made to promote the use <strong>of</strong> labor-sav<strong>in</strong>g herbicides <strong>in</strong>WCA, whereas <strong>in</strong> ESA only the top two groups <strong>in</strong> Mozambique recorded anyuse <strong>of</strong> herbicides. 73 Thus, weed<strong>in</strong>g is the s<strong>in</strong>gle largest contributor to this laborusedifferential between the two regions.If one compares higher <strong>and</strong> lower produc<strong>in</strong>g groups, total labor <strong>in</strong>put fallswith production level. Smaller producers require less labor for harvest<strong>in</strong>g, tendto weed fewer times, <strong>and</strong> require less labor (if any at all) for fertilizer application<strong>and</strong> spray<strong>in</strong>g. However, smaller producers (group 3 <strong>in</strong> Mozambique, Tanzania,<strong>and</strong> Zambia; all group 4s) <strong>of</strong>ten do not have access to animal traction,even for l<strong>and</strong> preparation, so they may have to use h<strong>and</strong> hoes, which is muchmore labor <strong>in</strong>tensive. Alternatively, they have to hire plow<strong>in</strong>g services, whichraises their expenditure on hired services above that <strong>of</strong> larger producers (seeBurk<strong>in</strong>a Faso group 3, for <strong>in</strong>stance).Focus group discussions <strong>in</strong> Mali <strong>and</strong> Burk<strong>in</strong>a Faso did not dist<strong>in</strong>guishbetween family <strong>and</strong> hired labor <strong>in</strong>put, so <strong>in</strong> table 10.1 all labor <strong>in</strong>put <strong>in</strong> the WCAcountries is considered to be family labor. Although this conclusion may not beentirely true, average family sizes are much larger <strong>in</strong> WCA than <strong>in</strong> ESA, <strong>and</strong> it isunderstood that most labor tasks on WCA cotton farms are performed by familymembers. By contrast, the top producer groups <strong>in</strong> ESA rely heavily on hiredlabor, which accounts for more than 70 percent <strong>of</strong> total labor <strong>in</strong>put for group 1<strong>in</strong> Mozambique, Tanzania, Zambia, <strong>and</strong> Zimbabwe (<strong>and</strong> also <strong>in</strong> Zambia group2). Smaller producers <strong>in</strong> ESA countries are more reliant on family labor.As discussed <strong>in</strong> chapter 6, given the high <strong>in</strong>put costs associated with cottonproduction <strong>and</strong> the difficulties that <strong>Africa</strong>n smallholder households have <strong>in</strong>afford<strong>in</strong>g such <strong>in</strong>puts, one <strong>of</strong> the ma<strong>in</strong> strengths <strong>of</strong> coord<strong>in</strong>ated cotton systemsis their ability to provide producers with access to <strong>in</strong>put on credit. Participants<strong>in</strong> focus group discussions <strong>in</strong> Burk<strong>in</strong>a Faso <strong>and</strong> Mali <strong>in</strong>sisted that all groupsuse the same quantity <strong>of</strong> fertilizers per hectare (ha). This response may havebeen <strong>in</strong>fluenced by the presence <strong>of</strong> the local extension <strong>of</strong>ficer at the discussions.Yet all cotton farmers are entitled to receive a similar quantity <strong>of</strong> fertilizers (perha <strong>of</strong> cotton cultivated) on credit, so fairly uniform usage is credible. By contrast,fertilizer use is highly skewed <strong>in</strong> Ug<strong>and</strong>a <strong>and</strong> Zimbabwe, the only twocountries <strong>in</strong> ESA where any <strong>in</strong>organic fertilizer is used on cotton. Despite a 50percent subsidy <strong>in</strong> Ug<strong>and</strong>a, only group 1 farmers reported us<strong>in</strong>g fertilizers.Accord<strong>in</strong>g to participants <strong>in</strong> the focus group discussions, fertilizer use by thetop group <strong>in</strong> Zimbabwe is higher than <strong>in</strong> any other country, <strong>in</strong>clud<strong>in</strong>g WCA.However, <strong>in</strong> part as a result <strong>of</strong> nationwide fertilizer shortages <strong>in</strong> Zimbabwe <strong>in</strong>2005/06, fertilizer use by group 2 is much less than by group 1, while group 3is not considered creditworthy enough to receive credit for fertilizer—evenunder normal circumstances.YIELDS AND RETURNS TO FARMERS 127
The reasons that <strong>in</strong>organic fertilizer is not used <strong>in</strong> Mozambique, Tanzania,or Zambia vary by country. 74 In Tanzania, the highly competitive sectoralstructure makes recovery <strong>of</strong> <strong>in</strong>put loans impossible, <strong>and</strong> the passbook system(see chapter 6) is not designed to enable access to <strong>in</strong>organic fertilizers, whichare much more expensive. In Mozambique <strong>and</strong> Zambia (<strong>and</strong>, for the timebe<strong>in</strong>g, perhaps also Tanzania), it is questionable whether farmers really need<strong>in</strong>organic fertilizers, given exist<strong>in</strong>g soil fertility levels <strong>and</strong> the generally moderatefertilizer response <strong>of</strong> cotton. Particularly <strong>in</strong> Mozambique, the relativelyhigh levels <strong>of</strong> soil fertility are a major advantage for the cotton sector. It is<strong>in</strong>conceivable that the yields claimed by group 1 farmers <strong>in</strong> Mozambique couldbe achieved by farmers <strong>in</strong> other countries without the use <strong>of</strong> either <strong>in</strong>organicfertilizer or manure. At the other end <strong>of</strong> the spectrum, producers <strong>in</strong> WCA <strong>and</strong>Zimbabwe grow cotton on less productive soils.There is less variation <strong>in</strong> the provision <strong>and</strong> use <strong>of</strong> plant protection chemicalsacross countries <strong>and</strong> groups than there is for fertilizers. Nevertheless, usageis more uniform across groups <strong>in</strong> WCA countries than <strong>in</strong> ESA.Table 10.1 also shows the ratio <strong>of</strong> <strong>in</strong>put costs to gross revenues for each producertype <strong>and</strong> sector. This ratio is an important <strong>in</strong>dicator <strong>of</strong> the risk entailed<strong>in</strong> cotton production. A cross-country comparison shows that the most importantdeterm<strong>in</strong>ant <strong>of</strong> the ratio <strong>of</strong> <strong>in</strong>put costs to gross revenues is the quantity <strong>of</strong><strong>in</strong>organic fertilizer used. The ratio is thus higher <strong>in</strong> WCA <strong>and</strong> Zimbabwe(which also has the highest number <strong>of</strong> pesticide sprays per season) than <strong>in</strong>Mozambique, Tanzania, Ug<strong>and</strong>a, or Zambia.Returns to FarmersTwo key <strong>in</strong>dicators at farm level were used to evaluate returns to farmers:weighted average return to family labor, <strong>and</strong> return to all labor. First, however,farm pr<strong>of</strong>its per ha by farmer group are exam<strong>in</strong>ed; pr<strong>of</strong>it data provide important<strong>in</strong>sights <strong>in</strong>to the potential poverty reduction effects <strong>of</strong> cotton cultivation.After one values family labor at the go<strong>in</strong>g casual wage rate <strong>in</strong> rural areas,group 1 households make a pr<strong>of</strong>it <strong>in</strong> all countries, while group 2 householdsmake a pr<strong>of</strong>it <strong>in</strong> all countries except Cameroon <strong>and</strong> Mozambique (figure10.6). In both Cameroon <strong>and</strong> Mozambique, apparent high labor requirementscause the loss. In Tanzania <strong>and</strong> Zimbabwe, the pr<strong>of</strong>it achieved by group 2households means that, under current conditions, cotton production canmake only a modest contribution to household <strong>in</strong>come <strong>and</strong> poverty reductionobjectives.Tanzania is the only country where group 3 households make a pr<strong>of</strong>it, asdef<strong>in</strong>ed here. This result means that the household obta<strong>in</strong>s a higher <strong>in</strong>comefrom apply<strong>in</strong>g its own labor to its cotton plot than it could from sell<strong>in</strong>g thesame quantity <strong>of</strong> labor at the assumed casual wage labor rate. In Mali, thereturn to labor achieved by group 3 households is identical to the assumedcasual wage labor rate.128 POULTON, LABASTE, AND BOUGHTON
Figure 10.6 Net Marg<strong>in</strong>s after All Costs (<strong>in</strong>clud<strong>in</strong>g Labor), US$/kg200150100US$/ha500–50–100–150Burk<strong>in</strong>a FasoCameroonMaliMozambiqueTanzaniaUg<strong>and</strong>aZambiaZimbabweGroup 1 Group 2 Group 3 Group 4Source: Authors.The stark f<strong>in</strong>d<strong>in</strong>g from these figures is that between 25 percent (Burk<strong>in</strong>aFaso) <strong>and</strong> 75 percent (Mozambique, Ug<strong>and</strong>a, <strong>and</strong> Zambia) 75 or more <strong>of</strong> cottonproduc<strong>in</strong>g households would be better <strong>of</strong>f hir<strong>in</strong>g out their labor than apply<strong>in</strong>git to their own cotton plots. Why do they persist <strong>in</strong> produc<strong>in</strong>g cotton?Two ma<strong>in</strong> answers emerged from the focus group discussions:■■First, many group 3 <strong>and</strong> group 4 households prioritize the hir<strong>in</strong>g out <strong>of</strong> theirlabor, then fit <strong>in</strong> cultivation <strong>of</strong> their own cotton farms when they are not work<strong>in</strong>gelsewhere. This is a major reason that these groups perform many <strong>of</strong> theircritical cultural practices late <strong>and</strong> hence that they achieve such low yields.Focus group participants argued that cotton is the most remunerativecropp<strong>in</strong>g activity available <strong>in</strong> their areas. A critical factor here is the reliablemarket provided by cotton companies, which means that farmers can besure <strong>of</strong> obta<strong>in</strong><strong>in</strong>g at least some cash <strong>in</strong>come (a scarce commodity <strong>in</strong> group3 <strong>and</strong> group 4 households) from cotton production.Weighted average returns to family labor <strong>and</strong> to all labor are presented <strong>in</strong>figure 10.7; the weights are the proportion <strong>of</strong> farmers by farmer group shown<strong>in</strong> figure 10.5. (See table 10.1 for the returns figures for each group). Returnsto family labor <strong>and</strong> to all labor are identical for the WCA countries because alllabor was recorded as family labor (<strong>and</strong>, <strong>in</strong> fact, very little hired labor is used).The WCA countries boast three <strong>of</strong> the four highest returns to family labor <strong>and</strong>the three highest returns to all labor. This result is driven by the success <strong>of</strong> thesesystems <strong>in</strong> mov<strong>in</strong>g farmers <strong>in</strong>to groups 1 <strong>and</strong> 2 over time. Zimbabwe deliversYIELDS AND RETURNS TO FARMERS 129
Figure 10.7 Weighted Average Returns to Family Labor <strong>and</strong> All Labor <strong>in</strong>Study Countries2.502.00US$/day1.501.000.50Source: Authors.0.00Burk<strong>in</strong>a FasoCameroonMaliTanzaniareturns to family laborZimbabweZambiaUg<strong>and</strong>areturns to all laborMozambiquethe highest return to family labor, aga<strong>in</strong> <strong>in</strong> part reflect<strong>in</strong>g the efforts made firstby its <strong>Cotton</strong> Market<strong>in</strong>g Board <strong>and</strong> then by COTTCO <strong>and</strong> Cargill to supportfarmers with extension services <strong>and</strong> <strong>in</strong>put access over a susta<strong>in</strong>ed period. Allother ESA countries lie below the three WCA countries. Mozambique performsespecially poorly, reflect<strong>in</strong>g its small share <strong>of</strong> households <strong>in</strong> group 1 <strong>and</strong>the very low prices paid to farmers.Alternative ScenariosFor vary<strong>in</strong>g reasons, the “base-case” budgets <strong>in</strong> Burk<strong>in</strong>a Faso, Mali, <strong>and</strong> Tanzaniarepresent a fairly optimistic scenario. Thus, <strong>in</strong> addition to the base-casebudgets, the chapter also presents f<strong>in</strong>d<strong>in</strong>gs on returns under the follow<strong>in</strong>galternative scenarios:■■Burk<strong>in</strong>a Faso <strong>and</strong> Mali. Large debts <strong>in</strong>curred by the cotton companies implythat seed cotton prices <strong>in</strong> 2005/06 were at an unsusta<strong>in</strong>ably high level.Budgets are thus reestimated assum<strong>in</strong>g a seed cotton price <strong>of</strong> CFA franc 150per kg (all other variables are held constant).Tanzania. A downward adjustment is applied to the seed cotton yieldsreported by the focus groups, to reflect national average yields <strong>in</strong> the2005/06 drought season. These adjusted yields are then comb<strong>in</strong>ed withactual seed cotton prices received <strong>in</strong> 2005/06. Harvest labor (but not otherlabor or cash <strong>in</strong>puts) is also adjusted to reflect the lower yields.130 POULTON, LABASTE, AND BOUGHTON
All other variables <strong>in</strong> the budgets are kept constant. Predictably, returns tolabor fall for all groups. Critically, returns to labor become negative for group 3<strong>in</strong> Burk<strong>in</strong>a Faso, which means that cotton would be completely nonviable forthis group, even if labor <strong>in</strong>put <strong>in</strong>to cotton did not compete at all with opportunitiesfor <strong>of</strong>f-farm labor. If one recalculates the weighted returns to labor underthese alternative scenarios, the figure for Burk<strong>in</strong>a Faso becomes comparable tothat achieved by Zimbabwe. This f<strong>in</strong>d<strong>in</strong>g suggests that, under a more susta<strong>in</strong>ablepric<strong>in</strong>g regime, WCA sectors could still deliver returns to labor that arecomparable to the best achieved <strong>in</strong> ESA.The alternative scenario for Tanzania <strong>in</strong>volved lower yields, but higherprices (the prices actually observed <strong>in</strong> 2005/06) <strong>and</strong> lower harvest<strong>in</strong>g labor.The country report (Poulton <strong>and</strong> Maro 2007) noted that national yields <strong>in</strong>2005/06 were only 58 percent <strong>of</strong> those recorded <strong>in</strong> 2004/05, so the base-caseyield for each group was adjusted by this factor. Actual seed cotton prices paid<strong>in</strong> Tanzania <strong>in</strong> 2005/06 were extremely attractive—the highest outside <strong>of</strong> thesubsidized WCA sectors <strong>and</strong> comparable to the susta<strong>in</strong>able prices just notedfor Burk<strong>in</strong>a Faso <strong>and</strong> Mali. However, even with lower harvest labor, these highprices do not compensate for the reduced yields experienced as a result <strong>of</strong> the2005/06 drought. All producer groups achieve returns to family labor that areclearly lower than the estimated casual wage rate, while the weighted averagereturns now approximate those realized <strong>in</strong> Mozambique. This f<strong>in</strong>d<strong>in</strong>g showsthe vulnerability <strong>of</strong> ESA cotton farmers to ra<strong>in</strong>fall fluctuations.CONCLUSIONSThe start<strong>in</strong>g po<strong>in</strong>t when compar<strong>in</strong>g across sectors is that there will always besome farmers who, by superior skill or hard work <strong>and</strong> by asset accumulation(<strong>and</strong> perhaps higher start<strong>in</strong>g asset endowment), do well, thereby produc<strong>in</strong>ghigh yields <strong>and</strong> achiev<strong>in</strong>g good returns. How well these top producers dodepends <strong>in</strong> part on soil fertility. Sector performance should not be judged onthe basis <strong>of</strong> the performance <strong>of</strong> this top group alone.Companies (hence sectors) can contribute to overall farm-level performanceby the follow<strong>in</strong>g:■■■■Assist with access to <strong>in</strong>puts through credit provision, thereby allow<strong>in</strong>g morefarmers to achieve high yields <strong>and</strong> allow<strong>in</strong>g good farmers to exp<strong>and</strong> production(at a given yield level).Provide extension advice, thereby assist<strong>in</strong>g more farmers to raise productivity.Pay<strong>in</strong>g high prices, thereby rais<strong>in</strong>g returns for a given technical performance.Facilitat<strong>in</strong>g asset accumulation, especially animal traction.Asset accumulation can be assisted either passively (by assist<strong>in</strong>g producers <strong>in</strong>obta<strong>in</strong><strong>in</strong>g good returns over a susta<strong>in</strong>ed period) or actively (by promot<strong>in</strong>guptake <strong>of</strong> the assets <strong>in</strong> question). Asset accumulation allows more producers tomove <strong>in</strong>to groups 1 <strong>and</strong> 2 over time.YIELDS AND RETURNS TO FARMERS 131
An important lesson from this analysis is that assist<strong>in</strong>g more farmers tomove <strong>in</strong>to groups 1 <strong>and</strong> 2 is critical for sector competitiveness (see data oncosts <strong>of</strong> production <strong>in</strong> table 10.1) <strong>and</strong> for poverty reduction (see figure 10.4).<strong>Cotton</strong> sectors <strong>in</strong> WCA countries have assisted more farmers <strong>in</strong> ris<strong>in</strong>g togroups 1 <strong>and</strong> 2 over time through their promotion <strong>of</strong> animal traction, whichallowed farmers to <strong>in</strong>crease their cotton area <strong>and</strong> yields. The majority <strong>of</strong> farmers<strong>in</strong> WCA also enjoy access to <strong>in</strong>puts that only the top households <strong>in</strong> selectedESA sectors enjoy. At the same time, recent strong political pressures have contributedto high (though unsusta<strong>in</strong>able) seed cotton prices for WCA producers.These broadly based successes with <strong>in</strong>put provision <strong>and</strong> animal traction,together with recent high prices, are reflected <strong>in</strong> the relatively high weightedaverage returns to farmers <strong>in</strong> all three WCA countries. There is hope to reducethe high producer prices, allow<strong>in</strong>g WCA cotton companies to break even, <strong>and</strong>still to realize returns at least as high as those achieved by most ESA sectors.The analysis also suggests that Zimbabwe is the best performer among ESAcountries from a farmer’s perspective, with Zambia <strong>and</strong> Tanzania hard to separate.However, given that the Tanzanian figures are based on a very good year<strong>and</strong> that the Zambia labor <strong>in</strong>put data are perhaps on the high side, thereforeunderestimat<strong>in</strong>g returns, Zambia probably has the edge. Thus, another keyf<strong>in</strong>d<strong>in</strong>g <strong>of</strong> this section is that, although competitive sectors with<strong>in</strong> ESA haveoutperformed more coord<strong>in</strong>ated ones on pric<strong>in</strong>g (chapter 5), from a farmer’sperspective they have not done so to such an extent as to outweigh their disadvantages<strong>in</strong> service provision.Some doubts l<strong>in</strong>ger over <strong>in</strong>put data for Mozambique (labor) <strong>and</strong> Ug<strong>and</strong>a(hired services). However, apparently unattractive returns for the majority <strong>of</strong>farmers are consistent with disappo<strong>in</strong>t<strong>in</strong>g medium-term production growth<strong>in</strong> both countries. A better-regulated local monopoly model should be able todeliver better services to more farmers than has so far been the case <strong>in</strong>Mozambique.The question then becomes to what extent current performance at the farmlevel reflects the current state <strong>of</strong> the sector <strong>and</strong> how much it reflects the laggedimpact <strong>of</strong> past sector performance. This study suggests that the lagged impact<strong>of</strong> past performance is large. This f<strong>in</strong>d<strong>in</strong>g is clear both <strong>in</strong> WCA <strong>and</strong> <strong>in</strong> Zimbabwe,where COTTCO’s assistance through the early to mid-2000s is still felt. WCAsectors cont<strong>in</strong>ue to benefit from past <strong>in</strong>vestments, but they have seen stagnantproductivity growth s<strong>in</strong>ce the mid-1980s (area planted has risen, but yield <strong>and</strong>net marg<strong>in</strong>s have stagnated or fallen). (See table 10.2 for a summary.)It is, <strong>of</strong> course, difficult to predict future trends. The most confident predictionis that there will be limited change <strong>in</strong> the f<strong>in</strong>d<strong>in</strong>gs <strong>of</strong> this type <strong>of</strong> analysisover the next five years.132 POULTON, LABASTE, AND BOUGHTON
Table 10.2Summary <strong>of</strong> Average Yield <strong>and</strong> Return per Day <strong>of</strong> LaborCountryCurrentSector TypeAverageYield(kg/ha)WeightedAverageReturn PerDay <strong>of</strong>Labor (US$)CommentsBurk<strong>in</strong>a FasoCameroonMaliMozambiqueLocalmonopolyNationalmonopolyNationalmonopolyLocalmonopoly1,088 1.54 WCA sectors generatehighest yields <strong>and</strong>returns. Returns are stillcomparable to best <strong>in</strong>ESA when seed cottonprice is adjusted to“susta<strong>in</strong>able” level.1,167 1.34 Return figure is probablyunderestimated because <strong>of</strong>high labor <strong>in</strong>put derivedfrom SODECOTON data.1,030 1.70 WCA sectors generatehighest yields <strong>and</strong> returns.575 0.48 Return figure isunderestimated because <strong>of</strong>high labor <strong>in</strong>put derivedfrom focus groups, but lowlabor productivity <strong>and</strong> lowwage rates are features <strong>of</strong>rural Mozambique.Tanzania Competitive 556 1.09 Competitive sector strugglesto raise yields. Yields <strong>and</strong>returns are both highlydependent on ra<strong>in</strong>fall.Ug<strong>and</strong>a Hybrid 562 0.88 Return figure is probablyunderestimated because <strong>of</strong>high cost <strong>of</strong> hired servicesderived from focus groups.Zambia Concentrated 671 0.91 Return figure probablyunderestimated as a result<strong>of</strong> high labor <strong>in</strong>put derivedfrom focus groups. Averageyield has been ris<strong>in</strong>gsteadily s<strong>in</strong>ce liberalization.Zimbabwe Concentrated 910 1.23 It is best performer <strong>in</strong> ESAbecause <strong>of</strong> efforts overtime to raise proportion<strong>of</strong> households <strong>in</strong> topproducer groups.Source: Authors.Note: These yield figures are the weighted average values derived from focus group discussions(group figures derived from SODECOTON monitor<strong>in</strong>g data <strong>in</strong> the case <strong>of</strong> Cameroon).ESA = East <strong>and</strong> Southern <strong>Africa</strong>; SODECOTON = ; WCA = West <strong>and</strong> Central <strong>Africa</strong>.YIELDS AND RETURNS TO FARMERS 133
ANNEX A10. METHODOLOGY FOR FOCUS GROUP DISCUSSIONON FARMER TYPESIn several <strong>of</strong> the study countries, formal household surveys provide data oncotton yields <strong>and</strong> <strong>in</strong>put use that can be stratified to show the performance <strong>of</strong>different categories <strong>of</strong> farmers. However, the difficulties <strong>of</strong> collect<strong>in</strong>g reliablelabor data <strong>in</strong> such surveys means that most <strong>of</strong> them do not conta<strong>in</strong> <strong>in</strong>formationon labor use by different categories <strong>of</strong> cotton farmers.To provide <strong>in</strong>sights <strong>in</strong>to labor use at modest cost, focus groups undertookdiscussions <strong>in</strong> seven <strong>of</strong> the n<strong>in</strong>e study countries (all except Cameroon <strong>and</strong>Ben<strong>in</strong>). Discussions were undertaken <strong>in</strong> two (Burk<strong>in</strong>a Faso, Mali) to six(Mozambique) villages per country, with efforts made to compare acrossregions or districts where there were considered to be important geographicaldifferences <strong>in</strong> performance (Mozambique, Tanzania, Zimbabwe, Zambia) <strong>and</strong>also between more <strong>and</strong> less accessible villages with<strong>in</strong> an area (Tanzania,Mozambique).In all cases except Mozambique, a s<strong>in</strong>gle group <strong>of</strong> <strong>in</strong>formants provided<strong>in</strong>formation on cotton farmers <strong>in</strong> their village. There were commonly 5–10<strong>in</strong>formants per village. In Mozambique, a larger number <strong>of</strong> respondents weredivided <strong>in</strong>to groups (based on level <strong>of</strong> cotton production) with each groupprovid<strong>in</strong>g <strong>in</strong>formation on its own activities, albeit <strong>in</strong> the presence <strong>of</strong> peoplefrom other groups.The first activity <strong>in</strong> each focus group discussion was a participatory rank<strong>in</strong>gexercise based on the pr<strong>in</strong>ciples <strong>of</strong> wealth rank<strong>in</strong>g. Where possible, 76 the name<strong>of</strong> every head <strong>of</strong> household <strong>in</strong> the village was recorded; then <strong>in</strong>formants wereasked to place the cards <strong>in</strong> piles accord<strong>in</strong>g to the level <strong>of</strong> cotton productionachieved by the household <strong>in</strong> a “normal” year. In most cases, this group<strong>in</strong>g producedthree or four piles. If one pile (typically the lower producers <strong>in</strong> ESA) wasmuch larger than the others, the researchers asked for a further disaggregation<strong>of</strong> this group. In Mozambique, farmers were asked to divide themselves <strong>in</strong>togroups; after verification <strong>of</strong> each farmer’s yield, each group responded <strong>in</strong> turn.Once the groups had been identified, the <strong>in</strong>formants were asked to describethe characteristics <strong>of</strong> households <strong>in</strong> each group, thereby cover<strong>in</strong>g demography,<strong>in</strong>come sources, <strong>and</strong> food production, as well as cotton production. This analysisgave a picture <strong>of</strong> a typical household <strong>in</strong> each group. A crop budget was thendrawn up for each group for one hectare (or acre) <strong>of</strong> cotton <strong>in</strong> a typical recentseason. 77The overall assessment is that the focus group discussions were a cost-effectiveway <strong>of</strong> collect<strong>in</strong>g reasonably reliable data on cotton production activities by differentgroups <strong>of</strong> farmers. However, the follow<strong>in</strong>g issues are noted:■The method tends to accentuate <strong>in</strong>tergroup differences at the expense <strong>of</strong><strong>in</strong>tragroup variation. Thus, top groups are characterized as be<strong>in</strong>g able torise above many <strong>of</strong> the problems that constra<strong>in</strong> poorer households, <strong>and</strong> the134 POULTON, LABASTE, AND BOUGHTON
■■■■impression is given that they uniformly achieve the best yields. Similarly, thedom<strong>in</strong>ant narrative for poorer households is that cotton yields <strong>and</strong> pr<strong>of</strong>itabilityare compromised by equipment, cash, or labor shortages.Current local issues may receive undue attention. One example was the legalrequirement for Zimbabwean farmers to cut down their st<strong>and</strong><strong>in</strong>g crops byAugust 15, follow<strong>in</strong>g the harvest, which farmers <strong>in</strong> one area claimed was fartoo expensive to do because <strong>of</strong> labor shortages.If farmers are feel<strong>in</strong>g dissatisfied with cotton (as many are for various reasons),they may <strong>in</strong>flate estimates <strong>of</strong> labor <strong>in</strong>put to make a po<strong>in</strong>t. Facilitatorsneed to have some grasp <strong>of</strong> comparative data from elsewhere to <strong>in</strong>terrogate<strong>in</strong>itial statements from focus group members where these statements appearquestionable. With prob<strong>in</strong>g questions, plus comparisons across differentgroups with<strong>in</strong> the village, <strong>in</strong>formants will <strong>of</strong>ten arrive at a more consideredf<strong>in</strong>al estimate.Where an extension agent is present dur<strong>in</strong>g discussions, respondents may givethe “correct”—but untrue—answers <strong>in</strong> l<strong>in</strong>e with extension recommendations.Questions on <strong>in</strong>put use appear particularly susceptible to this distortion, asobserved <strong>in</strong> Burk<strong>in</strong>a Faso, Mali, <strong>and</strong> Zimbabwe. In one Zimbabwe focus group,researchers challenged the <strong>in</strong>itial statements from group members about <strong>in</strong>putuse by the poorest groups. Eventually, respondents admitted that the lowergroups do not follow <strong>of</strong>ficial recommendations <strong>and</strong> gave a “true” picture,which prompted the extension agent to confess to the researchers afterwardthat he had never realized this!F<strong>in</strong>ally, there is a question <strong>of</strong> what constitutes a “normal” year. In Tanzania,2003/04 <strong>and</strong> 2004/05 were bumper harvests, with national yields around 50percent higher than the long-term average. Focus group estimates <strong>of</strong> normalperformance reflected these recent good years. However, 2005/06 was adrought year, with national production a third <strong>of</strong> its level <strong>in</strong> the previoustwo seasons. As a result, seed cotton prices were driven up by companiesscrambl<strong>in</strong>g to obta<strong>in</strong> scarce supplies. It is clear that an <strong>in</strong>dicative budgetshould not comb<strong>in</strong>e the good yields <strong>of</strong> 2003/04 <strong>and</strong> 2004/05 with the highprices <strong>of</strong> 2005/06. In Mozambique, a similar situation prevailed, with a nearrecord harvest <strong>in</strong> 2005/06.The issue <strong>of</strong> what constitutes a “normal” year can be h<strong>and</strong>led by some <strong>in</strong>itialdata adjustments, comb<strong>in</strong>ed with the construction <strong>of</strong> alternative scenarios forsome countries. The data adjustments for the base cases are as follows:■In Tanzania, reported yields were used (consistent with national performance<strong>in</strong> 2003/04 <strong>and</strong> 2004/05) <strong>in</strong> the budgets, but seed cotton prices wereadjusted downward (from those recorded <strong>in</strong> 2005/06) to reflect plausibleprices <strong>in</strong> a good harvest year. This change is achieved by sett<strong>in</strong>g the averageseed cotton price to 65 percent <strong>of</strong> the free-on-truck l<strong>in</strong>t equivalent price(the share received by farmers <strong>in</strong> 2004/05). Seed cotton pric<strong>in</strong>g <strong>in</strong> TanzaniaYIELDS AND RETURNS TO FARMERS 135
■■works by companies agree<strong>in</strong>g on an open<strong>in</strong>g price, based on a cautious estimate<strong>of</strong> the company’s costs <strong>and</strong> desired pr<strong>of</strong>its, with market competitionthen driv<strong>in</strong>g the price up as the season progresses. The open<strong>in</strong>g price is notheavily affected by the season, but when the harvest is good, the price willbe driven up less than <strong>in</strong> a drought season when companies are desperatefor seed cotton to fulfill contracts. Thus, when one <strong>in</strong> adjustes prices toreflect a good season, the average price received by the top producers (whosell more <strong>of</strong> their product late <strong>in</strong> the season) is lowered by more than theaverage price received by the poorer producers (who are forced to sell much<strong>of</strong> their product as soon as the season opens to meet press<strong>in</strong>g cash needs).In Mozambique, budgets were constructed for four groups <strong>of</strong> farmers. Anationally representative annual household survey allows the distribution<strong>of</strong> cotton yields <strong>in</strong> both 2004/05 (a drought year) <strong>and</strong> 2005/06 (a good ra<strong>in</strong>fallyear) to be exam<strong>in</strong>ed. The national yield spread is roughly mirrored bythe follow<strong>in</strong>g comb<strong>in</strong>ation <strong>of</strong> focus group budgets: 2005/06—group 1 (40percent), group 2 (20 percent), group 4 (40 percent); 2004/05—group 1 (20percent), group 3 (20 percent), group 4 (60 percent). Unlike the case <strong>of</strong> acompetitive cotton sector such as Tanzania’s, however, prices <strong>in</strong> Mozambiquevary less between good <strong>and</strong> bad seasons. This book, therefore, considersjust one scenario (figures 10.5 <strong>and</strong> 10.7), <strong>in</strong> which the balance <strong>of</strong> producersacross groups is assumed to be as follows: group 1 (5 percent), group2 (25 percent), group 3 (30 percent), group 4 (40 percent).In Mali, <strong>in</strong>formation on actual yields for the period 2004 to 2006 <strong>in</strong> the villageswhere focus group discussions were held was available from the localextension agent. The average village-level yield was similar to the averagenational yield (approximately 1,100 kg/ha), but it was higher than theweighted average yield generated by focus group discussions (approximately1,000 kg/ha). For the budgets, therefore, the yields reported by thefocus groups were adjusted upward by 10 percent.Distribution <strong>of</strong> Producers across GroupsFigure 10.5 shows estimates <strong>of</strong> the proportion <strong>of</strong> cotton farmers found with<strong>in</strong>each group. These figures were determ<strong>in</strong>ed <strong>in</strong> a number <strong>of</strong> ways. In Mali,Zambia, <strong>and</strong> Zimbabwe, the numbers were taken from the focus group exercises.In these countries, all farmers from each village were assigned to onegroup or another. The data are thus strictly representative <strong>of</strong> the focus groupvillages <strong>and</strong> at best are only illustrative <strong>of</strong> the country more widely. Yet <strong>in</strong> eachcase, the weighted average yield figures that resulted from these proportionsare plausible <strong>in</strong> light <strong>of</strong> other <strong>in</strong>formation for the country. In Burk<strong>in</strong>a Faso<strong>and</strong> Cameroon, the data were from monitor<strong>in</strong>g reports by SOFITEX <strong>and</strong>SODECOTON, respectively. In Tanzania, the numbers were taken from a 2004cotton farmer survey (Maro <strong>and</strong> Poulton 2005), while those <strong>in</strong> Mozambique136 POULTON, LABASTE, AND BOUGHTON
were based on a 2005 cotton farmer survey <strong>in</strong> two prov<strong>in</strong>ces spann<strong>in</strong>g a widerange <strong>of</strong> typical yields <strong>in</strong> the country. In a number <strong>of</strong> countries, focus grouprespondents identified three groups <strong>of</strong> producers, while four groups wereidentified <strong>in</strong> others. Group 3 <strong>in</strong> Burk<strong>in</strong>a Faso, Cameroon, Mali, <strong>and</strong> Zimbabwecorrespond, therefore, to groups 3 <strong>and</strong> 4 <strong>in</strong> other countries.A strik<strong>in</strong>g observation from figure 10.5 is that WCA sectors have a muchhigher proportion <strong>of</strong> households <strong>in</strong> groups 1 <strong>and</strong> 2 than ESA sectors. Thisf<strong>in</strong>d<strong>in</strong>g reflects <strong>in</strong>vestments made over the years <strong>in</strong> the promotion <strong>of</strong> animaltraction <strong>and</strong> use <strong>of</strong> fertilizer.YIELDS AND RETURNS TO FARMERS 137
CHAPTER ELEVENCost Efficiency <strong>of</strong>Companies, OverallSector Competitiveness,<strong>and</strong> Macro ImpactNicolas GergelyThis chapter br<strong>in</strong>gs together detailed data from g<strong>in</strong>n<strong>in</strong>g companies, alongwith farm-level data from the previous chapter, to calculate four additionaloutcome <strong>in</strong>dicators: one for company performance (an <strong>in</strong>termediateoutcome), one for overall sector competitiveness, <strong>and</strong> two <strong>in</strong>dicators for theimpact <strong>of</strong> the cotton sector on the countries’ macro economies. The proposedtypology generated clear predictions for only one <strong>of</strong> these <strong>in</strong>dicators: g<strong>in</strong>n<strong>in</strong>gcompanies are expected to be the least efficient <strong>in</strong> monopolies <strong>and</strong> the most efficient<strong>in</strong> competitive sectors. Other <strong>in</strong>dicators depend on factors <strong>in</strong> which no s<strong>in</strong>glesector type is expected to consistently perform better.The cost structures <strong>of</strong> cotton companies are based on account<strong>in</strong>g data disclosedby the companies <strong>in</strong> West <strong>and</strong> Central <strong>Africa</strong> (WCA) countries <strong>and</strong> on<strong>in</strong>terviews with g<strong>in</strong>ners <strong>and</strong> other key <strong>in</strong>formants <strong>in</strong> East <strong>and</strong> Southern <strong>Africa</strong>(ESA) countries. 78 For one to allow comparisons, costs do not <strong>in</strong>clude capitalcosts because these figures may be, depend<strong>in</strong>g on the g<strong>in</strong>ner, f<strong>in</strong>anced eitherthrough equity or long- <strong>and</strong> medium-term loans. Cost estimates <strong>in</strong> most casesare from 2006, converted to U.S. dollars at the prevail<strong>in</strong>g exchange rate (calendaryear 2005 for Mozambique). For Cameroon <strong>and</strong> Burk<strong>in</strong>a Faso, however,costs correspond, respectively, to the 2004/05 <strong>and</strong> 2003/04 seasons because139
more recent data are not available (except producer prices, which are the2006/07 actual prices). It has, however, been verified that costs have not dramaticallychanged <strong>in</strong> recent years <strong>in</strong> these countries, because domestic <strong>and</strong>imported <strong>in</strong>flation (ma<strong>in</strong>ly from imported equipment <strong>and</strong> oil) were more orless balanced by cost reductions. Ben<strong>in</strong> is not <strong>in</strong>cluded <strong>in</strong> this sample becauserecent reliable data were not available.COMPANY COST EFFICIENCYThe <strong>in</strong>dicator for company performance is the adjusted cost from farm gateprices to free-on-truck (FOT). This adjusted figure excludes taxes <strong>and</strong> the cost<strong>of</strong> critical functions, because these costs depend on policy <strong>and</strong> other factorsunrelated to the efficiency <strong>of</strong> company operations. The value <strong>of</strong> seed is notdeducted from the total cost figure because the performance <strong>of</strong> the seed market(<strong>and</strong> the value the companies can, therefore, get from seed sales) is alsobeyond the <strong>in</strong>fluence <strong>of</strong> the companies. These factors are brought back <strong>in</strong>to theanalysis when overall competitiveness <strong>and</strong> macro impacts <strong>of</strong> the cotton sectorare considered.This chapter focuses first on g<strong>in</strong>n<strong>in</strong>g costs as perhaps the key cost element <strong>in</strong>this <strong>in</strong>dicator. G<strong>in</strong>n<strong>in</strong>g costs <strong>in</strong> WCA (all national or local monopolies) rangefrom US$0.134 to US$0.234 per kg <strong>of</strong> l<strong>in</strong>t (table 11.1 <strong>and</strong> figure 11.1). In ESA,these costs are much lower—rang<strong>in</strong>g from US$0.081 to US$0.123—for countriesoperat<strong>in</strong>g at reasonably high capacity utilization rates (Tanzania, Zambia, <strong>and</strong>Zimbabwe). For Mozambique <strong>and</strong> Ug<strong>and</strong>a, which operate at about 20 percent <strong>of</strong>capacity, costs are comparable to those <strong>in</strong> WCA, at US$0.20 per kg <strong>and</strong> US$0.237per kg, respectively. These are the only two countries <strong>in</strong> the region that do notallow open competition between g<strong>in</strong>ners: Mozambique operates a local monopolysystem, <strong>and</strong> Ug<strong>and</strong>a operates a hybrid system with purchase quotas. Boththese systems protect g<strong>in</strong>ners from most competitive pressures <strong>and</strong> thus reduce<strong>in</strong>centives for cost conta<strong>in</strong>ment. At 100 percent capacity utilization rates <strong>in</strong> allcountries, there would be no overlap <strong>in</strong> g<strong>in</strong>n<strong>in</strong>g costs between the two regions:WCA countries would range from US$0.13 to US$0.20 per kg, while those <strong>in</strong>ESA would range from US$0.07 to US$0.12 per kg.A comb<strong>in</strong>ation <strong>of</strong> technical <strong>and</strong> structural factors likely contributes to thisstark difference <strong>in</strong> g<strong>in</strong>n<strong>in</strong>g costs between the two regions. First, WCA uses onlysaw g<strong>in</strong>s. Investment costs (<strong>and</strong> hence depreciation costs) for saw g<strong>in</strong>s are substantiallyhigher than for roller g<strong>in</strong>s. Roller g<strong>in</strong>s are predom<strong>in</strong>ant <strong>in</strong> Ug<strong>and</strong>a <strong>and</strong>also widely used <strong>in</strong> Tanzania. 79 In addition, a number <strong>of</strong> g<strong>in</strong>ners <strong>in</strong> Tanzania <strong>and</strong>Ug<strong>and</strong>a import equipment from India, <strong>of</strong>ten secondh<strong>and</strong>. Some Zambian g<strong>in</strong>ners<strong>in</strong>stall used saw g<strong>in</strong>s. All this equipment is much less expensive than the U.S.or European equipment purchased by WCA cotton companies. Second, energy ismuch cheaper <strong>in</strong> Zimbabwe (less than US$0.001 per kg <strong>of</strong> l<strong>in</strong>t), 80 Zambia(US$0.005 per kg), <strong>and</strong> Tanzania (US$0.009 per kg) than <strong>in</strong> WCA countries140 GERGELY
Table 11.1 Comparative Analysis <strong>of</strong> G<strong>in</strong>n<strong>in</strong>g Costs (U.S.¢ per kg <strong>of</strong> l<strong>in</strong>t cotton)Indicator Burk<strong>in</strong>a Faso a Cameroon b Mali c Mozambique d Tanzania e Ug<strong>and</strong>a e Zambia e Zimbabwe gType <strong>of</strong> system Local monopoly National monopoly National monopoly Local monopoly Competitive Hybrid Concentrated ConcentratedExchange rate to US$ 505 505 505 23.5 1,200 1,800 3,600 VariableTypes <strong>of</strong> g<strong>in</strong>s saw saw saw saw roller roller saw saw/rollerAverage unit g<strong>in</strong>n<strong>in</strong>gcapacity (tons) 45,000 31,000 40,000 13,500 6,300 5,000 20,000 25,000% capacity utilized 100 100 65 20 80 20 100 64Fixed costs/kg <strong>of</strong> l<strong>in</strong>t 5.84 4.03 8.00 17.15 1.84 12.29 4.69 3.29Depreciation 3.31 3.06 4.59 7.81 0.65 6.02 2.50 1.90Salaries 1.18 0.77 1.08 9.29 1.19 6.27 2.08 1.35Other 1.35 0.20 2.32 0.05 0 0 0.11 0.05Variable costs/kg<strong>of</strong> l<strong>in</strong>t 9.99 9.39 15.39 6.51 6.31 7.66 7.61 4.76Energy 2.50 3.07 4.40 2.36 0.94 3.04 0.50 0.04Packag<strong>in</strong>g 3.49 3.49 3.45 3.91 4.17 3.05 3.50 2.17Other (<strong>in</strong>clud<strong>in</strong>gma<strong>in</strong>tenance) 4.00 2.84 7.54 0.24 1.20 1.58 3.61 2.56Total cost/kg <strong>of</strong> l<strong>in</strong>t 15.83 13.42 23.39 23.66 8.15 19.96 12.30 8.06At 100% capacity 15.83 13.42 20.59 9.94 7.78 10.12 12.30 6.88At mean 1995–2006exchange rate h 13.62 11.55 17.71 n.a. n.a. n.a. n.a. n.a.141Source: Authors.Notes: n.a. = not applicable because no need to adjust for different exchange rate. Both Zambia <strong>and</strong> Ug<strong>and</strong>a use some secondh<strong>and</strong> g<strong>in</strong>n<strong>in</strong>g equipment.a. SOFITEX actual accounts for 2003/04.b. SODECOTON actual account for 2004/05.c. CMDT budget for 2006/07.d. Estimate for 2005 calendar year (Boughton 2008).e. Estimates based on 2006/07 costs but 2004/05 capacity utilization (Poulton <strong>and</strong> Maro 2007).f. Estimates by Gerald Estur (consultant) for 2005/06 (g<strong>in</strong>ners contend they are underestimated).g. Estimates for 2005/06 (Poulton <strong>and</strong> Hanyani-Mlambo 2007).h. CFA franc 587/US$; costs at actual capacity.CFA = Communauté Française d’Afrique (French community <strong>of</strong> <strong>Africa</strong>); CMDT = Compagnie Malienne de Développement des Fibres Textiles; SODECOTON=; SOFITEX=.
Figure 11.1 Estimated Average G<strong>in</strong>n<strong>in</strong>g Costs at 2006 Capacity UtilizationRates <strong>in</strong> Study Countries25.00U.S. cents/kg l<strong>in</strong>t cotton20.0015.0010.005.000.00Burk<strong>in</strong>a FasoMaliCameroonZambiaZimbabweTanzaniaUg<strong>and</strong>aMozambiquevariable costs/kg <strong>of</strong> l<strong>in</strong>tfixed costs/kg <strong>of</strong> l<strong>in</strong>tSource: Authors.(around US$0.025 per kg). F<strong>in</strong>ally, ma<strong>in</strong>tenance <strong>and</strong> other variable costs are, asa general rule, substantially lower <strong>in</strong> ESA, thus reflect<strong>in</strong>g higher cost efficiency atthe process<strong>in</strong>g stage.The gap between g<strong>in</strong>n<strong>in</strong>g costs <strong>in</strong> WCA <strong>and</strong> ESA countries would be reducedbut not elim<strong>in</strong>ated, if the Communauté Française d’Afrique (French community<strong>of</strong> <strong>Africa</strong>) franc/US$ exchange rate returned to its 1995–2006 mean, whichcorresponds to the period s<strong>in</strong>ce the 1994 devaluation (see f<strong>in</strong>al l<strong>in</strong>e <strong>of</strong> table 11.1):costs <strong>in</strong> Cameroon would be at the upper end <strong>of</strong> those <strong>in</strong> ESA, but costs <strong>in</strong> Burk<strong>in</strong>aFaso <strong>and</strong> especially <strong>in</strong> Mali would rema<strong>in</strong> much higher. This projection suggeststhat, while the current CFA franc/US$ exchange rate does contribute to thecurrent f<strong>in</strong>ancial crisis <strong>in</strong> the region, a more fundamental cause for the f<strong>in</strong>ancialcrisis, at least <strong>in</strong> Burk<strong>in</strong>a Faso <strong>and</strong> Mali, is very high costs <strong>of</strong> operation <strong>in</strong> cottong<strong>in</strong>n<strong>in</strong>g. This conclusion becomes even stronger when one realizes that figuresfor the highest cost g<strong>in</strong>ner <strong>in</strong> ESA—Zambia—are heavily affected by the sharpappreciation <strong>of</strong> the kwacha dur<strong>in</strong>g 2005/06. Zambia’s g<strong>in</strong>n<strong>in</strong>g cost <strong>in</strong> U.S. dollarswould be below US$0.10/kg <strong>of</strong> l<strong>in</strong>t if the kwacha were at its 2005 level.Table 11.2 builds <strong>in</strong> additional costs from farm gate to FOT to develop theoverall <strong>in</strong>dicator <strong>of</strong> company cost efficiency: total farm gate to FOT costsexclud<strong>in</strong>g taxes <strong>and</strong> critical functions. The ma<strong>in</strong> discrim<strong>in</strong>at<strong>in</strong>g factor for collectioncosts appears to be the size <strong>of</strong> g<strong>in</strong>n<strong>in</strong>g units; transport costs are lower<strong>in</strong> countries with smaller g<strong>in</strong>n<strong>in</strong>g units (particularly Ug<strong>and</strong>a) because thepurchas<strong>in</strong>g area for each unit is smaller <strong>and</strong> are higher <strong>in</strong> countries with largescaleg<strong>in</strong>n<strong>in</strong>g units (Zambia <strong>and</strong> WCA).Short-term f<strong>in</strong>ancial costs are higher <strong>in</strong> monopolistic systems (exceptCameroon) for managerial reasons. In such systems, cotton companies tend142 GERGELY
Table 11.2 Company <strong>Performance</strong> Indicator: Adjusted Costs, Farm Gate to FOT (U.S.¢ per kg <strong>of</strong> l<strong>in</strong>t)Indicator Burk<strong>in</strong>a Faso Cameroon Mali Mozambique Tanzania Ug<strong>and</strong>a Zambia ZimbabweType <strong>of</strong> cotton <strong>in</strong>dustryNationalmonopolyNationalmonopolyNationalmonopolyLocalmonopoly Competitive Hybrid Concentrated ConcentratedDate <strong>of</strong> data 2003/04 2004/05 2006/07 2005 2006/07 2006/07 2005/06 2005/06Collection <strong>of</strong> seed cotton 10.3 9.7 7.3 9.7 9.4 7.9 13.6 8.1Transport 6.5 5.0 5.2 8.8 5.1 3.2 7.7 6.1Other 3.8 4.7 2.1 0.9 4.1 4.8 5.9 2.0G<strong>in</strong>n<strong>in</strong>g costs 15.8 13.4 23.4 23.7 8.2 20 12.3 8.1Overhead 4.6 6.5 6.0 3.0 1.8 2.5 4.0 4.9Portion <strong>of</strong> overheadpaid to DAGRIS 1.2 1.2 0.3 n.a. n.a. n.a. n.a. n.a.Short-term f<strong>in</strong>anc<strong>in</strong>gcost 6.7 1.3 8.0 2.0 2.0 1.6 2.0 3.6Total adjusted costs 37.4 30.8 44.6 38.4 21.4 31.9 31.9 25.5Source: Authors.Note: n.a. = not applicable.a. Cost <strong>of</strong> <strong>in</strong>put borne by cotton company.DAGRIS = Développement des Agro-Industries du Sud; FOT = Free on truck.143
to buy seed cotton immediately after harvest, <strong>and</strong> to sell them throughout theyear, thus hold<strong>in</strong>g high average stocks. G<strong>in</strong>ners <strong>in</strong> competitive systems tend tom<strong>in</strong>imize their stocks by sell<strong>in</strong>g immediately after process<strong>in</strong>g. Cameroon isunique for monopolistic systems: most <strong>of</strong> its stock, at least through the end <strong>of</strong>the 2006 season, was f<strong>in</strong>anced by cash reserves <strong>of</strong> the company <strong>and</strong> the farmerorganization.Overhead costs are consistently higher <strong>in</strong> the WCA monopoly systems, wherecotton companies are larger, comb<strong>in</strong>e a broader scope <strong>of</strong> functions, <strong>and</strong> lack<strong>in</strong>centives to m<strong>in</strong>imize costs. Overhead costs are lower <strong>in</strong> competitive <strong>and</strong> concentratedsystems, where companies have more <strong>in</strong>centives to m<strong>in</strong>imize costs<strong>and</strong> also to focus on a narrower set <strong>of</strong> functions.Focus<strong>in</strong>g now on the f<strong>in</strong>al <strong>in</strong>dicator <strong>of</strong> company performance—total adjustedcosts (f<strong>in</strong>al l<strong>in</strong>e <strong>of</strong> table 11.2, plus figure 11.2)—companies <strong>in</strong> concentrated <strong>and</strong>competitive systems show clear evidence <strong>of</strong> greater efficiency, especially <strong>in</strong> themore competitive sectors. Burk<strong>in</strong>a Faso, Mali, <strong>and</strong> Mozambique, all monopolysectors, show the highest adjusted farm gate to FOT costs, with costs <strong>in</strong> Malibe<strong>in</strong>g especially high. Costs <strong>in</strong> Tanzania’s competitive sector <strong>and</strong> Zimbabwe’s<strong>in</strong>creas<strong>in</strong>gly competitive sector are substantially below all other countries,although the Zimbabwe figure is heavily <strong>in</strong>fluenced by the dramatic depreciation<strong>in</strong> the real exchange rate s<strong>in</strong>ce the onset <strong>of</strong> economic crisis <strong>in</strong> 2001. Accord<strong>in</strong>g tothe high share <strong>of</strong> roller g<strong>in</strong>s <strong>in</strong> Ug<strong>and</strong>a, its costs should be at least as low as those<strong>in</strong> Tanzania, but <strong>in</strong>stead Ug<strong>and</strong>a’s costs are comparable to those <strong>in</strong> Zambia(which uses saw g<strong>in</strong>s) <strong>and</strong> Cameroon. Very low capacity utilization, perpetuatedFigure 11.2 Company <strong>Performance</strong> Indicator: Adjusted Total Cost, FarmGate to FOT, 2006/070.500.450.400.35US$/kg l<strong>in</strong>t0.300.250.200.150.100.050.00Burk<strong>in</strong>a FasoMaliCame roonMozambiqueZambiaZimbabweTanzaniaUg<strong>and</strong>aSource: Authors.Note: FOT = free on truck.144 GERGELY
y the hybrid regulatory structure, drives this result. Zambia’s figure, which is thehighest <strong>of</strong> the market-based systems, <strong>in</strong>cludes costs <strong>in</strong>volved <strong>in</strong> achiev<strong>in</strong>g a veryhigh-quality premium. Cameroon shows what a national monopoly can achievewhen well managed <strong>and</strong> left relatively free from political <strong>in</strong>fluence, yet its costsare still well above those <strong>in</strong> Zimbabwe <strong>and</strong> Tanzania.OVERALL COMPETITIVENESSThe overall competitiveness <strong>in</strong>dicator is the ratio <strong>of</strong> total FOT costs to total FOTvalue <strong>in</strong> each sector. The cost side <strong>of</strong> this <strong>in</strong>dicator is developed by start<strong>in</strong>g withthe adjusted farm gate to FOT costs from table 11.2 <strong>and</strong> by add<strong>in</strong>g purchase price;pr<strong>of</strong>it taxes; payments for critical functions such as extension; <strong>in</strong>put subsidies paidby companies (if any); <strong>and</strong> anyth<strong>in</strong>g paid by the companies for research, roadma<strong>in</strong>tenance, <strong>and</strong> other public goods. Any taxes <strong>in</strong>cluded <strong>in</strong> these costs are notdeducted. Company revenues can be only theoretically estimated because <strong>in</strong>formationis not publicly available on actual sell<strong>in</strong>g prices <strong>and</strong> costs except <strong>in</strong> WCA’snational monopolies. The calculations are based on Cotlook A Index prices, qualitypremiums as estimated <strong>in</strong> chapter 7, <strong>and</strong> <strong>in</strong>formation on the value <strong>of</strong> seed salesfrom <strong>in</strong>terviews <strong>in</strong> each country.Results are shown <strong>in</strong> table 11.3. Ratios above 1.0 <strong>in</strong>dicate that the sector isgenerat<strong>in</strong>g deficits, thus is unable to cover costs at estimated realized exportprices <strong>and</strong> sales prices <strong>of</strong> seed. The WCA monopolies look very poor, with evenCameroon less competitive than any <strong>of</strong> the ESA countries. High producerprices <strong>and</strong> high costs for critical functions (lower only than those <strong>in</strong> Ug<strong>and</strong>a)comb<strong>in</strong>e with the high operat<strong>in</strong>g costs already documented <strong>in</strong> table 11.2 todrive this result. Remarkably, Mozambique now looks very competitive, butthis appearance is <strong>in</strong> large measure caused by the very low prices that thispoorly regulated local monopoly sector pays to its farmers. Zambia emerges asperhaps the most competitive sector, <strong>in</strong> large measure as a result <strong>of</strong> the veryhigh price premium it now earns on <strong>in</strong>ternational markets. Zimbabwe’s revenuesare reduced by the requirement that 30 percent <strong>of</strong> output be sold on thelocal market at lower prices; yet Zimbabwe’s sector still emerges as relativelycompetitive.In seven <strong>of</strong> the eight countries <strong>in</strong> this analysis, cotton companies pay for allor a significant portion <strong>of</strong> extension. The one exception is Tanzania, which isthe only competitive sector; companies spend<strong>in</strong>g money on extension wouldbe at a competitive disadvantage <strong>in</strong> such a system <strong>and</strong> so do not provide thisservice. Ug<strong>and</strong>a has a competitive structure, but its regulatory framework(which classifies its sector as a hybrid) allows companies to cooperate <strong>in</strong> support<strong>in</strong>gextension (supplemented by donor money). These company costs arecerta<strong>in</strong>ly recovered from farmers through the buy<strong>in</strong>g price, as they must be <strong>in</strong>other ESA countries. The sector deficits <strong>in</strong> the WCA region suggest that these(<strong>and</strong> other) costs are not be<strong>in</strong>g fully recovered. Extension costs are higher <strong>in</strong>COST EFFICIENCY, SECTOR COMPETITIVENESS, AND MACRO IMPACT 145
146Table 11.3 Overall Competitiveness Indicator: FOT Costs/FOT Revenue, 2006/07 (all costs <strong>and</strong> revenues <strong>in</strong> US$/kg l<strong>in</strong>t)Burk<strong>in</strong>a Faso Cameroon Mali Mozambique Zambia ZimbabweLocalMonopolyNationalMonopolyNationalMonopolyLocal Tanzania Ug<strong>and</strong>aMonopoly Competitive HybridConcentratedConcentratedCostsProducer price/kg l<strong>in</strong>t 0.78 0.78 0.75 0.51 0.69 0.71 0.64 0.67Adjusted farm gate toFOT costs (fromtable 11.2) 0.374 0.308 0.446 0.384 0.214 0.319 0.319 0.255Direct taxes n.a. 0.004 n.a. 0.022 0.037 0.026 0.012 0.006Critical functionsExtension 0.025 0.027 0.040 0.007 n.a. 0.027 0.015 0.029Roads, research, other 0.004 0.015 0.010 n.a. 0.019 n.a. n.a. n.a.Input subsidies n.a. n.a. 0.018 n.a. n.a. 0.084 n.a. n.a.Total FOT costs 1.18 1.13 1.26 0.92 0.96 1.17 0.99 0.96IncomeFOB value (CFR bm<strong>in</strong>us freight <strong>and</strong>h<strong>and</strong>l<strong>in</strong>g) 1.18 1.18 1.18 1.18 1.19 1.19 1.19 1.05 aFOT to FOB costs 0.15 0.19 0.15 0.03 0.10 0.13 0.14 0.11FOT value 1.03 0.99 1.03 1.15 1.09 1.06 1.05 0.94Quality premium 0.04 0.07 0.02 –0.04 –0.01 0.04 0.11 0.06Sale <strong>of</strong> seed/kg l<strong>in</strong>t 0.06 0.09 0.05 0.05 0.08 0.16 0.11 0.13Total Income, FOT 1.13 1.15 1.10 1.16 1.16 1.26 1.27 1.13FOT cost/FOTrevenue 1.05 0.99 1.15 0.80 0.83 0.93 0.78 0.85Source: Authors.Note: n.a. = Not applicable.a. Tak<strong>in</strong>g <strong>in</strong>to consideration sales on domestic market (30 percent <strong>of</strong> sales) at a lower adm<strong>in</strong>istered price.b. CFR = Costs, <strong>in</strong>surance, freight.
WCA than <strong>in</strong> ESA (US$0.025 to US$0.040 per kg <strong>of</strong> l<strong>in</strong>t, compared with zeroto US$.029 per kg <strong>of</strong> l<strong>in</strong>t <strong>in</strong> ESA), <strong>and</strong> they are highest <strong>in</strong> Mali, because thescope <strong>of</strong> extension <strong>in</strong>cludes rural development functions beyond cotton.Extension <strong>in</strong> Cameroon also covers rural development, but its cost is sharedbetween the cotton company <strong>and</strong> the farmer association. The monopoly cottoncompanies also contribute to road ma<strong>in</strong>tenance <strong>and</strong> research costs, thoughprobably less <strong>in</strong> Mozambique than <strong>in</strong> the WCA countries. 81MACRO IMPACTSThe two macro impact <strong>in</strong>dicators are per capita total value added from the cottonsector <strong>and</strong> per capita net budgetary contributions <strong>of</strong> the sector. Valueadded at the farm level is calculated by subtract<strong>in</strong>g nonlabor production costsfrom the farm gate value <strong>of</strong> seed cotton production. In the absence <strong>of</strong> mean figuresacross all farmers, the data for the farmer group that conta<strong>in</strong>s the medianfarmer are used (see table 11.4 <strong>and</strong> figure 11.3).Value added is calculated us<strong>in</strong>g two different def<strong>in</strong>itions <strong>of</strong> nonlabor productioncosts. In the first case, <strong>in</strong>put costs are deducted from the gross value <strong>of</strong>seed cotton production. In the second case, costs <strong>of</strong> animal traction <strong>and</strong>motorized services are also deducted, although the latter are extremely rare.The most appropriate def<strong>in</strong>ition can be debated. The argument for deduct<strong>in</strong>ganimal traction costs from value added is that they <strong>in</strong>clude rental or amortization<strong>of</strong> equipment, plus veter<strong>in</strong>ary <strong>and</strong> feed<strong>in</strong>g costs for oxen. These <strong>in</strong>termediate<strong>in</strong>puts account for about 80 percent <strong>of</strong> the estimated animal tractioncosts <strong>in</strong> WCA sectors. The argument for not deduct<strong>in</strong>g animal traction costs isthat oxen (<strong>and</strong>, <strong>in</strong>deed, equipment) are assets that farm households have accumulated<strong>in</strong> large part through their engagement with cotton production.Deduct<strong>in</strong>g animal traction costs would have the perverse effect <strong>of</strong> lower<strong>in</strong>g theestimates <strong>of</strong> the value added generated by WCA sectors (because these sectorshave proceeded further with animal traction than ESA) when this progressowes much to cotton.Value added at the g<strong>in</strong>nery stage can be estimated by subtract<strong>in</strong>g all nonlabor<strong>and</strong> nontax costs for purchase <strong>and</strong> collection <strong>of</strong> seed cotton <strong>and</strong> for process<strong>in</strong>g<strong>and</strong> market<strong>in</strong>g <strong>of</strong> l<strong>in</strong>t cotton from the total FOT value <strong>of</strong> l<strong>in</strong>t <strong>and</strong>seeds. The two value-added numbers are then summed, <strong>and</strong> the result is convertedto per capita figures by multiply<strong>in</strong>g by production <strong>and</strong> divid<strong>in</strong>g by totalcountry population (table 11.4, figure 11.3).WCA countries perform relatively poorly on total value added per kg <strong>of</strong>l<strong>in</strong>t. Yet Burk<strong>in</strong>a Faso <strong>and</strong> Mali perform quite well when this number isadjusted to the country’s total population; the two different treatments <strong>of</strong> animaltraction costs have no impact on overall conclusions. The high valueadded per capita <strong>in</strong> Burk<strong>in</strong>a Faso <strong>and</strong>, to a lesser degree Mali, flows directlyfrom the orientation <strong>of</strong> the national monopolies (now local monopolies <strong>in</strong>Burk<strong>in</strong>a Faso) to extend cotton cultivation to all farmers <strong>in</strong> areas deemedCOST EFFICIENCY, SECTOR COMPETITIVENESS, AND MACRO IMPACT 147
148Table 11.4 Total Value Added per Capita from <strong>Cotton</strong> Sector, 2006Indicator Burk<strong>in</strong>a Faso Mali Cameroon Mozambique Zambia Zimbabwe Tanzania Ug<strong>and</strong>aValue added atfarm levelSeed cotton yield(kg/ha) 1,100 1,011 1,120 565 600 800 438 563Seed cotton price(US$/kg) 0.33 0.32 0.32 0.21 0.25 0.29 0.24 0.25Gross value per ha(US$) 359 324 358 119 150 232 105 141Deduction for <strong>in</strong>putcosts (US$/ha) 165 160 133 14 20 90 6 8Deduction for hiredservices (US$/ha) 35 31 16 1 10 25 1 71Value added/ha,I (US$) 195 164 225 105 130 142 99 133Value added/ha,II (US$) 160 133 209 104 120 117 98 62Gross outturn ratio(percent) 42 42 41 39 40 41 36 35Value added/kg l<strong>in</strong>t,I (US$) 0.42 0.39 0.49 0.47 0.54 0.43 0.63 0.67Value added/kg l<strong>in</strong>t,II (US$) 0.35 0.31 0.46 0.47 0.50 0.36 0.62 0.31Value added atg<strong>in</strong>n<strong>in</strong>g level(US$/kg l<strong>in</strong>t)Total FOT <strong>in</strong>come(table 11.3) 1.13 1.10 1.15 1.16 1.27 1.13 1.16 1.26
Deduction for pricepaid to farmer/kg l<strong>in</strong>t 0.78 0.75 0.78 0.51 0.64 0.67 0.69 0.71Deduction for othernontax, nonlaborcosts 0.30 0.39 0.23 0.29 0.22 0.22 0.16 0.24Value added/kg l<strong>in</strong>t 0.05 –0.04 0.14 0.36 0.41 0.24 0.31 0.31Total value addedTotal value added/kgl<strong>in</strong>t, I (US$/kg l<strong>in</strong>t) 0.47 0.35 0.63 0.83 0.95 0.67 0.94 0.98Total value added/kgl<strong>in</strong>t, II (US$/kg l<strong>in</strong>t) 0.40 0.27 0.60 0.83 0.91 0.60 0.93 0.62Production, thous<strong>and</strong>metric tons l<strong>in</strong>t 311 186 89 43 80 123 126 22Total value added I(thous<strong>and</strong> US$) 146,513 64,188 56,146 35,902 76,133 82,770 118,265 21,641Total value added II(thous<strong>and</strong> US$) 123,222 50,609 53,045 35,707 72,800 73,395 117,466 13,714Population, 2005(thous<strong>and</strong>) 13,933 11,611 17,795 20,533 11,478 13,120 38,478 28,947Total value addedper capita, I (US$) 10.52 5.53 3.16 1.75 6.63 6.31 3.07 0.75Total value addedper capita, II (US$) 8.84 4.36 2.98 1.74 6.34 5.59 3.05 0.47Source: Authors.Note: Value added I = gross value <strong>of</strong> seed cotton production m<strong>in</strong>us <strong>in</strong>put costs; value added II = value added I m<strong>in</strong>us costs <strong>of</strong> animal traction<strong>and</strong> motorized services.149
Figure 11.3 Total Value Added per capita by <strong>Cotton</strong> Sector, 2006/071210US$ per capita86420Burk<strong>in</strong>a FasoMaliCameroonMozambiqueZambiaZimbabweTanzaniavalue added I value added IIUg<strong>and</strong>aSource: Authors.Note: Value added I = gross value <strong>of</strong> seed cotton production m<strong>in</strong>us <strong>in</strong>put costs; value addedII = value added I m<strong>in</strong>us costs <strong>of</strong> animal traction <strong>and</strong> motorized services.adapted to cotton cultivation. In ESA, Zambia <strong>and</strong> Zimbabwe perform verywell because they achieve high value added per kg <strong>and</strong> also reach a relativelyhigh share <strong>of</strong> the population (though much less than <strong>in</strong> WCA). Tanzania’s sector,<strong>in</strong> contrast, reaches far fewer farmers as a share <strong>of</strong> population, <strong>and</strong> itsvalue added per capita thus falls to about half that <strong>in</strong> Zambia <strong>and</strong> Zimbabwe.Mozambique <strong>and</strong> Ug<strong>and</strong>a perform the poorest because <strong>of</strong> chronically lowproduction <strong>in</strong> each country.The f<strong>in</strong>al <strong>in</strong>dicator shows that <strong>in</strong> Burk<strong>in</strong>a Faso <strong>and</strong> Mali, these positiveresults for value added currently come at a very high cost to the nationalbudget (table 11.5). Mali’s negative budgetary contribution is especially strik<strong>in</strong>gwhen compared with the value-added figures <strong>in</strong> table 11.4: for every dollar<strong>of</strong> value added generated, the Malian government had to pay roughly US$0.50from its budget <strong>in</strong> 2006. Burk<strong>in</strong>a Faso’s figure may be less alarm<strong>in</strong>g <strong>in</strong> total <strong>and</strong>when compared with value-added figures, but the figure caused major problemsfor the country <strong>and</strong> its g<strong>in</strong>n<strong>in</strong>g companies <strong>in</strong> 2006 <strong>and</strong> 2007. With<strong>in</strong> ESA,the concentrated <strong>and</strong> competitive sectors (Tanzania, Zambia, <strong>and</strong> Zimbabwe)clearly make the greatest contribution to the state budget.Over all three macro <strong>in</strong>dicators, the concentrated <strong>and</strong> competitive systems <strong>in</strong>Tanzania, Zambia, <strong>and</strong> Zimbabwe emerge as the strongest performers: (a) companycosts are among the lowest, (b) overall competitiveness is strong (withoutpunish<strong>in</strong>g farmers with very low prices, as <strong>in</strong> Mozambique), (c) they generatesubstantial value added per capita, <strong>and</strong> (d) they do all <strong>of</strong> this while mak<strong>in</strong>g byfar the highest contributions to the national budgets.150 GERGELY
Table 11.5 Net per Capita Budgetary Contribution <strong>of</strong> <strong>Cotton</strong> Sector, 2006Burk<strong>in</strong>a Faso Mali Cameroon Mozambique Zambia Zimbabwe Tanzania Ug<strong>and</strong>aTotal direct +<strong>in</strong>direct taxes paid(thous<strong>and</strong> US$) 4,261 2,883 1,388 1,471 1,904 2,312 5,531 719Budgetary transfersreceived(thous<strong>and</strong> US$) –15,550 –31,620 0 0 0 0 0 0Net budgetarycontribution –11,289 –28,737 1,388 1,471 1,904 2,312 5,531 719Population, 2005(thous<strong>and</strong>) 13,933 11,611 17,795 20,533 11,478 13,120 38,478 28,947Net budgetarycontribution, U.S.$per capita –0.81 –2.47 0.08 0.07 0.17 0.18 0.14 0.02Source: Authors.Note: Budgetary transfers assumed equal to losses <strong>of</strong> public companies: Compagnie Malienne de Développement des Fibres Textiles <strong>in</strong> Mali, SOFITEX <strong>in</strong>Burk<strong>in</strong>a.151
CHAPTER TWELVEConclusionsPatrick Labaste, Col<strong>in</strong> Poulton,<strong>and</strong> David TschirleyImplicit <strong>in</strong> reform programs <strong>in</strong> cotton <strong>and</strong> other sectors <strong>in</strong> <strong>Africa</strong> to date hasbeen the notion that structure matters, at least <strong>in</strong>s<strong>of</strong>ar as it promotes orimpedes competition. However, relatively little susta<strong>in</strong>ed attention hasbeen paid to the precise structure that postreform sectors could take or why aparticular structure might be preferable. 82 This present work strongly confirmsthat sector structure matters to performance <strong>and</strong> to the types <strong>of</strong> approachesneeded to improve performance. At the same time, it recognizes that otherfactors—such as history, managerial competence, geography, politics, macroeconomics,developments <strong>in</strong> compet<strong>in</strong>g or complementary sectors, <strong>and</strong> even luck—also play roles that cannot be ignored.Despite the f<strong>in</strong>ancial crisis currently fac<strong>in</strong>g a number <strong>of</strong> cotton sectors <strong>in</strong>West <strong>and</strong> Central <strong>Africa</strong> (WCA), experts tend to agree that the high <strong>in</strong>tr<strong>in</strong>sicquality <strong>of</strong> its fiber, the fact that it is h<strong>and</strong>picked, <strong>and</strong> the low unit productioncosts <strong>of</strong> its smallholder production base still give <strong>Africa</strong>n cotton importantgrowth potential on the world market <strong>in</strong> the long run. However, rema<strong>in</strong><strong>in</strong>gcompetitive <strong>and</strong> ma<strong>in</strong>ta<strong>in</strong><strong>in</strong>g or <strong>in</strong>creas<strong>in</strong>g market share will require considerableeffort geared toward narrow<strong>in</strong>g exist<strong>in</strong>g gaps (<strong>in</strong> productivity, quality management,<strong>and</strong> so forth) <strong>and</strong> build<strong>in</strong>g more on comparative advantages. Theseobjectives are important notwithst<strong>and</strong><strong>in</strong>g factors beyond the direct control <strong>of</strong>Sub-Saharan <strong>Africa</strong>n (SSA) governments <strong>and</strong> stakeholders, such as the evolution<strong>of</strong> the euro/US$ exchange rate <strong>and</strong> market distortions from subsidies <strong>in</strong>Organisation for Economic Co-operation <strong>and</strong> Development (OECD) countries<strong>and</strong> <strong>in</strong> Ch<strong>in</strong>a.153
This f<strong>in</strong>al chapter summarizes the study’s ma<strong>in</strong> f<strong>in</strong>d<strong>in</strong>gs on the l<strong>in</strong>ks betweensector types <strong>and</strong> performance outcomes. It then suggests ways forward for<strong>Africa</strong>n cotton sectors, look<strong>in</strong>g first at themes that cut across sector types, then<strong>in</strong>dividually at each sector type.SUMMARY OF EXPECTED AND REALIZED PERFORMANCEACROSS KEY INDICATORSTable 12.1 br<strong>in</strong>gs together <strong>in</strong>formation on the selected performance <strong>in</strong>dicatorsby sector type, compar<strong>in</strong>g expected with realized performance. The expectationsgenerated from the typology <strong>in</strong> chapter 4 about the strengths <strong>and</strong> weaknesses<strong>of</strong> different sector types are borne out <strong>in</strong> a number <strong>of</strong> ways, if not <strong>in</strong>all cases.With regard to sector structure, the follow<strong>in</strong>g four broad conclusions emergefrom the study:■■■First, no one sector type performed sufficiently well on all performance<strong>in</strong>dicators <strong>and</strong> throughout the past 10–15 years to be considered unambiguously“best.” The study has revealed strengths <strong>and</strong> weaknesses <strong>in</strong> all systems,particularly when they are exam<strong>in</strong>ed over an extended period. All cottonsectors are seek<strong>in</strong>g to adapt by implement<strong>in</strong>g reforms.Second, although no s<strong>in</strong>gle benchmark model emerges from the countriesunder review, useful dist<strong>in</strong>ctions can <strong>and</strong> must be made. Current weaknesses<strong>of</strong> some <strong>of</strong> the WCA sectors—lack <strong>of</strong> f<strong>in</strong>ancial susta<strong>in</strong>ability, loweconomic efficiency, <strong>and</strong> stagnat<strong>in</strong>g productivity at farm level—threatentheir short-term survival. At the other end <strong>of</strong> the spectrum, competitivemodels such as Tanzania <strong>and</strong> Ug<strong>and</strong>a are apparently stuck with low productivity<strong>and</strong> (<strong>in</strong> unregulated Tanzania) low quality, plus long-term concernsabout resource depletion <strong>and</strong> an <strong>in</strong>ability to make a significant dent <strong>in</strong>poverty rates. By contrast, the concentrated <strong>and</strong>, less clearly, the localmonopoly systems seem to have the greatest capacity to tackle their currentdifficulties, to develop regulatory systems, <strong>and</strong> to deliver improved performance<strong>in</strong> the near future. Sector type does matter.Third, although there has been considerable fluidity <strong>in</strong> the structure <strong>of</strong><strong>Africa</strong>n cotton sectors over the past 10–15 years (see figure 4.2), there isalso an element <strong>of</strong> path dependency <strong>in</strong> sector structure. 83 It is difficult toconsolidate a sector from 30 or more g<strong>in</strong>n<strong>in</strong>g companies to five or six.Conversely, it is not advisable <strong>and</strong> realistic for a country to try to changeovernight from a highly coord<strong>in</strong>ated national monopoly—with its beliefs<strong>and</strong> operat<strong>in</strong>g procedures—to a fragmented, competitive model. Whereneeded, systemic reforms should, therefore, be designed to shift sectorstructure progressively toward a preferred alternative model rather thanradically alter<strong>in</strong>g the structure over a short period. Where systemic reformis not called for, the priority is to seek new <strong>in</strong>stitutional arrangements that154 LABASTE, POULTON, AND TSCHIRLEY
Table 12.1 Summary <strong>of</strong> Expected <strong>and</strong> Realized <strong>Performance</strong> across Key IndicatorsType <strong>of</strong> <strong>in</strong>dicator Indicator Expected performance Realized performance CommentsProcess <strong>in</strong>dicatorsQualityEstimated averagerealized premiumover Cotlook AIndex on worldmarkets (US$/lbl<strong>in</strong>t)■ Best <strong>in</strong> concentratedsectors■ Lowest <strong>in</strong> competitive■ Conditions <strong>in</strong>national <strong>and</strong> localmonopolies thatshould be conduciveto quality, butperformance thatdepends onmanagement culture<strong>and</strong> regulatoryeffectiveness■ Best <strong>in</strong> competitivesystems■ Lower <strong>in</strong>concentrated,market-based sectors■ In national <strong>and</strong> localmonopolies, dependson political factors <strong>and</strong>barga<strong>in</strong><strong>in</strong>g strength <strong>of</strong>farmer organizations■ Expectations largely confirmed <strong>in</strong>ESA market-based sectors; Zambia(most concentrated) +0.05/lb,Zimbabwe +0.03/lb, Ug<strong>and</strong>a+0.02/lb, Tanzania (mostcompetitive) –0.01/lb■ State monopolies <strong>in</strong> WCA lowerthan concentrated sectors <strong>in</strong> ESA,at par to +0.03/lb■ Mozambique (local monopoly)worst at –0.02/lb■ Mozambique performancethat is highly variable acrosscompanies; <strong>in</strong>effectiveregulation <strong>and</strong> previousdom<strong>in</strong>ance <strong>of</strong> orig<strong>in</strong>al<strong>in</strong>vestors (with little focus onproductivity <strong>and</strong> quality) stillaffect<strong>in</strong>g overall premiums■ Zimbabwe performance thathas fallen with new entrants■ Mali is the poorestperformer <strong>in</strong> WCA because<strong>of</strong> management issues■ High share <strong>of</strong> world price <strong>in</strong>competitive systems(Tanzania, Ug<strong>and</strong>a)■ High prices to farmers <strong>in</strong>WCA are not susta<strong>in</strong>able■ Prices exceptionally low <strong>in</strong>Zimbabwe <strong>in</strong> early 2000s, butimpact <strong>of</strong> new entry on pricestill to be provenPric<strong>in</strong>gMean percentage <strong>of</strong>free-on-truck(FOR) paid t<strong>of</strong>armers■ Expectations largely confirmedoutside monopoly sectors:Tanzania (most competitive) 70%,Ug<strong>and</strong>a 68%, Zimbabwe (moreconcentrated) 49%, Zambia (mostconcentrated) 55%■ National monopoly systems allpaid 71%–76% <strong>in</strong> 2000–5, butmuch lower levels <strong>in</strong> 1990s■ Mozambique, with least powerfulfarmer groups <strong>and</strong> local monopolysystem, lowest at 48%(cont<strong>in</strong>ued)155
156Table 12.1 (Cont<strong>in</strong>ued)Type <strong>of</strong> <strong>in</strong>dicator Indicator Expected performance Realized performance CommentsInput provision■ Percentage <strong>of</strong>cotton farmersreceiv<strong>in</strong>g <strong>in</strong>putcredit■ Adequacy <strong>and</strong>quality <strong>of</strong> <strong>in</strong>putcredit package,if provided■ Repayment rate■ National <strong>and</strong> localmonopolies best onprovision <strong>and</strong>repayment;<strong>in</strong>determ<strong>in</strong>ate onadequacy <strong>and</strong> quality■ Concentrated, marketbasedsectors nextbest on provision;possibly with better<strong>in</strong>centives on adequacy<strong>and</strong> quality■ Competitive sectorsunable to provide<strong>in</strong>put on creditExpectations largely confirmed:■ % receiv<strong>in</strong>g <strong>in</strong>put credit: 100% <strong>in</strong>all WCA countries; Mozambique,<strong>and</strong> Zambia; 90%–95% <strong>in</strong>Zimbabwe (2006/07); 0% <strong>in</strong>Tanzania; subsidized cash sale <strong>in</strong>Ug<strong>and</strong>a (where past experimentswith credit unsuccessful)■ Adequacy worst (though variable)<strong>in</strong> Mozambique; best <strong>in</strong> WCA,Zimbabwe (before 2003), <strong>and</strong>Ug<strong>and</strong>a (under hybrid system)■ Credit repayment consistently>90% <strong>in</strong> WCA; highly variable <strong>in</strong>Mozambique, Zambia; 90% butfall<strong>in</strong>g <strong>in</strong> ZimbabweExpectations largely confirmed, withexception <strong>of</strong> Mozambique, wheresome companies provide almostno extension■ WCA <strong>and</strong> (to a lesserextent) Zimbabwe, Ug<strong>and</strong>aprovide fertilizer; Ug<strong>and</strong>a’sprovision enabled by hybridsystem imposed oncompetitive structure.■ Adequacy fall<strong>in</strong>g <strong>in</strong>Zimbabwe, very low amongnew entrants.■ Tanzania able to providesmall amounts <strong>of</strong> <strong>in</strong>putthrough forced sav<strong>in</strong>gsmechanism.ExtensionResearch■ Provision <strong>of</strong>assistance■ Qualitativeassessment <strong>of</strong>quality■ Number <strong>of</strong>varieties released<strong>and</strong> taken up <strong>in</strong>past 10 years■ Use <strong>of</strong> newtechnologies(GM varieties,low-volumeherbicides)Same as <strong>in</strong>put provision,though extension <strong>in</strong>general expected tobe weaker than <strong>in</strong>putcredit provisionNo clear prediction—though monopoly <strong>and</strong>concentrated systemsmay have bettercompany <strong>in</strong>put <strong>in</strong>tobreed<strong>in</strong>g workNo clear pattern: Mali (6) <strong>and</strong>Zimbabwe (4) have most releases;WCA hav<strong>in</strong>g seen much greaterorganizational stability <strong>in</strong> research<strong>in</strong> the past, because <strong>of</strong> persistence<strong>of</strong> national monopoly approachMeasurement very difficult,<strong>and</strong> dist<strong>in</strong>ction betweenprovid<strong>in</strong>g <strong>in</strong>put <strong>and</strong>extension advice notalways clearNature <strong>of</strong> agricultural researchthat means history exerts abig <strong>in</strong>fluence; impact <strong>of</strong>sector type limited by factthat state still controlscotton research <strong>in</strong> mostcountries
Valorization <strong>of</strong>by-productsValue <strong>of</strong> cottonseedsNo clear prediction—only <strong>in</strong> WCA doeshistory <strong>of</strong> vertical<strong>in</strong>tegration establish asystematic l<strong>in</strong>k withg<strong>in</strong>n<strong>in</strong>g structureAbnormally low <strong>in</strong> Mali <strong>and</strong> Burk<strong>in</strong>aFaso (monopsony <strong>in</strong> cottonseedoil markets). but high pricesrealized <strong>in</strong> other l<strong>and</strong>lockedcountriesBoth dem<strong>and</strong> (for oil <strong>and</strong> cake)<strong>and</strong> policy factors beyondthe control <strong>of</strong> g<strong>in</strong>ners thatexert a big <strong>in</strong>fluenceIntermediate outcome<strong>in</strong>dicatorsFarm-level performanceCompany performance■ Mean yield past5 years (kg seedcotton/ha)■ Trend, past 10yearsAdjusted farm gateto FOT cost(US$/kg l<strong>in</strong>t)■ Expected performanceon yield level stronglyrelated to expectationsfor <strong>in</strong>put provision <strong>and</strong>extension■ No clear predictionfor yield trend■ Worst <strong>in</strong> monopolies;best <strong>in</strong> competitivesectors■ Mean yields that rema<strong>in</strong> highest <strong>in</strong>WCA; with<strong>in</strong> ESA, concentratedsectors that perform best■ However, yield stagnation <strong>in</strong> WCAs<strong>in</strong>ce mid-1980s■ Zambia (concentrated) provid<strong>in</strong>gbest example <strong>of</strong> yield growth <strong>in</strong>ESA, but overall ESA yields hav<strong>in</strong>gfailed to close gap on worldaverageExpectations largely confirmed:US$0.31–0.45 <strong>in</strong> WCAmonopolies, US$0.38 <strong>in</strong>Mozambique; <strong>in</strong> market sectors,US$0.21 <strong>in</strong> Tanzania to US$0.32<strong>in</strong> Zambia <strong>and</strong> Ug<strong>and</strong>aCurrent yields heavily<strong>in</strong>fluenced by past<strong>in</strong>vestments, especially <strong>in</strong>research <strong>and</strong> extension, sotypology alone does notexpla<strong>in</strong> performancevariationsHybrid regulatory structure <strong>in</strong>Ug<strong>and</strong>a that protects<strong>in</strong>efficient companies; rollerg<strong>in</strong>s <strong>and</strong> competition <strong>in</strong>Tanzania that keepcosts down(cont<strong>in</strong>ued)157
158Table 12.1 (Cont<strong>in</strong>ued)Type <strong>of</strong> <strong>in</strong>dicator Indicator Expected performance Realized performance CommentsOverall outcome<strong>in</strong>dicatorsFarmer welfareOverallcompetitivenessReturns per day t<strong>of</strong>amily labor(US$/day)Ratio <strong>of</strong> total FOTcost to totalFOT valueNo clear predictionNo clear prediction.■ Generally highest <strong>in</strong> WCA national<strong>and</strong> local monopolies,US$1.30–US$1.70■ Highly variable <strong>in</strong> ESA, US$0.79 <strong>in</strong>Tanzania (competitive) to US$2.11<strong>in</strong> Zimbabwe (concentrated)■ Worst <strong>in</strong> Mozambique (localmonopoly) at $0.44■ WCA monopolies leastcompetitive, 0.98 (Cameroon) to1.15 (Mali)■ ESA concentrated <strong>and</strong> competitivemuch more competitive at 0.76(Zambia) to 0.88 (Zimbabwe)■ 0.79 <strong>in</strong> MozambiquePast <strong>in</strong>vestments <strong>in</strong> animaltraction important; currentprices not susta<strong>in</strong>able <strong>in</strong>WCA, but yields a biggerdeterm<strong>in</strong>ant <strong>of</strong> returnsthan prices■ Low (that is, competitive)figure <strong>in</strong> Mozambique, partlyresult <strong>of</strong> very low prices t<strong>of</strong>armers■ Low figure <strong>in</strong> Zambia partlyresult <strong>of</strong> not pass<strong>in</strong>g qualitypremium on to farmers■ WCA with high farm prices<strong>and</strong> high g<strong>in</strong>n<strong>in</strong>g costs
Macro impact■ Total value addedper capita■ Net budgetarycontribution percapita (taxes paidm<strong>in</strong>us transfersreceived)Traditionally thought tobe best <strong>in</strong> WCAmonopolies, wherecoverage <strong>of</strong> farmersgreatest <strong>and</strong> yieldshighest■ Total value added. No clear patternby sector type, thoughconcentrated market-basedsystems <strong>in</strong> ESA clearly best <strong>in</strong> thatregion, with Zambia <strong>and</strong>Zimbabwe US$6 per capita;Burk<strong>in</strong>a Faso highest <strong>of</strong> all atUS$8.84. per capita; Ug<strong>and</strong>a <strong>and</strong>Mozambique lowest because <strong>of</strong>low production■ Net budgetary contribution. Verypoor <strong>in</strong> non-market-basedsystems: Mali gov ernment paid netUS$2.47 per capita to sector <strong>in</strong>2006; Burk<strong>in</strong>a Faso paid US$0.81;sectors <strong>in</strong> Cameroon,Mozambique, <strong>and</strong> Ug<strong>and</strong>a madepositive but small contributions(US$0.02–US$0.08); market-basedsectors (Tanzania, Zimbabwe,Zambia) all made positivecontributions <strong>of</strong> US$0.14–US$0.18per capita■ Value added. Tanzania(competitive) hav<strong>in</strong>g highestvalue added per kg l<strong>in</strong>t, buthighly variable productionthat means macrocontribution will also varygreatlyZambia <strong>and</strong> Zimbabwe(concentrated) show<strong>in</strong>gmuch less variationSource: Authors.Note: FOT Costs = free-on-truck costs; GM = genetically modified.159
■make the exist<strong>in</strong>g system work better. Both <strong>of</strong> these issues are exam<strong>in</strong>ed <strong>in</strong>more concrete terms later <strong>in</strong> this chapter.Fourth, although some <strong>Africa</strong>n cotton sectors may be far<strong>in</strong>g better than others,on a global scale all are lagg<strong>in</strong>g beh<strong>in</strong>d the best performers <strong>in</strong> the world.Global competitiveness must, therefore, be kept high on the agenda <strong>in</strong> every<strong>Africa</strong>n cotton sector. Though a number <strong>of</strong> SSA producers have succeeded<strong>in</strong> exp<strong>and</strong><strong>in</strong>g their share <strong>of</strong> the world l<strong>in</strong>t market s<strong>in</strong>ce the mid-1990s, theyface <strong>in</strong>creas<strong>in</strong>g competition from other countries <strong>and</strong> from synthetic fibers;hence they should expect low future prices. This expectation means thatthey must cont<strong>in</strong>ually cut costs, raise productivity, <strong>and</strong> add value if they areto ma<strong>in</strong>ta<strong>in</strong> attractive returns to producers <strong>and</strong> to make a positive contributionto national poverty reduction goals. Whether this change needs to bedone through systemic reform or through <strong>in</strong>stitutional <strong>in</strong>novation with<strong>in</strong>the exist<strong>in</strong>g structure depends on the country’s specific circumstances. Ineither case, countries need to address (a) some common factors h<strong>in</strong>der<strong>in</strong>gcompetitiveness by improv<strong>in</strong>g research <strong>and</strong> extension responsiveness <strong>and</strong>efficiency, (b) technology transfer <strong>in</strong> areas such as dissem<strong>in</strong>ation <strong>of</strong> geneticallymodified varieties, <strong>and</strong> (c) natural resource conservation.<strong>Performance</strong> on Core Activities <strong>and</strong> Service Delivery:The Process IndicatorsThe typology presented <strong>in</strong> this book generated clear expectations regard<strong>in</strong>g four<strong>of</strong> the six selected process <strong>in</strong>dicators (quality, pric<strong>in</strong>g, <strong>in</strong>put provision, <strong>and</strong> extension).In all four cases, expectations were largely confirmed (table 12.1).Concentrated sectors perform best on quality. They also provide <strong>in</strong>putcredit <strong>and</strong> extension advice to large shares <strong>of</strong> cotton farmers, although farmercoverage is not as complete as <strong>in</strong> national <strong>and</strong> local monopolies. Credit repaymentrates <strong>in</strong> concentrated systems are typically high but is less stable than <strong>in</strong>national monopolies. The 1990s showed that concentrated systems can deliverattractive prices to farmers. However, post-2000 performance has been poor, asmight be feared <strong>in</strong> oligopolies.National <strong>and</strong> local monopolies <strong>in</strong> WCA countries provide <strong>in</strong>put credit <strong>and</strong>extension to all farmers <strong>and</strong> achieve high <strong>and</strong> fairly stable credit repaymentrates. However, the quality <strong>of</strong> extension assistance <strong>in</strong> these monopoly systemshas probably decl<strong>in</strong>ed s<strong>in</strong>ce the mid-1980s.Although seed cotton prices were at their lowest <strong>in</strong> the 1990s, s<strong>in</strong>ce 2000,they have benefited from new price-sett<strong>in</strong>g mechanisms, <strong>in</strong>clud<strong>in</strong>g greater<strong>in</strong>volvement <strong>of</strong> farmer representatives <strong>in</strong> price negotiations. However, they arenow at unsusta<strong>in</strong>ably high levels. <strong>Performance</strong> on l<strong>in</strong>t quality is variable. Ingeneral, these monopoly systems underperform on quality management, <strong>in</strong>part because <strong>of</strong> political <strong>in</strong>fluence with<strong>in</strong> the cotton sector.Meanwhile, Mozambique’s local monopoly system underperforms expectationsmore generally, although there is considerable divergence <strong>in</strong> performance160 LABASTE, POULTON, AND TSCHIRLEY
across concession zones, with newer entrants <strong>of</strong>ten outperform<strong>in</strong>g early <strong>in</strong>cumbents.Mozambique has the highest quality discount on world markets <strong>and</strong>, <strong>in</strong>several concession areas, the poorest <strong>in</strong>put supply <strong>and</strong> extension assistanceoutside <strong>of</strong> Tanzania. This performance is less surpris<strong>in</strong>g when one considersthat the country emerged from a devastat<strong>in</strong>g civil war only <strong>in</strong> the early 1990s<strong>and</strong> that its regulatory capacity rema<strong>in</strong>s very low.Evidence is strong <strong>in</strong> Tanzania <strong>and</strong> Ug<strong>and</strong>a that, with<strong>in</strong> market-based systems,competition <strong>in</strong>creases prices paid to farmers. Despite the recent high pricespaid by the WCA monopoly systems, tak<strong>in</strong>g a 20-year perspective, WCA sectorshave been outperformed on price by Tanzania <strong>and</strong> Ug<strong>and</strong>a. However, competitivesystems clearly also have their weaknesses. Tanzania’s competitive sector hasbeen unable to provide any <strong>in</strong>put credit or extension advice, <strong>and</strong> also it performspoorly on l<strong>in</strong>t quality, as predicted. Ug<strong>and</strong>a has ma<strong>in</strong>ta<strong>in</strong>ed a quality premiums<strong>in</strong>ce liberalization, although this premium has decl<strong>in</strong>ed. S<strong>in</strong>ce the early 2000s, itattempted to address the challenges <strong>of</strong> provid<strong>in</strong>g <strong>in</strong>put <strong>and</strong> extension to farmersby curtail<strong>in</strong>g output market competition through the zonal quota system.To date, there is little evidence <strong>of</strong> the impact <strong>of</strong> sector structure on researchsystem performance. In theory, companies with<strong>in</strong> monopoly <strong>and</strong> concentratedsystems should have stronger <strong>in</strong>centives <strong>and</strong> greater ability to dem<strong>and</strong> highquality research from research systems. However, <strong>in</strong> practice most research systemsrema<strong>in</strong> firmly under state control so that opportunities for stakeholder<strong>in</strong>fluence are limited. The effect <strong>of</strong> past <strong>in</strong>vestment is probably highest <strong>in</strong> thisrealm. Mali, with many years <strong>of</strong> support from French research <strong>in</strong>stitutions, wasable to carry on some <strong>of</strong> that momentum <strong>and</strong> released six varieties over the past10 years. However, an emphasis on improved g<strong>in</strong>n<strong>in</strong>g outturn <strong>in</strong>stead <strong>of</strong> higherseed cotton yields may have reduced the contribution that research could otherwisehave made to revers<strong>in</strong>g the yield stagnation seen <strong>in</strong> WCA countries.Zimbabwe, which featured close collaboration for many years among its ownnational monopoly, the research <strong>in</strong>stitute, <strong>and</strong> the commercial farmers, has alsobeen able to ma<strong>in</strong>ta<strong>in</strong> some capacity <strong>in</strong> this area <strong>and</strong> has released at least fourvarieties s<strong>in</strong>ce the mid-1990s. Other countries (with less historical <strong>in</strong>vestment <strong>in</strong>research) have been less successful <strong>in</strong> this regard, though Zambia has been effectiveat purify<strong>in</strong>g exist<strong>in</strong>g varieties <strong>and</strong> at exploit<strong>in</strong>g more <strong>of</strong> their yield potential.F<strong>in</strong>ally, there are few reasons that the performance <strong>of</strong> seed process<strong>in</strong>g <strong>in</strong>dustriesshould be related to the type <strong>of</strong> cotton sector organization other thanwhere the two <strong>in</strong>dustries are strongly vertically l<strong>in</strong>ked (as historically acrossWest <strong>Africa</strong>). Indeed, the ma<strong>in</strong> f<strong>in</strong>d<strong>in</strong>g <strong>in</strong> relation to seed pric<strong>in</strong>g is that—<strong>in</strong>the two monopoly systems <strong>in</strong> which cotton companies also face monopsonisticcottonseed oil markets (Burk<strong>in</strong>a Faso <strong>and</strong> Mali)—prices for seed dur<strong>in</strong>g2006 were extremely low. Elsewhere, factors beyond the control <strong>of</strong> cotton companies(whether a country is l<strong>and</strong>locked, the strength <strong>of</strong> local dem<strong>and</strong> for cakefrom the livestock sector, the trade policy) largely <strong>in</strong>fluence outcomes. Moreresearch is needed to underst<strong>and</strong> the performance <strong>of</strong> <strong>Africa</strong>n oil <strong>and</strong> cake markets<strong>in</strong> greater depth.CONCLUSIONS 161
<strong>Performance</strong> on Global Outcomes: The Outcome IndicatorsThe typology generated clear expectations about one <strong>in</strong>termediate outcome:that company efficiency would be worst <strong>in</strong> monopolies <strong>and</strong> best <strong>in</strong> competitivesectors. This expectation was strongly confirmed. Adjusted farm gate to FOTcosts <strong>in</strong> Tanzania’s competitive sector (the best performer) are less than halfthose <strong>in</strong> Mali’s national monopoly (the worst performer). In all national <strong>and</strong>local monopolies, costs are near or above the highest costs <strong>in</strong> market-based systems;with<strong>in</strong> these market-based systems, concentrated sectors show highercosts than competitive sectors (such as Tanzania).The comb<strong>in</strong>ation <strong>of</strong> high farmer prices s<strong>in</strong>ce the beg<strong>in</strong>n<strong>in</strong>g <strong>of</strong> the century<strong>and</strong> relatively <strong>in</strong>efficient companies—that is, companies with high operat<strong>in</strong>gcosts—means that the WCA monopolies are, by a substantial marg<strong>in</strong>, currentlythe least <strong>in</strong>ternationally competitive sectors <strong>in</strong> the study. FOT cost to valueratios <strong>in</strong> WCA range from 0.98 to 1.15, compared with a range <strong>of</strong> 0.76 to 0.88<strong>in</strong> all other countries except Ug<strong>and</strong>a. In Ug<strong>and</strong>a, the hybrid regulatory systemhas kept a large number <strong>of</strong> g<strong>in</strong>ners <strong>in</strong> the sector without <strong>in</strong>creas<strong>in</strong>g production,lead<strong>in</strong>g to a cost to value ratio <strong>of</strong> 0.93, the worst <strong>in</strong> East <strong>and</strong> Southern<strong>Africa</strong> (ESA). Other ESA sectors perform well on this measure, but for differentreasons. Efficient g<strong>in</strong>n<strong>in</strong>g operations are an important part <strong>of</strong> the story <strong>in</strong>Tanzania’s competitive sector <strong>and</strong> Zimbabwe’s concentrated sector. The l<strong>in</strong>tquality premiums obta<strong>in</strong>ed <strong>in</strong> Zambia <strong>and</strong>, to a lesser extent, <strong>in</strong> Zimbabweboost their performance. However, <strong>in</strong> both countries <strong>and</strong> also <strong>in</strong> Mozambique,the competitive ratios have been achieved <strong>in</strong> part because <strong>of</strong> the low prices theypay their farmers. In Mozambique (which scores 0.79 by this measure), theseed cotton price has been 20 percent to 30 percent lower than the prices <strong>in</strong> allother ESA countries. In Zambia (the most “<strong>in</strong>ternationally competitive” sector<strong>in</strong> the study, at 0.76), the seed cotton price is substantially higher than it is <strong>in</strong>Mozambique <strong>and</strong> not far below the price <strong>in</strong> Tanzania <strong>in</strong> absolute terms, but theprice reflects little <strong>of</strong> the substantial quality premium that Zambian companiesreceive on the <strong>in</strong>ternational market.Returns to farmers have been the best <strong>in</strong> WCA monopolies, plus Zimbabwe. InWCA, these high returns are, <strong>of</strong> course, heavily <strong>in</strong>fluenced by the high prices paid<strong>in</strong> recent years, which have been com<strong>in</strong>g down <strong>and</strong> must come down further ifthese sectors are to become more competitive <strong>and</strong> susta<strong>in</strong>able. However, the ma<strong>in</strong>reason for the high returns to farmers <strong>in</strong> WCA is that, by facilitat<strong>in</strong>g access to animaltraction, fertilizer, <strong>and</strong> tra<strong>in</strong><strong>in</strong>g over many years, these countries have beenable to move large shares <strong>of</strong> farmers <strong>in</strong>to high yield<strong>in</strong>g groups: an average <strong>of</strong> morethan 70 percent <strong>of</strong> WCA farmers are medium-high yield performers (see chapter10), compared with a range <strong>of</strong> 20 percent to 30 percent <strong>in</strong> all other countriesexcept Zimbabwe. Mozambique, a poorly regulated local monopoly, shows thelowest returns, driven by relatively poor yields <strong>and</strong> very low farm prices.The picture regard<strong>in</strong>g value added is complex. At farm level, the monopolysystems <strong>of</strong> WCA perform best on value added per hectare as a result <strong>of</strong> their162 LABASTE, POULTON, AND TSCHIRLEY
high yields. However, a mixed picture emerges <strong>in</strong> value added per kg <strong>of</strong> l<strong>in</strong>tbecause <strong>of</strong> the high <strong>in</strong>put costs <strong>in</strong>curred <strong>in</strong> WCA systems. More efficient g<strong>in</strong>ners<strong>in</strong> ESA score highly on value added at g<strong>in</strong>n<strong>in</strong>g level. Thus, although Burk<strong>in</strong>aFaso achieved the highest aggregate value added <strong>in</strong> the year for which thesecalculations were undertaken, <strong>in</strong> an unexpected result, three ESA sectors (Tanzania,Zambia, <strong>and</strong> Zimbabwe) outperformed Cameroon <strong>and</strong> Mali. 84 Translat<strong>in</strong>gthese figures <strong>in</strong>to value added per capita (across the whole population), Burk<strong>in</strong>aFaso aga<strong>in</strong> performs best. However, the concentrated systems <strong>in</strong> ESA aga<strong>in</strong>perform well, driven by the f<strong>in</strong>ancial capacity <strong>of</strong> firms to provide adequate<strong>in</strong>put packages <strong>and</strong> some extension to large numbers <strong>of</strong> farmers. Tanzania hasthe largest population <strong>in</strong> the sample, so even with its record production <strong>in</strong> theyear <strong>in</strong> question, its per capita <strong>in</strong>dicator is low. Perhaps the ma<strong>in</strong> lesson to bedrawn from this analysis is that the relative <strong>in</strong>efficiency <strong>of</strong> WCA g<strong>in</strong>n<strong>in</strong>g operationsgreatly reduces their value added contribution to the wider economy,despite their ability to assist large numbers <strong>of</strong> farmers <strong>in</strong> achiev<strong>in</strong>g relativelyhigh yields.F<strong>in</strong>ally, the positive performance on per capita value added <strong>in</strong> Burk<strong>in</strong>a Faso<strong>and</strong> Mali has come at a steep cost to the rest <strong>of</strong> the economy, especially to thestate budget, particularly <strong>in</strong> recent years. Follow<strong>in</strong>g the 2006 season, Mali’s cottonsector required a net budgetary transfer <strong>of</strong> US$2.47 per capita (US$29 milliontotal; see table 11.5) to cover its losses, while Burk<strong>in</strong>a Faso’s required US$0.81per capita (US$11 million total). Alone among the WCA countries,Cameroon’s SODECOTON was able to cover recent losses through surplusesgenerated <strong>in</strong> earlier years. Overall <strong>and</strong> even exclud<strong>in</strong>g Burk<strong>in</strong>a Faso <strong>and</strong> Mali,the market-based sectors (Tanzania, Zambia, <strong>and</strong> Zimbabwe) made net percapita budgetary contributions <strong>in</strong> 2006 at least twice as large as the monopolyor hybrid systems (Cameroon, Mozambique, <strong>and</strong> Ug<strong>and</strong>a).In summary, the WCA national monopoly model has generated strongreturns to very large numbers <strong>of</strong> farmers, but poor <strong>in</strong>centives for cost efficiencyhave underm<strong>in</strong>ed their <strong>in</strong>ternational competitiveness <strong>and</strong> their contribution tothe wider economy. It is clear that the appreciation <strong>of</strong> the euro versus the dollar<strong>in</strong> recent years has contributed to the current lack <strong>of</strong> competitiveness, butpoor cost control with<strong>in</strong> the parastatal companies is also significant. Costreductions are needed, particularly <strong>in</strong> Mali, but also to a lesser extent <strong>in</strong> Burk<strong>in</strong>aFaso <strong>and</strong> Cameroon (table 11.1). These cost reductions seem unlikely to comewithout fundamental change <strong>in</strong> the systems. To accomplish change, policymakers <strong>and</strong> stakeholders should look at the full range <strong>of</strong> options, both <strong>in</strong>stitutional<strong>and</strong> technological, at field, g<strong>in</strong>n<strong>in</strong>g, <strong>and</strong> cotton seed process<strong>in</strong>g levels. Amajor lesson s<strong>in</strong>ce 2000 is that the producer price cannot be treated any longeras the ma<strong>in</strong> mechanism for ensur<strong>in</strong>g good returns to farmers without jeopardiz<strong>in</strong>gthe sector’s f<strong>in</strong>ancial susta<strong>in</strong>ability.Competitive sectors are cost-efficient <strong>and</strong> pay attractive prices to farmers,but their <strong>in</strong>ability to provide <strong>in</strong>put credit <strong>and</strong> extension or to raise qualitylimits their likely contribution to poverty reduction as long as <strong>in</strong>put <strong>and</strong>CONCLUSIONS 163
credit market failures, rema<strong>in</strong> prom<strong>in</strong>ent features <strong>of</strong> rural <strong>Africa</strong>. It seemslikely that Tanzania’s competitive system has been able to perform as well asit has, <strong>in</strong> part because <strong>of</strong> favorable agro-ecological <strong>and</strong> population settlementcharacteristics. However, a competitive model’s performance could be expectedto be substantially poorer <strong>in</strong> many areas <strong>of</strong> WCA, which are less well endowed<strong>in</strong> cultivable l<strong>and</strong> <strong>and</strong> soil fertility.Concentrated sectors have performed well on a broad range <strong>of</strong> <strong>in</strong>dicators.They have scored highly on quality <strong>and</strong> service delivery (<strong>in</strong>put <strong>and</strong> extension),have been more efficient than the monopolies, <strong>and</strong> have also generated attractivevalue added per capita while mak<strong>in</strong>g the highest contributions to statebudgets through taxes <strong>and</strong> fees. Yet, s<strong>in</strong>ce 2000 their performance on seed cottonpric<strong>in</strong>g has been disappo<strong>in</strong>t<strong>in</strong>g. As illustrated by the problems caused bynew entry <strong>in</strong> Zimbabwe s<strong>in</strong>ce 2001 <strong>and</strong> <strong>in</strong> Zambia s<strong>in</strong>ce 2004, the long-termperformance <strong>of</strong> these systems is likely to depend on a supportive approach toregulation, someth<strong>in</strong>g that has yet to be achieved with<strong>in</strong> an <strong>Africa</strong>n cotton sector(see follow<strong>in</strong>g text for more details on key elements <strong>of</strong> such regulation).WAYS FORWARD FOR AFRICAN COTTON:CROSS-CUTTING CHALLENGESIn assess<strong>in</strong>g the performance <strong>of</strong> <strong>Africa</strong>n cotton sectors, one must keep <strong>in</strong> m<strong>in</strong>dthat, while some are far<strong>in</strong>g better than others, on a global scale all are lagg<strong>in</strong>gbeh<strong>in</strong>d the best performers <strong>in</strong> the world on one or several dimensions. Thoughthey have exp<strong>and</strong>ed their share <strong>of</strong> the world l<strong>in</strong>t market s<strong>in</strong>ce 1970, these sectorsface <strong>in</strong>creas<strong>in</strong>g competition, hence low future prices. Competition meansthat they must cont<strong>in</strong>ually cut costs, raise productivity, <strong>and</strong> add value if theyare to ma<strong>in</strong>ta<strong>in</strong> attractive returns to farmers <strong>and</strong> to make a positive contributionto national poverty reduction goals. To achieve these purposes, all <strong>Africa</strong>ncotton sectors need to improve their performance on critical issues such asimproved research <strong>and</strong> extension responsiveness <strong>and</strong> efficiency, technologytransfer <strong>in</strong> areas such as dissem<strong>in</strong>ation <strong>of</strong> genetically modified varieties, l<strong>in</strong>tquality management <strong>and</strong> market<strong>in</strong>g, soil conservation, <strong>and</strong> technical supportto farmers <strong>and</strong> farmer organizations. Effective strategies for <strong>Africa</strong>n cotton sectorsshould, therefore, comb<strong>in</strong>e <strong>in</strong>stitutional <strong>in</strong>novations <strong>and</strong> reforms withnecessary additional <strong>in</strong>vestments <strong>in</strong> key public goods.This section considers various cross-cutt<strong>in</strong>g actions that <strong>Africa</strong>n cotton sectorsshould take to build on their comparative advantages <strong>and</strong> narrow exist<strong>in</strong>gperformance gaps with <strong>in</strong>ternational competitors. These efforts can be articulatedaround the follow<strong>in</strong>g three major objectives: (a) achiev<strong>in</strong>g greater valuethrough improved quality, market<strong>in</strong>g, <strong>and</strong> valorization <strong>of</strong> by-products; (b)bridg<strong>in</strong>g competitiveness gaps through farm-level productivity <strong>and</strong> g<strong>in</strong>n<strong>in</strong>gefficiency; <strong>and</strong> (c) improv<strong>in</strong>g the sector’s susta<strong>in</strong>ability through <strong>in</strong>stitutionaldevelopment <strong>and</strong> capacity build<strong>in</strong>g <strong>of</strong> stakeholders, as well as strengthen<strong>in</strong>g <strong>of</strong>164 LABASTE, POULTON, AND TSCHIRLEY
governance <strong>and</strong> regulatory structures <strong>and</strong> management systems. Some <strong>of</strong> theactions discussed next could be usefully tackled at a regional level, as well asnationally, <strong>and</strong> may benefit from donor support.Achiev<strong>in</strong>g Greater ValueEfforts to achieve greater value <strong>in</strong> SSA cotton sectors should focus on three priorityareas: quality, market<strong>in</strong>g, <strong>and</strong> valorization <strong>of</strong> by-products.Quality<strong>Africa</strong>n cotton has two potential competitive advantages <strong>in</strong> the world market:the <strong>in</strong>tr<strong>in</strong>sic quality <strong>of</strong> its fiber (the fiber properties) <strong>and</strong> the fact that it ish<strong>and</strong>picked. Quality improvement—especially the elim<strong>in</strong>ation <strong>of</strong> contam<strong>in</strong>ation—couldresult <strong>in</strong> sell<strong>in</strong>g prices <strong>of</strong> up to US$0.10 per pound above the CotlookA Index. At typical producer prices <strong>of</strong> US$0.25–US$0.32 per kg, a US$0.10per lb <strong>in</strong>crease <strong>in</strong> the price <strong>of</strong> l<strong>in</strong>t that is fully passed on to farmers would<strong>in</strong>crease farmer prices by 30 to 40 percent. As a result, quality managementshould be considered one <strong>of</strong> the most important areas <strong>of</strong> improvement for SSAcotton export<strong>in</strong>g countries.Though most <strong>Africa</strong>n cotton is suitable for the medium-high level <strong>of</strong> r<strong>in</strong>gsp<strong>in</strong>n<strong>in</strong>g, progress on quality s<strong>in</strong>ce the mid-1990s has generally been disappo<strong>in</strong>t<strong>in</strong>g<strong>and</strong> certa<strong>in</strong>ly not improv<strong>in</strong>g as fast as required by the sp<strong>in</strong>n<strong>in</strong>g <strong>in</strong>dustry.The trend <strong>in</strong> sp<strong>in</strong>n<strong>in</strong>g technology toward more automation <strong>and</strong> higherspeeds makes improvements <strong>in</strong> quality <strong>and</strong> consistency a vital issue for thefuture <strong>of</strong> <strong>Africa</strong>n cotton. Yet the quality reputation <strong>of</strong> many <strong>Africa</strong>n l<strong>in</strong>ts hasbeen eroded, primarily by contam<strong>in</strong>ation from foreign matter. Meanwhile, theimpact <strong>of</strong> quality on cotton pric<strong>in</strong>g is not fully understood by producers, evenby some smaller g<strong>in</strong>ners.Greater awareness may be necessary to reestablish <strong>Africa</strong>’s ma<strong>in</strong> comparativeadvantage stemm<strong>in</strong>g from the manual harvest<strong>in</strong>g <strong>of</strong> seed cotton. However,Zimbabwe’s experience s<strong>in</strong>ce 2003 clearly illustrates that awareness alone is notenough. The Zimbabwe cotton sector enjoyed a strong quality reputation on<strong>in</strong>ternational markets, which the dom<strong>in</strong>ant firms were keen to ma<strong>in</strong>ta<strong>in</strong>, <strong>and</strong>farmers were discipl<strong>in</strong>ed <strong>in</strong> grad<strong>in</strong>g their seed cotton before sale. However,when new entrants began <strong>of</strong>fer<strong>in</strong>g flat-rate prices irrespective <strong>of</strong> quality <strong>in</strong>2003, farmer behavior changed with<strong>in</strong> a season, <strong>and</strong> the average quality <strong>of</strong> seedcotton delivered to buy<strong>in</strong>g po<strong>in</strong>ts plummeted. Indeed, a central <strong>in</strong>sight fromthis study is that sector structure has an impact on both the <strong>in</strong>centives that g<strong>in</strong>nershave to produce high quality l<strong>in</strong>t <strong>and</strong> on their ability to control their supplycha<strong>in</strong> to achieve it. Technical solutions to elim<strong>in</strong>ate contam<strong>in</strong>ation are wellknown, but some form <strong>of</strong> coord<strong>in</strong>ation across firms is necessary if such solutionsare to be implemented effectively. 85Quality improvement <strong>in</strong> SSA requires a concerted effort from researchers,farmers, <strong>and</strong> g<strong>in</strong>ners if they are to improve fiber characteristics throughCONCLUSIONS 165
esearch <strong>and</strong> better production practices, reduce variability <strong>of</strong> l<strong>in</strong>t qualitythrough more rigorous seed cotton grad<strong>in</strong>g <strong>and</strong> l<strong>in</strong>t classification, control contam<strong>in</strong>ationthrough capacity build<strong>in</strong>g <strong>and</strong> price <strong>in</strong>centives, <strong>and</strong> optimize qualitymanagement <strong>in</strong> g<strong>in</strong>n<strong>in</strong>g. Efforts must also be made to generalize the use <strong>of</strong>cotton cloth wrappers for bales <strong>and</strong>, ultimately, to develop conta<strong>in</strong>er load<strong>in</strong>g atthe g<strong>in</strong>s <strong>and</strong> optimize export logistics.However, the typology developed <strong>in</strong> chapter 4 highlights a key conundrum<strong>in</strong> <strong>Africa</strong>n cotton systems: while concentrated (<strong>and</strong> perhaps monopoly) sectorsare more likely to achieve the coord<strong>in</strong>ation needed to improve quality,they are not necessarily ready to pass the result<strong>in</strong>g price premiums on t<strong>of</strong>armers. For example, the comparative analysis <strong>in</strong> previous chapters showedthat farmers <strong>in</strong> Tanzania have received slightly higher prices than did farmers<strong>in</strong> Zambia, despite the much higher price premium <strong>in</strong> Zambia. Solv<strong>in</strong>gthis riddle—how to capture the very significant price premiums available to<strong>Africa</strong>n cotton while shar<strong>in</strong>g some <strong>of</strong> that benefit with farmers—probablyrequires much stronger farmer organizations than are currently found <strong>in</strong>SSA. In concentrated systems, these organizations would have to barga<strong>in</strong>with the large g<strong>in</strong>ners for remunerative prices on the basis <strong>of</strong> solid knowledge<strong>of</strong> world prices, realized export prices, quality premiums obta<strong>in</strong>ed, <strong>and</strong>cost structure borne by g<strong>in</strong>ners. In competitive systems, these organizationswould need to focus on tra<strong>in</strong><strong>in</strong>g farmers about the benefits <strong>of</strong> <strong>in</strong>creasedquality, <strong>and</strong> on monitor<strong>in</strong>g prices paid by companies to ensure transmission<strong>of</strong> quality premiums. 86Market<strong>in</strong>g PracticesDiscussion <strong>in</strong> chapters 2 <strong>and</strong> 7 highlighted the fact that <strong>Africa</strong>n cotton sectorscommonly lose revenue from weaknesses <strong>in</strong> l<strong>in</strong>t market<strong>in</strong>g, not just l<strong>in</strong>t quality.Some weaknesses are largely beyond the control <strong>of</strong> the cotton sector, especiallywhere a l<strong>and</strong>locked country relies on the export <strong>in</strong>frastructure <strong>of</strong> a neighbor.<strong>Africa</strong>n port facilities are <strong>of</strong>ten <strong>in</strong>efficient <strong>and</strong> shipp<strong>in</strong>g unreliable, while thepoor state <strong>of</strong> national road networks contributes to high <strong>in</strong>ternal transport costs<strong>and</strong> delays. As a major export <strong>in</strong>dustry <strong>in</strong> many <strong>Africa</strong>n countries, the cottonsector should be lobby<strong>in</strong>g hard for improved <strong>in</strong>frastructure. This area may alsobe one where <strong>in</strong>ternational development f<strong>in</strong>ance can assist.<strong>Africa</strong>n sectors are also progress<strong>in</strong>g slowly with the <strong>in</strong>troduction <strong>of</strong> highvolume <strong>in</strong>strument test<strong>in</strong>g <strong>of</strong> l<strong>in</strong>t. Use <strong>of</strong> <strong>in</strong>strument test<strong>in</strong>g on a bale-by-balebasis requires purchas<strong>in</strong>g the expensive equipment, tra<strong>in</strong><strong>in</strong>g scientists, <strong>and</strong>equipp<strong>in</strong>g laboratories to provide reliable results from such equipment under<strong>Africa</strong>n conditions. Introduction <strong>of</strong> this equipment will require <strong>in</strong>creased<strong>in</strong>ternational technical assistance beyond current levels.With regard to market<strong>in</strong>g practice at firm level, cotton g<strong>in</strong>n<strong>in</strong>g companiesaffiliated with <strong>in</strong>ternational merchants (referred to <strong>in</strong> this book as “affiliated g<strong>in</strong>ners”)have better access to market <strong>in</strong>formation <strong>and</strong> also benefit from hedg<strong>in</strong>g166 LABASTE, POULTON, AND TSCHIRLEY
aga<strong>in</strong>st price <strong>and</strong> exchange rate risks covered by their parent companies. Among<strong>in</strong>dependent g<strong>in</strong>ners, larger firms such as the parastatal companies <strong>of</strong> WCA, <strong>and</strong>COTTCO <strong>in</strong> Zimbabwe, are better placed than smaller, <strong>of</strong>ten also newer, rivals to<strong>of</strong>fer large volumes <strong>of</strong> particular quality l<strong>in</strong>t or year-round sales, or both. Theyshould also possess greater accumulated knowledge <strong>of</strong> <strong>in</strong>ternational markets <strong>and</strong>be better placed to barga<strong>in</strong> with <strong>in</strong>ternational merchants. 87Many options exist for <strong>in</strong>dependent g<strong>in</strong>ners <strong>in</strong> SSA to improve market<strong>in</strong>gperformance. Forward sales, the most common market<strong>in</strong>g method <strong>in</strong> the cottonbus<strong>in</strong>ess, are the easiest <strong>and</strong> most effective market<strong>in</strong>g strategy to coverrisks. The flexibility <strong>and</strong> effectiveness <strong>of</strong> such sales can be enhanced if they aresupplemented by the use <strong>of</strong> market <strong>in</strong>struments such as futures <strong>and</strong> options.The application <strong>of</strong> these <strong>in</strong>struments can be specified <strong>in</strong> the physical contractarrangements with merchants. G<strong>in</strong>ners can also spread their risks by committ<strong>in</strong>gportions <strong>of</strong> the total production to different market<strong>in</strong>g options: cash salesafter g<strong>in</strong>n<strong>in</strong>g <strong>and</strong> other options requir<strong>in</strong>g commitment before harvest, forwardsales at fixed price, “on call” at price-to-be-fixed contracts, <strong>and</strong> m<strong>in</strong>imumguaranteed price contracts. Direct sales from g<strong>in</strong>ners to sp<strong>in</strong>ners throughcommissioned agents can save the cost <strong>of</strong> <strong>in</strong>termediation by merchants whileimprov<strong>in</strong>g the quantity <strong>and</strong> quality <strong>of</strong> market knowledge available to the g<strong>in</strong>ners.A f<strong>in</strong>al potential tool for improv<strong>in</strong>g the market<strong>in</strong>g <strong>of</strong> <strong>Africa</strong>n cotton iselectronic trad<strong>in</strong>g. E-trade platforms can be a very effective means <strong>of</strong> transparentprice discovery brought about by real-time multilateral bids <strong>and</strong> <strong>of</strong>fers,<strong>and</strong> onl<strong>in</strong>e contract<strong>in</strong>g can reduce transaction costs.To realize improvements such as those recommended above, <strong>in</strong>dependentg<strong>in</strong>ners <strong>in</strong> SSA need to be <strong>in</strong>formed <strong>and</strong> tra<strong>in</strong>ed to better underst<strong>and</strong> theworld cotton market <strong>and</strong> prices, to master cotton trade rules <strong>and</strong> regulations,<strong>and</strong> to underst<strong>and</strong> how to use risk management techniques that are based onfutures <strong>and</strong> options contracts. There is a potential role for <strong>in</strong>ternationalorganizations <strong>in</strong> this area.F<strong>in</strong>ally, stronger farmer organizations can also work to the advantage <strong>of</strong>the sector if it allows more systematic contractual trade relationships betweenfarmers <strong>and</strong> g<strong>in</strong>ners. Examples could <strong>in</strong>clude more formalized contractfarm<strong>in</strong>g relationships than currently exist, with such contracts specify<strong>in</strong>g predeterm<strong>in</strong>edvolumes <strong>of</strong> seed cotton to trade <strong>and</strong> with precise quality specifications.Stronger farmer organizations might also be better <strong>in</strong>formed aboutworld markets <strong>and</strong> be better able to negotiate a pric<strong>in</strong>g approach that is tiedto world prices, <strong>in</strong>clud<strong>in</strong>g recognition <strong>of</strong> world market premiums for quality.Considerable <strong>in</strong>stitutional strengthen<strong>in</strong>g <strong>and</strong> tra<strong>in</strong><strong>in</strong>g will be required first tore<strong>in</strong>force producer organizations.Valorization <strong>of</strong> Seed <strong>Cotton</strong> By-ProductsAs emphasized <strong>in</strong> previous chapters, the performance <strong>of</strong> the oil <strong>and</strong> cake sectors(which affects the price that g<strong>in</strong>ners receive for their seed <strong>and</strong>, ultimately, theCONCLUSIONS 167
price that farmers might receive for their seed cotton) requires more attentionthan it has received so far. Internationally, these markets are chang<strong>in</strong>g fast as aresult <strong>of</strong> the <strong>in</strong>creased dem<strong>and</strong> for edible oil <strong>and</strong> animal feed related to competitivepressures on alternative uses <strong>of</strong> cereals <strong>and</strong> raw materials for bi<strong>of</strong>uelproduction. Meanwhile, <strong>in</strong>tra-<strong>Africa</strong> <strong>and</strong> <strong>in</strong>ternational comparisons <strong>in</strong>dicatethat some WCA sectors, <strong>in</strong> particular, receive very low prices for their seed,although others do much better. Improv<strong>in</strong>g the valorization <strong>of</strong> cotton seed hasa number <strong>of</strong> important policy implications <strong>and</strong> can take different forms:■■Movement toward open <strong>and</strong> transparent oil markets may br<strong>in</strong>g about betterprices for the seeds <strong>and</strong> better outcomes through <strong>in</strong>creased competition(such as improved <strong>in</strong>vestment climate, selection <strong>of</strong> pr<strong>of</strong>essional<strong>in</strong>vestors, stronger enforcement <strong>of</strong> the rules <strong>and</strong> regulations on importedoil, <strong>and</strong> so forth).Focused efforts to develop strategies with stakeholders for cottonseed oil<strong>and</strong> cake are also important. Despite the economic weight <strong>and</strong> strategicimportance <strong>of</strong> these activities, few countries have developed a strategy forcotton seed <strong>in</strong>dustries; this is an area donors might want to consider support<strong>in</strong>gat the domestic, subregional, <strong>and</strong> <strong>in</strong>ternational market levels.Improv<strong>in</strong>g the Productivity <strong>and</strong> Competitiveness <strong>of</strong> <strong>Cotton</strong>Production <strong>in</strong> <strong>Africa</strong>Bridg<strong>in</strong>g productivity <strong>and</strong> competitiveness gaps is also critical for strengthen<strong>in</strong>g<strong>Africa</strong>n cotton sectors. The ma<strong>in</strong> areas <strong>of</strong> focus for these efforts areproductivity at the farm level <strong>and</strong> efficiency <strong>of</strong> g<strong>in</strong>n<strong>in</strong>g <strong>in</strong>dustries.Productivity <strong>of</strong> <strong>Cotton</strong> Cultivation at Farm LevelIncreas<strong>in</strong>g productivity at farm level is necessary to improve a sector’s overallcompetitiveness <strong>and</strong> to make the cotton crop more pr<strong>of</strong>itable for farmers. Asshown <strong>in</strong> chapter 10, average yields <strong>in</strong> WCA sectors are about at the world ra<strong>in</strong>fedaverage but have stagnated s<strong>in</strong>ce the mid-1980s, while ra<strong>in</strong>fed cotton yields<strong>in</strong> other parts <strong>of</strong> the world have risen rapidly. Average yields <strong>in</strong> ESA countrieshave shown some improvement over time, 88 but they rema<strong>in</strong> much lower <strong>and</strong><strong>in</strong>deed have risen more slowly than the world ra<strong>in</strong>fed average. Delivery <strong>of</strong>high-quality <strong>in</strong>put packages to producers is clearly one requirement if productivityat farm level is to be <strong>in</strong>creased. The analysis <strong>in</strong> this book has shown thatsome sector types (monopolies <strong>and</strong> concentrated sectors) are much better at<strong>in</strong>put delivery than others. However, there are also several areas where <strong>Africa</strong>nsectors exhibit more general weaknesses. These areas, <strong>of</strong>ten l<strong>in</strong>ked to the provision<strong>of</strong> public goods with<strong>in</strong> a sector, are po<strong>in</strong>ts <strong>of</strong> possible external technicalor f<strong>in</strong>ancial <strong>in</strong>tervention.168 LABASTE, POULTON, AND TSCHIRLEY
Improvements <strong>in</strong> the Delivery <strong>of</strong> Extension Services <strong>and</strong> Technical AssistanceThis study has shown that some sector types can provide reasonable, basic extensionservices (cover<strong>in</strong>g simple but fundamental agronomic messages <strong>and</strong> perhapssupport for animal traction <strong>in</strong>vestment) to farmers. Traditional s<strong>in</strong>glechannelsystems, which directly or <strong>in</strong>directly provide extension services to allcotton growers, delivered remarkable results until the mid-1980s. However, suchsystems have s<strong>in</strong>ce exhibited decreas<strong>in</strong>g effectiveness <strong>and</strong> efficiency as the cottoncompanies concerned have grown larger; have not been under any competitivepressure; <strong>and</strong>, <strong>in</strong> some cases, have become more politicized. Concentrated sectors<strong>in</strong> Zambia <strong>and</strong> Zimbabwe have delivered reasonable extension support to farmers,while local monopolies can (but do not necessarily) <strong>in</strong>vest <strong>in</strong> extension. TheZambian example is <strong>in</strong>structive—donor assistance was used to dramaticallyscale-up the level <strong>of</strong> technical support provided by the ma<strong>in</strong> company. 89 In contrast,competitive systems are struggl<strong>in</strong>g to deliver extension services at all. Withcompetitive systems, even the provision <strong>of</strong> basic agronomic messages mayrequire some degree <strong>of</strong> public support (from local governments or donors, ideally<strong>in</strong> conjunction with both the cotton board <strong>and</strong> g<strong>in</strong>ners’ association).In all systems, there are wider issues that the cotton sector alone is unlikelyto be able to address adequately, although it will be a beneficiary when progressis made. Soil fertility management is a long-term challenge with benefits thatextend well beyond cotton. Promotion <strong>of</strong> safe chemical application <strong>and</strong> <strong>in</strong>tegratedpest management are also sufficiently long-term endeavors that they arelikely to suffer from free-rid<strong>in</strong>g by cotton companies, except those <strong>in</strong> securemonopoly arrangements. 90 Local monopoly systems may be the only ones <strong>in</strong>which companies have adequate <strong>in</strong>centives to <strong>in</strong>vest <strong>in</strong> the development <strong>of</strong>locally adapted fertilizer recommendations (a particular issue <strong>in</strong> WCA, giventhe high share <strong>of</strong> gross cotton revenue that is expended on <strong>in</strong>put). In addition,particularly now that former parastatals have been freed from their responsibilitiesto promote broadly based rural development <strong>in</strong> cotton areas, cottoncompanies may f<strong>in</strong>d it too costly to support animal traction <strong>in</strong>vestment byfarmers other than the medium-high perform<strong>in</strong>g ones (who already deliverquantities <strong>of</strong> seed cotton that make them creditworthy <strong>and</strong> able to pay <strong>of</strong>flumpy <strong>in</strong>vestments <strong>in</strong> reasonable time). For poorer farmers, acquisition <strong>of</strong> animaltraction assets is likely to be part <strong>of</strong> a longer-term process <strong>of</strong> asset accumulation(<strong>in</strong>clud<strong>in</strong>g better soil fertility management) <strong>in</strong> which livestock <strong>of</strong>various forms play a central role. This subject l<strong>in</strong>ks to a f<strong>in</strong>al area <strong>in</strong> which cottoncompanies have few, if any, <strong>in</strong>centives to contribute: develop<strong>in</strong>g alternative(agricultural <strong>and</strong> nonagricultural) <strong>in</strong>come-earn<strong>in</strong>g opportunities for households<strong>in</strong> cotton areas that are unlikely to benefit from any <strong>of</strong> the above. In all <strong>of</strong>these areas, some public role beyond the cotton <strong>in</strong>dustry (national extension orlocal government program, with possible donor support) can be envisaged. Inmost <strong>of</strong> these cases, however, work<strong>in</strong>g with the cotton <strong>in</strong>dustry will enhance theefficiency <strong>and</strong> effectiveness <strong>of</strong> the efforts undertaken.CONCLUSIONS 169
Improvements <strong>in</strong> ResearchPublicly funded cotton research <strong>in</strong> <strong>Africa</strong> appears weak but, nevertheless, has avital role to play <strong>in</strong> help<strong>in</strong>g to ensure the competitiveness <strong>and</strong> susta<strong>in</strong>ability <strong>of</strong>the cont<strong>in</strong>ent’s cotton sectors over the long run. This claim is supported bythree arguments. First, many (possibly the majority) <strong>of</strong> <strong>Africa</strong>’s cotton farmersare—<strong>and</strong> will likely rema<strong>in</strong>—too resource-constra<strong>in</strong>ed to close the yield gapwith exist<strong>in</strong>g technology through more effective <strong>and</strong> timely management <strong>of</strong>weed <strong>and</strong> <strong>in</strong>sect pests on both their food <strong>and</strong> cotton crops. Second, if cottonprices cont<strong>in</strong>ue to decl<strong>in</strong>e as a result <strong>of</strong> productivity <strong>in</strong>creases <strong>in</strong> other cottonproduc<strong>in</strong>g areas <strong>of</strong> the world, or real food crop prices <strong>in</strong>crease as a result <strong>of</strong>global dem<strong>and</strong> for plant-based energy feedstocks (a trend that will be aggravatedfurther by migration from rural areas), farmers will f<strong>in</strong>d cotton less <strong>and</strong>less attractive over time with current technology. F<strong>in</strong>ally, soil fertility managementhas become a critical issue <strong>in</strong> several West <strong>Africa</strong>n countries <strong>and</strong> is affect<strong>in</strong>geven the better endowed soils <strong>of</strong> ESA, as evidenced by high levels <strong>of</strong> striga<strong>in</strong>festation. Improved cotton production technology, therefore, needs to beembedded <strong>in</strong> susta<strong>in</strong>able cropp<strong>in</strong>g systems to be socially <strong>and</strong> economicallyviable <strong>in</strong> the long run.Improvements <strong>in</strong> research performance will depend on strengthen<strong>in</strong>g <strong>in</strong>ternal<strong>and</strong> external l<strong>in</strong>ks between researchers <strong>and</strong> other stakeholders. Externall<strong>in</strong>ks across research organizations are necessary to achieve critical mass, giventhe small size <strong>of</strong> <strong>in</strong>dividual national programs, <strong>and</strong> to maximize potentialspillovers among researchers address<strong>in</strong>g common technology constra<strong>in</strong>ts <strong>and</strong>opportunities. Currently, no formal cotton research networks exist <strong>in</strong> ESA, <strong>and</strong>those <strong>in</strong> WCA are <strong>in</strong> urgent need <strong>of</strong> rejuvenation (the West <strong>and</strong> Central <strong>Africa</strong>nCouncil for Agricultural Research <strong>and</strong> Development [CORAF/WECARD orConseil Ouest et Centre <strong>Africa</strong><strong>in</strong> pour la Recherche et le Développement Agricoles],for example). This area is a possible one for donor action. With regardto <strong>in</strong>ternal l<strong>in</strong>ks, irrespective <strong>of</strong> sector type, a high policy priority should be tomove toward greater <strong>in</strong>volvement <strong>of</strong> g<strong>in</strong>ners <strong>and</strong> farmers <strong>in</strong> research management.This approach should <strong>in</strong>stitutionalize stakeholder <strong>in</strong>volvement <strong>in</strong> sett<strong>in</strong>gresearch priorities, <strong>in</strong> monitor<strong>in</strong>g research performance, <strong>and</strong> <strong>in</strong> account<strong>in</strong>g forhow research funds have been used, thereby permitt<strong>in</strong>g greater fund<strong>in</strong>g <strong>of</strong>research efforts by the <strong>in</strong>dustry through either direct contributions or levies.Ideally, it should allow stakeholders, through whatever management regime isput <strong>in</strong> place, to appo<strong>in</strong>t <strong>and</strong> fire researchers <strong>and</strong> to determ<strong>in</strong>e their salary scalesrather than rely<strong>in</strong>g on public sector practices <strong>and</strong> scales.Technology TransferA major technology that is likely to be <strong>of</strong> particular <strong>in</strong>terest to cotton growers<strong>in</strong> <strong>Africa</strong> over the near to medium term is genetically modified cotton. 91 Currently,Bt cotton is by far the most common genetically modified type <strong>and</strong> themost relevant for <strong>Africa</strong>, but additional <strong>in</strong>novations already exist (herbicide170 LABASTE, POULTON, AND TSCHIRLEY
esistant, “stacked” genes), <strong>and</strong> more will certa<strong>in</strong>ly be developed. Bt cotton hasundoubtedly been a major source <strong>of</strong> yield ga<strong>in</strong>s <strong>in</strong> cotton <strong>in</strong> India (much <strong>of</strong> itra<strong>in</strong>fed) s<strong>in</strong>ce 2000. Although there are technical, organizational, <strong>and</strong> publicpolicy challenges that need to be addressed if Bt cotton is to be <strong>in</strong>troduced <strong>in</strong>to<strong>Africa</strong>n cotton systems, there is every reason to believe that Bt cotton varietieswould generate significant productivity ga<strong>in</strong>s <strong>in</strong> <strong>Africa</strong>n countries where pestcontrol is poor <strong>and</strong> that they should be able to reduce marg<strong>in</strong>al productioncosts where chemical <strong>in</strong>put use is higher <strong>and</strong> pest control is more effective. 92The key factor <strong>in</strong>fluenc<strong>in</strong>g pr<strong>of</strong>itability <strong>in</strong> both cases would be the licens<strong>in</strong>g feethat has to be paid for the technology. Among the countries studied here, currentlyonly Burk<strong>in</strong>a Faso has completed test<strong>in</strong>g <strong>of</strong> Bt cotton varieties. (Thecountry is now <strong>in</strong> the negotiation phase with Monsanto over patent issues,<strong>in</strong>clud<strong>in</strong>g licens<strong>in</strong>g fees.) Most <strong>Africa</strong>n countries have yet to beg<strong>in</strong> test<strong>in</strong>g Btcotton varieties to evaluate the potential ga<strong>in</strong>s, <strong>and</strong> some even have a moratoriumon such test<strong>in</strong>g. Clearly, there needs to be a public debate <strong>in</strong> many countries beforeBt cotton can be commercially released. However, there are important technicalsteps to be taken, <strong>in</strong>clud<strong>in</strong>g the development <strong>of</strong> biosafety assessment procedures(where lack<strong>in</strong>g) <strong>and</strong> the equipp<strong>in</strong>g <strong>of</strong> laboratories, plus breed<strong>in</strong>g work to<strong>in</strong>corporate the Bt gene <strong>in</strong>to locally adapted cotton varieties. There may beregional economies <strong>of</strong> scale <strong>in</strong> aspects <strong>of</strong> this work, hence the World Bankbiosafety project now be<strong>in</strong>g implemented <strong>in</strong> several WCA countries; furtherassistance from <strong>in</strong>ternational agencies could be useful <strong>in</strong> this area.Efficiency o f G<strong>in</strong>n<strong>in</strong>g IndustriesThe efficiency <strong>of</strong> g<strong>in</strong>n<strong>in</strong>g <strong>in</strong>dustries is critical to the competitiveness <strong>and</strong> susta<strong>in</strong>ability<strong>of</strong> the sector overall. In competitive <strong>and</strong> concentrated systems, companiesdemonstrate significantly lower operat<strong>in</strong>g <strong>and</strong> overhead costs than <strong>in</strong>monopoly systems. In national or local monopolies, there are too few <strong>in</strong>centivesto improve performance <strong>and</strong> efficiency <strong>of</strong> operations <strong>and</strong> to reduce costs.Achiev<strong>in</strong>g significant productivity ga<strong>in</strong>s at this level may imply structuralchanges well beyond the usual—<strong>and</strong> so far fairly unproductive—pressure puton these monopolies:■■Reduc<strong>in</strong>g the costs <strong>of</strong> g<strong>in</strong>n<strong>in</strong>g <strong>and</strong> other postharvest activities may entailrevisit<strong>in</strong>g policies on (a) the choice <strong>of</strong> technology (for g<strong>in</strong>n<strong>in</strong>g <strong>and</strong> cottonseed process<strong>in</strong>g), (b) the size <strong>of</strong> the <strong>in</strong>dustrial units, (c) the fiscal <strong>in</strong>centivesto m<strong>in</strong>imize <strong>in</strong>vestment costs by allow<strong>in</strong>g secondh<strong>and</strong> equipment to beimported, <strong>and</strong> the (d) pr<strong>of</strong>ile <strong>of</strong> strategic <strong>in</strong>vestors. As mentioned previously,these factors are strongly l<strong>in</strong>ked to the sector’s organizational model.Help<strong>in</strong>g develop real cotton <strong>in</strong>dustry clusters—where related services(ma<strong>in</strong>tenance, transport, f<strong>in</strong>ancial services) <strong>and</strong> <strong>in</strong>put can be procured atcompetitive prices—could also contribute to improv<strong>in</strong>g the performance<strong>and</strong> costs <strong>in</strong> cotton sectors.CONCLUSIONS 171
Improv<strong>in</strong>g Susta<strong>in</strong>ability, Governance, <strong>and</strong> Management<strong>of</strong> <strong>Cotton</strong> <strong>Sectors</strong>The f<strong>in</strong>ancial susta<strong>in</strong>ability <strong>of</strong> cotton sectors is very much l<strong>in</strong>ked to sectororganization. The traditional s<strong>in</strong>gle-channel systems <strong>of</strong> WCA (especiallyBen<strong>in</strong>, Burk<strong>in</strong>a Faso, <strong>and</strong> Mali) have experienced severe <strong>and</strong> recurrent f<strong>in</strong>ancialcrises, as much a result <strong>of</strong> the lack <strong>of</strong> adjustment capacities <strong>of</strong> these systemsas <strong>of</strong> world cotton price fluctuations <strong>and</strong> changes <strong>in</strong> the dollar–euro exchangerate. By contrast, competitive <strong>and</strong> concentrated systems <strong>in</strong> ESA have beenoperat<strong>in</strong>g without requir<strong>in</strong>g public subsidies or creat<strong>in</strong>g fiscal liabilities s<strong>in</strong>cethe liberalization <strong>of</strong> these sectors <strong>in</strong> the early 1990s. In WCA, more realisticprice-sett<strong>in</strong>g mechanisms, improved risk management techniques, <strong>and</strong> newmarket<strong>in</strong>g strategies can help mitigate such f<strong>in</strong>ancial problems <strong>in</strong> the future.However, greater adaptability is also likely to require a change <strong>in</strong> bus<strong>in</strong>ess culture<strong>and</strong> attitudes with<strong>in</strong> the cotton cha<strong>in</strong>, which may come only from greater<strong>in</strong>volvement <strong>of</strong> the private sector through the entry <strong>of</strong> national <strong>and</strong> <strong>in</strong>ternationalpr<strong>of</strong>essional operators with long-term commitments to improv<strong>in</strong>g sectorperformance. Examples <strong>of</strong> areas <strong>in</strong> which bus<strong>in</strong>ess culture <strong>and</strong> attitudes(among companies <strong>and</strong> farmers) could usefully change <strong>in</strong>clude quality control<strong>and</strong> <strong>in</strong>put access, with an evolution from farmers’ rights <strong>and</strong> state provisiontoward commercial transactions. For <strong>in</strong>put access, this change would mean amovement toward differential <strong>in</strong>put access accord<strong>in</strong>g to a farmer’s ability tomake productive use <strong>of</strong> <strong>in</strong>put, <strong>in</strong> contrast to the current st<strong>and</strong>ardized provisionirrespective <strong>of</strong> production capability.Improv<strong>in</strong>g sector management <strong>and</strong> governance should be high on the agenda<strong>of</strong> all <strong>Africa</strong>n cotton sectors, although specific governance needs vary by sectortype. In monopoly systems (<strong>and</strong> perhaps <strong>in</strong> concentrated systems <strong>in</strong> the future)build<strong>in</strong>g <strong>in</strong>terpr<strong>of</strong>essional committees that can effectively <strong>and</strong> wisely performtheir price-sett<strong>in</strong>g <strong>and</strong> other tasks, is a high priority. Specifically <strong>in</strong> local monopolysystems, def<strong>in</strong>ition <strong>and</strong> enforcement <strong>of</strong> clear rules for evaluat<strong>in</strong>g <strong>and</strong>retender<strong>in</strong>g concession areas (that is, not just for allocat<strong>in</strong>g them <strong>in</strong>itially) is akey task. Mozambique’s failure to retender concessions after almost 20 years <strong>of</strong>private sector <strong>in</strong>volvement lies at the root <strong>of</strong> its disappo<strong>in</strong>t<strong>in</strong>g performance <strong>in</strong>many areas. In concentrated systems, similar priority should be attached to thedevelopment <strong>and</strong> implementation <strong>of</strong> licens<strong>in</strong>g criteria that set out clearly thecapabilities <strong>and</strong> conduct required if a firm is to participate <strong>in</strong> the sector. In Zimbabwe,draft regulations <strong>of</strong> this nature have awaited <strong>of</strong>ficial ratification for fouryears. Meanwhile, <strong>in</strong> competitive sectors the need for the government to workwith stakeholders to play a central coord<strong>in</strong>at<strong>in</strong>g role to ensure that farmerscan access <strong>in</strong>put <strong>and</strong> technical advice carries with it the requirement that such arole be performed as efficiently <strong>and</strong> transparently as possible, tak<strong>in</strong>g <strong>in</strong>to accountthe views <strong>of</strong> all ma<strong>in</strong> stakeholder groups. F<strong>in</strong>ally, as already noted, reform <strong>of</strong> themanagement <strong>and</strong> governance <strong>of</strong> research organizations to make them moreresponsive to other stakeholders is a priority <strong>in</strong> almost all sectors.172 LABASTE, POULTON, AND TSCHIRLEY
Just as improved sector management <strong>and</strong> governance are desirable, irrespective<strong>of</strong> sector type, so farmer organizations should be strengthened <strong>in</strong> all sector typesto enable them to play a more effective role <strong>in</strong> sector governance <strong>and</strong> <strong>in</strong> servicedelivery. Strengthen<strong>in</strong>g farmer organizations is an area where donor fund<strong>in</strong>gis particularly needed. States may be reluctant to fund the strengthen<strong>in</strong>g <strong>of</strong>civil society organizations <strong>and</strong>, if they do so, may have an agenda <strong>of</strong> politicalcontrol rather than true capacity build<strong>in</strong>g. In turn, however, donor-controlledprojects may not be the best vehicle for capacity-build<strong>in</strong>g activities. Instead,program implementation could be contracted out to nongovernmentalorganizations with proven track records <strong>in</strong> support<strong>in</strong>g farmer organizations.Reflect<strong>in</strong>g on Investor Pr<strong>of</strong>iles: Global <strong>and</strong> Local ChampionsA f<strong>in</strong>al issue <strong>of</strong> concern to policy makers <strong>in</strong> all sectors—<strong>and</strong> one that <strong>in</strong>tersectswith several <strong>of</strong> the po<strong>in</strong>ts raised above—is the type <strong>of</strong> firms that should beencouraged to <strong>in</strong>vest <strong>in</strong> the <strong>in</strong>dustry. 93 Large firms have a number <strong>of</strong> advantagesover small rivals. They have more resources to <strong>in</strong>vest <strong>in</strong> preharvest serviceprovision <strong>and</strong> can afford to hire specialist technical expertise <strong>in</strong> critical areas(for example, agronomy, g<strong>in</strong>nery management, l<strong>in</strong>t market<strong>in</strong>g) because thereare economies <strong>of</strong> scale <strong>in</strong> us<strong>in</strong>g such knowledge with<strong>in</strong> organizations. Whenlarger volumes <strong>of</strong> l<strong>in</strong>t are produced, the opportunities for forward contract<strong>in</strong>g,year-round sales, <strong>and</strong> large consignments <strong>in</strong>crease, as does barga<strong>in</strong><strong>in</strong>g powerwith <strong>in</strong>ternational merchants. If the large firm is itself affiliated with an <strong>in</strong>ternationalmerchant, additional benefits flow from the unrivalled access to market<strong>in</strong>formation <strong>and</strong> a pool <strong>of</strong> technical expertise, <strong>and</strong> from the price <strong>and</strong>exchange rate hedg<strong>in</strong>g that such merchants undertake.Investment by <strong>in</strong>ternational merchants <strong>in</strong> a national cotton sector is generally,therefore, a good th<strong>in</strong>g. Compare the performance <strong>of</strong> the newer concessionareas <strong>in</strong> Mozambique (many taken by affiliated g<strong>in</strong>ners) with that <strong>of</strong> the earlierconcessions, or witness the lead<strong>in</strong>g role played by Dunavant <strong>in</strong> promot<strong>in</strong>gthe Zambian sector. However, this approach does not mean that countries needto depend entirely on such firms to drive sectoral development. In Zimbabwe,COTTCO provides an excellent example <strong>of</strong> a national champion that has ma<strong>in</strong>ta<strong>in</strong>eda dom<strong>in</strong>ant position with<strong>in</strong> the cotton sector <strong>in</strong> the face <strong>of</strong> <strong>in</strong>ternationalcompetition <strong>and</strong>, but for the recent economic crisis <strong>in</strong> Zimbabwe, would probablyhave established itself as a major force <strong>in</strong> Ug<strong>and</strong>a <strong>and</strong> Mozambique.Arguably the key to COTTCO’s success has been its comb<strong>in</strong>ation <strong>of</strong> accumulatedtechnical expertise from its highly competent parastatal predecessor <strong>and</strong> theprivate sector entrepreneurship <strong>and</strong> management unleashed by privatization.In Burk<strong>in</strong>a Faso <strong>and</strong> perhaps <strong>in</strong> other WCA sectors, wise privatization <strong>of</strong> thecurrent parastatal cotton companies (probably comb<strong>in</strong>ed with break<strong>in</strong>g themup <strong>in</strong>to more manageable units, as occurred <strong>in</strong> Zambia when L<strong>in</strong>tco was privatized)would produce similar national champions. Hav<strong>in</strong>g such firms compet<strong>in</strong>gwith <strong>in</strong>ternational merchants <strong>in</strong> domestic markets—<strong>and</strong> perhaps, <strong>in</strong>CONCLUSIONS 173
due course, <strong>in</strong> regional markets—will <strong>in</strong>crease the political acceptability <strong>of</strong> sectorreform <strong>and</strong> will also provide some guarantee <strong>of</strong> long-term commitment todevelopment <strong>of</strong> the national <strong>in</strong>dustry.This approach then leaves the question: is there any role for smaller firms <strong>in</strong>a high-perform<strong>in</strong>g cotton sector? Tanzania’s sector will cont<strong>in</strong>ue to be based onsuch small firms for the foreseeable future. However, even <strong>in</strong> concentrated sectors<strong>and</strong> perhaps <strong>in</strong> local monopolies (if there are one or two small concessionareas), small firms can use their lower overhead to keep big firms focus<strong>in</strong>g ontheir own efficiency <strong>and</strong> on pay<strong>in</strong>g reasonable prices to farmers. Moreover,small firms are the only feasible entry po<strong>in</strong>t for <strong>in</strong>novative local entrepreneurswho wish to enter the cotton <strong>in</strong>dustry <strong>and</strong> have to start somewhere. A key lessonfrom this study, however, is that such firms must be made to adhere tostrict codes <strong>of</strong> conduct if their presence with<strong>in</strong> a sector is to do more goodthan harm.WAYS FORWARD FOR PARTICULAR SECTOR TYPESAlthough there are some common challenges across <strong>Africa</strong>n cotton sectors,many challenges are more acute <strong>in</strong> some sector types than others. Moreover,the appropriate response to most challenges will depend heavily on the type <strong>of</strong>sector <strong>in</strong> question. Thus, this f<strong>in</strong>al section considers the key challenges <strong>and</strong>opportunities fac<strong>in</strong>g each <strong>of</strong> the ma<strong>in</strong> sectoral types. Some reflections onfuture trajectories for cotton sector organization <strong>in</strong> <strong>Africa</strong> are given as a preface.Future Trajectories for <strong>Cotton</strong> Sector <strong>Organization</strong> <strong>in</strong> <strong>Africa</strong>The typology presented <strong>in</strong> this book <strong>of</strong>fers a strong <strong>and</strong> reliable framework toprovide <strong>in</strong>sights <strong>in</strong>to possible evolutionary paths <strong>of</strong> <strong>Africa</strong>n cotton sectors <strong>and</strong>to guide decision makers on the possible paths <strong>of</strong> future reform. In the shortto medium term, the most likely change with<strong>in</strong> <strong>Africa</strong>n cotton systems is an<strong>in</strong>crease <strong>in</strong> the number <strong>of</strong> local monopoly systems <strong>in</strong> WCA. However, localmonopolies should be a transition phase toward market-based sector typessuch as concentrated <strong>and</strong> competitive systems. If so, the most desirable endtype is probably a concentrated system, which has a wide range <strong>of</strong> desirableproperties if regulatory challenges can be overcome to make them more stable.For example, if clear licens<strong>in</strong>g rules can be developed, total regulatory costsunder a concentrated system may be lower than with local monopolies, 94 while<strong>in</strong>centives for cost reduction are greater. Assum<strong>in</strong>g that appropriate regulatorymodels can be developed, the strength <strong>of</strong> farmer associations <strong>in</strong> WCA (relativeto most countries <strong>of</strong> ESA) could mean that the local monopoly stage could bea reasonably short one. 95 However, additional attention must still be paid toeducat<strong>in</strong>g farmer associations about the realities <strong>of</strong> the world cotton market<strong>and</strong> to <strong>in</strong>creas<strong>in</strong>g their operational capacities.174 LABASTE, POULTON, AND TSCHIRLEY
More-competitive systems are perhaps the long-term future. However, thereis a need for stronger farmer associations to take over some critical functions(for example, extension) <strong>and</strong> for improvements <strong>in</strong> rural <strong>in</strong>put <strong>and</strong> f<strong>in</strong>ancialmarkets before competitive systems can support genu<strong>in</strong>ely high-perform<strong>in</strong>gcotton sectors <strong>in</strong> most countries. For the foreseeable future, competitive systemswill have a hard time <strong>in</strong>creas<strong>in</strong>g productivity <strong>and</strong> quality to such anextent that they make a major contribution to reduc<strong>in</strong>g poverty. Therefore,stakeholders, policy makers, <strong>and</strong> donors cannot avoid deal<strong>in</strong>g with the details<strong>of</strong> <strong>in</strong>stitutional design to cope with <strong>in</strong>put <strong>and</strong> credit market failures. Thisdesign needs to be tailored to the current market structure <strong>and</strong> historical patterns<strong>of</strong> the country <strong>in</strong> question.Overall, one may expect some degree <strong>of</strong> convergence <strong>in</strong> the forms <strong>of</strong> cottonsector organization seen <strong>in</strong> SSA over the next decade, with emphasis on adegree <strong>of</strong> private sector competition, an important role for farmer associations,<strong>and</strong> a multistakeholder approach to sector regulation. This convergenceshould be accompanied by policies <strong>and</strong> programs aim<strong>in</strong>g, across sector types,at (a) improv<strong>in</strong>g the quality <strong>and</strong> market<strong>in</strong>g <strong>of</strong> cotton l<strong>in</strong>t, (b) reform<strong>in</strong>g <strong>and</strong>improv<strong>in</strong>g research <strong>and</strong> research-extension l<strong>in</strong>kages to close the productivitygap, <strong>and</strong> (c) strengthen<strong>in</strong>g <strong>in</strong>stitutional capacity at all levels. Effective strategiesfor <strong>Africa</strong>n cotton sectors should, therefore, comb<strong>in</strong>e the necessary <strong>in</strong>stitutionalreforms—given that this book has demonstrated a generally positiveresponse to reforms so far—with a set <strong>of</strong> other coord<strong>in</strong>ated actions (withdonor support) to “raise the game” on some critical issues that are to be h<strong>and</strong>ledat national <strong>and</strong> regional levels, such as technology, soil conservation, ortechnical support to farmers <strong>and</strong> farmer organizations.National <strong>and</strong> Local MonopoliesAs suggested <strong>in</strong> the typology, change <strong>in</strong> national monopolies depends on policychoice. Cameroon, with relatively good performance to date, is an example <strong>of</strong> acountry that may be able to ma<strong>in</strong>ta<strong>in</strong> its national monopoly to good effect, aslong as it reforms its price-sett<strong>in</strong>g process. The creep<strong>in</strong>g <strong>in</strong>efficiencies identified<strong>in</strong> this book, however, seem likely to force change even <strong>in</strong> Cameroon at somepo<strong>in</strong>t. History <strong>and</strong> accumulated experience <strong>in</strong> WCA (path dependency) suggestthat <strong>in</strong>itial change <strong>in</strong> the region will predom<strong>in</strong>antly be toward local monopolies,<strong>and</strong> recent policy decisions <strong>in</strong> Burk<strong>in</strong>a Faso <strong>and</strong> Mali support this conclusion. Inthe context <strong>of</strong> a possible cont<strong>in</strong>ued high dollar–euro exchange rate, the biggestchallenges <strong>in</strong> these sectors <strong>in</strong>clude (a) improv<strong>in</strong>g cost effectiveness <strong>of</strong> the cottoncompanies, tackl<strong>in</strong>g stagnant productivity at farm level, (b) rais<strong>in</strong>g quality, (c)develop<strong>in</strong>g pric<strong>in</strong>g formulas that make price sett<strong>in</strong>g more connected <strong>and</strong>responsive to world market prices, <strong>and</strong> (d) identify<strong>in</strong>g ways for cotton companiesto improve management <strong>of</strong> the <strong>in</strong>traseasonal price risk that they <strong>in</strong>curbecause <strong>of</strong> the panterritorial, panseasonal, price-sett<strong>in</strong>g mechanism. What, then,must these countries do to tackle such problems <strong>in</strong> a local monopoly sett<strong>in</strong>g?CONCLUSIONS 175
To beg<strong>in</strong> to answer that question, one could turn to the experience <strong>of</strong>Mozambique, which has shown that performance under such systems can bequite poor. Yet this country is probably an <strong>in</strong>ferior predictor <strong>of</strong> the performance<strong>of</strong> the WCA systems for several reasons. First, Mozambique at the time<strong>of</strong> reform had almost none <strong>of</strong> WCA’s history <strong>of</strong> substantial farm-level <strong>in</strong>putuse, <strong>in</strong>vestment <strong>in</strong> animal traction, technical advice to farmers, <strong>and</strong> regular release<strong>of</strong> new varieties. WCA thus starts at a much higher level than Mozambique <strong>and</strong>needs to resume productivity growth rather than start it from zero. Second, the<strong>in</strong>terpr<strong>of</strong>essional approach to sector coord<strong>in</strong>ation that has emerged <strong>in</strong> mostWCA countries provides much greater promise <strong>of</strong> consensual sector managementthan has been observed until recently <strong>in</strong> Mozambique. F<strong>in</strong>ally, <strong>and</strong>related to the last po<strong>in</strong>t, farmer organizations are more developed <strong>in</strong> WCA than<strong>in</strong> Mozambique, though their technical capacities rema<strong>in</strong> uneven <strong>and</strong> requirefurther strengthen<strong>in</strong>g.Recent positive developments <strong>in</strong> new concession areas <strong>of</strong> Mozambique dohold a lesson for WCA. First, private sector capital <strong>and</strong> management must havea prom<strong>in</strong>ent role <strong>in</strong> the reformed sectors. Second, not all private capital willperform well. Policy makers need to choose private <strong>in</strong>vestors carefully to ensurethat they have the technical <strong>and</strong> managerial knowledge, long-term commitment,<strong>and</strong> f<strong>in</strong>ancial capacity to deliver high-quality services to farmers.If WCA countries do move to local monopoly arrangements, key factorsthey need to take <strong>in</strong>to account <strong>in</strong>clude the follow<strong>in</strong>g:■■■Cost reduction from farm gate to FOT needs to be a top priority. To reducecosts, private companies need a greater role <strong>in</strong> price sett<strong>in</strong>g <strong>and</strong> other decisionmak<strong>in</strong>g than they have so far been given <strong>in</strong> Burk<strong>in</strong>a Faso. The fact thatSOFITEX controls 85 percent <strong>of</strong> the market, comb<strong>in</strong>ed with its apparentlys<strong>of</strong>t budget constra<strong>in</strong>t <strong>and</strong> the sectorwide price-sett<strong>in</strong>g mechanism, has donelittle if anyth<strong>in</strong>g to spur sectorwide cost reductions. If the government is toma<strong>in</strong>ta<strong>in</strong> a role <strong>in</strong> a cotton company, it must do so at a substantially lowermarket share.If concession zones are to be auctioned, care must be taken to avoid salesprices so high that they make it difficult for the new companies to compete.In Burk<strong>in</strong>a Faso, high auction prices may have underm<strong>in</strong>ed the new companies’ability to compete with SOFITEX <strong>in</strong> a context <strong>of</strong> decl<strong>in</strong><strong>in</strong>g worldprices for l<strong>in</strong>t <strong>and</strong> overvaluation <strong>of</strong> the currency.Price sett<strong>in</strong>g needs to occur <strong>in</strong> a framework <strong>of</strong> negotiation, but rules mustcont<strong>in</strong>ue to be reformed to provide reasonable assurance to companies that,if they operate efficiently accord<strong>in</strong>g to <strong>in</strong>ternational st<strong>and</strong>ards, they will beable to earn a reasonable return on their <strong>in</strong>vestment over time. Some level<strong>of</strong> price flexibility over the course <strong>of</strong> the market<strong>in</strong>g season may need to be apart <strong>of</strong> the revised pric<strong>in</strong>g approaches. <strong>Cotton</strong> companies need to recognize<strong>and</strong> improve the management <strong>of</strong> their exposure to cotton price <strong>and</strong> exchangerate volatility.176 LABASTE, POULTON, AND TSCHIRLEY
■■■■Interpr<strong>of</strong>essional committees <strong>and</strong> farmer organizations need to cont<strong>in</strong>ue tobe developed, with special emphasis on the operational abilities <strong>of</strong> the latter.Reforms <strong>in</strong> research organizations cont<strong>in</strong>ue to be needed to make sure thatthey are responsive to these <strong>in</strong>terpr<strong>of</strong>essional committees.Clear rules for evaluat<strong>in</strong>g <strong>and</strong> retender<strong>in</strong>g concession areas need to bedeveloped, as this lack has been a key failure <strong>in</strong> Mozambique.To create more competition, <strong>in</strong>vestment <strong>and</strong> structural reforms <strong>in</strong> thecottonseed oil sector should be encouraged.Three f<strong>in</strong>d<strong>in</strong>gs from this research are especially relevant if WCA countries<strong>in</strong>stead consider mov<strong>in</strong>g to a concentrated, market-based system. First, thesystems <strong>in</strong> Zimbabwe <strong>and</strong> Zambia have suffered periodic bouts <strong>of</strong> <strong>in</strong>stability.Zimbabwe, <strong>in</strong> particular, appears to have crossed a tipp<strong>in</strong>g po<strong>in</strong>t s<strong>in</strong>ce 2001,whereby the entry <strong>of</strong> additional g<strong>in</strong>n<strong>in</strong>g companies has underm<strong>in</strong>ed exist<strong>in</strong>gmechanisms for coord<strong>in</strong>ation <strong>of</strong> <strong>in</strong>put supply, extension, <strong>and</strong> quality control.Regulation <strong>of</strong> concentrated systems is thus a key challenge (see next). Second,WCA’s agro-ecological conditions (especially the low fertility <strong>of</strong> its soils) suggestthat a competitive sector (which could be the outcome <strong>of</strong> <strong>in</strong>stability with<strong>in</strong> aconcentrated sector) may perform quite poorly unless farmer organizationsthemselves are strong enough to ensure broadly based access to <strong>in</strong>puts. F<strong>in</strong>ally,though farmer organizations <strong>in</strong> most WCA countries are much stronger than<strong>in</strong> ESA countries, few if any appear strong enough to take on this challenge <strong>in</strong>the near future. Mov<strong>in</strong>g to a fully privatized market that allows competitionamong companies, even if the market is <strong>in</strong>itially very concentrated, is thus arisky proposition for WCA countries. If <strong>in</strong>stead these sectors can use the localmonopoly approach to build up the operational capacity <strong>of</strong> farmer organizations<strong>and</strong> to develop sound regulatory mechanisms, concentrated <strong>and</strong> eventuallycompetitive systems could perform well.Meanwhile, the key challenge <strong>in</strong> Mozambique’s local monopoly sector is tocreate <strong>in</strong>centives for good company performance with<strong>in</strong> the concessions. In theabsence <strong>of</strong> strong farmer associations, these <strong>in</strong>centives have to come fromsome comb<strong>in</strong>ation <strong>of</strong> improved rules govern<strong>in</strong>g tender<strong>in</strong>g <strong>and</strong> re-tender<strong>in</strong>gconcessions, procedures for monitor<strong>in</strong>g performance <strong>of</strong> concessionaires, <strong>and</strong>careful selection <strong>of</strong> companies. It appears that Mozambique has done a goodjob on the latter, with newer companies clearly outperform<strong>in</strong>g orig<strong>in</strong>al concessionholders; the country is also develop<strong>in</strong>g serious proposals for evaluat<strong>in</strong>g<strong>and</strong> reaward<strong>in</strong>g concession areas. Prices to farmers rema<strong>in</strong> very low, however,<strong>and</strong> are unlikely to improve without improved regulation.Concentrated <strong>Sectors</strong>Change <strong>in</strong> concentrated sectors is likely to be driven less by policy choice thanby <strong>in</strong>herent characteristics <strong>of</strong> these systems. Because <strong>in</strong>vestment <strong>in</strong> g<strong>in</strong>n<strong>in</strong>gcapacity is not prohibitively expensive—especially where <strong>in</strong>vestors are familiarCONCLUSIONS 177
with roller g<strong>in</strong> technology—concentrated systems can move—over fairly shortperiods—toward more competitive systems. Such a development may eventuallyimprove prices to farmers, but it can also have negative implications forcredit repayment (<strong>and</strong>, therefore, future <strong>in</strong>put credit provision) <strong>and</strong> quality.Zimbabwe has seen problems <strong>in</strong> both areas s<strong>in</strong>ce 2003, while Zambia’s problems<strong>in</strong> 2006/07 affected credit repayment <strong>and</strong> provision, but the problems aretoo recent to have had observable effects on quality. In both cases, new entrantshave so far been too small to exert much price pressure on exist<strong>in</strong>g companies.Indeed, the biggest danger with such new entry is that <strong>in</strong>creased competitionunderm<strong>in</strong>es <strong>in</strong>put credit <strong>and</strong> l<strong>in</strong>t quality well before it has any positive effecton prices paid to farmers.The key challenge for concentrated sectors, therefore, is to develop a flexible<strong>and</strong> commercially supportive regulatory regime that underst<strong>and</strong>s the strengths<strong>and</strong> weaknesses <strong>of</strong> the concentrated model:■■■Concentrated sectors need clear <strong>and</strong> transparent barriers to entry (licens<strong>in</strong>grules that specify strict capabilities <strong>and</strong> conduct <strong>of</strong> firms wish<strong>in</strong>g to participate<strong>in</strong> the sector) to defend the ability <strong>of</strong> firms with<strong>in</strong> the sector to coord<strong>in</strong>ate on<strong>in</strong>put supply, extension, quality control, <strong>and</strong> perhaps other matters.Concentrated sectors must reta<strong>in</strong> some contestability to provide <strong>in</strong>cumbentswith an <strong>in</strong>centive to ma<strong>in</strong>ta<strong>in</strong> attractive seed cotton prices. As <strong>in</strong> thecase <strong>of</strong> local monopolies, it is important for those <strong>in</strong> charge <strong>of</strong> policy for thesector to form a clear idea <strong>of</strong> the type <strong>of</strong> company that they wish to allow<strong>in</strong>to the sector, so as to be able to formulate rules accord<strong>in</strong>gly. Given the tendency<strong>of</strong> these sectors to slide toward unrestra<strong>in</strong>ed competition <strong>and</strong> creditdefault crises, a strong commitment to rais<strong>in</strong>g farmer productivity <strong>and</strong>improv<strong>in</strong>g quality with<strong>in</strong> the cha<strong>in</strong> should be given high priority <strong>in</strong> theselection criteria.However, given the problems <strong>of</strong> rely<strong>in</strong>g entirely on the threat <strong>of</strong> entry to discipl<strong>in</strong>e<strong>in</strong>cumbent firms with<strong>in</strong> concentrated sectors, it may also be desirableto develop price-sett<strong>in</strong>g mechanisms that are more formalized than theprice leadership that has prevailed <strong>in</strong> concentrated systems thus far. Aspiloted <strong>in</strong> WCA sectors, farmer organizations have a potentially importantrole to play with<strong>in</strong> such mechanisms. However, but this role needs to be<strong>in</strong>formed by a solid underst<strong>and</strong><strong>in</strong>g <strong>of</strong> world markets to avoid the problemsseen <strong>in</strong> WCA.Competitive <strong>Sectors</strong>As could be expected, there are fewer concerns over pric<strong>in</strong>g with<strong>in</strong> competitivesectors than <strong>in</strong> other sector types. Instead, the weaknesses are <strong>in</strong> servicedelivery <strong>and</strong> quality control. Given the pervasive failures <strong>in</strong> credit <strong>and</strong> <strong>in</strong>putmarkets <strong>in</strong> rural <strong>Africa</strong>, the typology suggested that competitive sectors mayface pressure to move toward more coord<strong>in</strong>ated sectors <strong>and</strong> that, if movement178 LABASTE, POULTON, AND TSCHIRLEY
were to occur, it would most likely be toward a local monopoly or hybrid system.Ug<strong>and</strong>a began experiment<strong>in</strong>g with solutions to <strong>in</strong>put <strong>and</strong> seasonalf<strong>in</strong>ance market problems nearly as soon as it emerged from reform with about30 active g<strong>in</strong>ners. In 2003, it moved to a hybrid sector model that <strong>in</strong>cludedzon<strong>in</strong>g <strong>and</strong> seed cotton quotas, as a way <strong>of</strong> provid<strong>in</strong>g <strong>in</strong>centives for <strong>in</strong>vestment<strong>in</strong> <strong>in</strong>put supply. However, this model has also encountered problems<strong>and</strong> has been suspended for the 2007/08 season. By contrast, Tanzania hasdeveloped an approach to <strong>in</strong>put supply that features an important role for thegovernment, but it has always <strong>in</strong>corporated arrangements that allow it to preservethe strong competition among firms <strong>in</strong> the market for seed cotton. 96Key <strong>in</strong>sights from this work regard<strong>in</strong>g competitive systems <strong>in</strong>clude thefollow<strong>in</strong>g:■■Such coord<strong>in</strong>ation as does occur with<strong>in</strong> a competitive sector must comefrom some central body. Given the difficulty <strong>of</strong> obta<strong>in</strong><strong>in</strong>g consensus amonglarge numbers <strong>of</strong> compet<strong>in</strong>g g<strong>in</strong>ners, the state is likely to have to play a keyrole with<strong>in</strong> this body. This state is <strong>in</strong> contrast to local monopoly or concentratedsystems, where <strong>in</strong>terpr<strong>of</strong>essional committees dom<strong>in</strong>ated by g<strong>in</strong>ners<strong>and</strong> farmers have more potential to adequately manage the sector. The riskwith allow<strong>in</strong>g a state agency to play such a central role is that it can makemistakes, even if well <strong>in</strong>tentioned, <strong>and</strong> it could do worse if rent-seek<strong>in</strong>g orother motivations prevail. Thus, the accountability <strong>of</strong> regulatory bodies tog<strong>in</strong>ners <strong>and</strong> farmers needs to be strengthened.Incentives with<strong>in</strong> competitive sectors for <strong>in</strong>dividual g<strong>in</strong>ners to supportlong-term programs, such as <strong>in</strong>itiatives to enhance soil fertility or to promoteanimal traction, are extremely limited. Thus, the cotton board <strong>and</strong> theg<strong>in</strong>ners’ association may have to work with other actors (local governmentor donors, for <strong>in</strong>stance) to develop programs that enhance the asset base <strong>of</strong>farmers <strong>and</strong> also generate benefits beyond the cotton sector. In the sameway, they could possibly explore seasonal f<strong>in</strong>anc<strong>in</strong>g models (for example,Sav<strong>in</strong>gs <strong>and</strong> Credit Cooperatives 97 <strong>in</strong> Tanzania) that, over time, might allowsome farmers to access greater quantities <strong>of</strong> purchased <strong>in</strong>puts for cottonproduction.Ug<strong>and</strong>a’s hybrid approach to solv<strong>in</strong>g the <strong>in</strong>put credit problem <strong>in</strong> competitivesystems kept all g<strong>in</strong>ners <strong>in</strong> the market by grant<strong>in</strong>g them all quotas for outputpurchase. However, after four years, the result<strong>in</strong>g (erratic) improvements<strong>in</strong> service delivery had failed to stimulate an <strong>in</strong>crease <strong>in</strong> total seed cotton production.The ma<strong>in</strong> consequence <strong>of</strong> this measure, therefore, was to entrench thesector’s chronic overcapacity, thereby lead<strong>in</strong>g to operat<strong>in</strong>g costs that weremuch higher than they would otherwise be, especially consider<strong>in</strong>g the heavyuse <strong>of</strong> roller g<strong>in</strong>s <strong>in</strong> the country. Generaliz<strong>in</strong>g, we suggest that hybrid approacheswith<strong>in</strong> competitive sectors need to avoid protect<strong>in</strong>g g<strong>in</strong>ners entirely from competitivepressure from with<strong>in</strong> the country.CONCLUSIONS 179
Tanzania’s agro-ecological <strong>and</strong> population settlement characteristics, whichpermitt expansion <strong>of</strong> “extensive” cotton production, have so far protected itfrom the need to take the type <strong>of</strong> radical measures that Ug<strong>and</strong>a took for <strong>in</strong>putcredit provision. However, if yields beg<strong>in</strong> to fall as a result <strong>of</strong> decl<strong>in</strong><strong>in</strong>g soil fertility(or possibly one day to <strong>in</strong>creas<strong>in</strong>g pest pressure) <strong>and</strong> if it wants to morefully realize its potential, the country may need to consider mov<strong>in</strong>g to a morecoord<strong>in</strong>ated approach.180 LABASTE, POULTON, AND TSCHIRLEY
APPENDIX AStatistical Tables181
182Table A1 Ben<strong>in</strong>SeasonL<strong>in</strong>t production(thous<strong>and</strong> tons)Area (thous<strong>and</strong>hectares)Yield(kg l<strong>in</strong>t/hectare)G<strong>in</strong>n<strong>in</strong>g ratio(%)Grower price(CFA f/kg seedcotton)GDP deflator(2,000 = 1.00)1970/71 14 39 351 38.1 34 0.161971/72 18 55 333 38.4 35 0.161972/73 19 48 396 37.9 35 0.171973/74 17 53 329 38.6 37 0.171974/75 13 49 256 40.5 45 0.201975/76 8 32 248 39.5 45 0.231976/77 7 26 260 38.7 50 0.261977/78 5 21 249 37.7 55 0.271978/79 7 26 275 38.2 55 0.311979/80 10 26 372 37.6 55 0.351980/81 5 30 167 37.8 60 0.381981/82 5 24 228 37.9 80 0.411982/83 12 24 490 37.9 85 0.481983/84 17 40 430 37.4 100 0.501984/85 33 56 597 37.8 100 0.511985/86 34 100 338 38.0 110 0.491986/87 48 103 464 39.0 110 0.471987/88 27 72 380 38.9 100 0.481988/89 44 97 456 40.5 105 0.48
1989/90 43 111 383 40.7 95 0.491990/91 59 123 482 41.2 100 0.501991/92 75 144 518 42.2 100 0.501992/93 69 139 493 42.5 100 0.521993/94 103 235 439 41.9 110 0.531994/95 98 230 426 41.9 140 0.701995/96 141 294 481 40.5 180 0.811996/97 143 292 491 41.2 200 0.861997/98 150 386 389 41.8 200 0.911998/99 138 394 351 41.3 225 0.951999/2000 152 372 409 41.9 185 0.972000/01 141 337 418 41.5 200 1.002001/02 172 357 482 42.1 200 1.032002/03 143 313 457 42.4 185 1.052003/04 142 323 440 42.5 205 1.112004/05 171 325 527 41.8 190 1.082005/06 82 200 408 41.8 185 1.142006/07 103 236 438 42.0 170 —Source: SONAPRA for cotton statistics; International Monetary Fund International F<strong>in</strong>ancial Statistics <strong>and</strong> World Bank estimates for Gross DomesticProduct deflator.Note: CFA f = Communauté Française d’Afrique franc; — = not available; GDP = Gross domestic product.183
184Table A2 Burk<strong>in</strong>a FasoSeasonL<strong>in</strong>t production(thous<strong>and</strong> tons)Area (thous<strong>and</strong>hectares)Yield(kg l<strong>in</strong>t/hectare)G<strong>in</strong>n<strong>in</strong>g ratio(%)Grower price(CFA f/kg seedcotton)GDP deflator(2,000 = 1.00)1970/71 8 81 105 35.9 32 0.201971/72 10 74 141 37.2 32 0.201972/73 12 70 171 36.7 32 0.221973/74 10 67 147 36.8 35 0.221974/75 11 62 184 37.1 40 0.251975/76 18 68 267 35.8 40 0.271976/77 20 79 255 36.6 40 0.281977/78 14 69 202 36.5 55 0.341978/79 22 72 312 37.3 55 0.391979/80 29 82 350 37.0 55 0.421980/81 23 75 311 37.3 55 0.451981/82 22 65 331 37.6 62 0.511982/83 29 72 400 38.1 62 0.561983/84 30 77 392 37.9 70 0.591984/85 34 82 418 39.0 90 0.631985/86 46 94 489 39.8 100 0.661986/87 66 127 520 39.8 100 0.611987/88 59 170 344 39.6 95 0.621988/89 59 171 344 40.3 95 0.64
1989/90 62 150 416 41.0 95 0.671990/91 77 166 465 40.8 95 0.681991/92 69 186 373 41.4 95 0.661992/93 69 177 392 42.4 85 0.661993/94 51 150 339 43.6 115 0.641994/95 63 184 341 43.9 115 0.761995/96 64 170 377 42.4 165 0.821996/97 90 196 460 42.1 180 0.881997/98 140 295 476 41.5 180 0.901998/99 119 355 335 41.8 185 0.971999/2000 109 245 445 42.9 185 0.952000/01 116 260 446 42.0 170 1.002001/02 158 359 440 41.8 200 1.052002/03 170 405 420 42.1 175 1.092003/04 204 459 444 42.2 185 1.112004/05 264 566 467 41.9 210 1.132005/06 298 646 462 41.9 175 1.162006/07 282 716 394 42.0 165 —Source: SOFITEX for cotton statistics; International Monetary Fund; International F<strong>in</strong>ancial Statistics <strong>and</strong> World Bank estimates for gross domestic productdeflator.Note: CFA f = Communauté Française d’Afrique franc; — = not available.185
186Table A3 CameroonSeasonL<strong>in</strong>t production(thous<strong>and</strong> tons)Area (thous<strong>and</strong>hectares)Yield(kg l<strong>in</strong>t/hectare)G<strong>in</strong>n<strong>in</strong>g ratio(%)Grower price(CFA f/kg seedcotton)GDP deflator(2,000 = 1.00)1970/71 14 102 139 36.9 30 0.161971/72 16 99 160 36.6 31 0.171972/73 17 88 191 37.0 38 0.181973/74 10 61 170 37.3 40 0.191974/75 15 65 234 37.7 45 0.211975/76 19 73 261 38.5 45 0.231976/77 18 60 303 38.1 55 0.271977/78 15 48 317 37.8 65 0.291978/79 23 47 495 39.2 65 0.301979/80 31 57 544 38.4 70 0.341980/81 32 65 494 38.2 80 0.381981/82 31 63 486 38.5 90 0.421982/83 29 55 523 39.5 105 0.471983/84 37 71 519 39.0 117 0.531984/85 38 73 522 39.2 130 0.601985/86 46 89 514 39.7 140 0.671986/87 48 94 513 39.5 150 0.671987/88 45 95 476 39.6 140 0.661988/89 69 112 614 41.4 140 0.66
1989/90 43 89 482 41.3 95 0.651990/91 47 94 496 41.1 95 0.661991/92 47 90 524 41.2 95 0.681992/93 53 99 534 41.9 85 0.671993/94 52 103 503 40.9 130 0.691994/95 63 141 445 41.1 155 0.761995/96 79 159 495 40.3 180 0.891996/97 90 191 471 41.2 180 0.941997/98 73 172 425 40.2 190 0.971998/99 78 173 453 40.3 195 0.981999/2000 78 172 455 40.7 165 0.972000/01 96 199 482 41.6 225 1.002001/02 103 211 487 41.6 175 1.032002/03 95 181 526 41.1 180 1.072003/04 100 208 480 41.2 185 1.092004/05 125 215 581 40.8 190 1.092005/06 87 214 405 41.7 150 1.142006/07 77 202 382 42.0 175 —Source: SODECOTON for cotton statistics; International Monetary Fund; International F<strong>in</strong>ancial Statistics <strong>and</strong> World Bank estimates for gross domesticproduct deflator.Note: CFA f = Communauté Française d’Afrique franc; — = not available.187
188Table A4 MaliSeasonL<strong>in</strong>t production(thous<strong>and</strong> tons)Area (thous<strong>and</strong>hectares)Yield (kgl<strong>in</strong>t/hectare)G<strong>in</strong>n<strong>in</strong>g ratio(%)Grower price(CFA f/kg seedcotton)GDP deflator(2,000 = 1.00)1970/71 20 66 303 37.7 25 0.131971/72 25 77 327 37.3 25 0.141972/73 24 77 315 36.8 25 0.151973/74 19 69 273 37.3 25 0.161974/75 23 69 332 37.6 38 0.171975/76 39 89 438 37.9 38 0.201976/77 45 110 412 38.3 38 0.231977/78 42 103 411 37.2 45 0.251978/79 48 118 407 37.7 45 0.271979/80 56 127 441 37.3 58 0.301980/81 41 111 367 37.6 58 0.351981/82 38 85 448 39.5 65 0.391982/83 50 105 474 39.1 65 0.441983/84 54 111 487 38.6 75 0.471984/85 55 119 464 38.4 75 0.531985/86 67 146 460 38.4 85 0.611986/87 79 152 518 39.0 85 0.551987/88 75 149 504 37.7 85 0.561988/89 97 190 511 39.0 85 0.55
1989/90 99 189 521 42.8 85 0.541990/91 115 205 558 41.5 93 0.571991/92 114 215 531 42.0 95 0.581992/93 135 246 547 42.2 95 0.591993/94 101 201 500 41.8 98 0.611994/95 128 270 475 43.7 130 0.781995/96 169 336 504 41.7 155 0.921996/97 190 420 451 41.9 155 0.971997/98 218 498 437 41.9 170 0.981998/99 217 504 431 41.6 185 0.981999/2000 197 482 409 42.8 150 0.952000/01 102 228 447 42.0 170 1.002001/02 240 532 451 42.0 200 1.002002/03 181 449 402 41.1 180 1.162003/04 254 549 464 41.0 200 1.192004/05 240 547 439 40.9 210 1.172005/06 222 551 403 41.5 168 1.202006/07 176 480 355 42.0 165 —Source: Compagnie Malienne de Développement des Fibres Textiles for cotton statistics; International Monetary Fund International F<strong>in</strong>ancial Statistics <strong>and</strong>World Bank estimates for gross domestic product deflator; International <strong>Cotton</strong> Advisory Council.Note: CFA f =Communauté Française d’Afrique franc; — = not available.189
190Table A5 MozambiqueSeasonL<strong>in</strong>t production(thous<strong>and</strong> tons)Area (thous<strong>and</strong>hectares)Yield(kg l<strong>in</strong>t/hectare)G<strong>in</strong>n<strong>in</strong>g ratio(%)Grower price(Mt/kgseed cotton)GDP deflator(2,000 =100.00)1980/81 24 300 78 — — 0.371981/82 18 249 74 — — 0.381982/83 8 110 74 — — 0.451983/84 7 100 74 — — 0.511984/85 1 15 75 — — 0.601985/86 4 48 77 — — 0.791986/87 9 108 80 — — 0.891987/88 7 131 51 — — 2.521988/89 9 108 86 — — 3.731989/90 8 65 123 — — 5.501990/91 14 75 187 33 to 35 320 7.381991/92 12 68 169 33 to 35 479 11.881992/93 15 77 195 33 to 35 700 16.661993/94 16 77 205 33 to 35 1,100 24.731994/95 17 86 202 33 to 35 1,500 38.431995/96 16 244 67 33 to 35 3,900 54.211996/97 25 267 94 33 to 35 3,300 76.22
1997/98 31 327 95 33 to 35 2,950 83.861998/99 36 333 133 33 to 35 2,098 88.141999/2000 12 148 83 33 to 35 2,500 91.122000/01 24 234 104 35 to 38 2,700 100.002001/02 31 222 141 35 to 38 3,000 114.032002/03 19 200 111 35 to 38 3,800 134.212003/04 26 230 115 35 to 40 5,000 142.472004/05 26 230 115 35 to 40 5,000 165.982005/06 25 225 111 35 to 40 5,300 198.462006/07 43 233 185 36 — —Source: International <strong>Cotton</strong> Advisory Council for cotton statistics; International Monetary Fund International F<strong>in</strong>ancial Statistics <strong>and</strong> World Bank estimates forgross domestic product deflator. G<strong>in</strong>n<strong>in</strong>g ratios estimated based on <strong>in</strong>terviews with <strong>Cotton</strong> Institute <strong>and</strong> g<strong>in</strong>ners.Note: Mt = Mozambican metical; — = not available. Increase <strong>in</strong> production start<strong>in</strong>g <strong>in</strong> 2000/01 related to entry <strong>of</strong> new firms.191
192Table A6 TanzaniaSeasonL<strong>in</strong>t production(thous<strong>and</strong> tons)Area (thous<strong>and</strong>hectares)Yield(kg l<strong>in</strong>t/hectare)G<strong>in</strong>n<strong>in</strong>g ratio(%)Grower price(T Sh/kg seedcotton)GDP deflator(2,000 =100.00)1980/81 43 350 123 32 3.7 1.611981/82 40 371 108 31 4.7 1.911982/83 44 446 99 31 6.0 2.361983/84 48 390 123 31 8.4 2.561984/85 31 370 84 29 13.0 2.961985/86 67 400 167 31 16.9 3.791986/87 78 450 173 31 19.5 4.941987/88 54 450 120 29 22.4 5.821988/89 35 260 135 31 28.0 10.331989/90 48 320 150 32 41.0 12.461990/91 85 450 189 32 70.0 15.261991/92 96 430 224 32 60.0 19.551992/93 45 344 131 31 80.0 24.511993/94 40 172 233 32 120.0 30.51
1994/95 82 344 238 33 207.0 40.011995/96 87 283 307 35 170.0 50.761996/97 62 350 177 30 185.0 60.561997/98 36 180 200 34 180.0 73.041998/99 35 250 142 35 175.0 83.421999/2000 41 182 227 33 180.0 93.032000/01 51 430 118 34 185.0 100.002001/02 63 392 161 33 182.0 107.172002/03 50 291 172 36 290.0 114.082003/04 118 459 257 35 250.0 120.492004/05 127 482 264 34 240.0 130.212005/06 72 434 165 35 365.0 137.162006/07 67 410 163 35 — —Source: International <strong>Cotton</strong> Advisory Council for cotton statistics; International Monetary Fund International F<strong>in</strong>ancial Statistics <strong>and</strong> World Bank estimatesfor gross domestic product deflator.Note: T Sh = Tanzania shill<strong>in</strong>g; — = not available.193
194Table A7 Ug<strong>and</strong>aYearL<strong>in</strong>t production(tons)Exchange rate(U sh/US$)World price <strong>of</strong> cottonCotlook A Index for l<strong>in</strong>t,nom<strong>in</strong>alConsumerprice <strong>in</strong>dex (U sh/kg) (US$/kg)Farmgate price forseed cottonNom<strong>in</strong>al(U sh/kg)Real(U sh/kg)1990/91 8,000 481 0.32 895 1.86 340 1,0521991/92 7,000 836 0.41 1,277 1.53 340 8211992/93 9,000 1,190 0.63 1,538 1.29 200 3171993/94 5,000 1,161 0.67 1,598 1.38 300 4481994/95 6,105 941 0.73 1,789 1.90 400 5451995/96 10,437 993 0.80 2,017 2.03 350 4391996/97 20,480 1,049 0.86 1,835 1.75 320 3741997/98 5,920 1,112 0.91 1,879 1.69 404 4421998/99 15,170 1,296 0.91 1,776 1.37 313 3431999/2000 21,645 1,497 0.97 1,718 1.15 253 2602000/01 18,500 1,709 1.00 2,290 1.34 360 3602001/02 22,200 1,749 1.02 1,687 0.96 262 2572002/03 20,350 1,835 1.02 2,033 1.11 476 4682003/04 29,600 1,967 1.10 2,915 1.48 615 5612004/05 46,990 1,762 1.13 2,207 1.25 350 3092005/06 18,981 1,806 1.23 2,262 1.25 400 3252006/07 24,790 1,824 1.31 2,316 1.27 450 3442007/08 27,750 1,710 1.37 2,445 1.43 450 329Sources: <strong>Cotton</strong> Development <strong>Organization</strong> (production <strong>and</strong> farmgate prices); International Monetary Fund (exchange rate <strong>and</strong> consumer price <strong>in</strong>dex); <strong>Cotton</strong>Outlook (Cotlook A Index); <strong>and</strong> authors’ calculations.Note: U sh = Ug<strong>and</strong>a shill<strong>in</strong>g. With the exception <strong>of</strong> consumer price <strong>in</strong>dex, all variables calculated on a crop year basis, April–March.
Table A8 ZambiaSeasonL<strong>in</strong>t production(thous<strong>and</strong> tons)Area (thous<strong>and</strong>hectares)Yield(kg l<strong>in</strong>t/hectare)G<strong>in</strong>n<strong>in</strong>g ratio(%)Grower price(K/kg seedcotton)GDP deflator(2,000 =100.00)1980/81 6 38 159 — — 0.041981/82 5 25 188 — — 0.041982/83 12 34 337 — — 0.041983/84 16 56 283 — — 0.051984/85 11 55 199 — — 0.061985/86 12 50 239 — — 0.081986/87 7 38 190 — — 0.151987/88 24 78 308 — — 0.241988/89 12 91 133 — — 0.321989/90 9 64 140 — — 0.581990/91 20 92 219 — — 1.201991/92 9 62 140 — — 2.321992/93 12 68 169 — — 6.161993/94 13 74 170 — — 15.001994/95 17 65 262 — 521 24.811995/96 20 115 174 38 558 34.251996/97 35 140 250 38 534 42.10(cont<strong>in</strong>ued)195
196Table A8 (cont<strong>in</strong>ued) ZambiaSeasonL<strong>in</strong>t production(thous<strong>and</strong> tons)Area (thous<strong>and</strong>hectares)Yield(kg l<strong>in</strong>t/hectare)G<strong>in</strong>n<strong>in</strong>g ratio(%)Grower price(K/kg seedcotton)GDP deflator(2,000 =100.00)1997/98 42 173 243 38 570 53.031998/99 36 150 240 39 444 63.371999/2000 30 150 200 39 680 76.902000/01 30 114 263 39 840 100.002001/02 46 165 279 40 860 128.032002/03 47 150 313 40 1,220 159.192003/04 69 254 271 40 1,420 192.542004/05 81 275 295 41 1,220 230.462005/06 79 275 286 41 850 270.612006/07 35 180 194 42 850 —Source: International <strong>Cotton</strong> Advisory Council for cotton statistics; International Monetary Fund International F<strong>in</strong>ancial Statistics <strong>and</strong> World Bank estimatesfor gross domestic product deflator. G<strong>in</strong>n<strong>in</strong>g ratio estimated from <strong>in</strong>terviews with g<strong>in</strong>ners <strong>and</strong> <strong>Cotton</strong> Development Trust (CDT).Note: K = Zambian kwacha; — = not available.
Table A9 ZimbabweSeasonL<strong>in</strong>t production(thous<strong>and</strong> tons)Area (thous<strong>and</strong>hectares)Yield(kg <strong>in</strong>t/hectare) G<strong>in</strong>n<strong>in</strong>g ratio (%)Grower price(Z$/kg seedcotton)GDP deflator(2,000 = 100.00)1980/81 62 134 459 36 0.40 2.211981/82 56 112 497 42 0.52 2.531982/83 60 138 435 41 0.52 2.891983/84 91 190 481 41 0.57 3.451984/85 103 231 447 38 0.67 3.571985/86 89 192 462 35 0.75 3.801986/87 87 243 356 31 0.80 4.241987/88 116 272 427 34 0.85 4.531988/89 92 248 371 34 1.11 5.311989/90 67 228 293 33 1.35 6.261990/91 72 273 262 28 1.63 7.191991/92 21 235 88 35 1.35 9.391992/93 75 246 304 35 2.62 11.981993/94 60 230 261 33 3.20 14.641994/95 38 194 194 38 3.70 17.721995/96 104 264 394 37 4.20 19.411996/97 101 313 322 36 6.00 24.421997/98 105 286 368 38 9.00 28.37(cont<strong>in</strong>ued)197
198Table A9 (cont<strong>in</strong>ued) ZimbabweSeasonL<strong>in</strong>t production(thous<strong>and</strong> tons)Area (thous<strong>and</strong>hectares)Yield(kg <strong>in</strong>t/hectare) G<strong>in</strong>n<strong>in</strong>g ratio (%)Grower price(Z$/kg seedcotton)GDP deflator(2,000 = 100.00)1998/99 115 330 349 38 15.00 38.801999/2000 138 369 374 39 18.00 64.012000/01 135 389 347 40 28.00 100.002001/02 80 363 221 41 57.00 176.572002/03 103 327 315 42 400.00 394.202003/04 130 330 395 39 1,800.00 2,014.742004/05 76 320 237 38 4,500.00 9,063.712005/06 115 380 303 44 80,000.00 28,208.972006/07 104 400 261 41 — —Source: International <strong>Cotton</strong> Advisory Council for cotton statistics; International Monetary Fund International F<strong>in</strong>ancial Statistics <strong>and</strong> World Bank estimatesfor gross domestic product deflator.Note: Z$ = Zimbabwe dollar; — = not available.
Table A10 G<strong>in</strong>n<strong>in</strong>g <strong>and</strong> FOB-to-CIF Costs, All WCA Countries, 1970–2006 (nom<strong>in</strong>al terms)FOB-to-CIF CostsSeasonNom<strong>in</strong>alCotlook AIndex ($/kg)Exchange rate(CFA f/$)G<strong>in</strong>n<strong>in</strong>g costs(CFA f/kg)Sea freightcosts ($/Ton)Market<strong>in</strong>gcosts ($/ton)CFA f/kg <strong>of</strong> l<strong>in</strong>t% <strong>of</strong> theCotlook AIndex1970/71 0.69 276 50 35 21 15 8.11971/72 0.82 262 50 35 25 15 7.31972/73 0.92 237 50 40 28 15 7.41973/74 1.69 233 55 50 51 24 6.01974/75 1.16 220 60 55 35 19 7.81975/76 1.44 228 65 60 43 24 7.21976/77 1.84 248 75 60 55 28 6.31977/78 1.43 237 80 65 43 25 7.51978/79 1.68 216 90 70 50 26 7.21979/80 1.88 208 100 75 56 28 7.01980/81 2.08 243 110 80 62 37 6.91981/82 1.63 301 120 85 49 43 8.21982/83 1.69 359 130 90 51 52 8.31983/84 1.93 414 140 110 58 72 8.71984/85 1.52 472 145 120 46 75 10.9(cont<strong>in</strong>ued)199
200Table A10 (cont<strong>in</strong>ued)FOB-to-CIF costsSeasonNom<strong>in</strong>alCotlook AIndex ($/kg)Exchange rate(CFA f/$)G<strong>in</strong>n<strong>in</strong>g costs(CFA f/kg)Sea freightcosts ($/ton)Market<strong>in</strong>gcosts ($/ton)CFA f/kg <strong>of</strong> l<strong>in</strong>t% <strong>of</strong> theCotlook AIndex1985/86 1.08 378 150 110 32 50 13.21986/87 1.37 316 150 100 41 43 10.31987/88 1.60 295 135 95 48 42 8.91988/89 1.46 308 120 95 44 44 9.51989/90 1.77 305 125 95 53 42 8.41990/91 1.81 273 120 90 54 40 8.01991/92 1.50 281 115 90 45 36 9.01992/93 1.30 269 120 90 39 36 9.91993/94 1.50 411 150 90 45 68 9.01994/95 2.02 522 175 90 61 77 7.51995/96 1.91 500 190 90 57 75 7.71996/97 1.76 538 200 80 53 75 7.5
1997/98 1.64 598 210 75 49 74 7.61998/99 1.35 593 225 70 40 67 8.21999/2000 1.20 649 230 65 36 70 8.42000/01 1.27 731 245 60 38 72 7.72001/02 0.97 731 225 55 29 60 8.62002/03 1.16 648 220 60 35 57 8.22003/04 1.47 555 215 55 38 50 6.32004/05 1.23 524 220 55 32 46 7.12005/06 1.24 535 225 60 32 49 7.4Sources: Country sources (see tables A1 through A9), World Bank, <strong>and</strong> International Monetary Fund International F<strong>in</strong>ancial Statistics.Note: FOB = free on board; CIF = cost, <strong>in</strong>surance, <strong>and</strong> freight. Accord<strong>in</strong>g to International <strong>Cotton</strong> Advisory Council classification, “All West <strong>and</strong> Central <strong>Africa</strong>”<strong>in</strong>cludes the four WCA countries <strong>in</strong> this study (Ben<strong>in</strong>, Burk<strong>in</strong>a Faso, Cameroon, <strong>and</strong> Mali) plus the Central <strong>Africa</strong>n Republic, Chad, Côte d’Ivoire, Gu<strong>in</strong>ea,Niger, Madagascar, Senegal, <strong>and</strong> Togo. The Cotlook A Index (cotton l<strong>in</strong>t) <strong>and</strong> the CFA f/$ exchange rate were calculated as averages over March through July toaccount for the fact that most cotton is marketed dur<strong>in</strong>g this period. Market<strong>in</strong>g costs were calculated as 3 percent <strong>of</strong> the Cotlook A Index through 2002/03 <strong>and</strong>2.6 percent afterward. The g<strong>in</strong>n<strong>in</strong>g costs are as reported by the cotton companies (averages for the entire WCA) <strong>and</strong> are expressed <strong>in</strong> terms <strong>of</strong> cotton l<strong>in</strong>t.201
202Table A11 <strong>Cotton</strong> Production, Area, <strong>and</strong> Yields, World <strong>and</strong> All WCA Countries, 1970–2006WorldAll WCASeasonProduction(thous<strong>and</strong> tons)Area (thous<strong>and</strong>hectares)Yield(kgs/hectare)Production(thous<strong>and</strong> tons)Area (thous<strong>and</strong>hectares)Yield(kgs/hectare)1970/71 11,740 31,778 369 109 644 1691971/72 12,938 33,024 392 141 686 2051972/73 13,595 33,818 402 143 643 2221973/74 13,615 32,558 418 138 616 2241974/75 13,926 33,285 418 158 629 2521975/76 11,706 30,001 390 190 723 2631976/77 12,385 31,513 393 195 712 2741977/78 13,860 34,966 396 179 666 2681978/79 12,933 34,000 380 216 702 3081979/80 14,084 33,100 425 235 652 3601980/81 13,831 33,667 411 204 633 3231981/82 14,991 33,948 442 202 551 3661982/83 14,479 32,569 445 253 591 4271983/84 14,499 32,137 451 279 675 4131984/85 19,247 35,217 547 327 708 4611985/86 17,461 32,792 532 351 838 4191986/87 15,269 29,503 518 409 846 483
1987/88 17,609 31,238 564 414 911 4541988/89 18,301 33,522 546 498 1,101 4521989/90 17,365 31,640 549 458 1,026 4461990/91 18,978 33,050 574 533 1,118 4771991/92 20,677 34,710 596 521 1,232 4231992/93 17,943 32,238 557 539 1,209 4461993/94 16,861 30,430 554 510 1,176 4341994/95 18,762 32,114 584 573 1,398 4101995/96 20,330 36,056 564 667 1,502 4441996/97 19,599 34,111 575 790 1,753 4511997/98 20,094 33,746 595 921 2,120 4351998/99 18,705 32,846 569 858 2,202 3901999/00 19,095 31,929 598 851 2,034 4182000/01 19,457 31,766 612 693 1,668 4152001/02 21,500 33,396 644 994 2,258 4402002/03 19,297 29,872 646 913 2,128 4292003/04 20,714 32,021 647 906 2,216 4092004/05 26,290 35,332 744 1,119 2,474 4522005/06 24,752 34,252 723 923 2,349 393Source: World data are from International <strong>Cotton</strong> Advisory Council; West <strong>and</strong> Central <strong>Africa</strong> data are from the cotton companies.Note: Accord<strong>in</strong>g to ICAC classification, “All WCA” <strong>in</strong>cludes the four West <strong>and</strong> Central <strong>Africa</strong> countries <strong>in</strong> this study (Ben<strong>in</strong>, Burk<strong>in</strong>a Faso, Cameroon, <strong>and</strong> Mali)plus the Central <strong>Africa</strong>n Republic, Chad, Côte d’Ivoire, Gu<strong>in</strong>ea, Niger, Madagascar, Senegal, <strong>and</strong> Togo.203
NOTES1. FAOSTAT for total agricultural trade; International <strong>Cotton</strong> Advisory Council forcotton trade.2. See chapter 2 on cotton’s market context for more detail.3. Although some might argue that Tanzania is an exception, the persistent <strong>and</strong> veryserious efforts by the government <strong>and</strong> private stakeholders to resolve the <strong>in</strong>put supplyproblem <strong>in</strong> the sector suggest that external <strong>in</strong>puts are considered critical.4. See Glover (1990) for a review <strong>of</strong> experience <strong>in</strong> eastern <strong>and</strong> southern <strong>Africa</strong> throughthe late 1980s.5. These low costs <strong>of</strong> production are related primarily to the very low price at whichmany smallholder farmers are will<strong>in</strong>g to “sell” their labor <strong>in</strong> production <strong>of</strong> thecrop, <strong>and</strong> to the low supervisory costs <strong>in</strong>herent <strong>in</strong> us<strong>in</strong>g primarily family labor. SeeB<strong>in</strong>swanger <strong>and</strong> McIntire (1987).6. See Jaffee (1994), however, for an empirical review <strong>of</strong> the widely vary<strong>in</strong>g circumstancesunder which contract farm<strong>in</strong>g has emerged, <strong>and</strong> examples <strong>of</strong> failure whereexternal conditions seemed favorable.7. One study did look at cross-country experience <strong>in</strong> selected countries <strong>of</strong> WCA <strong>and</strong>ESA <strong>and</strong> considered the pros <strong>and</strong> cons <strong>of</strong> different <strong>in</strong>stitutional structures (Goreux<strong>and</strong> Macrae 2002). Compared with that study, the present work is more comprehensive,has substantially more coverage <strong>of</strong> ESA, <strong>and</strong> has the benefit <strong>of</strong> an additionalfive years <strong>of</strong> postreform experience <strong>in</strong> the study countries.8. It is worth not<strong>in</strong>g, however, that production <strong>in</strong> the two major WCA producers hasdropped sharply <strong>in</strong> 2007/08 compared with 2006/07: from 700,000 to 360,000 metrictons (a drop <strong>of</strong> 48 percent) <strong>in</strong> Burk<strong>in</strong>a Faso <strong>and</strong> from 442,000 to 243,000 metrictons (a drop <strong>of</strong> 45 percent) <strong>in</strong> Mali.9. Except Ben<strong>in</strong>.10. Mozambique is a special case to be discussed later.205
206 NOTES11. Important cotton sector reforms have taken place <strong>in</strong> Côte d’Ivoire <strong>in</strong> the past 10 years,but it is not part <strong>of</strong> the study sample.12. Although India’s area allocated to GM cotton (10 percent) is small compared withother countries, its share <strong>in</strong> worldwide GM cotton production is high because thetotal cotton area <strong>in</strong> India is high <strong>and</strong> because GM yields are well above mean yields<strong>in</strong> the country.13. Price variability <strong>of</strong> cotton has not been that different from other primary commodities.Pan <strong>and</strong> Valderrama (2005), for example, compared the price variability <strong>of</strong> 22primary commodities <strong>and</strong> concluded that dur<strong>in</strong>g 2000–04, 17 commodities exhibitedmore price variability than cotton. Similarly, Gilbert (2006) ranked 21 commoditiesaccord<strong>in</strong>g to their volatility <strong>and</strong> found cotton to be somewhere <strong>in</strong> the middle.14. A study that estimated the price transmission elasticities from crude oil to 35 primarycommodities (<strong>in</strong>clud<strong>in</strong>g cotton <strong>and</strong> most food commodities) found that theaverage elasticity for food commodities was 0.18 <strong>and</strong> highly significant while thatfor cotton was 0.14 <strong>and</strong> marg<strong>in</strong>ally significant (Baffes 2007). Although this resultseems counter<strong>in</strong>tuitive because cotton competes with human-made fibers, whosekey <strong>in</strong>put is crude oil, food commodities are much bulkier than cotton while thecrude oil component <strong>in</strong> chemical fibers is small. Similarly, the study found lowtransmission elasticities for natural rubber (which competes with synthetic rubber)as well as some energy-<strong>in</strong>tensive metals.15. For a discussion <strong>of</strong> how the U.S. dollar exchange rate affects dollar-commodityprices, see Radetzki (1985).16. The highly divergent results <strong>of</strong> these models reflect a number <strong>of</strong> factors. First, thereare differences <strong>in</strong> the level <strong>and</strong> structure <strong>of</strong> support. For example, some models<strong>in</strong>corporate Ch<strong>in</strong>a’s support to its cotton sector <strong>and</strong> model its removal; others donot. Second, there are differences <strong>in</strong> the underly<strong>in</strong>g scenarios. Some models assumeliberalization <strong>in</strong> all commodity markets while others assume liberalization only <strong>in</strong>the cotton sector. Third, the models use different base years <strong>and</strong> hence different levels<strong>of</strong> subsidies. For example, support <strong>in</strong> the United States was three times as high<strong>in</strong> 1999 as <strong>in</strong> 1997.17. Note that these differentials are between short staple varieties <strong>and</strong> extra long staplepima varieties grown <strong>in</strong> different environments. As will be shown <strong>in</strong> chapter 7, theprice differentials observed with<strong>in</strong> <strong>Africa</strong>n upl<strong>and</strong> cotton varieties, while stillimportant, are much smaller than this.18. Fiber length is the average length <strong>of</strong> the longest half <strong>of</strong> fibers. Grade is a commercialvalue that is based on a visual assessment <strong>of</strong> a comb<strong>in</strong>ation <strong>of</strong> l<strong>in</strong>t color, cleanl<strong>in</strong>ess,<strong>and</strong> preparation. Color is determ<strong>in</strong>ed by the degree <strong>of</strong> reflectance (good) <strong>and</strong>yellowness (bad). Micronaire is a measure <strong>of</strong> fiber f<strong>in</strong>eness <strong>and</strong> maturity.19. Neps are cotton fibers tangled <strong>in</strong>to a knot.20. Gossypium barbadense.21. Cost <strong>and</strong> Freight Far East.22. R<strong>in</strong>g spun carded yarn is typically used for knitt<strong>in</strong>g <strong>and</strong> weav<strong>in</strong>g, <strong>in</strong> a large range<strong>of</strong> coarse to f<strong>in</strong>e counts.23. Combed yarns are stronger, more uniform, smoother <strong>and</strong> purer, <strong>and</strong> they havegreater sh<strong>in</strong>e than carded yarns.24. In <strong>Africa</strong>, these mother companies <strong>in</strong>clude Dunavant, Cargill, Plexus, DAGRIS,Re<strong>in</strong>hart, <strong>and</strong> others.25. Or the quotation for the <strong>Africa</strong>n franc zone <strong>in</strong> <strong>Cotton</strong> Outlook.26. Though exceptions may exist: for example, supply is more atomized <strong>in</strong> Ben<strong>in</strong> than<strong>in</strong> Zambia.
27. In some countries, seeds are sold directly on the domestic market without process<strong>in</strong>g<strong>in</strong>to oil <strong>and</strong> cake. In Mali, about 20 percent <strong>of</strong> cotton seeds are sold as livestockfeed at prices 30 percent higher than those paid by the oil mills.28. In most cases, this process<strong>in</strong>g takes place with<strong>in</strong> the country <strong>of</strong> orig<strong>in</strong>. However,vary<strong>in</strong>g quantities <strong>of</strong> seed are exported from Mozambique <strong>and</strong> Zambia to South<strong>Africa</strong> for process<strong>in</strong>g. Similarly, at the end <strong>of</strong> the 1990s, there was a Europe<strong>and</strong>em<strong>and</strong> for seeds. Some WCA cotton companies decided then to export, br<strong>in</strong>g<strong>in</strong>gf<strong>in</strong>ancial problems to the large-scale oil <strong>in</strong>dustry <strong>in</strong> the countries concerned, whichneeds large quantities <strong>of</strong> seeds to cover fixed costs. This export market to Europehas s<strong>in</strong>ce decl<strong>in</strong>ed <strong>and</strong> only one trader from WCA is still deal<strong>in</strong>g on it.29. Because the world market for cottonseed oil is very th<strong>in</strong>, its price <strong>in</strong>dicator may notbe as reliable as those <strong>of</strong> the four major oils.30. CFDT was renamed DAGRIS <strong>in</strong> 2000.31. CFDT withdrew from Ben<strong>in</strong> after the advent <strong>of</strong> the socialist regime <strong>in</strong> that country<strong>in</strong> 1972.32. With the exception <strong>of</strong> Ben<strong>in</strong> <strong>and</strong> Burk<strong>in</strong>a Faso, where cotton extension was providedby the national agricultural extension systems.33. Predef<strong>in</strong>ed st<strong>and</strong>ard costs on the basis <strong>of</strong> which cotton companies were remuneratedfor the public services they provided.34. Ben<strong>in</strong> <strong>and</strong> Côte d’Ivoire were exceptions to this s<strong>in</strong>gle channel pattern. Reforms <strong>in</strong>Ben<strong>in</strong> started earlier than elsewhere but were complex <strong>and</strong> badly managed. In Côted’Ivoire, full liberalization took place but was soon affected by the country’s politicalcrisis.35. Côte d’Ivoire <strong>and</strong> Senegal <strong>in</strong> WCA have also <strong>in</strong>troduced private cotton companies.36. Eventually adjusted before harvest <strong>in</strong> case <strong>of</strong> major changes <strong>in</strong> world prices.37. Distributors are farmers chosen from the community to help ma<strong>in</strong>ly <strong>in</strong> the logistics<strong>of</strong> credit provision given the large number <strong>of</strong> farmers that Dunavant deals with.Efforts at more serious extension assistance have been carried out through Dunavant’sYIELD program, f<strong>in</strong>anced by the German development agency GTZ.38. Input costs are subsidized by companies, rather than provided on credit. Becausethe subsidy must eventually be recovered <strong>in</strong> the price, it can be conceived <strong>of</strong> as partial<strong>in</strong>-k<strong>in</strong>d credit.39. See Leibenste<strong>in</strong> (1966) for orig<strong>in</strong>al concept <strong>of</strong> “x-<strong>in</strong>efficiency,” <strong>and</strong> see vast followupliterature <strong>in</strong> the area <strong>of</strong> bus<strong>in</strong>ess management.40. The details <strong>of</strong> this system are expla<strong>in</strong>ed <strong>in</strong> more detail <strong>in</strong> chapter 6.41. By label<strong>in</strong>g soil fertility “exogenous,” the <strong>in</strong>tention is not to dismiss concerns aboutthe impact (negative or positive) <strong>of</strong> cotton production on soil fertility. Rather, itpo<strong>in</strong>ts out that other factors also make a major contribution to the observed soilfertility, the <strong>in</strong>herent characteristics <strong>of</strong> the soil, the population density, <strong>and</strong> theoverall management <strong>of</strong> the farm<strong>in</strong>g system be<strong>in</strong>g three major ones.42. Consistent with this def<strong>in</strong>ition, this study does not cover the further process<strong>in</strong>g <strong>of</strong>l<strong>in</strong>t because it belongs to a completely different, downstream segment <strong>of</strong> the cotton<strong>and</strong> textile value cha<strong>in</strong>.43. Filière is the French word for value cha<strong>in</strong> or subsector <strong>and</strong> embodies the verticallycoord<strong>in</strong>ated approach long pursued <strong>in</strong> WCA.44. In 2004, the government <strong>of</strong> Zimbabwe did get <strong>in</strong>volved <strong>in</strong> resolv<strong>in</strong>g a pric<strong>in</strong>g disputebetween producers <strong>and</strong> companies.45. And <strong>in</strong> Cameroon, the price support fund has been exhausted by the high prices.46. See chapter 1 <strong>of</strong> this book for background on this issue.NOTES 207
208 NOTES47. Ben<strong>in</strong> is not <strong>in</strong>cluded <strong>in</strong> this review because the complexity <strong>and</strong> uniqueness <strong>of</strong> itssystem does not lend itself to the general lessons we seek <strong>in</strong> this review.48. Some <strong>of</strong> Burk<strong>in</strong>a Faso’s reported production is due to seed cotton com<strong>in</strong>g over theborder from Côte d’Ivoire <strong>and</strong> other countries, spurred by the unrest <strong>in</strong> Côted’Ivoire <strong>and</strong> high prices paid by SOFITEX.49. Though Ug<strong>and</strong>a has been classified as a hybrid sector, it is <strong>in</strong>cluded <strong>in</strong> the discussionhere with Tanzania under competitive sectors because its competitive structures<strong>in</strong>ce reform has created problems very similar to those found <strong>in</strong> Tanzania <strong>and</strong> hasdriven the types <strong>of</strong> hybrid <strong>in</strong>stitutional set-ups described earlier.50. Seed has so far been <strong>in</strong>cluded <strong>in</strong> the system but there has been debate as to whetherit should be removed <strong>in</strong> the future.51. More detail, see Tschirley, Poulton, <strong>and</strong> Boughton (2008) <strong>and</strong> Poulton <strong>and</strong> Hanyani-Mlambo (2007).52. Cargill purchased Clark <strong>in</strong> 2006.53. A sharp appreciation <strong>of</strong> the Zambian kwacha from late 2006 through May or June2007 was also a major factor.54. See concept <strong>of</strong> loss aversion <strong>in</strong> behavioral economics, <strong>in</strong> which “the disutility <strong>of</strong> giv<strong>in</strong>gup an object is greater than the utility associated with acquir<strong>in</strong>g it” (Kahneman,Knetsch, <strong>and</strong> Thaler 1991: 194).55. In the <strong>in</strong>ternational market, cotton is priced <strong>in</strong> U.S. cents per pound. One cent perpound is equal to 2.2046 cents per kg.56. Grow<strong>in</strong>g fewer varieties <strong>in</strong> a country makes it easier to ma<strong>in</strong>ta<strong>in</strong> homogeneity <strong>of</strong>quality, though proper controls (as <strong>in</strong> Zambia) <strong>and</strong> good classification can ensuregood performance even when several varieties are grown.57. Assum<strong>in</strong>g that the whole crop was sold on a given day.58. Actual season-average contract prices can be different from these theoretical averagesdepend<strong>in</strong>g on the tim<strong>in</strong>g <strong>of</strong> sales. In addition, f<strong>in</strong>al average realized prices c<strong>and</strong>iffer from contract prices depend<strong>in</strong>g on the actual quality <strong>and</strong> weight shipped <strong>and</strong>on eventual claims. Nevertheless, these calculations represent the current best estimates<strong>of</strong> average market quality premiums earned by each country’s sector.59. It is common for five or more buyers, all with their own buy<strong>in</strong>g posts, to be <strong>in</strong> a s<strong>in</strong>glevillage. Companies either hire enterpris<strong>in</strong>g local residents to run buy<strong>in</strong>g postsat harvest time or contract with the staff <strong>of</strong> the local primary cooperative society tobuy on their behalf. F<strong>in</strong>d<strong>in</strong>g trustworthy agents is sometimes a challenge <strong>in</strong> itself,without add<strong>in</strong>g quality control to their responsibilities.60. International firms feature more prom<strong>in</strong>ently <strong>in</strong> the Ug<strong>and</strong>a sector than <strong>in</strong> Tanzania,but there are still plenty <strong>of</strong> local firms <strong>in</strong> the market.61. Some farmers, pr<strong>in</strong>cipally those deliver<strong>in</strong>g to smaller companies, also began to engage<strong>in</strong> the k<strong>in</strong>d <strong>of</strong> opportunistic practices seen <strong>in</strong> Tanzania. COTTCO <strong>and</strong> Cargill’s buy<strong>in</strong>goperations allow them to trace seed cotton back to the farmers who sold it to them, sothey have been less affected by these practices. However, even they report a dramatic<strong>in</strong>crease <strong>in</strong> foreign matter found with<strong>in</strong> seed cotton bales <strong>and</strong> have had to employadditional staff members to sort through all bales before they are sent to the g<strong>in</strong>s.62. For some years, the NCC was chaired by a representative <strong>of</strong> one <strong>of</strong> the oil processors,ensur<strong>in</strong>g that sector policy protected their <strong>in</strong>terests, as well as those <strong>of</strong> g<strong>in</strong>ners<strong>and</strong> producers.63. Dem<strong>and</strong> for cake <strong>in</strong> Zimbabwe would certa<strong>in</strong>ly have been strong <strong>in</strong> the 1990s, whena strong commercial livestock <strong>in</strong>dustry existed.64. Agricultural research <strong>in</strong> <strong>Africa</strong> is overwhelm<strong>in</strong>gly funded by the public sector <strong>and</strong>at much lower levels than <strong>in</strong> developed countries relative to the agricultural sector’s
contribution to GDP. Growth <strong>in</strong> agricultural fund<strong>in</strong>g <strong>in</strong> <strong>Africa</strong> slowed dramatically<strong>in</strong> the 1990s compared with previous decades, even as numbers <strong>of</strong> researchers<strong>in</strong>creased. For a thorough review <strong>of</strong> agricultural research <strong>in</strong> <strong>Africa</strong>, see Be<strong>in</strong>tema<strong>and</strong> Stads (2006).65. In virtually all countries, research plays an important role <strong>in</strong> basic seed multiplication,as well as <strong>in</strong> development <strong>of</strong> new varieties.66. Similarly, it is desirable for producers’ associations to be <strong>in</strong>volved <strong>in</strong> sett<strong>in</strong>g researchpriorities <strong>and</strong> monitor<strong>in</strong>g research performance.67. With<strong>in</strong> a competitive system, a high degree <strong>of</strong> free-rid<strong>in</strong>g on such effort might beexpected.68. Note that Lele, Van de Walle, <strong>and</strong> Gbetiobouo (1989) <strong>in</strong>cluded the potential collapse<strong>of</strong> research systems <strong>in</strong> their warn<strong>in</strong>gs about dissolv<strong>in</strong>g the s<strong>in</strong>gle-channel cottonsystems throughout WCA if viable alternative <strong>in</strong>stitutional setups were not <strong>in</strong>place.69. It also complicates the priority sett<strong>in</strong>g for research, thus <strong>in</strong>creas<strong>in</strong>g the chances <strong>of</strong>conflicts <strong>of</strong> <strong>in</strong>terest between producers, g<strong>in</strong>ners, <strong>and</strong> l<strong>in</strong>t buyers.70. Field surveys were not carried out <strong>in</strong> Ben<strong>in</strong>; thus, Ben<strong>in</strong> does not appear <strong>in</strong> thecomparative analysis <strong>in</strong> this chapter.71. Yields <strong>in</strong> Ben<strong>in</strong>, Burk<strong>in</strong>a Faso, Chad, <strong>and</strong> Mali have all followed this general pattern.72. This calculation excludes the labor figures provided by focus group respondents <strong>in</strong>Mozambique, which were very high. It is not clear whether the very high labor figures<strong>in</strong> Mozambique were a result <strong>of</strong> different data collection methods used there orreflected actual differences <strong>in</strong> labor use. It is true that high prevalence <strong>of</strong> malaria<strong>and</strong> malnutrition (especially dur<strong>in</strong>g 2005/06) are believed to have depressed laborproductivity <strong>in</strong> Mozambique.73. In Mozambique, preemergence herbicide use is <strong>in</strong> a pilot phase <strong>in</strong> Cabo Delgadoprov<strong>in</strong>ce. Farmers were very positive about this <strong>in</strong>itiative, despite the <strong>in</strong>creasedcosts, because it enabled them to weed their food crops on time. Cargill also providesherbicide to some farmers <strong>in</strong> low altitude areas <strong>of</strong> Zambia, where weed pressureis <strong>in</strong>tense.74. Group 1 <strong>in</strong> Zambia does use a foliar feed fertilizer that the members receive oncredit; this provides much less nitrogen than the fertilizers used <strong>in</strong> WCA, Zimbabwe,<strong>and</strong> Ug<strong>and</strong>a, <strong>and</strong> it is much less costly.75. These percentage figures for Mozambique, Ug<strong>and</strong>a, <strong>and</strong> Zambia are probably onthe high side because <strong>of</strong> the high estimated costs for labor or hired services<strong>in</strong>cluded <strong>in</strong> the group budgets. However, the basic po<strong>in</strong>t that a large proportion <strong>of</strong>producers <strong>in</strong> these countries achieve low returns to their labor <strong>in</strong>put <strong>in</strong>to cottonproduction is a robust one.76. In Tanzania, each <strong>of</strong> the four villages conta<strong>in</strong>ed 500 to 1,000 or more households,so it would have been too time-consum<strong>in</strong>g to use the full list. In addition, while villageleaders could always give a figure for the number <strong>of</strong> households <strong>in</strong> their village(based on the previous census <strong>and</strong> subsequent adjustments), complete lists <strong>of</strong> allhousehold heads were not always available. In such cases, names were drawn at r<strong>and</strong>omfrom the lists for <strong>in</strong>dividual “wards” that were available.77. The entire exercise took three or more hours per village. Researchers thus providedfood part way through the process.78. Several g<strong>in</strong>ners were <strong>in</strong>terviewed <strong>in</strong> both Tanzania <strong>and</strong> Zimbabwe, <strong>and</strong> a compositepicture <strong>of</strong> g<strong>in</strong>n<strong>in</strong>g costs was built up from the <strong>in</strong>formation on different costcomponents provided by different respondents. In Mozambique, only one g<strong>in</strong>ner,considered to be representative <strong>of</strong> the least efficient companies, agreed to providecost <strong>in</strong>formation.NOTES 209
210 NOTES79. In Zimbabwe <strong>and</strong> Zambia, a number <strong>of</strong> new roller g<strong>in</strong>s are be<strong>in</strong>g <strong>in</strong>stalled. However,the majority <strong>of</strong> g<strong>in</strong>n<strong>in</strong>g capacity <strong>in</strong> these countries is still made up <strong>of</strong> saw g<strong>in</strong>s.80. This figure reflects uneconomic pric<strong>in</strong>g (based on <strong>of</strong>ficial exchange rates) by astate-owned enterprise with<strong>in</strong> a highly distorted economy.81. This claim is based on the higher level <strong>of</strong> research <strong>in</strong> WCA countries than <strong>in</strong>Mozambique <strong>and</strong> the history <strong>of</strong> substantial <strong>in</strong>vestment by WCA cotton companies<strong>in</strong> both <strong>in</strong>frastructure <strong>and</strong> research. Mozambican companies did have substantialroad ma<strong>in</strong>tenance costs dur<strong>in</strong>g the first several years <strong>of</strong> the privatization phase.82. One study did look at cross-country experience <strong>in</strong> WCA (Ben<strong>in</strong>, Burk<strong>in</strong>a Faso, <strong>and</strong>Côte d’Ivoire; also Ghana) <strong>and</strong> ESA (Zimbabwe <strong>and</strong>, with less detail, Tanzania) <strong>and</strong>explicitly considered the pros <strong>and</strong> cons <strong>of</strong> different <strong>in</strong>stitutional structures (Goreux<strong>and</strong> Macrae 2002). The report spotlighted some f<strong>in</strong>d<strong>in</strong>gs similar to those <strong>in</strong> thispresent book (for example, the collapse <strong>of</strong> <strong>in</strong>put supply <strong>and</strong> quality control <strong>in</strong> Tanzania).Compared with that study, the present work is more comprehensive, hassubstantially more coverage <strong>of</strong> ESA, <strong>and</strong> has the benefit <strong>of</strong> an additional five years<strong>of</strong> postreform experience <strong>in</strong> the study countries.83. By “path dependency,” we mean that current structure is heavily <strong>in</strong>fluenced by paststructure—the past structural path that the country has traveled.84. Unfortunately, this calculation could be performed only for one year, which happenedto be a bumper harvest year <strong>in</strong> Tanzania. It would be useful to extend thesecalculations to additional years, as has been done, for example, for seed cotton pric<strong>in</strong>g<strong>and</strong> quality premiums.85. As shown <strong>in</strong> chapter 7, <strong>in</strong> Zambia the efforts <strong>of</strong> the two dom<strong>in</strong>ant g<strong>in</strong>n<strong>in</strong>g companiesresulted <strong>in</strong> an <strong>in</strong>crease <strong>in</strong> the premium for the top type <strong>of</strong> Zambian l<strong>in</strong>t relativeto the Cotlook A Index by US$0.05 per lb over a period <strong>of</strong> five years. The twocompanies used different approaches, but with equal success <strong>in</strong> largely elim<strong>in</strong>at<strong>in</strong>gcontam<strong>in</strong>ation: Dunavant relies primarily on the manual removal <strong>of</strong> contam<strong>in</strong>ationat the g<strong>in</strong>, while Cargill has succeeded <strong>in</strong> chang<strong>in</strong>g farmer behavior to avoidcontam<strong>in</strong>ation. In both cases, the limited alternative outlets through which farmerscan sell their seed cotton means that they have to respond to the quality <strong>in</strong>itiatives<strong>of</strong> the dom<strong>in</strong>ant companies.86. As noted <strong>in</strong> this chapter, the competitive structure <strong>of</strong> the cotton sector <strong>in</strong> Tanzaniamay prevent it from ever achiev<strong>in</strong>g a high-quality reputation. Instead, its comb<strong>in</strong>ation<strong>of</strong> competitive structure <strong>and</strong> abundant area for production expansion makesit better placed to compete primarily on the basis <strong>of</strong> cost. Nevertheless, even as alow-cost producer Tanzania has to take urgent action to reduce the contam<strong>in</strong>ation<strong>of</strong> its l<strong>in</strong>t. Its challenge is to f<strong>in</strong>d <strong>in</strong>stitutional arrangements appropriate to a competitivesector that can enhance the quality <strong>in</strong>centives fac<strong>in</strong>g both producers <strong>and</strong>g<strong>in</strong>ners. A proposed village auction system for the purchase <strong>of</strong> seed cotton may beone such arrangement (Poulton <strong>and</strong> Maro 2007).87. COTTCO markets some <strong>of</strong> its l<strong>in</strong>t directly to sp<strong>in</strong>ners, bypass<strong>in</strong>g <strong>in</strong>ternationalmerchants altogether. However, its l<strong>in</strong>t market<strong>in</strong>g activities have been badly hit byboth the national economic crisis (lead<strong>in</strong>g to cash shortages) <strong>and</strong> the changes <strong>in</strong>sector structure, which make it less able to predict what quantities <strong>of</strong> l<strong>in</strong>t <strong>of</strong> a particularquality it is go<strong>in</strong>g to be able to produce. Hence, there has been a shift awayfrom forward <strong>and</strong> cost, <strong>in</strong>surance, <strong>and</strong> freight sales toward spot market sales on afree-on-board or free-on-truck basis.88. Accord<strong>in</strong>g to figure 10.1, there has been little improvement across ESA as a wholes<strong>in</strong>ce liberalization, although <strong>in</strong>dividual countries, such as Zambia, have postednoteworthy improvements.
89. It also shows how the efficiency <strong>of</strong> technical assistance can be <strong>in</strong>creased when it ischanneled through a strong private sector partner.90. A secure <strong>and</strong> well-regulated local monopoly arrangement may be ideal for this purposebecause concessionaires can capture the immediate benefits <strong>of</strong> better pestmanagement or demonstrate how their farmers have benefited from lower <strong>in</strong>putcosts, while eventual retender<strong>in</strong>g <strong>of</strong> concessions should provide an <strong>in</strong>centive to seeksuch outcomes. This <strong>in</strong>centive may be weaker <strong>in</strong> a national monopoly system,unless there is pressure from farmer organizations, civil society groups (concernedabout human health or environmental impacts), or politicians.91. A second technology likely to be <strong>of</strong> <strong>in</strong>terest to many farmers is low-volume herbicides.These are labor sav<strong>in</strong>g, so the poverty impact <strong>of</strong> their <strong>in</strong>troduction can bequestioned. However, as well as appeal<strong>in</strong>g to “larger” smallholder cotton producers,who currently rely heavily on hired labor (ESA) or animal traction with family labor(WCA) for weed<strong>in</strong>g work, they might ultimately also assist poorer producers whostruggle to allocate their labor across hir<strong>in</strong>g out, food crop production, <strong>and</strong> cotton,with the latter currently suffer<strong>in</strong>g from untimely <strong>and</strong> <strong>in</strong>adequate labor <strong>in</strong>put.92. The experience <strong>of</strong> Bt cotton production by South <strong>Africa</strong>n smallholders is <strong>in</strong>structive,<strong>in</strong> both the yield impact <strong>and</strong> rapid adoption <strong>of</strong> Bt (Thirtle et al. 2003) <strong>and</strong> <strong>in</strong>the dependence <strong>of</strong> that success on <strong>in</strong>stitutional arrangements to support provision<strong>of</strong> the relevant <strong>in</strong>put on credit (Gouse 2007).93. The ma<strong>in</strong> emphasis <strong>in</strong> this book has been on sector types <strong>and</strong> their <strong>in</strong>fluence onsector performance. However, the issue <strong>of</strong> firm types is clearly l<strong>in</strong>ked to that <strong>of</strong> sectortypes. Arguably, for example, concentrated <strong>and</strong> local monopoly sectors can performwell <strong>in</strong> part because they allow a lead<strong>in</strong>g role for large companies, many <strong>of</strong>them affiliated with <strong>in</strong>ternational cotton merchants. Conversely, the experiences <strong>of</strong>Zimbabwe s<strong>in</strong>ce 2003 <strong>and</strong> Ug<strong>and</strong>a s<strong>in</strong>ce 2000 show that the presence <strong>of</strong> such firmswith<strong>in</strong> a sector is not a sufficient condition for strong performance, hence the chosenfocus <strong>of</strong> this book.94. Dom<strong>in</strong>ant firms have <strong>in</strong>centives to cooperate with each other <strong>in</strong> concentrated sectors,whereas <strong>in</strong> local monopolies the onus is on the regulatory body to monitorconcessionaire companies that may be reluctant to disclose <strong>in</strong>formation. The costs<strong>of</strong> retender<strong>in</strong>g concessions may also be higher than the costs <strong>of</strong> issu<strong>in</strong>g licensesunder a concentrated system <strong>and</strong> the retender<strong>in</strong>g process may encourage firms to<strong>in</strong>vest more <strong>in</strong> ma<strong>in</strong>ta<strong>in</strong><strong>in</strong>g relations with the regulator than <strong>in</strong> improv<strong>in</strong>g performance<strong>in</strong> their monopoly areas.95. In Côte d’Ivoire, the cotton sector has moved fairly rapidly from a local monopolysystem toward a concentrated one, even though this evolution was not planned <strong>in</strong>advance <strong>and</strong> is partly due to the sociopolitical events that have taken place s<strong>in</strong>ce theearly 2000s.96. Chapter 6 suggests reasons for these different approaches <strong>in</strong> the two countries.97. Sav<strong>in</strong>gs <strong>and</strong> Credit Cooperatives (SACCOs).NOTES 211
BIBLIOGRAPHYBadiane, Ousmane, Dhaneshwar Ghura, Louis Goreux, <strong>and</strong> Paul Masson. 2002. “<strong>Cotton</strong>Sector Strategies <strong>in</strong> West <strong>and</strong> Central <strong>Africa</strong>.” Policy Research Work<strong>in</strong>g Paper No.2867, World Bank, Wash<strong>in</strong>gton, DC.Baffes, J. 2005. “The <strong>Cotton</strong> Problem.” The World Bank Research Observer 20 (1):109–44.———. 2007. “Oil Spills on Other Commodities.” Resources Policy 32 (3): 126–34.———. 2008. “Ug<strong>and</strong>a Country Study.” Background paper for Comparative Analysis <strong>of</strong><strong>Organization</strong> <strong>and</strong> <strong>Performance</strong> <strong>of</strong> <strong>Africa</strong>n <strong>Cotton</strong> <strong>Sectors</strong>: Learn<strong>in</strong>g from ReformExperience, World Bank, Wash<strong>in</strong>gton, DC.Baffes, J., Ibrahim Elbadawi, <strong>and</strong> Stephen O’Connell. 1999. “S<strong>in</strong>gle-Equation Estimation<strong>of</strong> the Equilibrium Real Exchange Rate.” In Exchange Rate Misalignment: Concepts<strong>and</strong> Measurements for Develop<strong>in</strong>g Countries, ed. L. E. H<strong>in</strong>kle <strong>and</strong> P. J. Montiel,405–65. New York: Oxford University Press.Be<strong>in</strong>tema, Nienke M., <strong>and</strong> Gert-Jan Stads. 2006. “Agricultural R&D <strong>in</strong> Sub-Saharan<strong>Africa</strong>: An Era <strong>of</strong> Stagnation.” Agricultural Science <strong>and</strong> Technology Indicators(ASTI) Initiative Background Report, IFPRI, Wash<strong>in</strong>gton, DC.Benfica, Rui, David Tschirley, <strong>and</strong> Liria Sambo. 2002. “The Impact <strong>of</strong> Alternative Agro-Industrial Investments on Poverty Reduction <strong>in</strong> Rural Mozambique.” ResearchReport No. 51E, M<strong>in</strong>istry <strong>of</strong> Agriculture <strong>of</strong> Mozambique, Maputo. http://www.aec.msu.edu/agecon/fs2/mozambique/wps51e.pdf.B<strong>in</strong>swanger, Hans, <strong>and</strong> J. McIntire. 1987. “Behavioral <strong>and</strong> Material Determ<strong>in</strong>ants <strong>of</strong>Production Relations <strong>in</strong> L<strong>and</strong> Abundant Tropical Agriculture.” Economic Development<strong>and</strong> Cultural Change 36 (1): 73–99.Boughton, D. 2008. “Mozambique Country Study.” Background paper for ComparativeAnalysis <strong>of</strong> <strong>Organization</strong> <strong>and</strong> <strong>Performance</strong> <strong>of</strong> <strong>Africa</strong>n <strong>Cotton</strong> <strong>Sectors</strong>: Learn<strong>in</strong>g fromReform Experience, World Bank, Wash<strong>in</strong>gton, DC.213
Chaudhry, Rafiq. 2007. “Outlook for <strong>Cotton</strong> Production <strong>and</strong> Developments <strong>in</strong> ProductionResearch.” Paper presented at the UNCTAD/UNDP Workshop on Enhanc<strong>in</strong>g the<strong>Cotton</strong> Value Cha<strong>in</strong> <strong>in</strong> <strong>Africa</strong> through Trade <strong>and</strong> Investment, with a Special Emphasison Regional <strong>and</strong> South-South Cooperation. Bamako, Mali, December 11–12.Conseil Ouest et Centre <strong>Africa</strong><strong>in</strong> Pour La Recherche et le Développement Agricole(CORAF/WECARD). Undated. Evaluation des Unités Opérationelles duCORAF/WECARD. Rapport F<strong>in</strong>al. Unpublished.<strong>Cotton</strong> Outlook. 2005. Cotlook’s GM <strong>Cotton</strong> Survey. Special Issue—The ICAC 64thPlenary Meet<strong>in</strong>g. Liverpool, United K<strong>in</strong>gdom.Delgado, Christopher. 1999. “Sources <strong>of</strong> Growth <strong>in</strong> Smallholder Agriculture <strong>in</strong> Sub-Saharan <strong>Africa</strong>: The Role <strong>of</strong> Vertical Integration <strong>of</strong> Smallholders with Processors <strong>and</strong>Marketers <strong>of</strong> High Value-Added Items.” Agrekon 38: 165–89.Devarajan, S. 1999. “Estimates <strong>of</strong> Real Exchange Rate Misalignment with a SimpleGeneral-Equilibrium Model.” In Exchange Rate Misalignment: Concepts <strong>and</strong> Measurementsfor Develop<strong>in</strong>g Countries, ed. L. E. H<strong>in</strong>kle <strong>and</strong> P. J. Montiel, 359–80.New York: Oxford University Press.Estur, G. 2008. “Quality <strong>and</strong> Market<strong>in</strong>g <strong>of</strong> <strong>Africa</strong>n <strong>Cotton</strong>.” Background paper for ComparativeAnalysis <strong>of</strong> <strong>Organization</strong> <strong>and</strong> <strong>Performance</strong> <strong>of</strong> <strong>Africa</strong>n <strong>Cotton</strong> <strong>Sectors</strong>:Learn<strong>in</strong>g from Reform Experience, World Bank, Wash<strong>in</strong>gton, DC.European Commission. 2003. “Agricultural Reform Cont<strong>in</strong>ued: Commission ProposesSusta<strong>in</strong>able Agricultural Model for Europe’s Tobacco, Olive Oil <strong>and</strong> <strong>Cotton</strong> <strong>Sectors</strong>.”Press Release, European Commission, September 23, Brussels.FAO (Food <strong>and</strong> Agriculture <strong>Organization</strong> <strong>of</strong> the United Nations). 2004. “<strong>Cotton</strong>:Impact <strong>of</strong> Support Policies <strong>in</strong> Develop<strong>in</strong>g Countries.” Trade Policy Technical NoteNo. 1. ftp://ftp.fao.org/docrep/fao/007/y5533e/y5533e01.pdf.FAO Statistics. Various reports.Gergely, N. 2004. “Analyse comparée des coûts de la filière coton au Burk<strong>in</strong>a, au Mali etau Cameroun.” (Cost analysis <strong>of</strong> the cotton supply cha<strong>in</strong> <strong>in</strong> Mali, Burk<strong>in</strong>a Faso, <strong>and</strong>Cameroon). Agence Française du Développement, Paris.———. 2005. “Etude d’un fonds de soutien et d’un fonds d’<strong>in</strong>tervention au bénéfice dela filière coton au Burk<strong>in</strong>a Faso.” (Study for a price support fund <strong>in</strong> Burk<strong>in</strong>a Faso).Agence Française de Développement, Paris.———. 2008a. “Ben<strong>in</strong> <strong>Cotton</strong> Study.” Background paper for Comparative Analysis <strong>of</strong><strong>Organization</strong> <strong>and</strong> <strong>Performance</strong> <strong>of</strong> <strong>Africa</strong>n <strong>Cotton</strong> <strong>Sectors</strong>: Learn<strong>in</strong>g from ReformExperience, World Bank, Wash<strong>in</strong>gton, DC.———. 2008b. “Burk<strong>in</strong>a Country Study.” Background paper for Comparative Analysis<strong>of</strong> <strong>Organization</strong> <strong>and</strong> <strong>Performance</strong> <strong>of</strong> <strong>Africa</strong>n <strong>Cotton</strong> <strong>Sectors</strong>: Learn<strong>in</strong>g from ReformExperience, World Bank, Wash<strong>in</strong>gton, DC.———. 2008c. “Cameroon Country Study.” Background paper for Comparative Analysis<strong>of</strong> <strong>Organization</strong> <strong>and</strong> <strong>Performance</strong> <strong>of</strong> <strong>Africa</strong>n <strong>Cotton</strong> <strong>Sectors</strong>: Learn<strong>in</strong>g fromReform Experience, World Bank, Wash<strong>in</strong>gton, DC.———. 2008d. “Mali Country Study.” Background paper for Comparative Analysis <strong>of</strong><strong>Organization</strong> <strong>and</strong> <strong>Performance</strong> <strong>of</strong> <strong>Africa</strong>n <strong>Cotton</strong> <strong>Sectors</strong>: Learn<strong>in</strong>g from ReformExperience, World Bank, Wash<strong>in</strong>gton, DC.Gibbon, P. 1999. “Free Competition without Susta<strong>in</strong>able Development? Tanzanian <strong>Cotton</strong>Sector Liberalisation, 1994/95 to 1997/98.” Journal <strong>of</strong> Development Studies 36 (1):128–50.Gilbert, C. 2006. “Trends <strong>and</strong> Volatility <strong>in</strong> Agricultural Commodity Prices.” In AgriculturalCommodity Markets <strong>and</strong> Trade: New Approaches to Analyz<strong>in</strong>g Market Structure214 BIBLIOGRAPHY
<strong>and</strong> Instability, ed. A. Sarris <strong>and</strong> D. Hallam, 31–60. Northampton, MA: Food <strong>and</strong>Agriculture <strong>Organization</strong> <strong>of</strong> the United Nations <strong>and</strong> Edward Elgar.Glover, D. 1990. “Contract Farm<strong>in</strong>g <strong>and</strong> Outgrower Schemes <strong>in</strong> East <strong>and</strong> Southern<strong>Africa</strong>.” Journal <strong>of</strong> Agricultural Economics 41: 303–15.Goreux, Louis, <strong>and</strong> John Macrae. 2002. “Liberaliz<strong>in</strong>g the <strong>Cotton</strong> Sector <strong>in</strong> SSA: Part I,Ma<strong>in</strong> Issues.” Unpublished. World Bank, Wash<strong>in</strong>gton, DC.Gouse, M. 2007. “South <strong>Africa</strong>: Reveal<strong>in</strong>g the Potential <strong>and</strong> Obstacles, the Private SectorModel <strong>and</strong> Reach<strong>in</strong>g the Traditional Sector.” In The Gene Revolution: GM Crops<strong>and</strong> Unequal Development, ed. S. Fukuda-Parr, 175–95. London: Earthscan.H<strong>in</strong>kle, Laurence, <strong>and</strong> Peter Montiel. 1999. Exchange Rate Misalignment: Concepts <strong>and</strong>Measurement for Develop<strong>in</strong>g Countries. New York: Oxford University Press.ICAC (International <strong>Cotton</strong> Advisory Committee). Various issues. <strong>Cotton</strong>: Review <strong>of</strong> theWorld Situation.Jaffee, S. 1994. “Contract Farm<strong>in</strong>g <strong>in</strong> the Shadow <strong>of</strong> Competitive Markets: The Experience<strong>of</strong> Kenyan Horticulture.” In Liv<strong>in</strong>g Under Contract: Contract Farm<strong>in</strong>g <strong>and</strong>Agrarian Transformation <strong>in</strong> Sub-Saharan <strong>Africa</strong>, ed. P. Little <strong>and</strong> M. Watts. Madison:University <strong>of</strong> Wiscons<strong>in</strong> Press.Jayne, T., L. Rubey, D. Tschirley, M. Mukumbu, M. Chisvo, A. Santos, M. Weber, <strong>and</strong>P. Disk<strong>in</strong>. 1995. “Effects <strong>of</strong> Market Reform on Access to Food by Low-IncomeHouseholds: Evidence from Four Countries <strong>in</strong> Eastern <strong>and</strong> Southern <strong>Africa</strong>.” Department<strong>of</strong> Agricultural Economics, Michigan State University, East Lans<strong>in</strong>g, MI.J. M. Consultants. 1995. “La Compétitivité du Coton dans le Monde.” Paris: M<strong>in</strong>istère dela Coopération Française.Kahneman, Daniel, Jack L. Knetsch, <strong>and</strong> Richard H. Thaler. 1991. “Anomalies: TheEndowment Effect, Loss Aversion, <strong>and</strong> Status Quo Bias.” The Journal <strong>of</strong> EconomicPerspectives 5 (1): 193–206.Leibenste<strong>in</strong> H. 1966. “Allocative Efficiency vs. ‘X-Efficiency.’” American EconomicReview 56 (3): 392–416.Lele, Uma, Nicholas Van de Walle, <strong>and</strong> Mathur<strong>in</strong> Gbetiobouo. 1989. “<strong>Cotton</strong> <strong>in</strong> <strong>Africa</strong>:An Analysis <strong>of</strong> Differences <strong>in</strong> <strong>Performance</strong>.” MADIA Discussion Paper No. 7, WorldBank, Wash<strong>in</strong>gton, DC.Maro, W., <strong>and</strong> C. Poulton. 2005. “Tanzania Country Report: 2003/04 Production Season.”Report produced for the Competition <strong>and</strong> Coord<strong>in</strong>ation <strong>in</strong> <strong>Cotton</strong> MarketSystems <strong>of</strong> Southern <strong>and</strong> Eastern <strong>Africa</strong> Project, Wye, Imperial College, London.National <strong>Cotton</strong> Council <strong>of</strong> America. 2002. “Government Roles, Private Actions, <strong>and</strong>the U.S. <strong>and</strong> World <strong>Cotton</strong> Market.” Paper presented at International <strong>Cotton</strong> AdvisoryCommittee Conference on <strong>Cotton</strong> <strong>and</strong> Global Trade Negotiations, July.North, D. 1990. Institutions, Institutional Change, <strong>and</strong> Economic <strong>Performance</strong>. Cambridge,United K<strong>in</strong>gdom: Cambridge University Press.ODI (Overseas Development Institute). 2004. “Developed Country <strong>Cotton</strong> Subsidies<strong>and</strong> Develop<strong>in</strong>g Countries: Unravell<strong>in</strong>g the Impacts on <strong>Africa</strong>.” Brief<strong>in</strong>g Paper, OverseasDevelopment Institute, London.PADECO. 2006. “Strategies for <strong>Cotton</strong> Sector Development <strong>in</strong> West <strong>and</strong> Central <strong>Africa</strong>.”Consultancy report prepared for the World Bank, PADECO, Tokyo.Pan, X., <strong>and</strong> C. Valderrama. 2005. “Higher <strong>Cotton</strong> Price Variability.” Review <strong>of</strong> the World Situation,January-February. International <strong>Cotton</strong> Advisory Committee, Wash<strong>in</strong>gton, DC.Poulton, C., P. Gibbon, B. Hanyani-Mlambo, J. Kydd, W. Maro, M. Nyl<strong>and</strong>sted Larsen,A. Osorio, D. Tschirley, <strong>and</strong> B. Zulu. 2004. “Competition <strong>and</strong> Coord<strong>in</strong>ation <strong>in</strong> Liberalized<strong>Africa</strong>n <strong>Cotton</strong> Market Systems.” World Development 32 (3): 519–36.BIBLIOGRAPHY 215
Poulton, C., <strong>and</strong> B. Hanyani-Mlambo. 2007. “Zimbabwe Country Study.” Backgroundpaper for Comparative Analysis <strong>of</strong> <strong>Organization</strong> <strong>and</strong> <strong>Performance</strong> <strong>of</strong> <strong>Africa</strong>n <strong>Cotton</strong><strong>Sectors</strong>: Learn<strong>in</strong>g from Reform Experience, World Bank, Wash<strong>in</strong>gton, DC.Poulton, C., <strong>and</strong> W. Maro. 2007. “Tanzania Country Study.” Background paper forComparative Analysis <strong>of</strong> <strong>Organization</strong> <strong>and</strong> <strong>Performance</strong> <strong>of</strong> <strong>Africa</strong>n <strong>Cotton</strong> <strong>Sectors</strong>:Learn<strong>in</strong>g from Reform Experience, World Bank, Wash<strong>in</strong>gton, DC.Pursell, G., <strong>and</strong> M. Diop. 1999. “<strong>Cotton</strong> Policies <strong>in</strong> Francophone <strong>Africa</strong>.” Unpublished.International Economics Department, World Bank, Wash<strong>in</strong>gton, DC.Radetzki, Marian. 1985. “Effects <strong>of</strong> a Dollar Appreciation on Dollar Prices <strong>in</strong> InternationalCommodity Markets.” Resources Policy 11 (3): 158–9.Sarris, A. 2000. “Has World Cereal Market Instability Increased?” Food Policy 25 (2):337–50.Str<strong>in</strong>gfellow, Rachel. 1996. “Smallholder Outgrower Schemes <strong>in</strong> Zambia.” Researchreport completed under ODA crops post-harvest programme, project no. AO439.Natural Resources Institute, Chatham, United K<strong>in</strong>gdom.Thirtle, C., L. Beyers, Y. Ismael, <strong>and</strong> J. Piesse. 2003. “Can GM Technologies Help thePoor? The Impact <strong>of</strong> Bt <strong>Cotton</strong> <strong>in</strong> Makhath<strong>in</strong>i Flats, KwaZulu-Natal.” World Development31: 717–32.Tollens, E., <strong>and</strong> C. Gilbert. 2003. “Does Market Liberalisation Jeopardise Export Quality?Cameroonian Cocoa, 1988–2000.” Journal <strong>of</strong> <strong>Africa</strong>n Economies 12 (3): 303–42.Tschirley, D. 2008. “Zambia Country Study.” Background paper for Comparative Analysis<strong>of</strong> <strong>Organization</strong> <strong>and</strong> <strong>Performance</strong> <strong>of</strong> <strong>Africa</strong>n <strong>Cotton</strong> <strong>Sectors</strong>: Learn<strong>in</strong>g fromReform Experience, World Bank, Wash<strong>in</strong>gton, DC.Tschirley, David, <strong>and</strong> Stephen Kabwe. 2007a. “Urgent Need for Effective Public–PrivateCoord<strong>in</strong>ation <strong>in</strong> Zambia’s <strong>Cotton</strong> Sector: Deliberations on the <strong>Cotton</strong> Act.” PolicySynthesis No. 21. Food Security Research Project, Lusaka. Zambia http://www.aec.msu.edu/ agecon/fs2/zambia/<strong>in</strong>dex.htm.———. 2007b. “Zambia Country Study.” Background paper for Comparative Analysis<strong>of</strong> <strong>Organization</strong> <strong>and</strong> <strong>Performance</strong> <strong>of</strong> <strong>Africa</strong>n <strong>Cotton</strong> <strong>Sectors</strong>: Learn<strong>in</strong>g from ReformExperience, World Bank, Wash<strong>in</strong>gton, DC.Tschirley, David, Col<strong>in</strong> Poulton, <strong>and</strong> Duncan Boughton. 2008. “The Many Paths <strong>of</strong><strong>Cotton</strong> Sector Reform <strong>in</strong> East <strong>and</strong> Southern <strong>Africa</strong>: Lessons from a Decade <strong>of</strong> Experience.”In Hang<strong>in</strong>g by a Thread: <strong>Cotton</strong>, Globalization, <strong>and</strong> Poverty <strong>in</strong> <strong>Africa</strong>, ed.William G. Moseley <strong>and</strong> Leslie C. Gray, 123–58. Athens, OH: Ohio University Press.Tschirley, David, Ballard Zulu, <strong>and</strong> James Shaffer. 2004. “<strong>Cotton</strong> <strong>in</strong> Zambia: An Assessment<strong>of</strong> its <strong>Organization</strong>, <strong>Performance</strong>, Current Policy Initiatives, <strong>and</strong> Challengesfor the Future.” Work<strong>in</strong>g Paper 10, Zambia Food Security Research Project, Lusaka.http://www.aec.msu.edu/agecon/fs2/zambia/ research.htm.United States. 1990. “<strong>Cotton</strong> Program: The Market<strong>in</strong>g Loan Has Not Worked: Report tothe Honorable David Pryor, United States Senate.” Wash<strong>in</strong>gton, DC: GovernmentPr<strong>in</strong>t<strong>in</strong>g Office.———. 1995. “<strong>Cotton</strong> Program: Costly <strong>and</strong> Complex Government Program Needs toBe Reassessed: Report to the Honorable Richard K. Armey, House <strong>of</strong> Representatives.”Wash<strong>in</strong>gton, DC: Government Pr<strong>in</strong>t<strong>in</strong>g Office.Valdès, A., <strong>and</strong> W. Foster. 2003. “Special Safeguards for Develop<strong>in</strong>g Countries: A Proposalfor WTO Negotiations.” World Trade Review 2 (1): 5–31.Williamson, O. E. 1985. The Economic Institutions <strong>of</strong> Capitalism. New York: The FreePress.216 BIBLIOGRAPHY
World Bank. 2007. Strategies for <strong>Cotton</strong> <strong>in</strong> West <strong>and</strong> Central <strong>Africa</strong>: Enhanc<strong>in</strong>g Competitiveness<strong>in</strong> the “<strong>Cotton</strong>-4” - Ben<strong>in</strong>, Burk<strong>in</strong>a Faso, Chad, <strong>and</strong> Mali. Wash<strong>in</strong>gton, DC:World Bank.Yanggen, David, Valerie Kelly, Thomas Reardon, <strong>and</strong> Anwar Naseem. 1998. “Incentivesfor Fertilizer Use <strong>in</strong> Sub-Saharan <strong>Africa</strong>: A Review <strong>of</strong> Empirical Evidence on FertilizerResponse <strong>and</strong> Pr<strong>of</strong>itability.” MSU International Development Work<strong>in</strong>g PaperNo. 70, Michigan State University, East Lans<strong>in</strong>g, MI.BIBLIOGRAPHY 217
INDEXBoxes, figures, notes, <strong>and</strong> tables are <strong>in</strong>dicated by b, f, n, <strong>and</strong> t, respectively.affiliated g<strong>in</strong>ners, 24–26, 166–67<strong>Africa</strong>, sub-Saharan (SSA), cottonsectors <strong>in</strong>. See cotton sectors <strong>in</strong>SSAAgence Française de Développement,37Albar637, 40Am<strong>in</strong>, Idi, 39animal traction technology, 120, 123,127, 131, 132, 137, 147Association for Strengthen<strong>in</strong>gAgricultural Research <strong>in</strong> Eastern<strong>and</strong> Central <strong>Africa</strong>, 107Australia, 12, 50b, 108Baffes, John, 11, 65Bank <strong>of</strong> Central <strong>Africa</strong>n States(BEAC), 17bBen<strong>in</strong>atomization <strong>of</strong> supply <strong>in</strong>, 206n26CDFT’s withdrawal from, 207n31CFA exchange rate, 17–18bhistorical background <strong>and</strong> recentevolution <strong>of</strong> cotton sector <strong>in</strong>,34–37<strong>in</strong>clusion <strong>in</strong> study, xxv, 6, 7f<strong>in</strong>put credit <strong>and</strong> extension <strong>in</strong>,207n32market<strong>in</strong>g <strong>of</strong> cotton from, 25oil <strong>and</strong> cake markets, 27t, 98t,101, 102prices <strong>and</strong> pric<strong>in</strong>g system <strong>in</strong>, 67t, 70tproductivity <strong>in</strong>, 209n71quality control <strong>in</strong>, 88t, 90reforms <strong>in</strong>, 207n34statistical tables, 182–83ton subsidies to cotton farmers, 4, 21<strong>in</strong> typology <strong>of</strong> SSA cotton sector, xxv,xxvif, xxvii, 48–49, 48fbiosafety issues, 171Boughton, Duncan, 105, 117Brazil, 4, 12, 21, 50b, 108Bretton Woods Agreement, 17bBt cotton, 106, 170–71, 211n92Burk<strong>in</strong>a FasoBt cotton stra<strong>in</strong>s <strong>in</strong>, 171219
CFA exchange rate, 17–18b, 19fcompany cost efficiency <strong>in</strong>, 139, 141t,142f, 143f, 144focus group discussions by farmertype, methodology for, 134,135, 136, 137historical background <strong>and</strong> recentevolution <strong>of</strong> cotton sector <strong>in</strong>,33–38<strong>in</strong>clusion <strong>in</strong> study, xxv, 6, 7f<strong>in</strong>put credit <strong>and</strong> extension <strong>in</strong>, 74,75–76, 82t, 207n32macroeconomic impact <strong>of</strong> cottonsector <strong>in</strong>, 147, 148–49t,150f, 151tmarket<strong>in</strong>g <strong>of</strong> cotton from, 25oil <strong>and</strong> cake markets, 27t, 97, 98t, 99,101–3, 161overall competitiveness, 146f, 163performance <strong>and</strong> structure <strong>of</strong> sector,l<strong>in</strong>k between, xxviii, 161, 163prices <strong>and</strong> pric<strong>in</strong>g system <strong>in</strong>, 66,67t, 70tproductivity, 121f, 205n8, 208n48,209n71quality control <strong>in</strong>, 88t, 90research <strong>in</strong>, 106, 108treturns to farmers, 123f, 124–26t,127, 129f, 130–31, 133tstatistical tables, 184–85ton subsidies to cotton farmers,4, 21susta<strong>in</strong>ability, governance, <strong>and</strong>management <strong>of</strong> cotton sector,improv<strong>in</strong>g, 172threats to macroeconomic stability<strong>in</strong>, 4<strong>in</strong> typology <strong>of</strong> SSA cotton sector, xxv,xxvif, 48f, 49, 53, 175, 176byproducts. See oil <strong>and</strong> cake marketsC4 (<strong>Cotton</strong>-4) countries, xiv, 4, 21cake <strong>and</strong> oil markets. See oil <strong>and</strong> cakemarketsCameroonCFA exchange rate, 17bcompany cost efficiency <strong>in</strong>, 139, 141t,142f, 143f, 145farmer type, methodology for,136, 137historical background <strong>and</strong> recentevolution <strong>of</strong> cotton sector <strong>in</strong>,32–37<strong>in</strong>clusion <strong>in</strong> study, xxv, 6, 7f<strong>in</strong>put credit <strong>and</strong> extension <strong>in</strong>,74–75, 82tmacroeconomic impact <strong>of</strong> cottonsector <strong>in</strong>, 148–49t, 150f, 151tmarket<strong>in</strong>g <strong>of</strong> cotton from, 25oil <strong>and</strong> cake markets, 26, 27t, 97, 98t,99, 102overall competitiveness, 145, 146f,147, 163performance <strong>and</strong> structure <strong>of</strong> sector,l<strong>in</strong>k between, 163prices <strong>and</strong> pric<strong>in</strong>g system <strong>in</strong>, 66, 67t,70t, 72, 207n45productivity, 121fquality control <strong>in</strong>, 88t, 90, 92, 96research <strong>in</strong>, 108treturns to farmers, 123, 123f,124–26t, 128, 129f, 133tstatistical tables, 186–87t<strong>in</strong> typology <strong>of</strong> SSA cotton sector, xxv,xxvif, 48f, 53, 175carded yarns, 22, 216n22Cargill, 42, 78, 79, 92, 95, 100b, 206n24,208n52, 208n61, 209n73,210n85CDF (<strong>Cotton</strong> Development Fund),Tanzania, 76, 110CDO (<strong>Cotton</strong> Development<strong>Organization</strong>), Ug<strong>and</strong>a, 76, 95CDT (<strong>Cotton</strong> Development Trust),Zambia, 110Central <strong>Africa</strong> Economic <strong>and</strong> MonetaryCommunity (CEMAC), 17bCentral <strong>Africa</strong>n Republic, 17bCentral Asia, 12, 13t, 50bCentral Bank <strong>of</strong> West <strong>Africa</strong>n States,17bCentre International de RechercheAgronomique pour leDéveloppement (CIRAD), 32CFA. See Communauté Françaised’Afrique220 INDEX
ChadCFA exchange rate, 17–18bprivatization <strong>of</strong> cotton companies<strong>in</strong>, 36productivity <strong>in</strong>, 209n71on subsidies to cotton farmers, 4, 21<strong>in</strong> typology <strong>of</strong> SSA cotton sector,xxvif, 48fCh<strong>in</strong>aas consumer <strong>of</strong> cotton, 14downstream <strong>in</strong>dustries, <strong>in</strong>tegration<strong>of</strong> cotton sector with, 50bexchange rate, 18, 19fpolicy shifts <strong>in</strong>, 15production <strong>of</strong> cotton <strong>in</strong>, 12productivity, 120subsidies to cotton farmers <strong>in</strong>, xxiv,3, 16, 153support for cotton <strong>in</strong>dustry <strong>in</strong>,206n14CIF (cost, <strong>in</strong>surance, <strong>and</strong> freight) costs,199–201tCIRAD (Centre International deRecherche Agronomique pourle Développement), 32Clark <strong>Cotton</strong>, 42, 78–79, 92, 208n52CMB (<strong>Cotton</strong> Market<strong>in</strong>g Board),Zimbabwe, 40, 60b, 78, 95,110, 130CMDT (Compagnie Malienne deDéveloppement des FibresTextiles), 4, 31–33, 35–36, 106,207n30–31combed yarns, 22, 23t, 216n23Commercial Farmers’ Union, 110Communauté Française d’Afrique(CFA)exchange rate, xxxii, 17–18b, 142franc devaluation <strong>in</strong>, 17–18b, 68,107, 142growth <strong>of</strong> l<strong>in</strong>t production <strong>in</strong>, 4oil <strong>and</strong> cake pric<strong>in</strong>g <strong>in</strong>, 102Compagnie Malienne deDéveloppement des FibresTextiles (CMDT), 4, 31–33,35–36, 106, 207n30–31Companhia Nacional de Algodão,76, 93company performance <strong>and</strong> costefficiency, 139–45, 141t, 142f,143t, 144f, 157t, 162company types, 211n93competitive market systems, 46. See alsoTanzaniacompany cost efficiency <strong>in</strong>, 141t,144–45, 162coord<strong>in</strong>ation <strong>and</strong> competition <strong>in</strong>,46–48<strong>in</strong> decision tree <strong>of</strong> typologies, 46fdynamism <strong>in</strong>, 39, 79–80b, 175expected FOT shares, 65<strong>in</strong>put credit <strong>and</strong> extension <strong>in</strong>,76–77, 81oil <strong>and</strong> cake markets, 99overall competitiveness, 145, 146fperformance <strong>and</strong> structure <strong>of</strong> sector,l<strong>in</strong>k between, 58t, 154,161–64predicted strengths <strong>and</strong> weaknesses,51, 53quality control <strong>in</strong>, 87, 88–89t, 93–96,94–95brealized versus expectedperformance along key<strong>in</strong>dicators, 58tresearch <strong>and</strong>, 109returns to farmers, 133tsusta<strong>in</strong>ability, governance, <strong>and</strong>management <strong>of</strong>, 172way forward for, 178–80competitivenessoverall competitiveness <strong>of</strong> SSAcotton sectors, 145–47, 146f,162–63structure as key factor <strong>in</strong>, xxxi–xxxiiconcentrated market systems, 46. Seealso Zambia; Zimbabwecompany cost efficiency <strong>in</strong>, 141t,144–45, 162coord<strong>in</strong>ation <strong>and</strong> competition <strong>in</strong>,46–48<strong>in</strong> decision tree <strong>of</strong> typologies, 46fdynamism <strong>in</strong>, 39, 79–80bexpected FOT shares, 65expected performance along key<strong>in</strong>dicators, 58tINDEX 221
<strong>in</strong>put credit <strong>and</strong> extension <strong>in</strong>, 77–81,79–81b, 85<strong>in</strong>stability <strong>of</strong>, 79–81boverall competitiveness, 146f, 163performance <strong>and</strong> structure <strong>of</strong> sector,l<strong>in</strong>k between, 154, 160,162–64predicted strengths <strong>and</strong> weaknesses,51, 52tquality control <strong>in</strong>, 87, 88–89t, 92, 93,96, 166research <strong>and</strong>, 109returns to farmers, 133tsusta<strong>in</strong>ability, governance, <strong>and</strong>management <strong>of</strong>, 172way forward for, 177–78Congo, Republic <strong>of</strong>, 17bConseil Ouest et Centre <strong>Africa</strong><strong>in</strong> pourla Recherche et leDéveloppement Agricoles(CORAF), 107, 170contam<strong>in</strong>ated cotton, 23–24contract farm<strong>in</strong>g, 5cooperative unions, 39–40CORAF (Conseil Ouest et Centre<strong>Africa</strong><strong>in</strong> pour la Recherche et leDéveloppement Agricoles),107, 170cost, <strong>in</strong>surance, <strong>and</strong> freight (CIF) costs,199–201tcost efficiency <strong>of</strong> cotton companies,139–45, 141t, 142f, 143t, 144f,157t, 162Côte d’IvoireCFA exchange rate, 17bprivatization <strong>in</strong>, 207n35reforms <strong>in</strong>, 206n11, 207n34seed cotton exported to Burk<strong>in</strong>aFaso, 208n48<strong>in</strong> typology <strong>of</strong> SSA cottonsector, xxvif, 48f, 50b,211n95Cotlook A <strong>in</strong>dex, 22, 23t, 25, 68, 87, 90,91, 93, 96, 145, 165COTONTCHAD, 36COTTCO, 42, 60b, 78, 94b, 95–96,100b, 110–11, 132, 167, 172,208n61, 210n87<strong>Cotton</strong>-4 (C4) countries, xiv, 4, 21. Seealso Ben<strong>in</strong>, Burk<strong>in</strong>a Faso, Chad,Mali<strong>Cotton</strong> Association <strong>of</strong> Zambia, 79<strong>Cotton</strong> Development Fund (CDF),Tanzania, 76, 110<strong>Cotton</strong> Development <strong>Organization</strong>(CDO), Ug<strong>and</strong>a, 76, 95<strong>Cotton</strong> Development Trust (CDT),Zambia, 110<strong>Cotton</strong> Market<strong>in</strong>g Board (CMB),Zimbabwe, 40, 60b, 78, 95,110, 130<strong>Cotton</strong> Research Institute (CRI),Zimbabwe, 110–11cotton sectors <strong>in</strong> SSA, xxiii–xxxiv, 3–9,153–54byproducts. See oil <strong>and</strong> cake marketsconceptual framework for analyz<strong>in</strong>g,xxv–xxvieconomic importance <strong>of</strong>, xiii, xxiii, 3external <strong>in</strong>put requirements, 5–6<strong>in</strong> global context, xxx–xxxi, 11–14,13t. See also <strong>in</strong>ternationalcotton markethistorical background. See historicalbackground <strong>and</strong> recentevolution <strong>of</strong> SSA cottonsectors<strong>in</strong>put credit <strong>and</strong> extension. See <strong>in</strong>putcredit <strong>and</strong> extensionmajor producers by tons <strong>of</strong> l<strong>in</strong>t, 6, 8fmarket context. See market for cottonparameters <strong>of</strong> current study, xxv,6–8, 7fperformance issues. See performance<strong>of</strong> SSA cotton sectorspr<strong>of</strong>itability. See pr<strong>of</strong>itabilityquality. See quality controlreform <strong>of</strong>. See reform <strong>of</strong> SSA cottonsectorsresearch activities, 105–13, 156t,161, 170seed. See seedtypology <strong>of</strong>. See typology <strong>of</strong> SSAcotton sectorsway forward for. See way forward forSSA cotton sectors222 INDEX
Cottrade, 100–101, 100bcredit. See <strong>in</strong>put credit <strong>and</strong> extensionCRI (<strong>Cotton</strong> Research Institute),Zimbabwe, 110–11cross-cutt<strong>in</strong>g challenges. See wayforward for SSA cotton sectorsdecision tree for SSA cotton sectortypologies, 46fdem<strong>and</strong> side <strong>of</strong> market for cotton, 14Développement des Agro-Industries duSud, 76, 93, 99DIAGRIS, 206n24, 207n30Doha Development Agenda, 21downstream <strong>in</strong>dustries, <strong>in</strong>tegration <strong>of</strong>cotton sector with, 50bDunavant, 42, 76, 78–79, 92, 93,206n24, 207n37, 210n85East <strong>and</strong> Southern <strong>Africa</strong> (ESA). Seealso specific countriescompany cost efficiency <strong>in</strong>, 139,140, 142countries <strong>in</strong> study from, xxv, 6, 7fexports from, 12farmer types <strong>in</strong>, 137historical background <strong>and</strong> recentevolution <strong>of</strong> cotton sectors<strong>in</strong>, 38–44macroeconomic impact <strong>of</strong> cottonsectors <strong>in</strong>, 147, 150market<strong>in</strong>g <strong>of</strong> cotton from, 25oil <strong>and</strong> cake markets, 99, 102performance <strong>and</strong> structure <strong>of</strong> sector,l<strong>in</strong>k between, xxix, xxxprices <strong>and</strong> pric<strong>in</strong>g systems <strong>in</strong>, 68, 69t,71–72privatization <strong>of</strong> cotton bus<strong>in</strong>ess <strong>in</strong>,41–42productivity, 118–22, 118f, 210n88quality control <strong>in</strong>, 90reform efforts <strong>in</strong>, xiv, xxiv, 6, 41–44research <strong>in</strong>, 106–7, 110–11returns to farmers, 127, 128,131, 132East Asian f<strong>in</strong>ancial crisis, 16Economic Community <strong>of</strong> West <strong>Africa</strong>nStates, 38efficiencycotton company cost efficiencies,139–45, 141t, 142f, 143t, 144f,157t, 162<strong>of</strong> g<strong>in</strong>n<strong>in</strong>g <strong>in</strong>dustries, 171Environmentally <strong>and</strong> SociallySusta<strong>in</strong>able DevelopmentDepartment (<strong>Africa</strong> Region,World Bank), xiiiEquatorial Gu<strong>in</strong>ea, 17bESA. See East <strong>and</strong> Southern <strong>Africa</strong>Estur, Gérald, 11, 87Europe/European Union (EU)as consumer <strong>of</strong> cotton, 14exchange rate, 153seed export market, 207n28subsidies to cotton farmers <strong>in</strong>, 3, 20bexchange rates <strong>and</strong> cotton prices, xxxii,16–19, 17–18b, 19f, 153exported cottonfrom ESA <strong>and</strong> WCA, 12quality control <strong>and</strong> price <strong>of</strong>, 90–92,91–92fextension services. See <strong>in</strong>put credit <strong>and</strong>extensionexternal <strong>in</strong>put requirements <strong>of</strong> cottonproduction, 5–6family labor, value <strong>of</strong>, 127, 128–30, 130ffarmer associationsglobal examples <strong>of</strong>, 50b<strong>in</strong>put credit <strong>and</strong> extension, 74, 75,76, 79, 81, 85market<strong>in</strong>g strategies <strong>and</strong>, 167<strong>in</strong> WCA, 34–35farmer typemethodology for focus groupdiscussions, 134–37productivity by, 121–22, 121freturns to farmers by, 123–29, 123f,124–26t, 129f, 132farmers, returns to. See returns t<strong>of</strong>armersFédération des Unions de Producteursdu Bén<strong>in</strong> (FUPRO), 34fertilizer, 108, 118–20, 127–28, 137,209n74fiber quality dem<strong>and</strong>s, 21–24, 23tINDEX 223
firm types, 211n93fixed prices, forward sales contracts at,25, 167FOB (free-on-board) price, 66, 70,199–201tfocus group discussions by farmer type,methodology for, 134–37forward sales contracts at fixed prices,25, 167FOT. See free-on-truck (FOT) sharesFrance, 17–18b, 106, 161Francophone <strong>Africa</strong>. See West <strong>and</strong>Central <strong>Africa</strong>, <strong>and</strong> specificFrancophone countriesfree-on-board (FOB) price, 66, 70,199–201tfree-on-truck (FOT) sharescompany cost efficiency <strong>and</strong>, 140–45,143t, 144f, 162cost reduction as priority, 176macroeconomic impact <strong>and</strong>, 147overall competitiveness <strong>and</strong>, 145–47,146fprices <strong>and</strong> pric<strong>in</strong>g systems, 65,68–72, 70tFUPRO (Fédération des Unions deProducteurs du Bén<strong>in</strong>), 34Gabon, 17bgenetically modified (GM) cottonstra<strong>in</strong>s, 12, 15, 169–70,206n12Gergely, Nicolas, 31, 65, 97, 139Germany, 207n37Ghana, xxvif, 48fg<strong>in</strong>n<strong>in</strong>g <strong>in</strong>dustry efficiency, 171g<strong>in</strong>n<strong>in</strong>g outturn ratios (GORs), 111global cotton market. See <strong>in</strong>ternationalcotton marketGM (genetically modified) cottonstra<strong>in</strong>s, 12, 15, 169–70, 206n12GORs (g<strong>in</strong>n<strong>in</strong>g outturn ratios), 111Gossypium barbadense, 22, 216n20Gossypium hirsutum (upl<strong>and</strong> cotton),22governance <strong>of</strong> SSA cotton sectors,improv<strong>in</strong>g, 172–73Greece, 12GTZ, 207n37Gu<strong>in</strong>ea Bissau, 17bherbicides <strong>and</strong> pest controls, 106, 108,127, 128, 169, 209n73,211n90–91historical background <strong>and</strong> recentevolution <strong>of</strong> SSA cotton sectors,31–44<strong>in</strong> ESA, 38–44reform efforts, 34–38, 41–44<strong>in</strong> WCA, 31–38Huileries Cotonnières du Mali(HUICOMA), 99hybrid systems. See also Ug<strong>and</strong>acompany cost efficiency <strong>in</strong>, 140, 141t,145, 162coord<strong>in</strong>ation <strong>and</strong> competition <strong>in</strong>,46–49<strong>in</strong> decision tree <strong>of</strong> typologies, 46fdynamism <strong>in</strong>, 49overall competitiveness, 145, 146freturns to farmers, 133tway forward for, 179ICAC (International <strong>Cotton</strong> AdvisoryCouncil), 101, 107improv<strong>in</strong>g SSA cotton sectors. Seereform <strong>of</strong> SSA cotton sectors;way forward for SSA cottonsectors<strong>in</strong>dependent g<strong>in</strong>ners, 24–26, 167Indiaas consumer <strong>of</strong> cotton, 14downstream <strong>in</strong>dustries, <strong>in</strong>tegration<strong>of</strong> cotton sector with, 50bequipment imported from, 99, 140exchange rate, 18, 19fGM cotton <strong>in</strong>, 206n12production <strong>of</strong> cotton <strong>in</strong>, 12, 14productivity, 120, 170Indonesia, 14<strong>in</strong>put credit <strong>and</strong> extensioncollaboration, regulatory approachfavor<strong>in</strong>g or h<strong>in</strong>der<strong>in</strong>g,81–85<strong>in</strong> competitive market sectors,76–77, 81224 INDEX
<strong>in</strong> concentrated market systems,77–81, 79–81b, 85farmer associations, 74, 75, 76, 79,81, 85<strong>in</strong> local monopolies, 75–76, 81, 85<strong>in</strong> national monopolies, 74–75, 81performance across sector types,conclusions regard<strong>in</strong>g, 81–85,82–84t, 156t, 160as performance <strong>in</strong>dicator, 56–58,57–58tway forward with, 169, 179–80WCA, expansion <strong>of</strong> cottonproduction <strong>in</strong>, 73Institut de Recherches sur le Coton etles Textiles (IRCT), 32, 106<strong>in</strong>strument test<strong>in</strong>g, 166International <strong>Cotton</strong> Advisory Council(ICAC), 101, 107<strong>in</strong>ternational cotton marketoil <strong>and</strong> cake, 26–27productivity, 118–19, 118–20f,202–3tSSA cotton sectors <strong>in</strong> context <strong>of</strong>,xxx–xxxi, 11–14, 13tstrategies for market<strong>in</strong>g to, 24–26typology, global applicability <strong>of</strong>,50–51bInterpr<strong>of</strong>essional committees (IPCs),36–38IRCT (Institut de Recherches sur leCoton et les Textiles), 32, 106Japan, 14Kazakhstan, 50bKorea, Republic <strong>of</strong>, 14Labaste, Patrick, 117, 153l<strong>in</strong>t, def<strong>in</strong>ed, 21–24L<strong>in</strong>tco, 40, 42, 60b, 172local monopolies, 45, 175–77. See alsoBurk<strong>in</strong>a Faso; Mozambiquecompany cost efficiency <strong>in</strong>, 140, 141t,142–45, 162coord<strong>in</strong>ation <strong>and</strong> competition <strong>in</strong>, 47<strong>in</strong> decision tree <strong>of</strong> typologies, 46fdynamism <strong>in</strong>, 174expected FOT shares, 65<strong>in</strong>put credit <strong>and</strong> extension <strong>in</strong>, 75–76,81, 85<strong>in</strong>ternational applicability <strong>of</strong>typology, 50boverall competitiveness, 145, 146fperformance <strong>and</strong> structure <strong>of</strong> sector,l<strong>in</strong>k between, 58t, 154,160–61, 162predicted strengths <strong>and</strong> weaknesses,51–53, 52tquality control <strong>in</strong>, 87, 88–89t,92–93, 96returns to farmers, 133tsusta<strong>in</strong>ability, governance, <strong>and</strong>management <strong>of</strong>, 172, 173way forward for, 175–77LOMACO, 109Lonhro, 41, 42, 109macroeconomic impact <strong>of</strong> cottonsector, 147–50, 148–49t, 150f,151t, 159tMaliCFA exchange rate, 17bcompany cost efficiency <strong>in</strong>, 141t,142f, 143f, 144, 162focus group discussions by farmertype, methodology for, 134,135, 136, 137historical background <strong>and</strong> recentevolution <strong>of</strong> cotton sector <strong>in</strong>,32–37<strong>in</strong>clusion <strong>in</strong> study, xxv, 6, 7f<strong>in</strong>put credit <strong>and</strong> extension <strong>in</strong>,74–75, 82tmacroeconomic impact <strong>of</strong> cottonsector <strong>in</strong>, 147, 148–49t, 150f,151tmarket<strong>in</strong>g <strong>of</strong> cotton from, 25oil <strong>and</strong> cake markets, 27t, 97, 98t, 99,101–3, 161overall competitiveness, 146f, 147, 163performance <strong>and</strong> structure <strong>of</strong> sector,l<strong>in</strong>k between, xxviii, 161,162, 163prices <strong>and</strong> pric<strong>in</strong>g system <strong>in</strong>, 66,67t, 70tINDEX 225
productivity, 119, 121f, 205n8,209n71quality control <strong>in</strong>, 88t, 90, 92–93research <strong>in</strong>, 106, 108t, 161returns to farmers, 123f, 124–26t,127–31, 129f, 133tseeds, sale <strong>of</strong>, 207n27s<strong>in</strong>gle-channel system, advantages<strong>and</strong> drawbacks <strong>of</strong>, 4statistical tables, 188–89ton subsidies to cotton farmers,4, 21<strong>in</strong> typology <strong>of</strong> SSA cotton sector, xxv,xxvif, 48f, 49, 53, 175management <strong>of</strong> SSA cotton sectors,improv<strong>in</strong>g, 172–73market for cotton, 11–27competition with<strong>in</strong> a produc<strong>in</strong>gcountry, 25–26dem<strong>and</strong> side, 14external factors affect<strong>in</strong>g, 15–21forward sales contracts, 25, 167GM versus organic cotton, 12–14<strong>in</strong>ternational market. See<strong>in</strong>ternational cotton marketoil <strong>and</strong> cake. See oil <strong>and</strong> cake marketspric<strong>in</strong>g. See prices <strong>and</strong> pric<strong>in</strong>gsystemsquality requirements, 21–24, 23tseed market, 26, 207n27–28strategies for market<strong>in</strong>g, 24–26,166–67supply side, 11–14, 13tsynthetic fibers, competition from,14, 21market systems, cotton sectors with,45–46. See also competitivemarket systems; concentratedmarket systemscompany cost efficiency <strong>in</strong>, 141t, 144decision tree for, 46fdynamism <strong>in</strong>, 49Mexico, 101monopolies with s<strong>in</strong>gle-channelmarket<strong>in</strong>g systems, 45–46. Seealso local monopolies; nationalmonopoliesadvantages <strong>and</strong> drawbacks <strong>of</strong>, 4–6company cost efficiency <strong>in</strong>, 140, 141t,142–44decision tree for, 45–46dynamism <strong>in</strong>, 49historical development <strong>and</strong> recentevolution <strong>of</strong>, 31–38oil <strong>and</strong> cake markets, 97overall competitiveness, 145, 146f,147, 162–63research <strong>and</strong>, 109returns to farmers <strong>in</strong>, 132, 133tsusta<strong>in</strong>ability, governance, <strong>and</strong>management <strong>of</strong>, 172<strong>in</strong> WCA, 4–6, 31–34, 65, 74, 145–47,160–64, 172monopsony, 45, 103, 161Monsanto, 171Mozambiquecompany cost efficiency <strong>in</strong>, 139, 140,141t, 142f, 143f, 144, 209n78,210n81focus group discussions by farmertype, methodology for, 134,135, 136–37historical background <strong>and</strong> recentevolution <strong>of</strong> cotton sector <strong>in</strong>,38–41, 43<strong>in</strong>clusion <strong>in</strong> study, xxv, 6, 7f<strong>in</strong>put credit <strong>and</strong> extension <strong>in</strong>, 73,75–76, 78, 81, 83tmacroeconomic impact <strong>of</strong> cottonsector <strong>in</strong>, 148–49t, 150f, 151toil <strong>and</strong> cake markets, 27t, 97, 98t, 99overall competitiveness, 145, 146f,147, 163performance <strong>and</strong> structure <strong>of</strong> sector,l<strong>in</strong>k between, xxx,160–61, 162prices <strong>and</strong> pric<strong>in</strong>g system <strong>in</strong>, 68–71,69t, 70tproductivity, 120f, 121f, 209n72,209n73quality control <strong>in</strong>, 88t, 90, 96reform challenges <strong>in</strong>, xxxiiiresearch <strong>in</strong>, 107–9, 108t, 112returns to farmers, 123f, 124–26t,127, 128, 129f, 131, 132, 133t,162, 163, 209n75226 INDEX
seed export market, 207n28statistical tables, 190–91tsusta<strong>in</strong>ability, governance, <strong>and</strong>management <strong>of</strong> cotton sector,improv<strong>in</strong>g, 172<strong>in</strong> typology <strong>of</strong> SSA cotton sector, xxv,xxvif, 48f, 53, 65, 176, 177Multi-Fiber Agreement, 14National <strong>Cotton</strong> Council (NCC),Zimbabwe, 99, 208n62national monopolies, 45, 175–77. Seealso Cameroon; Malicompany cost efficiency <strong>in</strong>, 141t,142–45, 162coord<strong>in</strong>ation <strong>and</strong> competition <strong>in</strong>, 47<strong>in</strong> decision tree <strong>of</strong> typologies, 46fdynamism <strong>in</strong>, 49expected FOT shares, 65expected performance along key<strong>in</strong>dicators, 58t<strong>in</strong>put credit <strong>and</strong> extension <strong>in</strong>,74–75, 81<strong>in</strong>ternational applicability <strong>of</strong>typology, 50boverall competitiveness, 145–47, 146fperformance <strong>and</strong> structure <strong>of</strong> sector,l<strong>in</strong>k between, 154, 160–63predicted strengths <strong>and</strong> weaknesses,51–53, 52tproductivity <strong>and</strong>, 122quality control <strong>in</strong>, 87, 88–89t,92–93, 96returns to farmers, 133tsusta<strong>in</strong>ability, governance, <strong>and</strong>management <strong>of</strong>, 172–73way forward for, 175–77NCC (National <strong>Cotton</strong> Council),Zimbabwe, 99, 208n62Niger, 17bNigeria, 94–95bNyanza Cooperative Union, 39OECD (Organisation for EconomicCo-operation <strong>and</strong>Development), xiv, xxiv, 16, 153oil <strong>and</strong> cake markets, 97–104conclusions regard<strong>in</strong>g, 103–4domestic markets, 27t<strong>in</strong>ternational market, 26–27as performance <strong>in</strong>dicators, 57–58t, 61performance <strong>of</strong>, 101–3, 157t, 161prices, 101–3structure <strong>and</strong> organization <strong>of</strong>,97–101, 98ttariff protections on edible oils,101, 103typology <strong>of</strong> SSA cotton sectors <strong>and</strong>,57–58t, 60–61vertical <strong>in</strong>tegration with cottong<strong>in</strong>n<strong>in</strong>g <strong>in</strong>dustry, 99–100way forward for, 167–68on call pric<strong>in</strong>g, 25, 167OPPC (Organisation des Producteursde Coton du Cameroun), 34, 74organic cotton market, 12–14organic fertilizer, use <strong>of</strong>, 108Organisation des Producteurs de Cotondu Cameroun (OPPC), 34, 74Organisation for EconomicCo-operation <strong>and</strong> Development(OECD), xiv, xxiv, 16, 153organization. See structure <strong>and</strong>organizationoutgrower schemes, 5overall competitiveness <strong>of</strong> SSA cottonsectors, 145–47, 146f, 162–63Pakistan, 12, 14, 120passbook system, Tanzania, 77, 128path dependency <strong>in</strong> sector structure,154, 175, 210n83performance contracts, 32–33performance <strong>of</strong> SSA cotton sectors,154–64company performance <strong>and</strong> costefficiency, 139–45, 141t, 142f,143t, 144f, 157t, 162competitiveness <strong>and</strong> susta<strong>in</strong>ability,structure as key factor <strong>in</strong>,xxxi–xxxiiexpected versus realized performanceacross key <strong>in</strong>dicators, 155–59t<strong>in</strong>put credit <strong>and</strong> extension acrosssector types, 81–85, 82–84t,156t, 160INDEX 227
key <strong>in</strong>dicators, 56–58, 57–58t,155–59tmacroeconomic impact, 147–50,148–49t, 150f, 151t, 159toil <strong>and</strong> cake markets, 101–3,157t, 161overall competitiveness, 145–47,146f, 162–63structure, performance factorsbeyond, 59–60bstructure <strong>and</strong> performance <strong>of</strong> sector,l<strong>in</strong>k between, xxvii–xxx,54–58, 55f, 57–58t, 154,161–64pest controls <strong>and</strong> herbicides, 106, 108,127, 128, 169, 209n73,211n90–91Plexus, 76, 93, 206n24policy considerations. See also wayforward for SSA cottonsectorsfor national monopolies, 163oil <strong>and</strong> cake markets, vertical<strong>in</strong>tegration with cottong<strong>in</strong>n<strong>in</strong>g <strong>in</strong>dustry, 99–100subsidies, policy shifts <strong>in</strong> U.S. <strong>and</strong>Ch<strong>in</strong>a <strong>and</strong>, 15Poulton, Col<strong>in</strong>, 31, 45, 87, 97, 105,117, 153prices <strong>and</strong> pric<strong>in</strong>g systems, 65–72conclusions regard<strong>in</strong>g, 71–72elasticities <strong>in</strong> price transmission,306n14<strong>in</strong> ESA, 68, 69t, 71–72exchange rates, xxxii, 16–19, 17–18b,19f, 153expected versus realizedperformance, 155t, 160–61external factors affect<strong>in</strong>g, 15–21FOB price, 66, 70, 199–201tforward sales contracts at fixedprices, 25FOT share, 65, 68–72, 70toil <strong>and</strong> cake markets, 101–3on call pric<strong>in</strong>g, 25, 167overall decl<strong>in</strong>e <strong>in</strong> world cottonprices, 12, 14–15, 15fquality control <strong>and</strong> price <strong>of</strong> exportedcotton, 90–92, 91–92fquality issues, 21–24, 23tstatistical tables, 182–98tvolatility <strong>in</strong>, 14–16, 15–16fway forward for, 176<strong>in</strong> WCA, 66–68, 67t, 71–72privatization <strong>of</strong> cotton companies<strong>in</strong> ESA, 41–42<strong>in</strong> WCA, 35–36productivity, 117–22<strong>in</strong> ESA, 118–22, 118fat farm level, 168by farmer type, 121–22, 121f<strong>in</strong> global context, 118–19, 118–20f,202–3tresearch on, 105–6, 111statistical tables, 182–98t, 202–3ttypology <strong>of</strong> sector, associationwith, 122<strong>in</strong> WCA, 105, 118–22, 118f, 120f,182–98t, 202–3tpr<strong>of</strong>itability, 117–37by farmer typemethodology for focus groupdiscussions, 134–37productivity, 121–22, 121freturns to farmers, 123f, 124–26t,127, 128–29, 129f, 132returns to farmers. See returns t<strong>of</strong>armersyield. See productivityquality control, 87–96conclusions regard<strong>in</strong>g, 88–89t, 96contam<strong>in</strong>ated cotton, 23–24expected versus realizedperformance, 155t, 160export prices impacted by, 90–92,91–92ffiber properties, 22–23, 23tmarket dem<strong>and</strong>s regard<strong>in</strong>g,21–24, 23tby typology <strong>of</strong> sector, 87, 88–89t,92–96, 94–95b, 166way forward <strong>in</strong>, 165–66Quton Seed Company, 110–11228 INDEX
ed bollworm, 40reform <strong>of</strong> SSA cotton sectors. See alsoway forward for SSA cottonsectorsdef<strong>in</strong>ed, 8efforts at, xiii–xv, xxiii–xxiv, 6historical background, 34–38, 41–44key elements <strong>in</strong>, xxxi–xxxii, 153possible structural paths for,xxxii–xxxivsusta<strong>in</strong>ability, governance, <strong>and</strong>management, 172typology, dynamism <strong>in</strong>, 175Re<strong>in</strong>hart, 206n24Republic <strong>of</strong> Congo, 17bRepublic <strong>of</strong> Korea, 14research on cotton, 105–13, 156t,161, 170returns to farmers, 122–31alternative scenarios, 130–31conclusions regard<strong>in</strong>g, 131–32, 133t<strong>in</strong> ESA, 127, 128, 131, 132expected versus realizedperformance, 157–58t, 162family labor, value <strong>of</strong>, 127,128–30, 130fby farmer type, 123f, 124–26t, 127,128–29, 129f, 132impact <strong>of</strong> <strong>in</strong>puts on crop budgets,123–28, 124–26tkey <strong>in</strong>dicators, 128–30, 129–30ftypology <strong>of</strong> sector, association with,122, 132, 133t<strong>in</strong> WCA, 127, 128, 129, 131, 132r<strong>in</strong>g spun carded yarns, 22, 216n22r<strong>in</strong>g spun combed yarns, 22, 23t,216n23roller g<strong>in</strong>n<strong>in</strong>g, 41, 49, 81b, 95, 103, 140,141t, 144, 178, 179, 210n79Sav<strong>in</strong>gs <strong>and</strong> Credit Cooperatives,Tanzania, 179saw g<strong>in</strong>n<strong>in</strong>g, 32, 41, 140, 141t, 144,210n79seedbyproducts. See oil <strong>and</strong> cake marketsmarket for, 26, 207n27–28new cultivars, <strong>in</strong>troduction <strong>of</strong>,107, 108townership <strong>of</strong>, 100prices, 101–3Senegal, xxvif, 17b, 48f, 207n35SICOSA, 50bs<strong>in</strong>gle-channel systems. See monopolieswith s<strong>in</strong>gle-channel market<strong>in</strong>gsystemsSN SITEC, 102SODECOTON, 26, 36, 74–75, 123,136, 163SOFITEX, 25, 33, 35, 36, 76, 99, 136,176, 208n48soil fertility, 54, 119, 123, 128, 131, 164,169–70, 179–80, 207n41SONAPRA, 25, 35South <strong>Africa</strong>, 100, 207n28, 211n92South Korea, 14SSA (sub-Saharan <strong>Africa</strong>), cottonsectors <strong>in</strong>. See cotton sectors <strong>in</strong>SSASt<strong>and</strong>ardized Instrument for Test<strong>in</strong>g <strong>of</strong><strong>Cotton</strong>, 24structure <strong>and</strong> organization<strong>of</strong> cotton research, 106–8<strong>of</strong> oil <strong>and</strong> cake markets, 97–101, 98t<strong>of</strong> SSA cotton sectors. See typology<strong>of</strong> SSA cotton sectorssub-Saharan <strong>Africa</strong> (SSA), cotton sectors<strong>in</strong>. See cotton sectors <strong>in</strong> SSAsubsidies, xxiv, 3–4, 15, 16, 19–21,20b, 153supply side <strong>of</strong> market for cotton,11–14, 13tsusta<strong>in</strong>abilityimprov<strong>in</strong>g, 172–73structure as key factor <strong>in</strong>, xxxi–xxxiisynthetic fibers, competition from,14, 21Taiwan (Ch<strong>in</strong>a), 14Tajikistan, 50bTanzaniacompany cost efficiency <strong>in</strong>, 140, 141t,142f, 143f, 144, 145, 162,209n78INDEX 229
focus group discussions by farmertype, methodology for, 134,135–36historical background <strong>and</strong> recentevolution <strong>of</strong> cotton sector <strong>in</strong>,38–43<strong>in</strong>clusion <strong>in</strong> study, xxv, 6, 7f<strong>in</strong>put credit <strong>and</strong> extension <strong>in</strong>,76–77, 84t<strong>in</strong>put supply problem <strong>in</strong>, 205n3macroeconomic impact <strong>of</strong> cottonsector <strong>in</strong>, 148–49t, 150f, 151tmarket<strong>in</strong>g <strong>of</strong> cotton from, 25oil <strong>and</strong> cake markets, 26, 27t, 98t,99–103overall competitiveness, 145,146f, 163passbook system, 77, 128performance <strong>and</strong> behavior factorsbeyond structure, 59–60bperformance <strong>and</strong> structure <strong>of</strong> sector,l<strong>in</strong>k between, xxvii–xxx, 154,161–64prices <strong>and</strong> pric<strong>in</strong>g system <strong>in</strong>, 68–71,69t, 70tproductivity, 120f, 121f, 122quality control <strong>in</strong>, 89t, 90, 93–95,94–95b, 96, 166, 208n61,210n86reform challenges <strong>in</strong>, xxxivreform efforts <strong>in</strong>, xxivresearch <strong>in</strong>, 107–10, 108treturns to farmers, 123f, 124–26t,127–32, 129f, 133t, 209n76Sav<strong>in</strong>gs <strong>and</strong> Credit Cooperatives, 179statistical tables, 192–93tsusta<strong>in</strong>ability, governance, <strong>and</strong>management <strong>of</strong> cotton sector,improv<strong>in</strong>g, 173<strong>in</strong> typology <strong>of</strong> SSA cotton sector, xxv,xxvif, 46, 48–49, 48f, 53,59–60b, 65, 179–80tariff protections on edible oils,101, 103technology transfer, 170–71Thail<strong>and</strong>, 14Togo, 17btoll g<strong>in</strong>n<strong>in</strong>g, 100btransaction cost economics, 99Tschirley, David, 3, 45, 65, 73, 87, 153Turkey, 12, 14, 50bTurkmenistan, 50btypology <strong>of</strong> firms, 211n93typology <strong>of</strong> SSA cotton sectors,xxv–xxvii, 45–61. See alsocompetitive market systems;concentrated market systems;hybrid systems; localmonopolies; nationalmonopoliescompany cost efficiency by, 140, 141tcoord<strong>in</strong>ation <strong>and</strong> competition,46–49decision tree for, 46fdynamism <strong>in</strong>, 48f, 49, 79–80b,174–75global applicability <strong>of</strong>, 50–51bimportance <strong>of</strong>, 153–54<strong>in</strong>put credit <strong>and</strong> extension affectedby. See under <strong>in</strong>put credit <strong>and</strong>extensionlocation <strong>of</strong> countries with<strong>in</strong>,xxvif, 48fmarket-based versus regulatedsectors, 45–46, 46foil <strong>and</strong> cake marketsoverall country typologies <strong>and</strong>,57–58t, 60–61structure <strong>and</strong> organization <strong>of</strong>,97–101, 98toverall competitiveness <strong>of</strong>,145–47, 146tpath dependency <strong>in</strong> sector structure,154, 175, 210n83performance <strong>and</strong> behavior factorsbeyond structure, 59–60bperformance <strong>and</strong> structure <strong>of</strong> sector,l<strong>in</strong>k between, xxvii–xxx,54–58, 55f, 57–58t, 154,161–64predicted strengths <strong>and</strong> weaknesses<strong>of</strong> different types, 51–53, 52tproductivity <strong>and</strong>, 122quality control <strong>and</strong>, 87, 88–89t,92–96, 94–95breform efforts <strong>and</strong>, xxxii–xxxiv230 INDEX
esearch <strong>and</strong>, 108–11returns to farmers <strong>and</strong>, 122,132, 133tsusta<strong>in</strong>ability <strong>and</strong> competitiveness,structure as key factor <strong>in</strong>,xxxi–xxxiiway forward by, 174–80Ug<strong>and</strong>acompany cost efficiency <strong>in</strong>, 140, 141t,142f, 143f, 144–45, 162historical background <strong>and</strong> recentevolution <strong>of</strong> cotton sector <strong>in</strong>,38–43<strong>in</strong>clusion <strong>in</strong> study, xxv, 6, 7f<strong>in</strong>put credit <strong>and</strong> extension <strong>in</strong>, 76–77,81, 84tmacroeconomic impact <strong>of</strong> cottonsector <strong>in</strong>, 148–49t,150f, 151tmarket<strong>in</strong>g <strong>of</strong> cotton from, 25oil <strong>and</strong> cake markets, 27t, 98t,102, 103overall competitiveness, 145,146f, 163performance <strong>and</strong> behavior factorsbeyond structure, 59–60bperformance <strong>and</strong> structure <strong>of</strong> sector,l<strong>in</strong>k between, xxvii–xxviii,xxx, 154, 161, 162, 163prices <strong>and</strong> pric<strong>in</strong>g system <strong>in</strong>, 68–71,69t, 70tproductivity, 120f, 121f, 122,209n74quality control <strong>in</strong>, 89t, 95reform efforts <strong>in</strong>, xxivresearch <strong>in</strong>, 106, 107, 108treturns to farmers, 123f, 124–26t,127, 128, 129f, 132, 133t,209n75statistical tables, 194tsusta<strong>in</strong>ability, governance, <strong>and</strong>management <strong>of</strong> cotton sector,improv<strong>in</strong>g, 172<strong>in</strong> typology <strong>of</strong> SSA cotton sector, xxv,xxvif, xxvii, 48, 48f, 49, 53,59–60b, 65, 179–80, 208n49UK91, 110Union Nationale des Producteurs deCoton du Burk<strong>in</strong>a (UNPCB),34, 76United K<strong>in</strong>gdom, 106United Statesas consumer <strong>of</strong> cotton, 14dollar strength/weakness <strong>and</strong> cottonprices, 16–19, 19f, 153farmer associations <strong>in</strong>, 50bpolicy shifts <strong>in</strong>, 15production <strong>of</strong> cotton <strong>in</strong>, 12–14seed prices <strong>in</strong>, 101subsidies to cotton farmers <strong>in</strong>, 3–4,19, 20b, 21support for cotton <strong>in</strong>dustry <strong>in</strong>,206n14UNPCB (Union Nationale desProducteurs de Coton duBurk<strong>in</strong>a), 34, 76upl<strong>and</strong> cotton (Gossypium hirsutum),22URECOS-CI, 50bU.S. Agency for InternationalDevelopment (USAid), 77Uzbekistan, 50bvalorization <strong>of</strong> seed cotton byproducts.See oil <strong>and</strong> cake marketsVictoria Federation <strong>of</strong> CooperativeUnions, 39WAEMU (West <strong>Africa</strong>n Economic <strong>and</strong>Monetary Union), 17bway forward for SSA cotton sectors,164–80efficiency <strong>of</strong> g<strong>in</strong>n<strong>in</strong>g <strong>in</strong>dustries, 171<strong>in</strong>put credit <strong>and</strong> extension, 169,179–80market<strong>in</strong>g practices <strong>and</strong> strategies,166–67oil <strong>and</strong> cake markets, 167–68prices <strong>and</strong> pric<strong>in</strong>g systems, 176productivity at farm level, 168quality control, 165–66research, 170susta<strong>in</strong>ability, governance, <strong>and</strong>management, improv<strong>in</strong>g,172–73INDEX 231
technology transfer, 170–71by typology <strong>of</strong> sector, 174–80WCA. See West <strong>and</strong> Central <strong>Africa</strong>WECARD (West <strong>and</strong> Central <strong>Africa</strong>nCouncil for AgriculturalResearch <strong>and</strong> Development),107, 170West <strong>Africa</strong>n Economic <strong>and</strong> MonetaryUnion (WAEMU), 17bWest <strong>and</strong> Central <strong>Africa</strong> (WCA). Seealso specific countriesCFA exchange rate, 17–18bcompany cost efficiency <strong>in</strong>, 139, 140,142, 144costs, g<strong>in</strong>n<strong>in</strong>g <strong>and</strong> FOB-to-CIF,199–201tcountries <strong>in</strong> study from, xxv, 6, 7fexports from, 12farmer associations <strong>in</strong>, 34–35farmer types <strong>in</strong>, 137historical background <strong>and</strong> recentevolution <strong>of</strong> cotton sectors<strong>in</strong>, 31–38<strong>in</strong>put credit <strong>and</strong> extension,importance to expansion <strong>of</strong>cotton production, 73IPCs, 36–38macroeconomic impact <strong>of</strong> cottonsectors <strong>in</strong>, 147, 150market<strong>in</strong>g <strong>of</strong> cotton from, 25monopolies <strong>in</strong>, 4–6, 31–34, 65, 74,145–47, 160–64, 172,174–77oil <strong>and</strong> cake markets, 99, 101–2performance <strong>and</strong> structure <strong>of</strong>sector, l<strong>in</strong>k between,xxviii–xxxprices <strong>and</strong> pric<strong>in</strong>g systems <strong>in</strong>, 66–68,67t, 71–72privatization <strong>of</strong> cotton companies <strong>in</strong>,35–36productivity <strong>in</strong>, 105, 118–22, 118f,120f, 182–98t, 202–3tquality control <strong>in</strong>, 90reform efforts <strong>in</strong>, xiv, xxiv, 6research <strong>in</strong>, 106–7, 111, 112returns to farmers, 127, 128, 129,131, 132West <strong>and</strong> Central <strong>Africa</strong>n Council forAgricultural Research <strong>and</strong>Development (WECARD),107, 170World Bankbiosafety project, 171Environmentally <strong>and</strong> SociallySusta<strong>in</strong>able DevelopmentDepartment (<strong>Africa</strong> Region),xiiiworld cotton market. See <strong>in</strong>ternationalcotton marketWorld Trade <strong>Organization</strong> (WTO), xiv,4, 21x-<strong>in</strong>efficiency, 207n39yields, productivity <strong>of</strong>. See underpr<strong>of</strong>itabilityZambiaatomization <strong>of</strong> supply <strong>in</strong>, 206n26company cost efficiency <strong>in</strong>, 140, 141t,142f, 143f, 144, 162, 210n79exchange rate, 18focus group discussions by farmertype, methodology for,134, 136historical background <strong>and</strong> recentevolution <strong>of</strong> cotton sector <strong>in</strong>,40–44<strong>in</strong>clusion <strong>in</strong> study, xxv, 6, 7f<strong>in</strong>put credit <strong>and</strong> extension <strong>in</strong>, 73,77–81, 79–81b, 83tmacroeconomic impact <strong>of</strong> cottonsector <strong>in</strong>, 148–49t, 150f, 151toil <strong>and</strong> cake markets, 27t, 98t, 102overall competitiveness, 145,146f, 163performance <strong>and</strong> behavior factorsbeyond structure, 59–60bperformance <strong>and</strong> structure <strong>of</strong> sector,l<strong>in</strong>k between, xxviii, xxix,xxx, 161–64prices <strong>and</strong> pric<strong>in</strong>g system <strong>in</strong>, 68–71,69t, 70tproductivity, 120f, 121f, 122, 209n73,209n74, 210n88232 INDEX
quality control <strong>in</strong>, 89t, 90, 92, 94b,96, 166, 208n56, 210n85reform efforts <strong>in</strong>, xxivresearch <strong>in</strong>, 107, 108t, 110, 112, 161returns to farmers, 123f, 124–26t, 127,128, 129f, 132, 133t, 209n75seed export market, 207n28statistical tables, 195–96tsusta<strong>in</strong>ability, governance, <strong>and</strong>management <strong>of</strong> cotton sector,improv<strong>in</strong>g, 172<strong>in</strong> typology <strong>of</strong> SSA cotton sector, xxv,xxvif, xxvii, 46, 48–49, 48f,53, 59–60b, 65, 177, 178Zimbabwecompany cost efficiency <strong>in</strong>, 140–45,141t, 142f, 143f, 162, 209n78,210n79exchange rate, 18–19focus group discussions by farmertype, methodology for, 134,135, 136, 137historical background <strong>and</strong> recentevolution <strong>of</strong> cotton sector <strong>in</strong>,39–43<strong>in</strong>clusion <strong>in</strong> study, xxv, 6, 7f<strong>in</strong>put credit <strong>and</strong> extension <strong>in</strong>, 75,77–81, 79–81b, 83tmacroeconomic impact <strong>of</strong> cottonsector <strong>in</strong>, 148–49t, 150f, 151tmarket<strong>in</strong>g strategies, 167oil <strong>and</strong> cake markets, 27t, 98t,99–102, 100b, 208n63overall competitiveness, 145,146f, 163performance <strong>and</strong> behavior factorsbeyond structure,59–60bperformance <strong>and</strong> structure <strong>of</strong> sector,l<strong>in</strong>k between, xxviii, xxix,161–64prices <strong>and</strong> pric<strong>in</strong>g system <strong>in</strong>, 68–71,69t, 70t, 207n44productivity, 120f, 121f, 122,209n74quality control <strong>in</strong>, 89t, 90, 94–95b,95–96, 165reform efforts <strong>in</strong>, xxivresearch <strong>in</strong>, 106, 107, 108t,110–12, 161returns to farmers, 123f, 124–26t,127–32, 129f, 133t, 162statistical tables, 197–98tsusta<strong>in</strong>ability, governance, <strong>and</strong>management <strong>of</strong> cotton sector,improv<strong>in</strong>g, 172<strong>in</strong> typology <strong>of</strong> SSA cotton sector,xxv, xxvif, xxvii, 47–49,48f, 53, 59–60b, 65,177, 178INDEX 233
ECO-AUDITEnvironmental Benefits StatementThe World Bank is committed to preserv<strong>in</strong>gendangered forests <strong>and</strong> natural resources.The Office <strong>of</strong> the Publisher has chosen topr<strong>in</strong>t <strong>Organization</strong> <strong>and</strong> <strong>Performance</strong> <strong>of</strong><strong>Cotton</strong> <strong>Sectors</strong> <strong>in</strong> <strong>Africa</strong> on recycled paperwith 30 percent post-consumer waste, <strong>in</strong>accordance with the recommended st<strong>and</strong>ardsfor paper usage set by the Green Press Initiative,a nonpr<strong>of</strong>it program support<strong>in</strong>g publishers<strong>in</strong> us<strong>in</strong>g fiber that is not sourced fromendangered forests. For more <strong>in</strong>formation,visit www.greenpress<strong>in</strong>itiative.org.Saved:• 6 trees• 5 million BTUs <strong>of</strong> totalenergy• 569 lbs. <strong>of</strong> CO 2equivalent <strong>of</strong> netgreenhouse gases• 2,363 gallons <strong>of</strong>waste water• 303 lbs. <strong>of</strong>solid waste
<strong>Cotton</strong> is a rare economic success story <strong>in</strong> Sub-Saharan <strong>Africa</strong>.While the cont<strong>in</strong>ent’s share <strong>of</strong> the world’s agricultural trade fell by abouthalf from 1980 to 2005, its share <strong>of</strong> world cotton exports more than doubled.<strong>Cotton</strong> is a major source <strong>of</strong> foreign exchange earn<strong>in</strong>gs <strong>in</strong> more than 15countries <strong>of</strong> the cont<strong>in</strong>ent <strong>and</strong> is a crucial source <strong>of</strong> <strong>in</strong>come for millions <strong>of</strong>rural people.<strong>Organization</strong> <strong>and</strong> <strong>Performance</strong> <strong>of</strong> <strong>Cotton</strong> <strong>Sectors</strong> <strong>in</strong> <strong>Africa</strong> provides an <strong>in</strong>-depthcomparative analysis <strong>of</strong> the outcomes <strong>of</strong> the reforms that have beenimplemented <strong>in</strong> Sub-Saharan cotton sectors <strong>and</strong> <strong>of</strong> the l<strong>in</strong>kages betweensector organization <strong>and</strong> performance. The book highlights challenges fac<strong>in</strong>gcotton sectors <strong>in</strong> Sub-Saharan <strong>Africa</strong> <strong>and</strong> demonstrates how reform <strong>in</strong> thesectors is the key to susta<strong>in</strong><strong>in</strong>g growth, improv<strong>in</strong>g competitiveness <strong>and</strong>reduc<strong>in</strong>g rural poverty. It provides national <strong>and</strong> regional policy makers witha number <strong>of</strong> recommendations based upon the observable lessons <strong>of</strong> pastreform programs.“The comparative analysis <strong>of</strong> <strong>Organization</strong> <strong>and</strong> <strong>Performance</strong> <strong>of</strong> <strong>Cotton</strong> <strong>Sectors</strong><strong>in</strong> <strong>Africa</strong>: Learn<strong>in</strong>g From Reform Experience provides an empirically based, analyticalassessment <strong>of</strong> the experiences <strong>of</strong> n<strong>in</strong>e countries across Sub-Saharan<strong>Africa</strong> represent<strong>in</strong>g a range <strong>of</strong> cotton sector structures. The report is builtaround a conceptual framework that recognizes the trade<strong>of</strong>fs betweencompetition <strong>and</strong> coord<strong>in</strong>ation.The authors conclude that sector structure has a major <strong>in</strong>fluence onperformance. They note that no s<strong>in</strong>gle structure is unambiguously superiorto all others, but that concentrated structures tend to perform better onaverage. Whether <strong>in</strong> agreement with the conclusion <strong>of</strong> the authors or not,this report is a must-read for all persons with a serious <strong>in</strong>terest <strong>in</strong> an empiricalevaluation <strong>of</strong> the performance <strong>of</strong> cotton <strong>in</strong>dustry structures <strong>in</strong> <strong>Africa</strong>.”— Terry P. Townsend, Executive Director,International <strong>Cotton</strong> Advisory CommitteeISBN 978-0-8213-7770-3SKU 17770