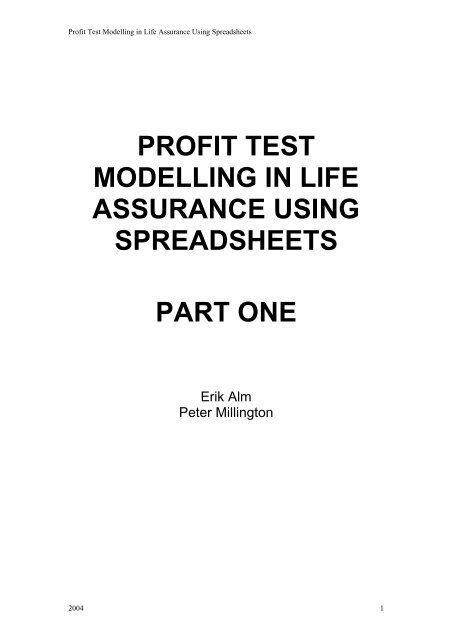
profit test modelling in life assurance using spreadsheets part one
profit test modelling in life assurance using spreadsheets part one
profit test modelling in life assurance using spreadsheets part one

You also want an ePaper? Increase the reach of your titles
YUMPU automatically turns print PDFs into web optimized ePapers that Google loves.
Profit Test Modell<strong>in</strong>g <strong>in</strong> Life Assurance Us<strong>in</strong>g SpreadsheetsPROFIT TESTMODELLING IN LIFEASSURANCE USINGSPREADSHEETSPART ONEErik AlmPeter Mill<strong>in</strong>gton2004 1
Profit Test Modell<strong>in</strong>g <strong>in</strong> Life Assurance Us<strong>in</strong>g SpreadsheetsProfit <strong>test</strong> <strong>modell<strong>in</strong>g</strong> <strong>in</strong> <strong>life</strong> <strong>assurance</strong>1. IntroductionThe aim of this brief is to demonstrate the development of <strong>profit</strong> <strong>test</strong> models <strong>in</strong> <strong>life</strong><strong>assurance</strong> us<strong>in</strong>g <strong>spreadsheets</strong>. We will work through several illustrative examplesstep-by-step and the degree of complexity will <strong>in</strong>crease from <strong>one</strong> example to thenext. We will start with a s<strong>in</strong>gle policy exclud<strong>in</strong>g load<strong>in</strong>gs and gradually work our wayto an entire portfolio of policies where we also <strong>in</strong>clude <strong>in</strong>vestment return, expenses,load<strong>in</strong>gs and maturity benefits. In <strong>part</strong> two we will build more advanced modelswhere we will <strong>in</strong>clude surrenders, paid-ups and mortality risk.It is very common <strong>in</strong> <strong>life</strong> <strong>assurance</strong> that the <strong>life</strong> office has high <strong>in</strong>itial expenses whenwrit<strong>in</strong>g a new policy. This cost could be commission to the sales agent but could alsobe <strong>in</strong>ternal costs for underwrit<strong>in</strong>g or for IT systems. This leads to a negative cash flowor negative result for the <strong>life</strong> office at the <strong>in</strong>ception of a <strong>life</strong> policy.The premiums charged by a <strong>life</strong> office are calculated <strong>in</strong> such a way that the presentvalue of the premiums should be equal to or exceed the present value of the futurebenefits and expenses. If not, the policy is written at an expected loss which, if it isd<strong>one</strong> consistently, would threaten the solvency of the <strong>life</strong> office.Lett<strong>in</strong>g the present value of the premiums be<strong>in</strong>g equal to the present value of thebenefits and expenses is not enough. In order for the <strong>life</strong> office to be able to writenew bus<strong>in</strong>ess, it needs to put up risk capital. For a proprietary company, this is d<strong>one</strong>by shareholders who expect return on their share capital. For a mutual company thisis d<strong>one</strong> by the exist<strong>in</strong>g policyholders, who expect the surplus accumulated <strong>in</strong> thecompany not to be diluted by the writ<strong>in</strong>g of new policies that do not contribute to thissurplus.The <strong>life</strong> office usually sets <strong>in</strong>ternal rules determ<strong>in</strong><strong>in</strong>g the m<strong>in</strong>imum <strong>profit</strong> to beemerg<strong>in</strong>g from a new <strong>life</strong> policy or new block of <strong>life</strong> policies written. One such rulecould be that the present value of the premiums should exceed the present value ofthe benefits by a certa<strong>in</strong> percentage. Another way of express<strong>in</strong>g <strong>profit</strong> requirementsfor a <strong>life</strong> policy is to state when the <strong>in</strong>itial expenses are repaid at a stated <strong>in</strong>ternaldiscount rate. We will ma<strong>in</strong>ly work with this type of <strong>profit</strong> requirement <strong>in</strong> this brief.2. Unit-l<strong>in</strong>ked <strong>assurance</strong>2.1. A policyLet us first start with a unit-l<strong>in</strong>ked policy as an example.In a typical unit-l<strong>in</strong>ked <strong>assurance</strong> policy the f<strong>in</strong>ancial risk is born by the policyholder.This differs from traditional <strong>assurance</strong> where the products typically provideguaranteed benefits at maturity, death or surrender. In unit-l<strong>in</strong>ked <strong>assurance</strong>,premiums are <strong>in</strong>vested <strong>in</strong> a fund of the choice of the policyholder after deductions forexpenses and mortality. The premium reserve will thus (<strong>in</strong> most cases) be def<strong>in</strong>edretrospectively, us<strong>in</strong>g the <strong>in</strong>vestment return earned by the fund.It should be noted that there are unit-l<strong>in</strong>ked policies sold which provide someguarantees. One typical guarantee is a guaranteed benefit of at least the sum ofpremium paid. In our discussion, we will assume that no guarantees are provided.2004 2
Profit Test Modell<strong>in</strong>g <strong>in</strong> Life Assurance Us<strong>in</strong>g SpreadsheetsLetV = premium reserve at year ttP = premium paid at the beg<strong>in</strong>n<strong>in</strong>g of the year ttti = <strong>in</strong>vestment return of the fund dur<strong>in</strong>g the periodAssum<strong>in</strong>g zero <strong>in</strong>itial expenses and no mortality risk the premium reserve at time t isexpressed as:V = V−+ P ) *(1 + i )(1)t(t 1 ttExpression (1) shows the development of the fund <strong>in</strong> the time-discrete case. Thekeen student could here and <strong>in</strong> later examples construct the correspond<strong>in</strong>g formula <strong>in</strong>the time-cont<strong>in</strong>uous case.This type of policy could, just as well as a traditional policy, be studied analytically.We will however <strong>in</strong>stead ma<strong>in</strong>ly study it <strong>in</strong> a more straightforward way <strong>in</strong> aspreadsheet environment. The ma<strong>in</strong> reason for this is that the assumptions used dooften not lead to a nice analytical formula, like the Makeham formula. Anotherimportant advantage of this method is that the student could much easier see whathappens dur<strong>in</strong>g the <strong>life</strong>time of the policy rather than just see<strong>in</strong>g <strong>one</strong> figure be<strong>in</strong>g theresult of a long formula. Also, it is easier <strong>in</strong> a spreadsheet to create ‘what if’situations, i.e. to <strong>test</strong> the effect of changes <strong>in</strong> assumptions and to see how thesechanges affect the policy <strong>in</strong> different periods.We will look at some pr<strong>in</strong>ciple problems and also give some practical tips on how thistype of study is best d<strong>one</strong> <strong>in</strong> a spreadsheet environment.We will generally assume a level premium is paid, i.e.P t= P , 0
Profit Test Modell<strong>in</strong>g <strong>in</strong> Life Assurance Us<strong>in</strong>g SpreadsheetsPolicy durationPremium10 years100 per yearYearPremium1 1002 1003 1004 1005 1006 1007 1008 1009 10010 100One important th<strong>in</strong>g to note here is that all parameters should be stated explicitly <strong>in</strong> any Excelspreadsheet used for this type of calculations. It should always be very easy to change the parametersand study the effects of such change. IfP = 50 for 0
Profit Test Modell<strong>in</strong>g <strong>in</strong> Life Assurance Us<strong>in</strong>g SpreadsheetsWe show the maturity benefit as negative, s<strong>in</strong>ce it represents an outgo for the <strong>life</strong>office.Let us also <strong>in</strong>clude the cash flow to the <strong>life</strong> office:Policy durationPremium paymentPremium10 years10 years100 per yearYear Premium Maturity benefit Cash flow1 100 1002 100 1003 100 1004 100 1005 100 1006 100 1007 100 1008 100 1009 100 10010 100 -1000 -900The premiums the <strong>life</strong> office receives years 1 to 10 must be reserved, s<strong>in</strong>ce it will beneeded to pay for the maturity benefit <strong>in</strong> year 10. The development of the premiumreserve is given by (assum<strong>in</strong>g zero <strong>in</strong>vestment return):V + PorV tt= Vt−1= t ∗ PtThe maturity benefitCd= Vd= d ∗ PC = 0 for t ? d.tCdat time d is given byPolicy durationPremium paymentPremium10 years10 years100 per yearYear Premium Maturity benefit Cash flow Reserve1 100 100 1002 100 100 2003 100 100 3004 100 100 4005 100 100 5006 100 100 6007 100 100 7008 100 100 8009 100 100 90010 100 -1000 -900 0We here use a m<strong>in</strong>us sign for the maturity benefit, s<strong>in</strong>ce it enters the cash flow as negative.The reserve <strong>in</strong>creases with the premiums paid and decreases with the maturitybenefit paid out and we note that it is zero after the maturity of the policy just as wewould expect.2004 5
Profit Test Modell<strong>in</strong>g <strong>in</strong> Life Assurance Us<strong>in</strong>g SpreadsheetsFor unit-l<strong>in</strong>ked bus<strong>in</strong>ess, the reserve (at least <strong>in</strong> simple cases) consists of sav<strong>in</strong>gsbelong<strong>in</strong>g to the policyholder, where the policyholder bears the f<strong>in</strong>ancial risksconnected with the reserve. In such case, the reserve is often called the fund and thecash flow to and from the fund is not <strong>in</strong>cluded when <strong>one</strong> studies the cash flow fromthe <strong>life</strong> office's po<strong>in</strong>t of view. The fund is like a bank account and is treated as such <strong>in</strong>US GAAP, the general accepted account<strong>in</strong>g pr<strong>in</strong>ciples <strong>in</strong> the US.In our simplified example, the cash flow is given byCFt= V t−t1+ P t− C t−V= 0or <strong>in</strong> spreadsheet format:Policy durationPremium paymentPremium10 years10 years100 per yearYear Premium Maturity benefit Fund Cash flow1 100 100 02 100 200 03 100 300 04 100 400 05 100 500 06 100 600 07 100 700 08 100 800 09 100 900 010 100 -1000 0 0In order to avoid hav<strong>in</strong>g different formulae for year <strong>one</strong> and subsequent years, we <strong>in</strong>clude the value ofthe fund at the beg<strong>in</strong>n<strong>in</strong>g of the year and the value of the fund at the end of the year. We have dividedthe table <strong>in</strong>to two <strong>part</strong>s, <strong>one</strong> show<strong>in</strong>g the development of the fund and <strong>one</strong> show<strong>in</strong>g the cash flow to the<strong>life</strong> office.Policy durationPremium paymentPremium10 years10 years100 per yearYear Fund <strong>in</strong> Premium Maturity benefit Fund out Cash flow1 0 100 -100 02 100 100 -200 03 200 100 -300 04 300 100 -400 05 400 100 -500 06 500 100 -600 07 600 100 -700 08 700 100 -800 09 800 100 -900 010 900 100 -1000 0 0For practical reasons, we use the convention that the fund out is shown with a m<strong>in</strong>us sign (it is positivefor the client but is a liability for the <strong>life</strong> office).2004 6
Profit Test Modell<strong>in</strong>g <strong>in</strong> Life Assurance Us<strong>in</strong>g Spreadsheets2.2. Investment returnWe have up to now assumed that the m<strong>one</strong>y <strong>in</strong> the fund will earn no return. In real<strong>life</strong>, this m<strong>one</strong>y is <strong>in</strong>vested <strong>in</strong> f<strong>in</strong>ancial assets, <strong>in</strong> equities or bonds or both. The<strong>in</strong>vestment return <strong>in</strong>cludes dividends on shares and realised or unrealised ga<strong>in</strong>s onshares or bonds. We will assume that the <strong>in</strong>vestment return is fixed at a rate of i tpertime period t, even though the fund value might change cont<strong>in</strong>uously.The fund value and cash flows are given by:V V + P ) ∗ (1 + i )t= (t−1 ttCFCF= ( V− 1+ P ) ∗ (1 + i ) − C −Vort t ttt= Vt− 1+ Pt+ ( Vt−1+ Pt)t∗itt− Ct−VtAssum<strong>in</strong>g a level premium, the maturity benefit at maturity date d is expressed asCd= Vd= P ∗d∑t=1( 1+i)tImportant to remember is that the <strong>in</strong>vestment return varies over time, depend<strong>in</strong>g onthe development of the assets <strong>in</strong> the fund. Let us now assume that the fund will earn5% annual return (after taxes and after <strong>in</strong>ternal fund expenses).Policy durationPremium paymentExpected <strong>in</strong>crease <strong>in</strong> unit valuePremium10 years10 years5% annually100 per yearYear Fund <strong>in</strong> Premium Interest Maturity benefit Fund out Cash flow1 0 100 5 0 -105 02 105 100 10 0 -215 03 215 100 16 0 -331 04 331 100 22 0 -453 05 453 100 28 0 -580 06 580 100 34 0 -714 07 714 100 41 0 -855 08 855 100 48 0 -1 003 09 1 003 100 55 0 -1 158 010 1 158 100 63 -1 321 0 0(In unit–l<strong>in</strong>ked bus<strong>in</strong>ess, the value of the fund is often expressed as a number ofunits, multiplied by the value of a unit. When the underly<strong>in</strong>g assets <strong>in</strong>crease <strong>in</strong> value,the number of units rema<strong>in</strong>s constant while the value of a unit <strong>in</strong>creases. When newpremium is added to the fund, the number of unit <strong>in</strong>creases.)Problem: What <strong>in</strong>terest rate is needed <strong>in</strong> order to provide a maturity benefit of 2000?Answer: 12.3%This problem could be solved by analytical methods, but a more practical and faster way is to use theproblem solv<strong>in</strong>g methods of Excel: Goal Seeker or Solver. (Tools, Goal Seeker).2004 7
Profit Test Modell<strong>in</strong>g <strong>in</strong> Life Assurance Us<strong>in</strong>g Spreadsheets2.3. Initial commissionUp to now, the cash flow for the <strong>life</strong> office has been zero. We shall now start to lookat this cash flow.The most important cost for the <strong>life</strong> office <strong>in</strong> writ<strong>in</strong>g bus<strong>in</strong>ess is the <strong>in</strong>itial expenses,and especially the commission paid to the sales agents, be<strong>in</strong>g ties agents or brokers.This commission is often paid up-front (i.e. directly after a sale is made) and is oftencalculated as a percentage (or per mille) of the total premium volume of the contract.We call the percentage a. The <strong>in</strong>itial commission is thus given byI1 = α ∗ d ∗ P , I t= 0,t ≠ 1This <strong>in</strong>itial commission enters as negative cash flow year <strong>one</strong>. The cash flow formulais now given by:CF V + P + V + P ∗i− C − I −Vt=t− 1 t(t−1t)tttThe above expression consists of two <strong>part</strong>s. The first <strong>part</strong> is <strong>in</strong>flow and outflow of thepremium reserve. This <strong>part</strong> does <strong>in</strong> reality not affect the <strong>life</strong> office as such but ratherthe client fund. The second <strong>part</strong> is the <strong>in</strong>itial commission. Look<strong>in</strong>g at cash flow thataffects the <strong>life</strong> office separately, we have:CF = −tI tLet us assume that the commission is 40 per mille of the total premium. For ourcontract, the total premium is 10*100 = 1000 and the commission is thus 40.tPolicy durationPremium paymentExpected <strong>in</strong>crease <strong>in</strong> unit valuePremiumInitial commission10 years10 years5% annually100 per year4 % of total premiumYear Fund <strong>in</strong> Premium Interest MaturitybenefitFund out CommissionCashflow1 0 100 5 0 -105 -40 -402 105 100 10 0 -215 0 03 215 100 16 0 -331 0 04 331 100 22 0 -453 0 05 453 100 28 0 -580 0 06 580 100 34 0 -714 0 07 714 100 41 0 -855 0 08 855 100 48 0 -1 003 0 09 1 003 100 55 0 -1 158 0 010 1 158 100 63 -1 321 0 0 0In our tables, we show commission and other expenses as negative, s<strong>in</strong>ce they mean outflow for the <strong>life</strong>office.2.4. Premium chargesWe have an outflow from the <strong>life</strong> office <strong>in</strong> the form of the commission. The <strong>life</strong> officewill need to cover these expenses and this is d<strong>one</strong> by <strong>in</strong>troduc<strong>in</strong>g some charges thatthe policyholder has to pay. One way of do<strong>in</strong>g this is to charge a percentage of eachpremium paid to the <strong>life</strong> office. Let us <strong>in</strong>troduce such a charge and let that charge ?be the same as the commission, i.e. 4%.2004 8
Profit Test Modell<strong>in</strong>g <strong>in</strong> Life Assurance Us<strong>in</strong>g SpreadsheetsIntroduc<strong>in</strong>g premium charges, the development of the premium reserve is given by:Vt= ( Vt−1= V + P − P ∗γt+ P ∗ (1 − γ )) ∗ (1 + i ) − C+ ( V + P ∗γ) ∗i− CttttThe maturity benefit isCd= Vd= P ∗ ( 1−γ ) ∗d∑t=1(1 + i)The cash flow to the <strong>life</strong> office isCF = P ∗γ−tI ttPolicy durationPremium paymentExpected <strong>in</strong>crease <strong>in</strong> unit valuePremiumInitial commissionPremium charge10 years10 years5% annually100 per year4 % of total premium4 % of each premiumYearFund<strong>in</strong>ChargePremiumInterestMaturitybenefitFundoutChargeCommissionCashflow1 0 100 -4 5 0 -101 4 -40 -362 101 100 -4 10 0 -207 4 0 43 207 100 -4 15 0 -318 4 0 44 318 100 -4 21 0 -435 4 0 45 435 100 -4 27 0 -558 4 0 46 558 100 -4 33 0 -687 4 0 47 687 100 -4 39 0 -822 4 0 48 822 100 -4 46 0 -964 4 0 49 964 100 -4 53 0 -1 114 4 0 410 1 114 100 -4 61 -1 270 0 4 0 42004 9
Profit Test Modell<strong>in</strong>g <strong>in</strong> Life Assurance Us<strong>in</strong>g SpreadsheetsA <strong>profit</strong> <strong>test</strong><strong>in</strong>g study <strong>in</strong> a spreadsheet environment is normally d<strong>one</strong> vertically the way we have d<strong>one</strong> itup to now. We will however do it horizontally for the rema<strong>in</strong>der of this brief.Policy durationPremium paymentExpected <strong>in</strong>crease <strong>in</strong> unit valuePremiumInitial commissionPremium charge10 years10 years5% annually100 per year4 % of total premium4 % of each premiumYear 1 2 3 4 5 6 7 8 9 10Fund <strong>in</strong> 0 101 207 318 435 558 687 822 964 1 114Premium 100 100 100 100 100 100 100 100 100 100Charge -4 -4 -4 -4 -4 -4 -4 -4 -4 -4Interest 5 10 15 21 27 33 39 46 53 61Maturity 0 0 0 0 0 0 0 0 0 -1 270Fund out -101 -207 -318 -435 -558 -687 -822 -964 -1 114 0Charge 4 4 4 4 4 4 4 4 4 4Comm -40 0 0 0 0 0 0 0 0 0Cash flow -36 4 4 4 4 4 4 4 4 4The premium charge is shown twice, as an expense for the policyholder and as an <strong>in</strong>come for the <strong>life</strong>office.Let us also look at the accumulated cash flow at time t where t
Profit Test Modell<strong>in</strong>g <strong>in</strong> Life Assurance Us<strong>in</strong>g SpreadsheetsThe general formula for calculation of Net Present Value as per the beg<strong>in</strong>n<strong>in</strong>g of year1 isNPV ( X0... Xn)=d∑k = 1Xk∗ vk −1=d −1∑k=0Xk + 1∗ vkwhere1v = 1 + ris the discount factor and r is the discount rate.Xk= cash flow at time k (i.e. at beg<strong>in</strong>n<strong>in</strong>g of year k)One may use the NPV function of Excel to do this calculation.One must decide on an appropriate discount <strong>in</strong>terest rate. This discount rate shouldtake <strong>in</strong>to account the cost of m<strong>one</strong>y for the <strong>life</strong> office. If the commission is f<strong>in</strong>ancedthrough new equity <strong>in</strong> the company, the cost of m<strong>one</strong>y is the return the shareholderswant on this new equity (<strong>in</strong>clud<strong>in</strong>g tax). This might be 15%. If the <strong>life</strong> office has idlefunds which would otherwise be <strong>in</strong>vested, the discount rate should take <strong>in</strong>to accountthe <strong>in</strong>come which would have been received <strong>in</strong> such an alternative <strong>in</strong>vestment, where<strong>one</strong> should <strong>in</strong>clude the risk <strong>in</strong>volved with <strong>in</strong>vest<strong>in</strong>g funds <strong>in</strong>to <strong>in</strong>itial commissions. Ifthe <strong>in</strong>itial commission <strong>in</strong>vestment is funded through re<strong>in</strong>surance, the cost of thisre<strong>in</strong>surance could be used for the discount rate.We will here assume a discount rate of 10%, giv<strong>in</strong>g us a discount factor v=0.90909.Policy duration 10 years Discount rate 10%Premium payment 10 years NPV -13Expected <strong>in</strong>crease <strong>in</strong> unit value 5% annuallyPremium100 per yearInitial commission4 % of total premiumPremium charge4 % of each premiumYear 1 2 3 4 5 6 7 8 9 10Fund <strong>in</strong> 0 101 207 318 435 558 687 822 964 1 114Premium 100 100 100 100 100 100 100 100 100 100Charge -4 -4 -4 -4 -4 -4 -4 -4 -4 -4Interest 5 10 15 21 27 33 39 46 53 61Maturity 0 0 0 0 0 0 0 0 0 -1 270Fund out -101 -207 -318 -435 -558 -687 -822 -964 -1 114 0Charge 4 4 4 4 4 4 4 4 4 4Comm -40 0 0 0 0 0 0 0 0 0Cash flow -36 4 4 4 4 4 4 4 4 4Accumulated -36 -32 -28 -24 -20 -16 -12 -8 -4 0cash flowDiscount1 0.909 0.826 0.751 0.683 0.621 0.564 0.513 0.467 0.424factorDiscounted -36 4 3 3 3 2 2 2 2 2cash flowAccumulateddiscountedcash flow-36 -32 -29 -26 -23 -21 -19 -17 -15 -13We can see that the Accumulated discounted cash flow is equal to –13 at thematurity age. This is the NPV of the cash flow valued at the discount rate of 10%. We2004 11
Profit Test Modell<strong>in</strong>g <strong>in</strong> Life Assurance Us<strong>in</strong>g Spreadsheetsdef<strong>in</strong>e this as our <strong>profit</strong> and our <strong>profit</strong> goal is that the <strong>profit</strong> should be positive (or atleast not negative).The <strong>profit</strong> could also be calculated directly by us<strong>in</strong>g the NPV function <strong>in</strong> Excel. Please note that theExcel formula assumes that all payments are made <strong>in</strong> arrears i.e.at the end of the period <strong>in</strong> question,while we here assume that all payments (except the maturity) are made at the beg<strong>in</strong>n<strong>in</strong>g of the period <strong>in</strong>question. The value calculated by Excel must therefore be multiplied by (1+r), <strong>in</strong> our case 110% <strong>in</strong> orderto arrive at the right answer. Us<strong>in</strong>g the NPV formula <strong>in</strong> Excel gives the answer –12, which multiplied by110% gives –13 as can be found <strong>in</strong> the lower right hand corner of the table above.We see that we must use a premium charge greater than 4% <strong>in</strong> order to break-even,i.e. a <strong>profit</strong> of zero. We can calculate the premium that is required for a break-evensituation by sett<strong>in</strong>g the NPV of future premium charges equal to the <strong>in</strong>itialcommission.This gives:n∑ −t=01γ∗ P ∗ vt= It= α ∗ d ∗ P (n=d).where n=10, d=10, i=5% and a=4%,We get9∑γ ∗ P ∗ vt=09γ ∗∑t=0v101−vγ ∗ = 0.41−vγ ∗ 6 .76 = 0.4tt= α ∗ d ∗ P= α ∗ d = 0.4orThe premium charge that will give break-even isγ = 0.059The same answer could have been found by once aga<strong>in</strong> us<strong>in</strong>g the Goal Seek or Solver.2.6. Portfolios, model po<strong>in</strong>tsWe have up to now looked at a 10-year policy. Let us look at a 5-year policy,assum<strong>in</strong>g an <strong>in</strong>itial commission of 5.9% of the total premium.2004 12
Profit Test Modell<strong>in</strong>g <strong>in</strong> Life Assurance Us<strong>in</strong>g SpreadsheetsPolicy duration 5 years Discount rate 10%Premium payment 5 years NPV 5Expected <strong>in</strong>crease <strong>in</strong> unit value 5% annuallyPremium100 per yearInitial commission4 % of total premiumPremium charge5.9 % of each premiumYear 1 2 3 4 5 6 7 8 9 10Fund <strong>in</strong> 0 99 203 312 427 0 0 0 0 0Premium 100 100 100 100 100 0 0 0 0 0Charge -6 -6 -6 -6 -6 0 0 0 0 0Interest 5 10 15 21 26 0 0 0 0 0Maturity 0 0 0 0 -548 0 0 0 0 0Fund out -99 -203 -312 -427 0 0 0 0 0 0Charge 6 6 6 6 6 0 0 0 0 0Comm -20 0 0 0 0 0 0 0 0 0Cash flow -14 6 6 6 6 0 0 0 0 0Accumulated -14 -8 -2 4 10 10 10 10 10 10cash flowDiscount 1 0.909 0.826 0.751 0.683 0.621 0.564 0.513 0.467 0.424factorDiscounted -14 5 5 4 4 0 0 0 0 0cash flowAccumulateddiscountedcash flow-14 -9 -4 1 5 5 5 5 5 5The table above shows that the 5-year policy gives a <strong>profit</strong> of 5. If we <strong>in</strong>steadcalculate the <strong>profit</strong> of a 15-year policy, we would make a loss of 11. For a 20-yearpolicy, we make a loss of 25. The <strong>in</strong>itial commission formula gets more expensive forlong term policies. Let us therefore assume that the agent gets commission for onlythe first 20 premiums, even if the policy duration is longer. This is a common way toconstruct sales commission scales. The <strong>in</strong>itial commission is given by:I= ∗ m<strong>in</strong>(20; d)∗ P1αLet us now assume that the maturity age is 65 years, x is the age of the assured, (i.e.d=65-x) and that the m<strong>in</strong>imum <strong>in</strong>itial age is 20. Let us also assume that thedistribution of <strong>in</strong>itial age will be even over the age band 20-64 years. We could thencalculate the <strong>profit</strong>ability of each <strong>in</strong>itial age and sum the result over all ages as:NPV =P ∗64∑⎜(∑x=20⎛⎝65−xt=1vt−1⎞∗γ) −α∗ m<strong>in</strong>(20;65 − x)⎟⎠One could <strong>in</strong> pr<strong>in</strong>ciple solve for ? from the above expression by sett<strong>in</strong>g the total tozero to get the break-even situation.64 65−x⎛ t−1⎞NPV = ∑⎜(∑v∗γ) −α∗ m<strong>in</strong>(20;65 − x)⎟ = 0x=20⎝t=1⎠A rearrangement of the terms givesα ∗64∑m<strong>in</strong>(20;65 − x)=64 65−x∑ ∑x= 20x=20 t=1and thenvt − 1∗γ2004 13
Profit Test Modell<strong>in</strong>g <strong>in</strong> Life Assurance Us<strong>in</strong>g Spreadsheetsγα ∗64∑x=20=64m<strong>in</strong>(20;65 − x)65−x∑ ∑x=20 t=1vt−1This could however be a bit complicated to handle. Another problem is that, by us<strong>in</strong>gthis complex formula, <strong>one</strong> can not differentiate the <strong>profit</strong>able from the non-<strong>profit</strong>ablepolicies. One gets a much better view of the situation by study<strong>in</strong>g the differentpolicies <strong>one</strong> by <strong>one</strong>. We study therefore the expression for calculat<strong>in</strong>g the <strong>profit</strong> for acohort of policies65xNPV = ∑ − t−1( v ∗γ ∗ P)−α∗ P ∗ m<strong>in</strong>(20;65 − x)for x = 20, 21,…,64.t=1This is straightforward but could be cumbersome. One common way to simplify thecalculations is to use model po<strong>in</strong>ts. The <strong>profit</strong>s of a 25-year and a 26-year policy arerather equal and the 25-year policy could represent both a 24-year and a 26-yearpolicy. We therefore choose a number of model policies that will represent the rest.Us<strong>in</strong>g this pr<strong>in</strong>ciple and lett<strong>in</strong>g each 5-year age bands be represented by its middlepo<strong>in</strong>t, we thus study65xNPV = ∑ − t−1P ∗γ ∗ ( v ) − P ∗α∗ m<strong>in</strong>(20;65 − x)for x = 22, 27,…,62.t=1This gives:Maturity age 65 years Discount rate 10%Expected <strong>in</strong>crease <strong>in</strong> unit value 5% annuallyPremium 100 per year Max commission years 20Initial commission 4 % of total premium max 80%Premium charge6 % of each premiumAge Policy Profitduration62 3 457 8 352 13 -547 18 -1842 23 -2137 28 -1932 33 -1727 38 -1622 43 -15Total -103This calculation could be d<strong>one</strong> by <strong>test</strong><strong>in</strong>g the policy durations <strong>one</strong> at a time. A quicker way is to use theData Table function <strong>in</strong> Excel which gives all values at the same time. Please note that tables aredynamically updated if this function is not turned off (Tools, Calculation, Automatic except tables), whyhav<strong>in</strong>g large tables might lead to heavy update times.We f<strong>in</strong>d:2004 14
Profit Test Modell<strong>in</strong>g <strong>in</strong> Life Assurance Us<strong>in</strong>g Spreadsheets6265−x⎛t−1⎞NPV = ∑ ⎜100∗ 5.9% ∗ ( ∑v ) −100∗α ∗ m<strong>in</strong>(20;65 − x)⎟ = −103(a)x=22,27... ⎝t=1⎠The result is not good, but it is hard to see how bad it is. We want to know how muchwe need to <strong>in</strong>crease the premium charge <strong>in</strong> order to go break-even. We want to f<strong>in</strong>da k such that the <strong>profit</strong> is equal to zero, i.e.:6265−x⎛t−1⎞NPV = ∑ ⎜100∗ (5.9% + k)∗ ( ∑v) −100∗α ∗ m<strong>in</strong>(20;65 − x)⎟ = 0 (b)x=22,27... ⎝t=1⎠Insert<strong>in</strong>g expression (a) <strong>in</strong> (b) gives6265−x⎛t−1⎞∑ ⎜100(5.9% + k ) ∗ ( ∑v) ⎟ −x=22,27... ⎝t=1 ⎠This then gives64∑x=20...Furtherk64x=20⎛⎜100∗5.9%∗ (⎝65−x∗ ∑ ∑65−x6265 1⎛1 ⎞ ⎛⎜100( ) ⎟ ≈ ⎜100∗ ∗⎝∗ ∗ ∑ ∑−t−k ∑vk vt=1 ⎠ x=22,27... ⎝t=1≈ ≈6465−x⎛− ⎞64t 1NPV ( P)∑x=20103⎜100∗ (⎝∑t=1v) ⎟⎠∑x=20103t−1t=1⎞⎟ = 103⎠t ⎞v ) ⎟ = 103⎠We therefore also <strong>in</strong>clude the net present value of the premiums paid for each policy<strong>in</strong> our table.This givesAge PolicydurationProfit NPV ofpremium62 3 4 27457 8 3 58752 13 -5 78147 18 -18 90242 23 -21 97737 28 -19 1 02432 33 -17 1 05327 38 -16 1 07122 43 -15 1 082Total -103 7 750k=103 =77500.0133The loss is thus -1.33% of the NPV of the total premium. Let us therefore <strong>in</strong>creasethe premium charge with 1.4% to 7.4%:2004 15
Profit Test Modell<strong>in</strong>g <strong>in</strong> Life Assurance Us<strong>in</strong>g SpreadsheetsMaturity age 65 years Discount rate 10%Expected <strong>in</strong>crease <strong>in</strong> unit value 5% annuallyPremium 100 per year Max commission years 20Initial commission 4 % of total premium max 80%Premium charge7.4 % of each premiumAge PolicydurationProfit NPV ofpremium62 3 8 27457 8 11 58752 13 6 78147 18 -5 90242 23 -8 97737 28 -4 1 02432 33 -2 1 05327 38 -1 1 07122 43 0 1 082Total 5 7 750We f<strong>in</strong>d that the portfolio has a break-even po<strong>in</strong>t with a premium charge of 7.4%Let us now assume that we expect to sell more of some policies and less of others.Most of our new clients are expected to be around 35 years and few are 20 or 60years. We <strong>in</strong>clude this <strong>in</strong> our calculation by weight<strong>in</strong>g the different policies by theirexpected sales figures:64 65−x⎛ t−1⎞NPV = P ∗ ∑Wx⎜(∑v∗γ) −α∗ m<strong>in</strong>(20;65 − x)⎟x=20 ⎝ t=1⎠Assume that our portfolio has an average duration of 23 years and has an agedistribution as shown <strong>in</strong> the table below:Age PolicydurationNumber ofpolicies62 3 10057 8 20052 13 30047 18 40042 23 50037 28 40032 33 30027 38 20022 43 100Total 3 0002004 16
Profit Test Modell<strong>in</strong>g <strong>in</strong> Life Assurance Us<strong>in</strong>g SpreadsheetsThis gives the follow<strong>in</strong>g results:PolicydurationNumber ofpoliciesProfit perpolicyNPVpremium perpolicyTotal <strong>profit</strong>Total NPV ofpremium3 100 8 274 824 27 3558 200 11 587 2 285 117 36813 300 6 781 1 746 234 41118 400 -5 902 -2 096 360 86223 500 -8 977 -3 845 488 57728 400 -4 1 024 -1 698 409 48933 300 -2 1 053 -631 315 79138 200 -1 1 071 -155 214 11843 100 0 1 082 5 108 174Total 3 000 -3 565 2 276 146The figures <strong>in</strong> the column Profit per policy are rounded to the nearest <strong>in</strong>teger. When calculat<strong>in</strong>g the total<strong>profit</strong>, non-rounded figures are used.We have here more of the non-<strong>profit</strong>able policies and less of the <strong>profit</strong>able policies.The NPV of the loss is only 0.16% of the NPV of the total premium, why an <strong>in</strong>creaseof the premium charge of 0.2% should be enough to make the portfolio <strong>profit</strong>able. We<strong>in</strong>crease the premium charge to 7.6%.Maturity age 65 years Discount rate 10%Expected <strong>in</strong>crease <strong>in</strong> unit value 5% annuallyPremium 100 per year Max commission years 20Initial commission 4 % of total premium max 80%Premium charge7.6 % of each premiumPolicydurationNumber ofpoliciesProfit perpolicyNPVpremium perpolicyTotal <strong>profit</strong>Total NPV ofpremium3 100 9 274 879 27 3558 200 13 587 2 520 117 36813 300 7 781 2 215 234 41118 400 -3 902 -1 374 360 86223 500 -6 977 -2 868 488 57728 400 -2 1 024 -879 409 48933 300 0 1 053 0 315 79138 200 1 1 071 273 214 11843 100 2 1 082 221 108 174Total 3 000 987 2 276 146As shown <strong>in</strong> the previous table, we have arrived at a small <strong>profit</strong> of 987.In the real world, you might not know the actual age distribution of the portfolio. It istherefore often a good idea to <strong>test</strong> different reasonably realistic age distributions <strong>in</strong>the portfolio and choose the least favourable. In our case, we assume that we will selleither the evenly distributed portfolio or the <strong>one</strong> with the weight on duration 23 andwe choose the latter <strong>one</strong> and thus the premium charge of 7.6%.We discussed <strong>in</strong> section 2.5. the choice of discount rate. The result that we arrive atis dependent on the discount rate chosen.Problem: How would the <strong>profit</strong>ability be with a discount rate of 12%2004 17
Profit Test Modell<strong>in</strong>g <strong>in</strong> Life Assurance Us<strong>in</strong>g SpreadsheetsAnswer: There will be a loss of 0.66% of NPV of total premiums. A high discountmakes it more expensive to have high <strong>in</strong>itial costs.2.7. Fixed costsUp to now, we have only <strong>in</strong>cluded the commissions to the sales agents as expenses.These commissions are def<strong>in</strong>ed to be proportional to premium volume, why it doesnot matter if we have sold small or large policies.Let us now assume that we have an <strong>in</strong>itial fixed expense of 10 for each new policy.The <strong>in</strong>troduction of this new expense leads to a need of <strong>in</strong>crease <strong>in</strong> charges. Onepossibility could be to <strong>in</strong>troduce a policy charge of the same amount as the policyexpense. Another would be to <strong>in</strong>crease the premium charge. We will choose thelatter alternative. We therefore now want to determ<strong>in</strong>e how much we need to<strong>in</strong>crease the premium charge to offset this expense.With a fixed cost, large policies will be more <strong>profit</strong>able than small policies. We will<strong>in</strong>vestigate the effect on a portfolio of policies with different premium. The examplebelow shows the case for <strong>one</strong> policy with a premium of 100.Policy duration 10 years Discount rate 10%Expected <strong>in</strong>crease <strong>in</strong> unit value 5% annually NPV of <strong>profit</strong> -9Premium 100 per year NPV of premium 68Initial commission 4 % of total premium max 80%Internal <strong>in</strong>itial expenses 10 per policy Max commission years 20Premium charge7.6 % of each premiumYear 1 2 3 4 5 6 7 8 9 10Fund <strong>in</strong> 0 97 199 306 418 536 660 790 926 1 070Premium 100 100 100 100 100 100 100 100 100 100Charge -8 -8 -8 -8 -8 -8 -8 -8 -8 -8Interest 5 9 15 20 26 31 38 44 51 58MaturityFund out0 0 0 0 0 0 0 0 0-1220-1070 0-97 -199 -306 -418 -536 -660 -790 -926Charge 8 8 8 8 8 8 8 8 8 8Comm -40 0 0 0 0 0 0 0 0 0Internalexpenses -10 0 0 0 0 0 0 0 0 0Cash flow -42 8 8 8 8 8 8 8 8 8Accumulatedcash flow -42 -35 -27 -20 -12 -4 3 11 18 26Discountfactor 1 0.909 0.826 0.751 0.683 0.621 0.564 0.513 0.467 0.424Discountedcash flow -42 7 6 6 5 5 4 4 4 3Accumulateddiscountedcash flow -42 -35 -29 -23 -18 -14 -9 -5 -2 12004 18
Profit Test Modell<strong>in</strong>g <strong>in</strong> Life Assurance Us<strong>in</strong>g SpreadsheetsIf we do this calculation for different policy premiums and durations, we get:Policy duration x years Discount rate 10%Expected <strong>in</strong>crease <strong>in</strong> unit value 5% annually NPV of <strong>profit</strong> -9Premium 100 per year NPV of premium 68Initial commission 4 % of total premium max 80%Internal <strong>in</strong>itial expenses y per policy Max commission years 20Premium charge7.6 % of each premiumProfitAnnual premiumDuration 10 40 100 250 10003 -9 -6 -1 12 788 -9 -5 3 21 11613 -9 -7 -3 8 6418 -10 -11 -13 -19 -4423 -11 -12 -16 -24 -6728 -10 -11 -12 -15 -3233 -10 -10 -10 -10 -1038 -10 -9 -9 -7 443 -10 -9 -8 -4 12If all policy durations and premiums were evenly distributed, we could just sum up atotal and get –156. Let us now however assume that the policies are expected to bedistributed as follows:10 40 100 250 10003 0.80% 1.60% 1.00% 0.40% 0.20%8 1.60% 3.20% 2.00% 0.80% 0.40%13 2.40% 4.80% 3.00% 1.20% 0.60%18 3.20% 6.40% 4.00% 1.60% 0.80%23 4.00% 8.00% 5.00% 2.00% 1.00%28 3.20% 6.40% 4.00% 1.60% 0.80%33 2.40% 4.80% 3.00% 1.20% 0.60%38 1.60% 3.20% 2.00% 0.80% 0.40%43 0.80% 1.60% 1.00% 0.40% 0.20%As before, we multiply the result for each type of policy with the probability weight ofthat policy <strong>in</strong> order to arrive at the portfolio probability. We thus multiply the <strong>profit</strong>matrix with the distribution matrix and arrive at the follow<strong>in</strong>g result.Profit 10 40 100 250 10003 -0.07 -0.10 -0.01 0.05 0.168 -0.14 -0.16 0.05 0.17 0.4613 -0.22 -0.34 -0.08 0.10 0.3818 -0.33 -0.73 -0.54 -0.30 -0.3523 -0.42 -0.98 -0.79 -0.49 -0.6728 -0.33 -0.70 -0.49 -0.25 -0.2633 -0.24 -0.48 -0.30 -0.12 -0.0638 -0.16 -0.30 -0.17 -0.05 0.0143 -0.08 -0.15 -0.08 -0.02 0.02Total –9.53For the premium, we correspond<strong>in</strong>gly multiply the premium per policy with the weight:2004 19
Profit Test Modell<strong>in</strong>g <strong>in</strong> Life Assurance Us<strong>in</strong>g SpreadsheetsPremium 10 40 100 250 10003 0.22 1.75 2.74 2.74 5.478 0.94 7.51 11.74 11.74 23.4713 1.88 15.00 23.44 23.44 46.8818 2.89 23.10 36.09 36.09 72.1723 3.91 31.27 48.86 48.86 97.7228 3.28 26.21 40.95 40.95 81.9033 2.53 20.21 31.58 31.58 63.1638 1.71 13.70 21.41 21.41 42.8243 0.87 6.92 10.82 10.82 21.63Total 1074The <strong>profit</strong> <strong>in</strong> relation to the premium is -9.53/1074 = –0.9%. Let us try with a premiumcharge of 8.5%. We get a <strong>profit</strong> very close to zero as expected. We have thus foundour break-even po<strong>in</strong>t.2004 20