Tsunami Report(Page 21-40)
Tsunami Report(Page 21-40) Tsunami Report(Page 21-40)
FIG 17. Observed Tide at different Ports showing the sea level changes on December 26, 2004.Red arrow indicates the approximate time of occurrence of the earthquake off Sumatra andthe blue arrow indicates the time of arrival of the disturbance at respective places.(Courtesy: Survey of India and NIO).28
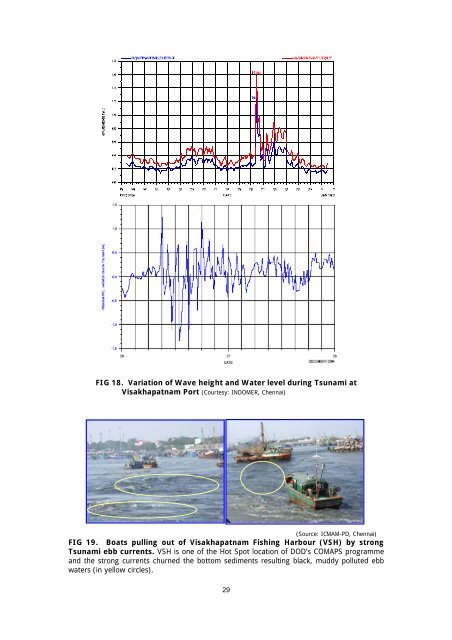
FIG 18. Variation of Wave height and Water level during Tsunami atVisakhapatnam Port (Courtesy: INDOMER, Chennai)(Source: ICMAM-PD, Chennai)FIG 19. Boats pulling out of Visakhapatnam Fishing Harbour (VSH) by strongTsunami ebb currents. VSH is one of the Hot Spot location of DOD’s COMAPS programmeand the strong currents churned the bottom sediments resulting black, muddy polluted ebbwaters (in yellow circles).29
- Page 1 and 2: 4.1.1 Diving Indian plateThe earthq
- Page 3 and 4: Shallow focus earthquakes measuring
- Page 5 and 6: Tsunami energyFIG 14. Simulation of
- Page 7: The Tide gauge data from major port
- Page 11 and 12: Subsequently a series of waves hit
- Page 13 and 14: TABLE 3. Distribution of Bacterial
- Page 15 and 16: 5.3.3 South of ChennaiFIG 24.The pr
- Page 17 and 18: (Courtesy: NRSA)FIG 26. Satellite i
- Page 19 and 20: Fishing HarbourAgricultural LandsBe
FIG 18. Variation of Wave height and Water level during <strong>Tsunami</strong> atVisakhapatnam Port (Courtesy: INDOMER, Chennai)(Source: ICMAM-PD, Chennai)FIG 19. Boats pulling out of Visakhapatnam Fishing Harbour (VSH) by strong<strong>Tsunami</strong> ebb currents. VSH is one of the Hot Spot location of DOD’s COMAPS programmeand the strong currents churned the bottom sediments resulting black, muddy polluted ebbwaters (in yellow circles).29


