Tsunami Report(Page 21-40)
Tsunami Report(Page 21-40)
Tsunami Report(Page 21-40)

You also want an ePaper? Increase the reach of your titles
YUMPU automatically turns print PDFs into web optimized ePapers that Google loves.
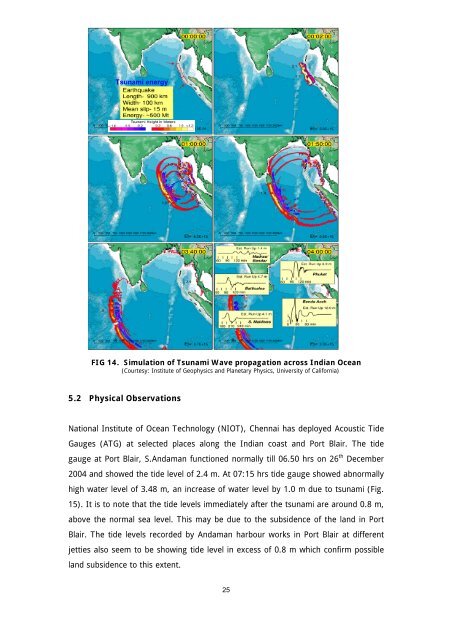
<strong>Tsunami</strong> energyFIG 14. Simulation of <strong>Tsunami</strong> Wave propagation across Indian Ocean(Courtesy: Institute of Geophysics and Planetary Physics, University of California)5.2 Physical ObservationsNational Institute of Ocean Technology (NIOT), Chennai has deployed Acoustic TideGauges (ATG) at selected places along the Indian coast and Port Blair. The tidegauge at Port Blair, S.Andaman functioned normally till 06.50 hrs on 26 th December2004 and showed the tide level of 2.4 m. At 07:15 hrs tide gauge showed abnormallyhigh water level of 3.48 m, an increase of water level by 1.0 m due to tsunami (Fig.15). It is to note that the tide levels immediately after the tsunami are around 0.8 m,above the normal sea level. This may be due to the subsidence of the land in PortBlair. The tide levels recorded by Andaman harbour works in Port Blair at differentjetties also seem to be showing tide level in excess of 0.8 m which confirm possibleland subsidence to this extent.25