Comparison between 1D and 2D models to analyze the dam break
Comparison between 1D and 2D models to analyze the dam break
Comparison between 1D and 2D models to analyze the dam break
- No tags were found...

Create successful ePaper yourself
Turn your PDF publications into a flip-book with our unique Google optimized e-Paper software.
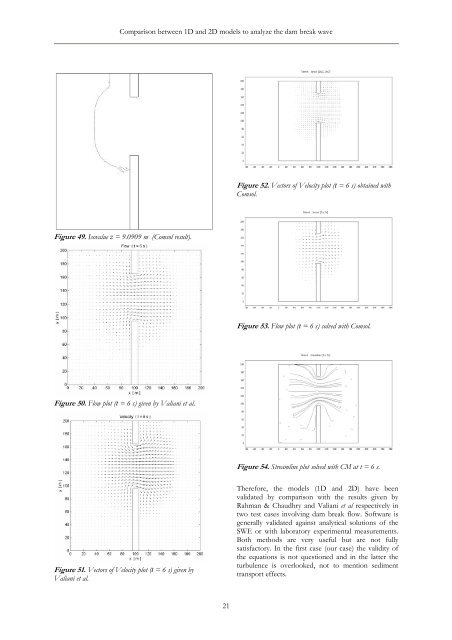
<strong>Comparison</strong> <strong>between</strong> <strong>1D</strong> <strong>and</strong> <strong>2D</strong> <strong>models</strong> <strong>to</strong> <strong>analyze</strong> <strong>the</strong> <strong>dam</strong> <strong>break</strong> waveFigure 52. Vec<strong>to</strong>rs of Velocity plot (t = 6 s) obtained withComsol.Figure 49. Isovalue z = 9.0909 m (Comsol result).Figure 53. Flow plot (t = 6 s) solved with Comsol.Figure 50. Flow plot (t = 6 s) given by Valiani et al.Figure 54. Streamline plot solved with CM at t = 6 s.Figure 51. Vec<strong>to</strong>rs of Velocity plot (t = 6 s) given byValiani et al.Therefore, <strong>the</strong> <strong>models</strong> (<strong>1D</strong> <strong>and</strong> <strong>2D</strong>) have beenvalidated by comparison with <strong>the</strong> results given byRahman & Chaudhry <strong>and</strong> Valiani et al respectively intwo test cases involving <strong>dam</strong> <strong>break</strong> flow. Software isgenerally validated against analytical solutions of <strong>the</strong>SWE or with labora<strong>to</strong>ry experimental measurements.Both methods are very useful but are not fullysatisfac<strong>to</strong>ry. In <strong>the</strong> first case (our case) <strong>the</strong> validity of<strong>the</strong> equations is not questioned <strong>and</strong> in <strong>the</strong> latter <strong>the</strong>turbulence is overlooked, not <strong>to</strong> mention sedimenttransport effects.21