- Page 1:
CITY OF SAGINAW, MICHIGANAPPROVEDBU
- Page 5 and 6:
CITY OF SAGINAWTABLE OF CONTENTSPag
- Page 7 and 8:
CITY OF SAGINAW1315 South Washingto
- Page 9 and 10:
FY 2013 Budget HighlightsGeneral Fu
- Page 11 and 12: Safety Funding/Planning/Sustainabil
- Page 13 and 14: City of Saginaw -Goals and Objectiv
- Page 15 and 16: HOW TO USE THE BUDGET DOCUMENTThis
- Page 17 and 18: CITY OF SAGINAWMANAGEMENT TEAMDarne
- Page 19 and 20: CITY OF SAGINAWORGANIZATIONAL STRUC
- Page 21 and 22: in compliance with federal and stat
- Page 23 and 24: CITY OF SAGINAW2012/2013 APPROVED B
- Page 25 and 26: approved by City Council. In all ot
- Page 27 and 28: What Neighborhoods Were Meant to Be
- Page 29: They include natural and man-made f
- Page 32 and 33: BUDGET AND FINANCESCOPE OF THE BUDG
- Page 34 and 35: A percent of 2012 revenues are dete
- Page 36 and 37: Chapter VII, Section 47 Budget Cont
- Page 38 and 39: Boat Launch Operation Fund:This fun
- Page 40 and 41: Motor Pool Operations Fund:This fun
- Page 42 and 43: RESOURCE ALLOCATION2012/2013 APPROV
- Page 44 and 45: mills. For FY 2013, the city will r
- Page 46 and 47: INTERNAL SERVICE FUNDSThe total Int
- Page 48 and 49: GENERAL FUNDSUMMARY OF REVENUES2012
- Page 50 and 51: SUMMARY OF EXPENDITURESGENERAL FUND
- Page 52 and 53: ealized through the reduction of op
- Page 54 and 55: ENTERPRISE FUNDSThe total Enterpris
- Page 56 and 57: GENERAL FUND2010/2011 2011/2012 201
- Page 58 and 59: Summary of RevenuesCITY OF SAGINAWS
- Page 60 and 61: EXPENDITURES BY CATEGORY ANALYSIS20
- Page 64: UNASSIGNED FUND BALANCE ANALYSIS201
- Page 67 and 68: RESOURCE ALLOCATION2012/2013 APPROV
- Page 69 and 70: General Fund RevenuesTotal 2012/201
- Page 71 and 72: STATE SHARED REVENUESThe City of Sa
- Page 73 and 74: The chart above reveals that the am
- Page 75 and 76: REVENUE ANALYSIS DETAIL2012/2013 AP
- Page 77 and 78: REVENUE ANALYSIS DETAIL2012/2013 AP
- Page 79 and 80: REVENUE ANALYSIS DETAIL2012/2013 AP
- Page 81 and 82: GENERAL FUND REVENUE AND EXPENDITUR
- Page 83 and 84: GENERAL GOVERNMENT
- Page 85 and 86: GENERAL FUND’S OFFICES OF GENERAL
- Page 87 and 88: EXPENDITURE ANALYSIS DETAIL2012/201
- Page 89 and 90: EXPENDITURE ANALYSIS DETAIL2012/201
- Page 91 and 92: EXPENDITURE ANALYSIS DETAIL2012/201
- Page 94 and 95: DEPARTMENT OF FISCAL SERVICES
- Page 96 and 97: DEPARTMENT OF FISCAL SERVICESEXPEND
- Page 98 and 99: EXPENDITURE ANALYSIS DETAIL2012/201
- Page 100 and 101: EXPENDITURE ANALYSIS DETAIL2012/201
- Page 102 and 103: EXPENDITURE ANALYSIS DETAIL2012/201
- Page 104 and 105: CITY OF SAGINAWCOMMUNITY PUBLIC SAF
- Page 106 and 107: SUMMARY OF POSITIONS2008/09 2009/10
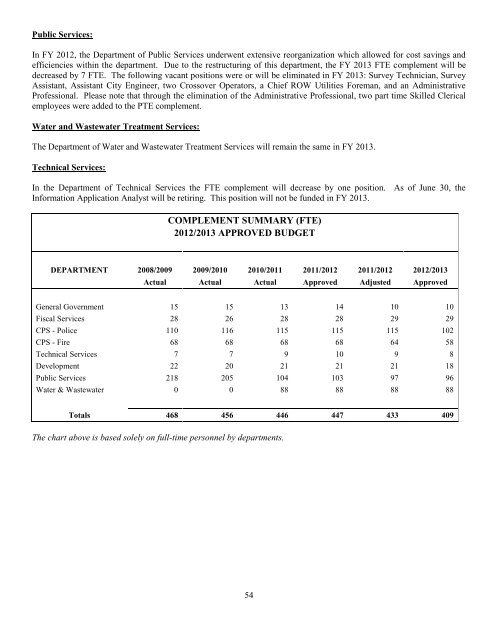
- Page 108 and 109: EXPENDITURE ANALYSIS DETAIL2012/201
- Page 110 and 111: EXPENDITURE ANALYSIS DETAIL2012/201
- Page 112 and 113:
EXPENDITURE ANALYSIS DETAIL2012/201
- Page 114 and 115:
COMMUNITY PUBLIC SAFETY - FIREEXPEN
- Page 116 and 117:
EXPENDITURE ANALYSIS DETAIL2012/201
- Page 118:
EXPENDITURE ANALYSIS DETAIL2012/201
- Page 121 and 122:
CITY OF SAGINAWDEPARTMENT OF DEVELO
- Page 123 and 124:
EXPENDITURE ANALYSIS DETAIL2012/201
- Page 125:
EXPENDITURE ANALYSIS DETAIL2012/201
- Page 128 and 129:
CITY OF SAGINAWDEPARTMENT OF PUBLIC
- Page 130 and 131:
SUMMARY OF POSITIONS2008/09 2009/10
- Page 132 and 133:
EXPENDITURE ANALYSIS DETAIL2012/201
- Page 134 and 135:
EXPENDITURE ANALYSIS DETAIL2012/201
- Page 136:
EXPENDITURE ANALYSIS DETAIL2012/201
- Page 139:
OTHER GENERAL FUNDEXPENDITURE BUDGE
- Page 142 and 143:
CITY OF SAGINAWMAJOR STREETS FUNDPh
- Page 144 and 145:
MAJOR STREETS FUNDREVENUE BUDGET SU
- Page 146 and 147:
FUNDING LEVEL SUMMARY2008/09 2009/1
- Page 148 and 149:
EXPENDITURE ANALYSIS DETAIL2012/201
- Page 150 and 151:
EXPENDITURE ANALYSIS DETAIL2012/201
- Page 152 and 153:
EXPENDITURE ANALYSIS DETAIL2012/201
- Page 154 and 155:
EXPENDITURE ANALYSIS DETAIL2012/201
- Page 156 and 157:
EXPENDITURE ANALYSIS DETAIL2012/201
- Page 158 and 159:
LOCAL STREETS FUND (203)RESOURCE AL
- Page 160 and 161:
DETAIL REVENUES ANALYSIS2008/09 200
- Page 162 and 163:
EXPENDITURE ANALYSIS DETAIL2012/201
- Page 164 and 165:
EXPENDITURE ANALYSIS DETAIL2012/201
- Page 166:
EXPENDITURE ANALYSIS DETAIL2012/201
- Page 169 and 170:
CITY OF SAGINAWRUBBISH COLLECTION F
- Page 171 and 172:
REVENUE BUDGET SUMMARYRUBBISH COLLE
- Page 173 and 174:
EXPENDITURE BUDGET SUMMARYRUBBISH C
- Page 175 and 176:
EXPENDITURE ANALYSIS DETAIL2012/201
- Page 177 and 178:
EXPENDITURE ANALYSIS DETAIL2012/201
- Page 179:
EXPENDITURE ANALYSIS DETAIL2012/201
- Page 182 and 183:
PUBLIC SAFETY FUND (205)RESOURCE AL
- Page 184 and 185:
The above graph reflects numerical
- Page 186 and 187:
EXPENDITURE ANALYSIS DETAIL2012/201
- Page 188 and 189:
PUBLIC SAFETY GRANTSRESOURCE ALLOCA
- Page 190 and 191:
pursued crime technology grants and
- Page 192 and 193:
EXPENDITURE ANALYSIS DETAIL2012/201
- Page 194 and 195:
POLICE TRAINING FUNDREVENUE BUDGET
- Page 196 and 197:
DEPARTMENT OF JUSTICE - JUSTICE ASS
- Page 198 and 199:
REVENUE BUDGET SUMMARYDRUG FORFEITU
- Page 200 and 201:
SAGINAW COUNTY TREATMENT AND PREVEN
- Page 202 and 203:
REVENUE BUDGET SUMMARYHOMELAND SECU
- Page 204 and 205:
EXPENDITURE ANALYSIS DETAIL2012/201
- Page 206 and 207:
EXPENDITURE BUDGET SUMMARYThe total
- Page 208 and 209:
TIFA/LDFA/DDA (SRF)
- Page 210 and 211:
REVENUE BUDGET SUMMARYCLEAN ENERGY
- Page 212 and 213:
EXPENDITURE ANALYSIS DETAIL2012/201
- Page 214 and 215:
REVENUE BUDGET SUMMARYANDERSEN ENRI
- Page 216 and 217:
EXPENDITURE ANALYSIS DETAIL2012/201
- Page 218 and 219:
GM TOWER PROJECTREVENUE BUDGET SUMM
- Page 220 and 221:
BOAT LAUNCH OPERATIONS (239)RESOURC
- Page 222 and 223:
EXPENDITURE BUDGET SUMMARYThe Boat
- Page 224 and 225:
COMMERCE CENTER DDAREVENUE BUDGET S
- Page 226 and 227:
FUNDING LEVEL BY CATEGORY2008/09 20
- Page 228 and 229:
BROWNFIELD AUTHORITY SRRFREVENUE BU
- Page 230 and 231:
REVENUE/EXPENDITURE BUDGET SUMMARYS
- Page 232 and 233:
REVENUE/EXPENDITURE BUDGET SUMMARYT
- Page 235 and 236:
COMMUNITY DEVELOPMENTBLOCK GRANT
- Page 237 and 238:
COMMUNITY DEVELOPMENT BLOCK GRANT (
- Page 239 and 240:
DETAIL REVENUES ANALYSIS2008/09 200
- Page 241 and 242:
EXPENDITURE ANALYSIS DETAIL2012/201
- Page 243 and 244:
EXPENDITURE ANALYSIS DETAIL2012/201
- Page 245 and 246:
CDBG RESIDENTIAL LOANS (276)RESOURC
- Page 247 and 248:
EXPENDITURE BUDGET SUMMARYThe total
- Page 249 and 250:
CDBG RENTAL LOANS (277)RESOURCE ALL
- Page 251 and 252:
EXPENDITURE BUDGET SUMMARYThe total
- Page 253 and 254:
CDBG HOME PROGRAMREVENUE BUDGET SUM
- Page 255 and 256:
EXPENDITURE ANALYSIS DETAIL2012/201
- Page 257 and 258:
REVENUE BUDGET SUMMARYNEIGHBORHOOD
- Page 259 and 260:
EXPENDITURE ANALYSIS DETAIL2012/201
- Page 261 and 262:
SEDC REVOLVING LOANREVENUE BUDGET S
- Page 264 and 265:
CELEBRATION PARK FUND (SRF)
- Page 266 and 267:
CELEBRATION PARKREVENUE BUDGET SUMM
- Page 268 and 269:
EXPENDITURE ANALYSIS DETAIL2012/201
- Page 270 and 271:
DEBT SERVICEOVERVIEW:The City curre
- Page 272 and 273:
DIRECT DEBT:DIRECTDEBT:General Obli
- Page 274 and 275:
STATEMENT OF LEGAL DEBT MARGIN2012
- Page 276 and 277:
ENTERPRISE FUNDSPARKING OPERATIONS
- Page 278 and 279:
REVENUE BUDGET SUMMARYPARKING OPERA
- Page 280 and 281:
CITY OF SAGINAWSEWER OPERATIONS AND
- Page 282 and 283:
SEWER OPERATIONS AND MAINTENANCE FU
- Page 284 and 285:
City was able to obtain Build Ameri
- Page 286 and 287:
FUNDING LEVEL BY CATEGORY2008/09 20
- Page 288 and 289:
EXPENDITURE ANALYSIS DETAIL2012/201
- Page 290 and 291:
EXPENDITURE ANALYSIS DETAIL2012/201
- Page 292 and 293:
EXPENDITURE ANALYSIS DETAIL2012/201
- Page 294 and 295:
EXPENDITURE ANALYSIS DETAIL2012/201
- Page 296 and 297:
CITY OF SAGINAWWATER OPERATIONS AND
- Page 298 and 299:
WATER OPERATIONS AND MAINTENANCE (5
- Page 300 and 301:
The above graph reflects numerical
- Page 302 and 303:
FUNDING LEVEL BY CATEGORY2008/09 20
- Page 304 and 305:
EXPENDITURE ANALYSIS DETAIL2012/201
- Page 306 and 307:
EXPENDITURE ANALYSIS DETAIL2012/201
- Page 308 and 309:
EXPENDITURE ANALYSIS DETAIL2012/201
- Page 310:
EXPENDITURE ANALYSIS DETAIL2012/201
- Page 313 and 314:
PUBLIC WORKS BUILDING (641)RESOURCE
- Page 315 and 316:
EXPENDITURE BUDGET SUMMARYThe total
- Page 317 and 318:
CITY OF SAGINAWDEPARTMENT OF TECHNI
- Page 319 and 320:
REVENUE BUDGET SUMMARYDEPARTMENT OF
- Page 321 and 322:
EXPENDITURE ANALYSIS DETAIL2012/201
- Page 323 and 324:
DEPARTMENT OF TECHNICAL SERVICES (6
- Page 325 and 326:
EXPENDITURE BUDGET SUMMARYThe total
- Page 327 and 328:
RADIO OPERATIONS (660)RESOURCE ALLO
- Page 329 and 330:
EXPENDITURE BUDGET SUMMARYThe total
- Page 331 and 332:
MOTOR POOL OPERATIONS (661)RESOURCE
- Page 333 and 334:
charge was too high and that enterp
- Page 335 and 336:
EXPENDITURE ANALYSIS DETAIL2012/201
- Page 337 and 338:
SELF - INSURANCE FUNDREVENUE BUDGET
- Page 339 and 340:
CITY OF SAGINAWWORKERS COMPENSATION
- Page 341 and 342:
REVENUE BUDGET SUMMARYWORKERS COMPE
- Page 343 and 344:
EXPENDITURE ANALYSIS DETAIL2012/201
- Page 345 and 346:
UNFUNDED LIABILITIES FUND (674)RESO
- Page 347 and 348:
The above graph reflects numerical
- Page 349 and 350:
REVENUE BUDGET SUMMARYFOREST LAWN C
- Page 351 and 352:
OAKWOOD CEMETERY (712)RESOURCE ALLO
- Page 353 and 354:
EXPENDITURE BUDGET SUMMARYOakwood C
- Page 355 and 356:
POLICE AND FIRE PENSION FUND (732)R
- Page 357 and 358:
The above graph reflects numerical
- Page 359 and 360:
EXPENDITURE ANALYSIS DETAIL2012/201
- Page 361 and 362:
20022003200420052006200720082009201
- Page 363 and 364:
CAPITAL IMPROVEMENT PLAN
- Page 365 and 366:
for review and approval. If City Co
- Page 367 and 368:
intersection of Tittabawassee and C
- Page 369 and 370:
CITY OF SAGINAWCIP PROJECTS FOR FY
- Page 371 and 372:
CITY OF SAGINAWCAPITAL IMPROVEMENT
- Page 373 and 374:
CITY OF SAGINAWCAPITAL IMPROVEMENT
- Page 375 and 376:
CITY OF SAGINAWCAPITAL IMPROVEMENT
- Page 377 and 378:
CITY OF SAGINAWCAPITAL IMPROVEMENT
- Page 379 and 380:
CITY OF SAGINAWCAPITAL IMPROVEMENT
- Page 381 and 382:
CITY OF SAGINAWCAPITAL IMPROVEMENT
- Page 383 and 384:
CITY OF SAGINAWCAPITAL IMPROVEMENT
- Page 385 and 386:
CITY OF SAGINAWCAPITAL IMPROVEMENT
- Page 387 and 388:
CITY OF SAGINAWCAPITAL IMPROVEMENT
- Page 389 and 390:
CITY OF SAGINAWCAPITAL IMPROVEMENT
- Page 391 and 392:
CITY OF SAGINAWCAPITAL IMPROVEMENT
- Page 393 and 394:
CITY OF SAGINAWCAPITAL IMPROVEMENT
- Page 395 and 396:
CITY OF SAGINAWCAPITAL IMPROVEMENT
- Page 397 and 398:
CITY OF SAGINAWCAPITAL IMPROVEMENT
- Page 399 and 400:
CITY OF SAGINAWCAPITAL IMPROVEMENT
- Page 401 and 402:
CITY OF SAGINAWCAPITAL IMPROVEMENT
- Page 403 and 404:
CITY OF SAGINAWCAPITAL IMPROVEMENT
- Page 405 and 406:
CITY OF SAGINAWCAPITAL IMPROVEMENT
- Page 407 and 408:
CITY OF SAGINAWCAPITAL IMPROVEMENT
- Page 409 and 410:
CITY OF SAGINAWCAPITAL IMPROVEMENT
- Page 411 and 412:
CITY OF SAGINAWCAPITAL IMPROVEMENT
- Page 413 and 414:
CITY OF SAGINAWCAPITAL IMPROVEMENT
- Page 415 and 416:
CITY OF SAGINAWCAPITAL IMPROVEMENT
- Page 417 and 418:
CITY OF SAGINAWCAPITAL IMPROVEMENT
- Page 419 and 420:
CITY OF SAGINAWCAPITAL IMPROVEMENT
- Page 421 and 422:
Performance Management PlanIntroduc
- Page 423 and 424:
City AttorneyAndre Borrello, City A
- Page 425 and 426:
Community Public Safety - Fire Phil
- Page 427 and 428:
Community Public Safety - PoliceBri
- Page 429 and 430:
Community Policing - (summary of se
- Page 431 and 432:
Inspections - (summary of services)
- Page 433 and 434:
The key performance indicator to
- Page 435 and 436:
Workers Compensation - (summary of
- Page 437 and 438:
Controller’s Office - (summary of
- Page 439 and 440:
Department of Public ServicesPhilli
- Page 441 and 442:
Explanation of variances:In FY 2012
- Page 443 and 444:
Abatement of Nuisances - (summary o
- Page 445 and 446:
SGTV - (summary of services)The SGT
- Page 447 and 448:
Instrumentation and Process Control
- Page 449 and 450:
CTIY OF SAGINAWCOMMUNITY PROFILE201
- Page 451 and 452:
COMMUNITY HIGHLIGHTSSaginaw Art Mus
- Page 453 and 454:
Andersen Enrichment Centerwww.artsa
- Page 455 and 456:
climbing apparatus, a beamed hill,
- Page 457 and 458:
CULTURAL INDULGENCESGreen Point Env
- Page 459 and 460:
Saginaw Art Museum features an expa
- Page 461 and 462:
Saginaw County is 23rd in the natio
- Page 463 and 464:
of the University's level of perfor
- Page 465 and 466:
Midland, Bay, Saginaw (MBS)Internat
- Page 467 and 468:
DEVELOPING PROJECTSPROJECTCOSTSched
- Page 469 and 470:
MAJOR EMPLOYERS IN THE SAGINAW AREA
- Page 471 and 472:
CITY OF SAGINAWSTATISTICAL SECTION2
- Page 473 and 474:
CITY OF SAGINAW, MICHIGANCOMMUNITY
- Page 475 and 476:
CITY OF SAGINAW, MICHIGANPRINCIPAL
- Page 477 and 478:
GLOSSARY OF ABBREVIATED TERMS-A-AAS
- Page 479 and 480:
GLOSSARY OF ABBREVIATED TERMSPOAMPP
- Page 481 and 482:
C -CAPITAL BUDGET - A spending plan
- Page 483 and 484:
LONG-TERM DEBT - Debt with a maturi
- Page 485:
1315 SOUTH WASHINGTON AVENUESAGINAW