12.07.2015
•
Views
LOCAL STREETS FUND (203)RESOURCE ALLOCATION2012/2013 APPROVED BUDGETLocal Streets Funds receives allocation of State collected gasoline taxes and license fees to be used for themaintenance, repair, and construction of local streets and bridges within the City. The Municipal StreetFund functions as an inventory account for street maintenance materials. These materials are reallocated tothe Major and Local Streets Funds upon completion of construction.RESOURCESAPPROPRIATIONSSTATE REVENUE 920,230 ENGINEERING ADMIN. 45,887INTEREST AND RENTS 1,400 TRAFFIC ENGINEERING 236,689OTHER REVENUES 3,000 STREET ADMINISTRATION 420,061TRANSFERS 265,188 ROUTINE MAINTENANCE 366,315WINTER MAINTENANCE 120,866TOTAL RESOURCES 1,189,818 TOTAL APPROPRIATIONS 1,189,818136
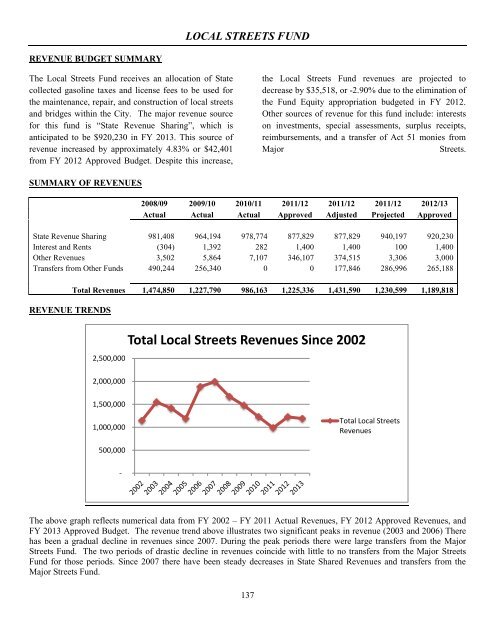
LOCAL STREETS FUNDREVENUE BUDGET SUMMARYThe Local Streets Fund receives an allocation of Statecollected gasoline taxes and license fees to be used forthe maintenance, repair, and construction of local streetsand bridges within the City. The major revenue sourcefor this fund is “State Revenue Sharing”, which isanticipated to be $920,230 in FY 2013. This source ofrevenue increased by approximately 4.83% or $42,401from FY 2012 Approved Budget. Despite this increase,the Local Streets Fund revenues are projected todecrease by $35,518, or -2.90% due to the elimination ofthe Fund Equity appropriation budgeted in FY 2012.Other sources of revenue for this fund include: interestson investments, special assessments, surplus receipts,reimbursements, and a transfer of Act 51 monies fromMajorStreets.SUMMARY OF REVENUES2008/09 2009/10 2010/11 2011/12 2011/12 2011/12 2012/13Actual Actual Actual Approved Adjusted Projected ApprovedState Revenue Sharing 981,408 964,194 978,774 877,829 877,829 940,197 920,230Interest and Rents (304) 1,392 282 1,400 1,400 100 1,400Other Revenues 3,502 5,864 7,107 346,107 374,515 3,306 3,000Transfers from Other Funds 490,244 256,340 0 0 177,846 286,996 265,188REVENUE TRENDSTotal Revenues 1,474,850 1,227,790 986,163 1,225,336 1,431,590 1,230,599 1,189,8182,500,000Total Local Streets Revenues Since 20022,000,0001,500,0001,000,000Total Local StreetsRevenues500,000-The above graph reflects numerical data from FY 2002 – FY 2011 Actual Revenues, FY 2012 Approved Revenues, andFY 2013 Approved Budget. The revenue trend above illustrates two significant peaks in revenue (2003 and 2006) Therehas been a gradual decline in revenues since 2007. During the peak periods there were large transfers from the MajorStreets Fund. The two periods of drastic decline in revenues coincide with little to no transfers from the Major StreetsFund for those periods. Since 2007 there have been steady decreases in State Shared Revenues and transfers from theMajor Streets Fund.137
-
Page 1:
CITY OF SAGINAW, MICHIGANAPPROVEDBU
-
Page 5 and 6:
CITY OF SAGINAWTABLE OF CONTENTSPag
-
Page 7 and 8:
CITY OF SAGINAW1315 South Washingto
-
Page 9 and 10:
FY 2013 Budget HighlightsGeneral Fu
-
Page 11 and 12:
Safety Funding/Planning/Sustainabil
-
Page 13 and 14:
City of Saginaw -Goals and Objectiv
-
Page 15 and 16:
HOW TO USE THE BUDGET DOCUMENTThis
-
Page 17 and 18:
CITY OF SAGINAWMANAGEMENT TEAMDarne
-
Page 19 and 20:
CITY OF SAGINAWORGANIZATIONAL STRUC
-
Page 21 and 22:
in compliance with federal and stat
-
Page 23 and 24:
CITY OF SAGINAW2012/2013 APPROVED B
-
Page 25 and 26:
approved by City Council. In all ot
-
Page 27 and 28:
What Neighborhoods Were Meant to Be
-
Page 29:
They include natural and man-made f
-
Page 32 and 33:
BUDGET AND FINANCESCOPE OF THE BUDG
-
Page 34 and 35:
A percent of 2012 revenues are dete
-
Page 36 and 37:
Chapter VII, Section 47 Budget Cont
-
Page 38 and 39:
Boat Launch Operation Fund:This fun
-
Page 40 and 41:
Motor Pool Operations Fund:This fun
-
Page 42 and 43:
RESOURCE ALLOCATION2012/2013 APPROV
-
Page 44 and 45:
mills. For FY 2013, the city will r
-
Page 46 and 47:
INTERNAL SERVICE FUNDSThe total Int
-
Page 48 and 49:
GENERAL FUNDSUMMARY OF REVENUES2012
-
Page 50 and 51:
SUMMARY OF EXPENDITURESGENERAL FUND
-
Page 52 and 53:
ealized through the reduction of op
-
Page 54 and 55:
ENTERPRISE FUNDSThe total Enterpris
-
Page 56 and 57:
GENERAL FUND2010/2011 2011/2012 201
-
Page 58 and 59:
Summary of RevenuesCITY OF SAGINAWS
-
Page 60 and 61:
EXPENDITURES BY CATEGORY ANALYSIS20
-
Page 62 and 63:
Public Services:In FY 2012, the Dep
-
Page 64:
UNASSIGNED FUND BALANCE ANALYSIS201
-
Page 67 and 68:
RESOURCE ALLOCATION2012/2013 APPROV
-
Page 69 and 70:
General Fund RevenuesTotal 2012/201
-
Page 71 and 72:
STATE SHARED REVENUESThe City of Sa
-
Page 73 and 74:
The chart above reveals that the am
-
Page 75 and 76:
REVENUE ANALYSIS DETAIL2012/2013 AP
-
Page 77 and 78:
REVENUE ANALYSIS DETAIL2012/2013 AP
-
Page 79 and 80:
REVENUE ANALYSIS DETAIL2012/2013 AP
-
Page 81 and 82:
GENERAL FUND REVENUE AND EXPENDITUR
-
Page 83 and 84:
GENERAL GOVERNMENT
-
Page 85 and 86:
GENERAL FUND’S OFFICES OF GENERAL
-
Page 87 and 88:
EXPENDITURE ANALYSIS DETAIL2012/201
-
Page 89 and 90:
EXPENDITURE ANALYSIS DETAIL2012/201
-
Page 91 and 92:
EXPENDITURE ANALYSIS DETAIL2012/201
-
Page 94 and 95:
DEPARTMENT OF FISCAL SERVICES
-
Page 96 and 97:
DEPARTMENT OF FISCAL SERVICESEXPEND
-
Page 98 and 99:
EXPENDITURE ANALYSIS DETAIL2012/201
-
Page 100 and 101:
EXPENDITURE ANALYSIS DETAIL2012/201
-
Page 102 and 103:
EXPENDITURE ANALYSIS DETAIL2012/201
-
Page 104 and 105:
CITY OF SAGINAWCOMMUNITY PUBLIC SAF
-
Page 106 and 107:
SUMMARY OF POSITIONS2008/09 2009/10
-
Page 108 and 109:
EXPENDITURE ANALYSIS DETAIL2012/201
-
Page 110 and 111:
EXPENDITURE ANALYSIS DETAIL2012/201
-
Page 112 and 113:
EXPENDITURE ANALYSIS DETAIL2012/201
-
Page 114 and 115:
COMMUNITY PUBLIC SAFETY - FIREEXPEN
-
Page 116 and 117:
EXPENDITURE ANALYSIS DETAIL2012/201
-
Page 118:
EXPENDITURE ANALYSIS DETAIL2012/201
-
Page 121 and 122:
CITY OF SAGINAWDEPARTMENT OF DEVELO
-
Page 123 and 124:
EXPENDITURE ANALYSIS DETAIL2012/201
-
Page 125:
EXPENDITURE ANALYSIS DETAIL2012/201
-
Page 128 and 129:
CITY OF SAGINAWDEPARTMENT OF PUBLIC
-
Page 130 and 131:
SUMMARY OF POSITIONS2008/09 2009/10
-
Page 132 and 133:
EXPENDITURE ANALYSIS DETAIL2012/201
-
Page 134 and 135:
EXPENDITURE ANALYSIS DETAIL2012/201
-
Page 136:
EXPENDITURE ANALYSIS DETAIL2012/201
-
Page 139:
OTHER GENERAL FUNDEXPENDITURE BUDGE
-
Page 142 and 143:
CITY OF SAGINAWMAJOR STREETS FUNDPh
-
Page 144 and 145:
MAJOR STREETS FUNDREVENUE BUDGET SU
-
Page 146 and 147:
FUNDING LEVEL SUMMARY2008/09 2009/1
-
Page 148 and 149:
EXPENDITURE ANALYSIS DETAIL2012/201
-
Page 150 and 151:
EXPENDITURE ANALYSIS DETAIL2012/201
-
Page 152 and 153:
EXPENDITURE ANALYSIS DETAIL2012/201
-
Page 154 and 155:
EXPENDITURE ANALYSIS DETAIL2012/201
-
Page 156 and 157:
EXPENDITURE ANALYSIS DETAIL2012/201
-
Page 160 and 161:
DETAIL REVENUES ANALYSIS2008/09 200
-
Page 162 and 163:
EXPENDITURE ANALYSIS DETAIL2012/201
-
Page 164 and 165:
EXPENDITURE ANALYSIS DETAIL2012/201
-
Page 166:
EXPENDITURE ANALYSIS DETAIL2012/201
-
Page 169 and 170:
CITY OF SAGINAWRUBBISH COLLECTION F
-
Page 171 and 172:
REVENUE BUDGET SUMMARYRUBBISH COLLE
-
Page 173 and 174:
EXPENDITURE BUDGET SUMMARYRUBBISH C
-
Page 175 and 176:
EXPENDITURE ANALYSIS DETAIL2012/201
-
Page 177 and 178:
EXPENDITURE ANALYSIS DETAIL2012/201
-
Page 179:
EXPENDITURE ANALYSIS DETAIL2012/201
-
Page 182 and 183:
PUBLIC SAFETY FUND (205)RESOURCE AL
-
Page 184 and 185:
The above graph reflects numerical
-
Page 186 and 187:
EXPENDITURE ANALYSIS DETAIL2012/201
-
Page 188 and 189:
PUBLIC SAFETY GRANTSRESOURCE ALLOCA
-
Page 190 and 191:
pursued crime technology grants and
-
Page 192 and 193:
EXPENDITURE ANALYSIS DETAIL2012/201
-
Page 194 and 195:
POLICE TRAINING FUNDREVENUE BUDGET
-
Page 196 and 197:
DEPARTMENT OF JUSTICE - JUSTICE ASS
-
Page 198 and 199:
REVENUE BUDGET SUMMARYDRUG FORFEITU
-
Page 200 and 201:
SAGINAW COUNTY TREATMENT AND PREVEN
-
Page 202 and 203:
REVENUE BUDGET SUMMARYHOMELAND SECU
-
Page 204 and 205:
EXPENDITURE ANALYSIS DETAIL2012/201
-
Page 206 and 207:
EXPENDITURE BUDGET SUMMARYThe total
-
Page 208 and 209:
TIFA/LDFA/DDA (SRF)
-
Page 210 and 211:
REVENUE BUDGET SUMMARYCLEAN ENERGY
-
Page 212 and 213:
EXPENDITURE ANALYSIS DETAIL2012/201
-
Page 214 and 215:
REVENUE BUDGET SUMMARYANDERSEN ENRI
-
Page 216 and 217:
EXPENDITURE ANALYSIS DETAIL2012/201
-
Page 218 and 219:
GM TOWER PROJECTREVENUE BUDGET SUMM
-
Page 220 and 221:
BOAT LAUNCH OPERATIONS (239)RESOURC
-
Page 222 and 223:
EXPENDITURE BUDGET SUMMARYThe Boat
-
Page 224 and 225:
COMMERCE CENTER DDAREVENUE BUDGET S
-
Page 226 and 227:
FUNDING LEVEL BY CATEGORY2008/09 20
-
Page 228 and 229:
BROWNFIELD AUTHORITY SRRFREVENUE BU
-
Page 230 and 231:
REVENUE/EXPENDITURE BUDGET SUMMARYS
-
Page 232 and 233:
REVENUE/EXPENDITURE BUDGET SUMMARYT
-
Page 235 and 236:
COMMUNITY DEVELOPMENTBLOCK GRANT
-
Page 237 and 238:
COMMUNITY DEVELOPMENT BLOCK GRANT (
-
Page 239 and 240:
DETAIL REVENUES ANALYSIS2008/09 200
-
Page 241 and 242:
EXPENDITURE ANALYSIS DETAIL2012/201
-
Page 243 and 244:
EXPENDITURE ANALYSIS DETAIL2012/201
-
Page 245 and 246:
CDBG RESIDENTIAL LOANS (276)RESOURC
-
Page 247 and 248:
EXPENDITURE BUDGET SUMMARYThe total
-
Page 249 and 250:
CDBG RENTAL LOANS (277)RESOURCE ALL
-
Page 251 and 252:
EXPENDITURE BUDGET SUMMARYThe total
-
Page 253 and 254:
CDBG HOME PROGRAMREVENUE BUDGET SUM
-
Page 255 and 256:
EXPENDITURE ANALYSIS DETAIL2012/201
-
Page 257 and 258:
REVENUE BUDGET SUMMARYNEIGHBORHOOD
-
Page 259 and 260:
EXPENDITURE ANALYSIS DETAIL2012/201
-
Page 261 and 262:
SEDC REVOLVING LOANREVENUE BUDGET S
-
Page 264 and 265:
CELEBRATION PARK FUND (SRF)
-
Page 266 and 267:
CELEBRATION PARKREVENUE BUDGET SUMM
-
Page 268 and 269:
EXPENDITURE ANALYSIS DETAIL2012/201
-
Page 270 and 271:
DEBT SERVICEOVERVIEW:The City curre
-
Page 272 and 273:
DIRECT DEBT:DIRECTDEBT:General Obli
-
Page 274 and 275:
STATEMENT OF LEGAL DEBT MARGIN2012
-
Page 276 and 277:
ENTERPRISE FUNDSPARKING OPERATIONS
-
Page 278 and 279:
REVENUE BUDGET SUMMARYPARKING OPERA
-
Page 280 and 281:
CITY OF SAGINAWSEWER OPERATIONS AND
-
Page 282 and 283:
SEWER OPERATIONS AND MAINTENANCE FU
-
Page 284 and 285:
City was able to obtain Build Ameri
-
Page 286 and 287:
FUNDING LEVEL BY CATEGORY2008/09 20
-
Page 288 and 289:
EXPENDITURE ANALYSIS DETAIL2012/201
-
Page 290 and 291:
EXPENDITURE ANALYSIS DETAIL2012/201
-
Page 292 and 293:
EXPENDITURE ANALYSIS DETAIL2012/201
-
Page 294 and 295:
EXPENDITURE ANALYSIS DETAIL2012/201
-
Page 296 and 297:
CITY OF SAGINAWWATER OPERATIONS AND
-
Page 298 and 299:
WATER OPERATIONS AND MAINTENANCE (5
-
Page 300 and 301:
The above graph reflects numerical
-
Page 302 and 303:
FUNDING LEVEL BY CATEGORY2008/09 20
-
Page 304 and 305:
EXPENDITURE ANALYSIS DETAIL2012/201
-
Page 306 and 307:
EXPENDITURE ANALYSIS DETAIL2012/201
-
Page 308 and 309:
EXPENDITURE ANALYSIS DETAIL2012/201
-
Page 310:
EXPENDITURE ANALYSIS DETAIL2012/201
-
Page 313 and 314:
PUBLIC WORKS BUILDING (641)RESOURCE
-
Page 315 and 316:
EXPENDITURE BUDGET SUMMARYThe total
-
Page 317 and 318:
CITY OF SAGINAWDEPARTMENT OF TECHNI
-
Page 319 and 320:
REVENUE BUDGET SUMMARYDEPARTMENT OF
-
Page 321 and 322:
EXPENDITURE ANALYSIS DETAIL2012/201
-
Page 323 and 324:
DEPARTMENT OF TECHNICAL SERVICES (6
-
Page 325 and 326:
EXPENDITURE BUDGET SUMMARYThe total
-
Page 327 and 328:
RADIO OPERATIONS (660)RESOURCE ALLO
-
Page 329 and 330:
EXPENDITURE BUDGET SUMMARYThe total
-
Page 331 and 332:
MOTOR POOL OPERATIONS (661)RESOURCE
-
Page 333 and 334:
charge was too high and that enterp
-
Page 335 and 336:
EXPENDITURE ANALYSIS DETAIL2012/201
-
Page 337 and 338:
SELF - INSURANCE FUNDREVENUE BUDGET
-
Page 339 and 340:
CITY OF SAGINAWWORKERS COMPENSATION
-
Page 341 and 342:
REVENUE BUDGET SUMMARYWORKERS COMPE
-
Page 343 and 344:
EXPENDITURE ANALYSIS DETAIL2012/201
-
Page 345 and 346:
UNFUNDED LIABILITIES FUND (674)RESO
-
Page 347 and 348:
The above graph reflects numerical
-
Page 349 and 350:
REVENUE BUDGET SUMMARYFOREST LAWN C
-
Page 351 and 352:
OAKWOOD CEMETERY (712)RESOURCE ALLO
-
Page 353 and 354:
EXPENDITURE BUDGET SUMMARYOakwood C
-
Page 355 and 356:
POLICE AND FIRE PENSION FUND (732)R
-
Page 357 and 358:
The above graph reflects numerical
-
Page 359 and 360:
EXPENDITURE ANALYSIS DETAIL2012/201
-
Page 361 and 362:
20022003200420052006200720082009201
-
Page 363 and 364:
CAPITAL IMPROVEMENT PLAN
-
Page 365 and 366:
for review and approval. If City Co
-
Page 367 and 368:
intersection of Tittabawassee and C
-
Page 369 and 370:
CITY OF SAGINAWCIP PROJECTS FOR FY
-
Page 371 and 372:
CITY OF SAGINAWCAPITAL IMPROVEMENT
-
Page 373 and 374:
CITY OF SAGINAWCAPITAL IMPROVEMENT
-
Page 375 and 376:
CITY OF SAGINAWCAPITAL IMPROVEMENT
-
Page 377 and 378:
CITY OF SAGINAWCAPITAL IMPROVEMENT
-
Page 379 and 380:
CITY OF SAGINAWCAPITAL IMPROVEMENT
-
Page 381 and 382:
CITY OF SAGINAWCAPITAL IMPROVEMENT
-
Page 383 and 384:
CITY OF SAGINAWCAPITAL IMPROVEMENT
-
Page 385 and 386:
CITY OF SAGINAWCAPITAL IMPROVEMENT
-
Page 387 and 388:
CITY OF SAGINAWCAPITAL IMPROVEMENT
-
Page 389 and 390:
CITY OF SAGINAWCAPITAL IMPROVEMENT
-
Page 391 and 392:
CITY OF SAGINAWCAPITAL IMPROVEMENT
-
Page 393 and 394:
CITY OF SAGINAWCAPITAL IMPROVEMENT
-
Page 395 and 396:
CITY OF SAGINAWCAPITAL IMPROVEMENT
-
Page 397 and 398:
CITY OF SAGINAWCAPITAL IMPROVEMENT
-
Page 399 and 400:
CITY OF SAGINAWCAPITAL IMPROVEMENT
-
Page 401 and 402:
CITY OF SAGINAWCAPITAL IMPROVEMENT
-
Page 403 and 404:
CITY OF SAGINAWCAPITAL IMPROVEMENT
-
Page 405 and 406:
CITY OF SAGINAWCAPITAL IMPROVEMENT
-
Page 407 and 408:
CITY OF SAGINAWCAPITAL IMPROVEMENT
-
Page 409 and 410:
CITY OF SAGINAWCAPITAL IMPROVEMENT
-
Page 411 and 412:
CITY OF SAGINAWCAPITAL IMPROVEMENT
-
Page 413 and 414:
CITY OF SAGINAWCAPITAL IMPROVEMENT
-
Page 415 and 416:
CITY OF SAGINAWCAPITAL IMPROVEMENT
-
Page 417 and 418:
CITY OF SAGINAWCAPITAL IMPROVEMENT
-
Page 419 and 420:
CITY OF SAGINAWCAPITAL IMPROVEMENT
-
Page 421 and 422:
Performance Management PlanIntroduc
-
Page 423 and 424:
City AttorneyAndre Borrello, City A
-
Page 425 and 426:
Community Public Safety - Fire Phil
-
Page 427 and 428:
Community Public Safety - PoliceBri
-
Page 429 and 430:
Community Policing - (summary of se
-
Page 431 and 432:
Inspections - (summary of services)
-
Page 433 and 434:
The key performance indicator to
-
Page 435 and 436:
Workers Compensation - (summary of
-
Page 437 and 438:
Controller’s Office - (summary of
-
Page 439 and 440:
Department of Public ServicesPhilli
-
Page 441 and 442:
Explanation of variances:In FY 2012
-
Page 443 and 444:
Abatement of Nuisances - (summary o
-
Page 445 and 446:
SGTV - (summary of services)The SGT
-
Page 447 and 448:
Instrumentation and Process Control
-
Page 449 and 450:
CTIY OF SAGINAWCOMMUNITY PROFILE201
-
Page 451 and 452:
COMMUNITY HIGHLIGHTSSaginaw Art Mus
-
Page 453 and 454:
Andersen Enrichment Centerwww.artsa
-
Page 455 and 456:
climbing apparatus, a beamed hill,
-
Page 457 and 458:
CULTURAL INDULGENCESGreen Point Env
-
Page 459 and 460:
Saginaw Art Museum features an expa
-
Page 461 and 462:
Saginaw County is 23rd in the natio
-
Page 463 and 464:
of the University's level of perfor
-
Page 465 and 466:
Midland, Bay, Saginaw (MBS)Internat
-
Page 467 and 468:
DEVELOPING PROJECTSPROJECTCOSTSched
-
Page 469 and 470:
MAJOR EMPLOYERS IN THE SAGINAW AREA
-
Page 471 and 472:
CITY OF SAGINAWSTATISTICAL SECTION2
-
Page 473 and 474:
CITY OF SAGINAW, MICHIGANCOMMUNITY
-
Page 475 and 476:
CITY OF SAGINAW, MICHIGANPRINCIPAL
-
Page 477 and 478:
GLOSSARY OF ABBREVIATED TERMS-A-AAS
-
Page 479 and 480:
GLOSSARY OF ABBREVIATED TERMSPOAMPP
-
Page 481 and 482:
C -CAPITAL BUDGET - A spending plan
-
Page 483 and 484:
LONG-TERM DEBT - Debt with a maturi
-
Page 485:
1315 SOUTH WASHINGTON AVENUESAGINAW