CAHSEE Math Problem of the Day - Week 2
CAHSEE Math Problem of the Day - Week 2
CAHSEE Math Problem of the Day - Week 2

You also want an ePaper? Increase the reach of your titles
YUMPU automatically turns print PDFs into web optimized ePapers that Google loves.
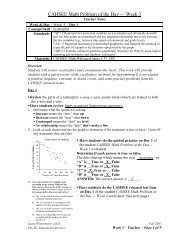
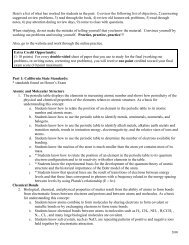
<strong>CAHSEE</strong> <strong>Math</strong> <strong>Problem</strong> <strong>of</strong> <strong>the</strong> <strong>Day</strong> - <strong>Week</strong> 2Teacher Notes• Have students do <strong>the</strong> <strong>CAHSEE</strong> released test item on <strong>Day</strong> 3 <strong>of</strong> <strong>the</strong> student <strong>CAHSEE</strong><strong>Math</strong> <strong>Problem</strong> <strong>of</strong> <strong>the</strong> <strong>Day</strong> -- <strong>Week</strong> 2 worksheet.(<strong>CAHSEE</strong> <strong>Math</strong> Released Item 51)Answer:1. Add up <strong>the</strong> percents <strong>of</strong> students who got ei<strong>the</strong>r and A or B. 15% + 10% = 25%2. 25% is <strong>the</strong> same as ¼ (Think: a quarter is 25 cents or ¼ <strong>of</strong> a dollar)3. To determine <strong>the</strong> number <strong>of</strong> students who received As or Bs take ¼ <strong>of</strong> <strong>the</strong> totalnumber <strong>of</strong> students (40)¼ x 40 = 10ANSWER: The correct answer is B.Laura Westermeier, Ed.D. Fall 2007SAUSD, Educational Services <strong>Week</strong> 2 – Teacher - Page 6 <strong>of</strong> 9
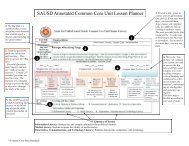
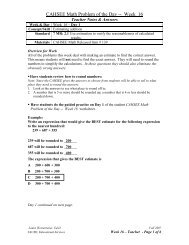
<strong>CAHSEE</strong> <strong>Math</strong> <strong>Problem</strong> <strong>of</strong> <strong>the</strong> <strong>Day</strong> - <strong>Week</strong> 2Teacher Notes<strong>Week</strong> <strong>Week</strong> 2 – <strong>Day</strong> 4Concept/Skill Venn DiagramStandard 7.SP:1.1 Know various forms <strong>of</strong> display for data sets, including a stemand-leafplot or box-and-whisker plot; use <strong>the</strong> forms to display a singleset <strong>of</strong> data or to compare two sets <strong>of</strong> data.Materials <strong>CAHSEE</strong> <strong>Math</strong> Released Item #55<strong>Day</strong> 4Review that Venn Diagrams are used to compare groups. Venn diagrams are made <strong>of</strong>two circles that overlap. Each circle contains <strong>the</strong> members <strong>of</strong> a group. The part <strong>of</strong> <strong>the</strong> circles thatoverlap show <strong>the</strong> members that are in both groups.Students need to determine what <strong>the</strong> question is asking. They should look for wordslike:• both meaning found in <strong>the</strong> space between <strong>the</strong> circles• only meaning inside <strong>of</strong> one circle but not found in <strong>the</strong> space between <strong>the</strong> circles• total means you need to add <strong>the</strong> number in <strong>the</strong> circle and between <strong>the</strong> circlesStudents should look at each answer choice and use <strong>the</strong> Venn diagram to determine if <strong>the</strong>choice is true or false.Have students do <strong>the</strong> guided practice on <strong>Day</strong> 4 <strong>of</strong> <strong>the</strong> student <strong>CAHSEE</strong> <strong>Math</strong> <strong>Problem</strong><strong>of</strong> <strong>the</strong> <strong>Day</strong> -- <strong>Week</strong> 2 worksheet.How many girls are only on <strong>the</strong> track team?A 6A. The 6 refers to girls in _Soccer_ andB 31_Track_ so A is _False__.C 37B. The 31 refers to girls that are only in_Track___ so B is _True____.D 55C. The 37 refers to all <strong>of</strong> <strong>the</strong> girls in Trackincluding those in Soccer so C is _False_.D. The 55 refers to all <strong>of</strong> <strong>the</strong> girls in Soccerand Track so D is _False_.The correct answer is ___B_____.Laura Westermeier, Ed.D. Fall 2007SAUSD, Educational Services <strong>Week</strong> 2 – Teacher - Page 7 <strong>of</strong> 9
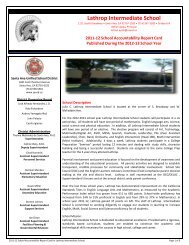
<strong>CAHSEE</strong> <strong>Math</strong> <strong>Problem</strong> <strong>of</strong> <strong>the</strong> <strong>Day</strong> - <strong>Week</strong> 2Teacher Notes• Have students do <strong>the</strong> <strong>CAHSEE</strong> released test item on <strong>Day</strong> 4 <strong>of</strong> <strong>the</strong> student <strong>CAHSEE</strong><strong>Math</strong> <strong>Problem</strong> <strong>of</strong> <strong>the</strong> <strong>Day</strong> -- <strong>Week</strong> 2 worksheet.(<strong>CAHSEE</strong> <strong>Math</strong> Released Item #55)Answer:A – The 6 refers to <strong>the</strong> girls in both Soccer and Track so A is TRUE.B – The 12 is FALSEC – The 49 is <strong>the</strong> total <strong>of</strong> girls who are only in Soccer or only in Track (18+31=49) so Cis FALSED – <strong>the</strong> 55 is <strong>the</strong> total <strong>of</strong> girls on <strong>the</strong> graph (18+6+31=55) so D is FALSEThe correct answer is A.Laura Westermeier, Ed.D. Fall 2007SAUSD, Educational Services <strong>Week</strong> 2 – Teacher - Page 8 <strong>of</strong> 9
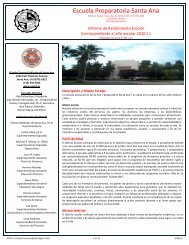
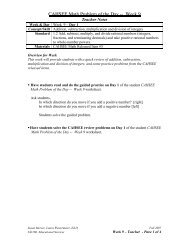
<strong>CAHSEE</strong> <strong>Math</strong> <strong>Problem</strong> <strong>of</strong> <strong>the</strong> <strong>Day</strong> - <strong>Week</strong> 2Teacher Notes<strong>Week</strong> <strong>Week</strong> 2 – <strong>Day</strong> 5Concept/Skill Circle Graph (Pie Chart)Standard 7.SP:1.1 Know various forms <strong>of</strong> display for data sets, including a stemand-leafplot or box-and-whisker plot; use <strong>the</strong> forms to display a singleset <strong>of</strong> data or to compare two sets <strong>of</strong> data.Materials <strong>CAHSEE</strong> <strong>Math</strong> Released Item #54<strong>Day</strong> 5• Students will need to pick <strong>the</strong> Circle Graph (Pie Chart) that shows <strong>the</strong> data in <strong>the</strong> tableprovided.• Have students do <strong>the</strong> <strong>CAHSEE</strong> released test item on <strong>Day</strong> 5 <strong>of</strong> <strong>the</strong> student <strong>CAHSEE</strong><strong>Math</strong> <strong>Problem</strong> <strong>of</strong> <strong>the</strong> <strong>Day</strong> -- <strong>Week</strong> 2 worksheet.A is notcorrect sinceSculpture andO<strong>the</strong>r shouldboth have <strong>the</strong>same percent.C is not correctsince Painting andDrawing shouldboth have <strong>the</strong>same percent.B is <strong>the</strong> correctanswer. Note thatyou did not haveto calculate <strong>the</strong>percents.D is not correctsince Painting andDrawing shouldboth have <strong>the</strong>same percent.• At <strong>the</strong> end <strong>of</strong> <strong>the</strong> week remind students to keep <strong>the</strong> student <strong>CAHSEE</strong> <strong>Math</strong><strong>Problem</strong> <strong>of</strong> <strong>the</strong> <strong>Day</strong> -- <strong>Week</strong> 1 worksheet to use as a study guide as <strong>the</strong>y continueto prepare for <strong>the</strong> <strong>CAHSEE</strong>.Laura Westermeier, Ed.D. Fall 2007SAUSD, Educational Services <strong>Week</strong> 2 – Teacher - Page 9 <strong>of</strong> 9