The Soils of Brant County - Agriculture and Agri-Food Canada
The Soils of Brant County - Agriculture and Agri-Food Canada
The Soils of Brant County - Agriculture and Agri-Food Canada
- No tags were found...
Create successful ePaper yourself
Turn your PDF publications into a flip-book with our unique Google optimized e-Paper software.
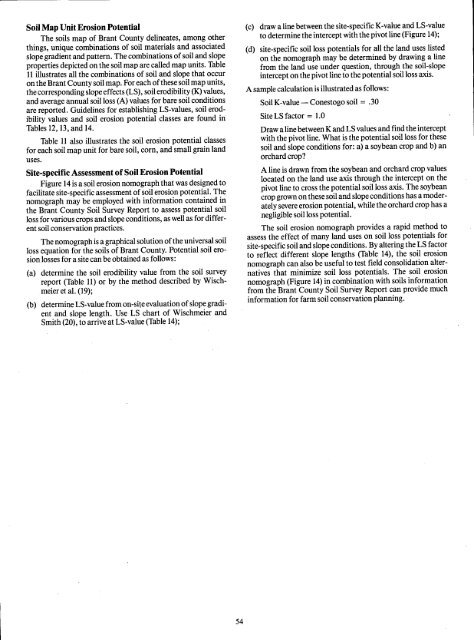
Soil Map Unit Erosion Potential<strong>The</strong> soils map <strong>of</strong> <strong>Brant</strong> <strong>County</strong> delineates, among otherthings, unique combinations <strong>of</strong> soil materials <strong>and</strong> associatedslope gradient <strong>and</strong> pattern . <strong>The</strong> combinations <strong>of</strong> soil <strong>and</strong> slopeproperties depicted on the soil map are called map units . Table11 illustrates all the combinations <strong>of</strong> soil <strong>and</strong> slope that occuron the <strong>Brant</strong> <strong>County</strong> soil map. For each <strong>of</strong> these soil map units,the corresponding slope effects (LS), soil erodibility (K) values, .<strong>and</strong> average annual soil loss (A) values for bare soil conditionsare reported . Guidelines for establishing LS-values, soil erodibilityvalues <strong>and</strong> soil erosion potential classes are found inTables 12, 13, <strong>and</strong> 14 .Table 11 also illustrates the soil erosion potential classesfor each soil map unit for bare soil, corn, <strong>and</strong> small grain l<strong>and</strong>uses .Site-specific Assessment <strong>of</strong> Soil Erosion PotentialFigure 14 is a soil erosion nomograph that was designed t<strong>of</strong>acilitate site-specific assessment <strong>of</strong> soil erosion potential . <strong>The</strong>nomograph may be employed with information contained inthe <strong>Brant</strong> <strong>County</strong> Soil Survey Report to assess potential soilloss for various crops <strong>and</strong> slope conditions, as well as for differentsoil conservation practices .<strong>The</strong> nomograph is agraphical solution <strong>of</strong> the universal soilloss equation for the soils <strong>of</strong> <strong>Brant</strong> <strong>County</strong>. Potential soil erosionlosses for a site can be obtained as follows :(a) determine the soil erodibility value from the soil surveyreport (Table 11) or by the method described by Wischmeieret al . (19) ;(b) determine LS-value from on-siteevaluation <strong>of</strong> slope gradient<strong>and</strong> slope length . Use LS chart <strong>of</strong> Wischmeier <strong>and</strong>Smith (20), to arrive at LS-value (Table 14) ;(c)(d)draw a line between the site-specific K-value <strong>and</strong> LS-valueto determine the intercept with the pivot line (Figure 14) ;site-specific soil loss potentials for all the l<strong>and</strong> uses listedon the nomograph may be determined by drawing a linefrom the l<strong>and</strong> use under question, through the soil-slopeintercept on the pivot line to the potential soil loss axis.A sample calculation is illustrated as follows :Soil K-value- Conestogo soil = .30Site LS factor = 1 .0Draw a line between K <strong>and</strong> LS values <strong>and</strong> find the interceptwith the pivot line. What is the potential soil loss for thesesoil <strong>and</strong> slope conditions for : a) a soybean crop <strong>and</strong> b) anorchard crop?A line is drawn from the soybean <strong>and</strong> orchard crop valueslocated on the l<strong>and</strong> use axis through the intercept on thepivot line to cross the potential soil loss axis . <strong>The</strong> soybeancrop grown onthese soil <strong>and</strong> slope conditions has amoderatelysevere erosion potential, while the orchard crop has anegligible soil loss potential .<strong>The</strong> soil erosion nomograph provides a rapid method toassess the effect <strong>of</strong> many l<strong>and</strong> uses on soil loss potentials forsite-specific soil <strong>and</strong> slope conditions . By altering the LS factorto reflect different slope lengths (Table 14), the soil erosionnomograph can also be useful to test field consolidation alternativesthat minimize soil loss potentials . <strong>The</strong> soil erosionnomograph (Figure 14) in combination with soils informationfrom the <strong>Brant</strong> <strong>County</strong> Soil Survey Report can provide muchinformation for farm soil conservation planning .


