Robust PCI Monitoring During PWR Operation at ... - Studsvik
Robust PCI Monitoring During PWR Operation at ... - Studsvik
Robust PCI Monitoring During PWR Operation at ... - Studsvik
- No tags were found...
You also want an ePaper? Increase the reach of your titles
YUMPU automatically turns print PDFs into web optimized ePapers that Google loves.
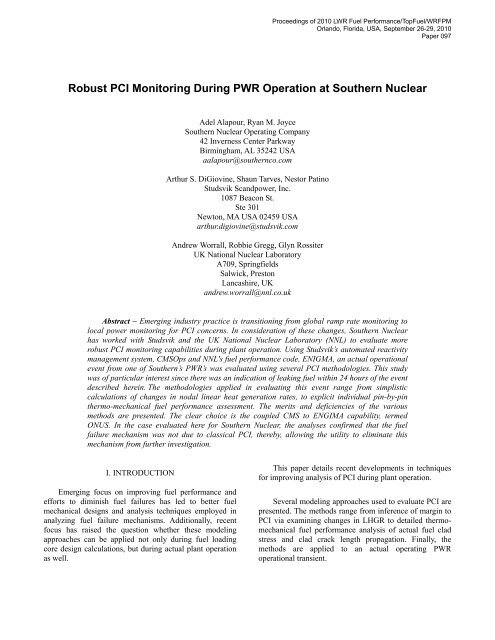
Proceedings of 2010 LWR Fuel Performance/TopFuel/WRFPMOrlando, Florida, USA, September 26-29, 2010Paper 097<strong>Robust</strong> <strong>PCI</strong> <strong>Monitoring</strong> <strong>During</strong> <strong>PWR</strong> <strong>Oper<strong>at</strong>ion</strong> <strong>at</strong> Southern NuclearAdel Alapour, Ryan M. JoyceSouthern Nuclear Oper<strong>at</strong>ing Company42 Inverness Center ParkwayBirmingham, AL 35242 USAaalapour@southernco.comArthur S. DiGiovine, Shaun Tarves, Nestor P<strong>at</strong>ino<strong>Studsvik</strong> Scandpower, Inc.1087 Beacon St.Ste 301Newton, MA USA 02459 USAarthur.digiovine@studsvik.comAndrew Worrall, Robbie Gregg, Glyn RossiterUK N<strong>at</strong>ional Nuclear Labor<strong>at</strong>oryA709, SpringfieldsSalwick, PrestonLancashire, UKandrew.worrall@nnl.co.ukAbstract – Emerging industry practice is transitioning from global ramp r<strong>at</strong>e monitoring tolocal power monitoring for <strong>PCI</strong> concerns. In consider<strong>at</strong>ion of these changes, Southern Nuclearhas worked with <strong>Studsvik</strong> and the UK N<strong>at</strong>ional Nuclear Labor<strong>at</strong>ory (NNL) to evalu<strong>at</strong>e morerobust <strong>PCI</strong> monitoring capabilities during plant oper<strong>at</strong>ion. Using <strong>Studsvik</strong>’s autom<strong>at</strong>ed reactivitymanagement system, CMSOps and NNL's fuel performance code, ENIGMA, an actual oper<strong>at</strong>ionalevent from one of Southern’s <strong>PWR</strong>’s was evalu<strong>at</strong>ed using several <strong>PCI</strong> methodologies. This studywas of particular interest since there was an indic<strong>at</strong>ion of leaking fuel within 24 hours of the eventdescribed herein. The methodologies applied in evalu<strong>at</strong>ing this event range from simplisticcalcul<strong>at</strong>ions of changes in nodal linear he<strong>at</strong> gener<strong>at</strong>ion r<strong>at</strong>es, to explicit individual pin-by-pinthermo-mechanical fuel performance assessment. The merits and deficiencies of the variousmethods are presented. The clear choice is the coupled CMS to ENGIMA capability, termedONUS. In the case evalu<strong>at</strong>ed here for Southern Nuclear, the analyses confirmed th<strong>at</strong> the fuelfailure mechanism was not due to classical <strong>PCI</strong>, thereby, allowing the utility to elimin<strong>at</strong>e thismechanism from further investig<strong>at</strong>ion.I. INTRODUCTIONEmerging focus on improving fuel performance andefforts to diminish fuel failures has led to better fuelmechanical designs and analysis techniques employed inanalyzing fuel failure mechanisms. Additionally, recentfocus has raised the question whether these modelingapproaches can be applied not only during fuel loadingcore design calcul<strong>at</strong>ions, but during actual plant oper<strong>at</strong>ionas well.This paper details recent developments in techniquesfor improving analysis of <strong>PCI</strong> during plant oper<strong>at</strong>ion.Several modeling approaches used to evalu<strong>at</strong>e <strong>PCI</strong> arepresented. The methods range from inference of margin to<strong>PCI</strong> via examining changes in LHGR to detailed thermomechanicalfuel performance analysis of actual fuel cladstress and clad crack length propag<strong>at</strong>ion. Finally, themethods are applied to an actual oper<strong>at</strong>ing <strong>PWR</strong>oper<strong>at</strong>ional transient.
Proceedings of 2010 LWR Fuel Performance/TopFuel/WRFPMOrlando, Florida, USA, September 26-29, 2010Paper 097II. <strong>PCI</strong> ANALYSIS METHODS OVERVIEWFuel performance has long been a part of reload coredesign and analysis. Typically, only bounding analysis ofthe most limiting fuel pins is included in the core designprocess.The difference in the analysis presented here is twofold.First, an actual transient from oper<strong>at</strong>ing reactors th<strong>at</strong>resulted in changes to LHGR is analyzed for margin to<strong>PCI</strong>. Second, since <strong>PCI</strong> is a pin-based phenomenon, allfuel pins in the core are equally analyzed (e.g., nobounding analysis of only limiting pins was used).Fig. 1. Limit<strong>at</strong>ions to delta kW/ft modelThe assessment demonstr<strong>at</strong>es th<strong>at</strong> the various methodsfor examining <strong>PCI</strong> can be applied to actual oper<strong>at</strong>ingevents and screening criteria for bounding analysis is notnecessary.II. A. Delta-kW/ft ModelIn a delta-kW/ft model, changes in linear he<strong>at</strong>gener<strong>at</strong>ion r<strong>at</strong>e (LHGR) between successive calcul<strong>at</strong>ionpoints (st<strong>at</strong>epoints) are examined to ensure the values arewithin acceptable limits. The LHGR values can be nodeaveragedd<strong>at</strong>a, where LHGR's for each pin in an assemblyare normalized within an assembly and divided axially intonodes.The delta-kW/ft model uses the maximum change inLHGR as a potential indic<strong>at</strong>or of a <strong>PCI</strong> viol<strong>at</strong>ion. Thedisadvantage to this approach is th<strong>at</strong> it may ignore arel<strong>at</strong>ively small change in LHGR th<strong>at</strong> could indic<strong>at</strong>e a <strong>PCI</strong>viol<strong>at</strong>ion if the LHGR was already near the limit.Additionally, this approach could incorrectly recognize arel<strong>at</strong>ively large change in LHGR as a potential <strong>PCI</strong> issue,even though the large change occurred in a pin th<strong>at</strong> wasoper<strong>at</strong>ing well below viol<strong>at</strong>ion limits. This is illustr<strong>at</strong>ed inFig. 1.To compens<strong>at</strong>e for these shortcomings, conserv<strong>at</strong>ivevalues for the limiting delta-kW/ft are typically applied.Although this does lend itself to mitig<strong>at</strong>ing <strong>PCI</strong> concernsduring a power maneuver, for example, it can beeconomically inefficient, requiring a slower return topower than is actually needed to preclude <strong>PCI</strong>.The advantage of the delta-kW/ft model is th<strong>at</strong> d<strong>at</strong>a isreadily available from the core simul<strong>at</strong>ion neutronicmodels, with rel<strong>at</strong>ively fast comput<strong>at</strong>ional times.II. B. Threshold LHGR <strong>PCI</strong> ModelA more sophistic<strong>at</strong>ed method of monitoring <strong>PCI</strong> usingLHGR d<strong>at</strong>a is to account for the physical phenomenon ofpin conditioning, the time-dependent annealing th<strong>at</strong> occurswhen a pin LHGR remains <strong>at</strong> the same power for anextended period. By modeling conditioning, gre<strong>at</strong>erchanges in LHGR are achievable without viol<strong>at</strong>ing <strong>PCI</strong>limits, since the pellet and cladding conditioning arefactored into the calcul<strong>at</strong>ion.Fig. 2 presents a graphical depiction of how <strong>at</strong>hreshold model works. The lower dashed line representsthe conditioning threshold. The upper dashed line is the<strong>PCI</strong> viol<strong>at</strong>ion limit, which is a delta above the <strong>PCI</strong>threshold. If, during plant oper<strong>at</strong>ion, a pin LHGR valueexceeds the threshold, "conditioning" begins for th<strong>at</strong> pin.<strong>During</strong> conditioning the threshold increases and, since the<strong>PCI</strong> limit is a fixed delta above the threshold, the <strong>PCI</strong>viol<strong>at</strong>ion limit also increases. Provided the LHGRincreases <strong>at</strong> a r<strong>at</strong>e slow enough to remain below the <strong>PCI</strong>limit, no viol<strong>at</strong>ion occurs. However, if the LHGR changesmore rapidly than the threshold changes, a <strong>PCI</strong> viol<strong>at</strong>ionmay occur.
Proceedings of 2010 LWR Fuel Performance/TopFuel/WRFPMOrlando, Florida, USA, September 26-29, 2010Paper 097fuel performance perspective are maximum localconcentr<strong>at</strong>ed clad hoop stress and maximum local cladcrack length.Clad Hoop Stress - is the stress th<strong>at</strong> forces a crack inthe clad wall to “open up” and propag<strong>at</strong>e through thecladding. Form<strong>at</strong>ion of a crack is a prerequisite to<strong>PCI</strong> and is therefore an ideal indic<strong>at</strong>ion of thesusceptibility of a fuel pin to <strong>PCI</strong> failure. However,<strong>PCI</strong> failure will not necessarily occur only byform<strong>at</strong>ion of the crack by itself.Fig. 2. Threshold <strong>PCI</strong> Model using LHGR d<strong>at</strong>aConversely, once the LHGR is above the thresholdand then begins to decrease, the threshold and <strong>PCI</strong>viol<strong>at</strong>ion limits begin to decrease or de-condition.The drawback with this particular model for <strong>PWR</strong>s isth<strong>at</strong> the threshold level, the <strong>PCI</strong> viol<strong>at</strong>ion limit delta, andthe conditioning & de-conditioning r<strong>at</strong>es are not typicallysupplied from the fuel vendor. They can be determinedfrom detailed thermo-mechanical fuel performancecalcul<strong>at</strong>ions or via experimental d<strong>at</strong>a. Additionally,detailed neutronic d<strong>at</strong>a of the actual LHGR's duringoper<strong>at</strong>ion has previously been difficult to obtain.II. C. Detailed Thermo-Mechanical FuelPerformance AnalysisWhen the LHGR of a fuel pin increases, the fuel pinbecomes prone to a failure mechanism known as <strong>PCI</strong>. Thespecific mechanism is referred to as stress corrosioncracking (SCC) and occurs <strong>at</strong> the inner wall of the fuel pincladding. Although the power increase causes a differentialthermal expansion in the fuel clad, which in turn gener<strong>at</strong>esa tensile stress in the cladding (hoop stress), a certain finalpower level is also necessary for failure to occur.This behavior implies th<strong>at</strong> a high temper<strong>at</strong>ure in thefuel, leading to the release of chemically aggressive fissionproducts (such as iodine), is also required for <strong>PCI</strong>. Thefailure is not immedi<strong>at</strong>e, suggesting th<strong>at</strong> the crack has todevelop and propag<strong>at</strong>e until the crack length is gre<strong>at</strong>er thanthe cladding thickness, requiring th<strong>at</strong> the fuel pin be <strong>at</strong>power for a certain period of time.Clad Yield Stress - the point <strong>at</strong> which the m<strong>at</strong>erialmoves from elastic to plastic deform<strong>at</strong>ion, i.e., doesnot "recover" when the stress is removed. In thisanalysis the difference in the calcul<strong>at</strong>ed clad hoopstress to clad yield stress, or margin to clad failure, isused. The clad yield stress limit is dependent on thefuel design and conditions during plant oper<strong>at</strong>ion.Clad Crack Length – Once a crack has formed in theclad wall, the length and growth of the crack is adirect indic<strong>at</strong>ion of the potential for a <strong>PCI</strong> failure.However, the failure threshold occurs when thecalcul<strong>at</strong>ed crack length exceeds the clad wallthickness.It is important to note th<strong>at</strong> the clad hoop stress andclad crack length are very much dependent on theirradi<strong>at</strong>ion history (LHGR vs. exposure) as well as thelocal LHGR of every fuel pin. Therefore, a full powerhistory (LHGR vs. time) of every fuel pin for the entiretime it has been in the reactor core must be modeled as partof the <strong>PCI</strong> assessment. (Note this is for Zircaloy clad fueland is not necessarily applicable for other claddingm<strong>at</strong>erial.)The deficiency with this approach has been in itsapplic<strong>at</strong>ion; typically only the most limiting pins from acore neutronic simul<strong>at</strong>ion are selected for this morethorough fuel performance analysis. This brings intoquestion the criteria used to select the candid<strong>at</strong>e pins.<strong>During</strong> an actual oper<strong>at</strong>ional transient it is very difficult toset inclusive criteria to ensure the most limiting pins arecorrectly chosen. As with the other methods, until now,there has not been an efficient way to perform this morerobust assessment during plant oper<strong>at</strong>ions.Therefore, in order to properly assess vulnerability to<strong>PCI</strong> due to local power changes, the key indic<strong>at</strong>ors from a
Proceedings of 2010 LWR Fuel Performance/TopFuel/WRFPMOrlando, Florida, USA, September 26-29, 2010Paper 097III. OPEN VALVE TEST EVENT DESCRIPTIONTo demonstr<strong>at</strong>e the applic<strong>at</strong>ion of the various <strong>PCI</strong>evalu<strong>at</strong>ion methods to actual oper<strong>at</strong>ing d<strong>at</strong>a, a specificevent from an oper<strong>at</strong>ing <strong>PWR</strong> in Southern Nuclear's fleetwas selected. The event is called an open valve test. Thetest itself should result in fairly mild changes in LHGRvalues. However, upon completion of the test in the actualplant, coolant off-gas activity increased indic<strong>at</strong>ing fuelfailure. The analysis was motiv<strong>at</strong>ed by the need toelimin<strong>at</strong>e <strong>PCI</strong> as a possible cause.In an open valve test the reactor core inlet coolanttemper<strong>at</strong>ure is reduced to facilit<strong>at</strong>e testing on thesecondary side. The temper<strong>at</strong>ure reduction is mild, on theorder of a few degrees.This particular event was conducted near BOC <strong>at</strong> fullreactor power (HFP). The MTC for the core <strong>at</strong> thiscondition was slightly neg<strong>at</strong>ive in value (meaning astemper<strong>at</strong>ure decreases positive reactivity is inserted). Inorder for the reactor to remain critical this positivereactivity insertion must be balanced with the insertion ofneg<strong>at</strong>ive reactivity by partially inserting the lead controlbank. <strong>During</strong> this event, the lead bank was partiallyinserted approxim<strong>at</strong>ely 10% into the core.Once the testing on the secondary side is complete, thelead control bank is withdrawn to a full out position as theinlet coolant temper<strong>at</strong>ure is slowly raised back to nominal.<strong>During</strong> this movement of the lead control bank <strong>at</strong> HFPLHGR is redistributed axially and radially within the core.Since <strong>PCI</strong> is dependent on changes in LHGR vs. time, thisevent was chosen to apply the various <strong>PCI</strong> methodspreviously discussed.IV. ANALYSIS MODELS OF SPECIFIC OPERATINGEVENTS DESCRIPTIONIn order to assess <strong>PCI</strong> during oper<strong>at</strong>ing events, severalcalcul<strong>at</strong>ional components are necessary: an accur<strong>at</strong>e threedimensional,cycle-specific core neutronic model, detailedcore follow d<strong>at</strong>a for the actual transients, an accur<strong>at</strong>ethermo-mechanical fuel performance code, a systemcoupling these models together, and a d<strong>at</strong>a managementsystem to digest and resolve all the d<strong>at</strong>a points into asuccinct summary for the events. This section describesthese analysis models.IV. A. CMS Model DescriptionA cycle-specific CMS neutronics model, comprised of<strong>Studsvik</strong>’s CASMO 1 and SIMULATE 2 codes, has beenused for several cycles <strong>at</strong> Southern Nuclear for fuel vendoroversight, oper<strong>at</strong>ional support, and oper<strong>at</strong>or simul<strong>at</strong>ortraining. These models employ CASMO as the crosssectionl<strong>at</strong>tice code and SIMULATE as the steady-st<strong>at</strong>enodal simul<strong>at</strong>or.IV. B. CMSOps Model Description<strong>Studsvik</strong>’s CMSOps 3 was used to integr<strong>at</strong>e detailedplant oper<strong>at</strong>ional d<strong>at</strong>a during the events analyzed withinthis paper 4 . CMSOps manages the high-fidelity CMSneutronics model for reactivity management, including <strong>at</strong>hreshold based <strong>PCI</strong> assessment.CMSOps ensures the CMS core neutronics modelaccur<strong>at</strong>ely reflects the plant’s actual detailed oper<strong>at</strong>inghistory by autom<strong>at</strong>ing core follow. CMSOps reads plantmeasured signals on a minute-by-minute frequency anddetects any changes in the values of these signals. Basedon certain change criteria being met (e.g., changes inpower level, lead control bank position, inlet temper<strong>at</strong>urechange, etc.), CMSOps autom<strong>at</strong>ically activ<strong>at</strong>es executionand upd<strong>at</strong>ing of the cycle-specific SIMULATE model.CMSOps is built on a very efficient d<strong>at</strong>abase th<strong>at</strong>archives all of the measured signals and all calcul<strong>at</strong>edneutronic parameters, making it easy to assess <strong>PCI</strong> usingother techniques, such as the delta-kW/ft and the thresholdmodels.<strong>Studsvik</strong>, with assistance from Southern's engineers,implemented CMSOps for the plant in which the oper<strong>at</strong>ingevent (open valve test) was conducted. This event resultedin several SIMULATE calcul<strong>at</strong>ions over a small amount oftime (~8 hours), each of which produced detailed threedimensionalLHGR pin-maps.IV. C. ENIGMA Thermo-Mechanical FuelPerformance Model DescriptionThe UK N<strong>at</strong>ional Nuclear Labor<strong>at</strong>ory (NNL)particip<strong>at</strong>ed in the analysis by evalu<strong>at</strong>ing the CMS d<strong>at</strong>afrom the oper<strong>at</strong>ional event using their fuel performancecode, ENIGMA 5 .
Proceedings of 2010 LWR Fuel Performance/TopFuel/WRFPMOrlando, Florida, USA, September 26-29, 2010Paper 097ENIGMA is a fully valid<strong>at</strong>ed fuel performance codeth<strong>at</strong> has been used for several definitive design andlicensing assessments for both UO2 and MOX fuel,including licensing UO2 and gadolinia-doped UO2 inSizewell B (the UK’s only <strong>PWR</strong>) and the Finnish LoviisaVVER-440 reactor, and mixed oxide (MOX) fuel in theSwiss Beznau-1 <strong>PWR</strong>. ENIGMA is also used in support ofMOX production in the Sellafield MOX Plant (SMP) andto perform feasibility studies for advanced fuel concepts.Recently NNL and <strong>Studsvik</strong> have coupled the CMScore neutronics model and ENIGMA’s fuel performanceanalysis capabilities, producing ONUS 6,7 to performthermo-mechanical analysis of every fuel pin in the core.Since CMSOps autom<strong>at</strong>ically gener<strong>at</strong>es CMS casesfor the entire oper<strong>at</strong>ional event, detailed LHGR's gener<strong>at</strong>edare available for every fuel pin and axial pin node in thecore. This d<strong>at</strong>a was coupled directly with ENIGMA toperform <strong>PCI</strong> evalu<strong>at</strong>ion for every pin in the core, using itsdetailed power history. ONUS is also then used to displaythe 3-D pin-by-pin d<strong>at</strong>a available following the analysis.V. <strong>PCI</strong> RESULTS FROM OPEN VALVE TESTThis event provided an opportunity to explore thevarious ways of monitoring <strong>PCI</strong> limits in order to mitig<strong>at</strong>e<strong>PCI</strong> viol<strong>at</strong>ions. The three various methods explainedpreviously are applied.Fig.3. presents a graphical result from ONUS(ENIGMA/CMS), of the normalized, axially integr<strong>at</strong>ed(radial) pin-by-pin LHGR <strong>at</strong> the point of deepest insertionof the lead control bank. The core loading p<strong>at</strong>tern is easilyrecognized as a contemporary low-leakage one.Fig.3. Rel<strong>at</strong>ive Power Density Distribution and LeadControl Bank Loc<strong>at</strong>ions during Event (Circles)Note also the loc<strong>at</strong>ions of the lead control bank, whichis partially inserted during the open valve test. Since theloc<strong>at</strong>ions are in rel<strong>at</strong>ively high-powered regions, theconcern of <strong>PCI</strong> during the event is warranted.V. A. Delta-kW/ft Results for Open Valve TestUsing d<strong>at</strong>a from the open valve test event, the deltakW/ftanalysis was applied to assess margin to <strong>PCI</strong> limit.This analysis calcul<strong>at</strong>ed delta-kW/ft/hr, as compared to theimmedi<strong>at</strong>ely previous case, calcul<strong>at</strong>ed with d<strong>at</strong>a for everynode in the core, as shown in Fig. 4. and Fig. 5.Fig. 4. Nodal delta-kW/ft/hr during Open Valve Test vs.Exposure..
Proceedings of 2010 LWR Fuel Performance/TopFuel/WRFPMOrlando, Florida, USA, September 26-29, 2010Paper 097Fig. 5. Nodal delta-kW/ft/hr during Open Valve Test vs.TimeThe nodal delta-kW/ft/hr values presented in thefigure coincide with the expected behavior. <strong>During</strong> theevent nodes where power is being suppressed as the leadcontrol bank is inserted experience a neg<strong>at</strong>ive deltakW/ft/hr.Conversely, nodes where power is beingincreased as the lead control bank is withdrawn experiencea positive delta-kW/ft/hr. The magnitude of the changes (indelta-kW/ft/hr) are consistent with the expected increase inclad strain – a key component of <strong>PCI</strong> – given th<strong>at</strong> the leadcontrol bank movement occurs over a rel<strong>at</strong>ively short time.The event was also evalu<strong>at</strong>ed with the delta-kW/ftapproach by using d<strong>at</strong>a for each fuel pin in the core (d<strong>at</strong>awhich is typically not available during oper<strong>at</strong>ionaltransients).Exploring the same plot of delta-kW/ft/hr with d<strong>at</strong>afor every pin in every node in the core (Fig. 6.) highlightsone major inadequacy of this monitoring method – namelyth<strong>at</strong> it ignores local (pin-level) changes, which can besignificantly larger in magnitude than more coarse nodewised<strong>at</strong>a.This pin d<strong>at</strong>a is compared with the nodal results andpresented as Fig.6. Note th<strong>at</strong> in the following plot, the d<strong>at</strong>ain red is pin-by-pin delta-kw/ft/hr, while the d<strong>at</strong>a in blackis the nodal delta-kw/ft/hr.Fig. 6. Pin-by-Pin Margin-to-<strong>PCI</strong> during Open Valve TestThe results demonstr<strong>at</strong>e th<strong>at</strong> using nodal d<strong>at</strong>a vs.detailed pin inform<strong>at</strong>ion does not show the significantlyhigher changes in LHGR th<strong>at</strong> individual pins couldexperience during a power transient. (Even though for thisparticular case there is not sufficient evidence, even withthermo-mechanical fuel performance analysis to support<strong>PCI</strong> failure.)Finally, neither the nodal d<strong>at</strong>a based delta-kW/ft/hrmodel nor the pin-by-pin delta-kW/ft/hr models aresufficient for diagnosing <strong>PCI</strong>. <strong>PCI</strong> is predic<strong>at</strong>ed not only inchanges in kW/ft but also a time component (e.g., howquickly the changes have occurred, has the fuel claddingbeen conditioned to the higher LHGR, etc.).V. B. Threshold LHGR Results for Results for OpenValve TestUsing the same detailed pin-by-pin LHGR d<strong>at</strong>agener<strong>at</strong>ed from CMSOps during the open valve test, thealtern<strong>at</strong>ive threshold model 8 was applied. As previouslymentioned, this model requires certain constants for thecomponents for monitoring (e.g., conditioning/deconditioningr<strong>at</strong>es, etc.).The results presented in Fig. 7. indic<strong>at</strong>es similarmargin for the most limiting pin during the transient usingthe threshold model and empirical d<strong>at</strong>a from <strong>Studsvik</strong>Nuclear 9 .In the figure the inlet temper<strong>at</strong>ure vs. time during theevent is plotted against the right-side y-axis and the leadcontrol bank position on the left-side y-axis.
Proceedings of 2010 LWR Fuel Performance/TopFuel/WRFPMOrlando, Florida, USA, September 26-29, 2010Paper 097Fig. 7. Margin to <strong>PCI</strong> <strong>During</strong> Open Valve Test fromThreshold ModelAlthough every pin was evalu<strong>at</strong>ed for susceptibility to<strong>PCI</strong>, a simple way to summarize the event is shown in thefigure as <strong>PCI</strong>UTL (shown in blue). <strong>PCI</strong>UTL is defined asthe margin to <strong>PCI</strong> for the most limiting pin per time stepduring the event. The model accommod<strong>at</strong>es the situ<strong>at</strong>ionwhere the limiting pin loc<strong>at</strong>ion is changing from time stepto time step. Basically, the margin is calcul<strong>at</strong>ed for everypin and only the most limiting margin value is presented inthe figure. The results show th<strong>at</strong> there was sufficientmargin during the event to <strong>PCI</strong> failure.V. C. Thermo-Mechanical Fuel Performance AnalysisResultsThe last <strong>PCI</strong> analysis conducted for the open valve testwas to analyze every pin via the ONUS integr<strong>at</strong>ed fuelperformance analysis (ENIGMA and CMS using detailedoper<strong>at</strong>ional histories from CMSOps CMSOps) 10 .The most limiting parameter analyzed was the marginto maximum clad yield stress during the open valve test.The result is summarized here as Fig. 8. The ENGIMAanalysis assumed a failure yield stress of 93.5 kPSI. (Theactual limit is fuel design type- and exposure-dependent,but the vari<strong>at</strong>ion is insignificant with the amount of marginth<strong>at</strong> exists for the fuel during this test.)Fig. 8. Margin to Yield Stress Limit of Most Limiting Pin<strong>During</strong> Open Valve TestThe cases shown in the figure's x-axis correspond tothe time during which the open valve test was conducted,(approxim<strong>at</strong>ely 8 hours). In the figure, the most limitingpin – in terms of smallest margin to yield stress (cladfailure) – was in one of the assemblies which the leadcontrol bank was partially inserted/withdrawn. Theminimum margin occurred axially near the core mid-plane.The figure also shows the lead control bank positionduring the test and the LHGR of the limiting pin. Theminimum margin (highest stress) occurs <strong>at</strong> the deepestinsertion of the lead control bank, most probably due to theLHGR being redistributed as the lead control banksuppresses power in the upper axial region of theassemblies into which they are inserted.Other findings from the ONUS results are th<strong>at</strong> the pinswith the highest crack lengths (albeit with crack lengthsonly a fraction of 1% of the total clad thickness) are fromhigher depleted assemblies (pin-average exposures ofabout 45 GWd/T) where pellet clad gap closure will havealready occurred. However, because the higher depletedassemblies were loc<strong>at</strong>ed on the periphery of the core, thepin LHGRs before, during, and after the event wererel<strong>at</strong>ively low and consequently SCC propag<strong>at</strong>ionnegligible.Detailed pin-by-pin results for minimum margin yieldstress during the event are presented in Fig. 9. The axialloc<strong>at</strong>ion where the minimum margin occurs is in thebottom half of the core. When the lead control bank ispartially inserted, the power in this lower region of thecore increases leading to a system<strong>at</strong>ic increase in stress onthe clad (margin decrease). When this lead control bank isfully withdrawn, the power in this lower region decreasesagain and the stress on the clad relaxes (margin increase).
Proceedings of 2010 LWR Fuel Performance/TopFuel/WRFPMOrlando, Florida, USA, September 26-29, 2010Paper 097Pins with the lowest margin during the event are fromthe same assembly loc<strong>at</strong>ions in which the lead control bankwas partially inserted during the event. These assemblieshave pin exposures high enough th<strong>at</strong> the fuel/clad gap isexpected to have closed prior to the event.Furthermore, using these thorough and rigorousmethods, it has provided confidence th<strong>at</strong> the fuel failureexperienced during the open valve test in the SouthernNuclears <strong>PWR</strong> was not caused by <strong>PCI</strong>. This analysishelped elimin<strong>at</strong>ed this potential cause from any furtherinvestig<strong>at</strong>ion and has allowed Southern Nuclear to focusresources onto other potential sources of fuel failure. (Rootcause analysis results based on poolside inspectionsconducted by Southern <strong>at</strong> the end of cycle turned out to beconsistent with results from these studies.)The techniques presented in this study were applied toanalyze a past oper<strong>at</strong>ing event, but they can also easily beapplied to the simul<strong>at</strong>ion of a future power maneuvers toassess margin to fuel performance parameters (such as cladstress, strain) before the event actually occurs. The resultscould then be used to alter the power maneuver, ifnecessary, to ensure sufficient margin and help reducepotential fuel failures.Fig. 9. Minimum margin to clad yield stress (lead controlbank partially inserted)The results indic<strong>at</strong>e there is still a large degree ofmargin before fuel failure would occur, even for the mostlimiting pin loc<strong>at</strong>ions during this event. (Fuel failure mightstill be possible due to prior mechanical damage th<strong>at</strong> couldhave been exacerb<strong>at</strong>ed during this event; missing pelletsurface, introduction of foreign m<strong>at</strong>erial hitting the fuelpin, hydriding, etc.)VI. CONCLUSIONThree different methodologies to evalu<strong>at</strong>e fuelperformance in terms of <strong>PCI</strong> were applied to an actualtransient from oper<strong>at</strong>ing <strong>PWR</strong>. The methods range fromexamining changes in coarse nodal LHGR's (delta-kW/ftmodel) during the transient as an indic<strong>at</strong>or of <strong>PCI</strong>susceptibility, to a threshold-based pin-by-pin model, tothermo-mechanical fuel performance analysis for every pinin the entire core.The work here demonstr<strong>at</strong>es th<strong>at</strong> all three approachesare comput<strong>at</strong>ionally feasible and th<strong>at</strong> limit<strong>at</strong>ions ofperforming coarse analysis using nodal LHGR d<strong>at</strong>a (inwhich the margin to <strong>PCI</strong> is underestim<strong>at</strong>ed) can bereplaced with explicit pin-by-pin thermo-mechanical fuelperformance evalu<strong>at</strong>ion during plant oper<strong>at</strong>ion.The coupled CMS-ENIGMA analysis hasdemonstr<strong>at</strong>ed how an explicit pin-by-pin <strong>PCI</strong> analysis canbe applied during actual oper<strong>at</strong>ing events for fuelperformance assessment.NOMENCLATURE<strong>PCI</strong> – Pellet Clad InteractionLHGR – Linear He<strong>at</strong> Gener<strong>at</strong>ion R<strong>at</strong>e<strong>PWR</strong> – Pressurized W<strong>at</strong>er ReactorDelta-kW/ft – delta kilow<strong>at</strong>t per foot (energy)SCC - Stress Corrosion CrackingBOC – Beginning of CycleHFP – Hot Full PowerMTC – Moder<strong>at</strong>or Temper<strong>at</strong>ure CoefficientCMS – <strong>Studsvik</strong> Core Management SystemkPSI – kilo-pounds per square inch (pressure)MPa – mega Pascals (pressure)GWd/T – gigaw<strong>at</strong>t days per metric ton (exposure)REFERENCES1. J. D. RHODES, K. S. SMITH, J. D. LEE,“CASMO-5 Development and Applic<strong>at</strong>ions,”PHYSOR 2006, Vancouver, Canada, (Sept 2006).2. K.S. SMITH et al., “SIMULATE-3 Methodology,”<strong>Studsvik</strong> Report, SOA-95/18 (1995).3. A. DIGIOVINE and A. NOËL, “GARDEL-<strong>PWR</strong>:<strong>Studsvik</strong>’s Online <strong>Monitoring</strong> and ReactivityManagement System,” Proceedings of Advances
Proceedings of 2010 LWR Fuel Performance/TopFuel/WRFPMOrlando, Florida, USA, September 26-29, 2010Paper 097In Nuclear Fuel Management III, Hilton HeadIsland, SC (October 2003).4. S. TARVES, A. DIGIOVINE, "CMSOpsReactivity Management and <strong>PCI</strong> Analysis forSelected Events <strong>During</strong> <strong>PWR</strong> <strong>Oper<strong>at</strong>ion</strong>s forSouthern Nuclear," <strong>Studsvik</strong> Report SSP-08/453C, December 2008.5. W. J. KILGOUR, J. A. TURNBULL, R. J.WHITE, A. J. BULL, P. A. JACKSON and I. D.PALMER, “Capabilities and Valid<strong>at</strong>ion of theENIGMA Fuel Performance Code,” ANSintern<strong>at</strong>ional topical meeting on LWR fuelperformance, Avignon (April 1991).6. R. W. H. GREGG, “Whole Core FuelPerformance Calcul<strong>at</strong>ions,” IAEA TCM on w<strong>at</strong>erreactor fuel performance modeling, Kendal(September 2005).7. A. WORRAL, A. S. DIGIOVINE, "ONUS: On-Line Fuel Performance Surveillance – Linking<strong>Studsvik</strong>’s CMS With UK NNL’s ENIGMA-B,"Proceedings of Global 2009, Paris, France,September 6-11, 2009.8. <strong>Studsvik</strong> Report SSP-02/438, Pellet CladInteraction (<strong>PCI</strong>) Model in SIMULATE-3, June2004.9. AEN/NEA present<strong>at</strong>ion, Current <strong>PCI</strong> criteria,rel<strong>at</strong>ion to SCIP scope, C. Vitanza, SCIP April2006. (<strong>Studsvik</strong> Clad Interaction Program –SCIP).10. R. W. H GREGG, "Whole Core Fuel PerformanceAssessment of <strong>PWR</strong> Open Valve Test Event,"N<strong>at</strong>ional Nuclear Labor<strong>at</strong>ory memo to <strong>Studsvik</strong>Scandpower, August 3, 2009.


