- Page 1 and 2:
UNITED STATESSECURITIES AND EXCHANG
- Page 3 and 4:
TABLE OF CONTENTSINTRODUCTION AND U
- Page 5 and 6:
INTRODUCTION AND USE OF CERTAIN TER
- Page 7 and 8:
Historical Performance and Market D
- Page 9 and 10:
• the departure of some or all of
- Page 11 and 12:
(US$ Millions) Mar. 31, 2012 Dec. 3
- Page 13 and 14:
Our company is not, and does not in
- Page 15 and 16:
Additionally, as part of our strate
- Page 17 and 18:
Our inability to enter into renewal
- Page 19 and 20:
The computation of cost reimburseme
- Page 21 and 22:
management agreement in limited cir
- Page 23 and 24:
• differences in cultures;• cha
- Page 25 and 26:
• the same professionals within B
- Page 27 and 28: to the agreement. In addition, beca
- Page 29 and 30: our company. In particular, our uni
- Page 31 and 32: fractional units, without reduction
- Page 33 and 34: federal income tax purposes, direct
- Page 35 and 36: Under legislation recently enacted
- Page 37 and 38: the Property Partnership, income fo
- Page 39 and 40: “taxable Canadian property”. Un
- Page 41 and 42: THE SPIN-OFFBackground to and Purpo
- Page 43 and 44: Transaction AgreementsOur company a
- Page 45 and 46: • recognize that superior returns
- Page 47 and 48: • Trizec Western Canada - 3.5 mil
- Page 49 and 50: As at the dates set out below, we h
- Page 51 and 52: Office Property Portfolio (1) Asset
- Page 53 and 54: Our strategy is to sign long-term l
- Page 55 and 56: Our portfolio also includes, as at
- Page 57 and 58: The following table presents the le
- Page 59 and 60: properties that we believe have sig
- Page 61 and 62: domestic economy and overall low un
- Page 63 and 64: Environmental ProtectionWe are comm
- Page 65 and 66: consideration for causing the Prope
- Page 67 and 68: Operating EntitiesOur business is o
- Page 69 and 70: Multi-Family and Industrial Platfor
- Page 71 and 72: NOI is used as a key indicator of p
- Page 73 and 74: Opportunistic Investmentsopportunit
- Page 75 and 76: First Quarter Performance Highlight
- Page 77: development sites, we will proceed
- Page 81 and 82: RetailIFRS Value - RetailThe follow
- Page 83 and 84: The key valuation metrics of our re
- Page 85 and 86: FFO for the three months ended Marc
- Page 87 and 88: Financial Highlights and Performanc
- Page 89 and 90: Equity accounted investments as at
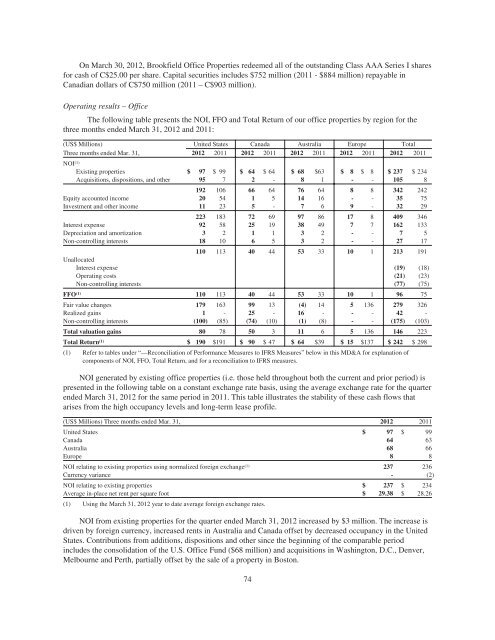
- Page 91 and 92: Operating results - OfficeThe follo
- Page 93 and 94: The results of operations are prima
- Page 95 and 96: etter than expected leasing market
- Page 97 and 98: interests, of $681 million. Discoun
- Page 99 and 100: NOI increased over the periods due
- Page 101 and 102: The key valuation metrics of these
- Page 103 and 104: increase in interest rates on inter
- Page 105 and 106: more stringent environmental laws a
- Page 107 and 108: Other DerivativesThe following othe
- Page 109 and 110: TRZ Holdings; in the event the JV P
- Page 111 and 112: available- for-sale. Estimation of
- Page 113 and 114: The components of NOI for the three
- Page 115 and 116: The following table presents a reco
- Page 117 and 118: • fund those capital expenditures
- Page 119 and 120: Given the small amount of new offic
- Page 121 and 122: The following table presents certai
- Page 123 and 124: nominating and governance committee
- Page 125 and 126: investments and activities or in re
- Page 127 and 128: 7.B. RELATED PARTY TRANSACTIONSRELA
- Page 129 and 130:
Other ServicesBrookfield may provid
- Page 131 and 132:
Partnership. See Item 10.B. “Addi
- Page 133 and 134:
connection with a particular transa
- Page 135 and 136:
• recommending to the Holding Ent
- Page 137 and 138:
• any of the Managers is grossly
- Page 139 and 140:
2002 to directors, executives or se
- Page 141 and 142:
Nature and PurposeUnder our limited
- Page 143 and 144:
Bermuda Limited Partnership Act 188
- Page 145 and 146:
In addition, the BPY General Partne
- Page 147 and 148:
Withdrawal of the BPY General Partn
- Page 149 and 150:
entity or any other holding entity
- Page 151 and 152:
• ratified and confirmed all cont
- Page 153 and 154:
agreement, a holder of Property Par
- Page 155 and 156:
(including, generally, debt owed to
- Page 157 and 158:
In addition, pursuant to the Voting
- Page 159 and 160:
In addition, the Property GP LP may
- Page 161 and 162:
successor general partner will have
- Page 163 and 164:
Indemnification; Limitations on Lia
- Page 165 and 166:
subject to U.S. federal income taxa
- Page 167 and 168:
the Obama administration proposes t
- Page 169 and 170:
asis of units owned by you prior to
- Page 171 and 172:
consent of the IRS. The Section 754
- Page 173 and 174:
Income Exception, we may determine
- Page 175 and 176:
generally would constitute debt-fin
- Page 177 and 178:
expected income and assets, the BPY
- Page 179 and 180:
any particular time (in light of po
- Page 181 and 182:
(c)(d)the amount and description of
- Page 183 and 184:
Taxation of Canadian Resident Limit
- Page 185 and 186:
Canadian Limited Partner and will b
- Page 187 and 188:
CFA in respect of which the FAPI wa
- Page 189 and 190:
(under Tax Proposals released on Au
- Page 191 and 192:
our actual results of operations an
- Page 193 and 194:
10.G. STATEMENT BY EXPERTSThe follo
- Page 195 and 196:
PART IIITEM 13.DEFAULTS, DIVIDEND A
- Page 197 and 198:
SIGNATURESThe registrant hereby cer
- Page 199 and 200:
COMMERCIAL PROPERTY OPERATIONS OF B
- Page 201 and 202:
Commercial Property Operations of B
- Page 203 and 204:
Commercial Property Operations of B
- Page 205 and 206:
Commercial Property Operations of B
- Page 207 and 208:
The financial statements are prepar
- Page 209 and 210:
liabilities are provided for using
- Page 211 and 212:
In a net investment hedging relatio
- Page 213 and 214:
provided in connection with a lease
- Page 215 and 216:
over from IAS 39 the requirements f
- Page 217 and 218:
Values are most sensitive to change
- Page 219 and 220:
NOTE 7: EQUITY ACCOUNTED INVESTMENT
- Page 221 and 222:
Included in other non-current asset
- Page 223 and 224:
NOTE 13: CAPITAL SECURITIESCapital
- Page 225 and 226:
The major components of income tax
- Page 227 and 228:
(b) Property net operating incomeNe
- Page 229 and 230:
NOTE 22: CAPITAL MANAGEMENT AND LIQ
- Page 231 and 232:
Other derivativesThe following othe
- Page 233 and 234:
The following table outlines financ
- Page 235 and 236:
NOTE 24: RELATED PARTIESIn the norm
- Page 237 and 238:
(US$ Millions) Revenue Net operatin
- Page 239 and 240:
Schedule III -Supplemental Schedule
- Page 241 and 242:
Commercial Property Operations of B
- Page 243 and 244:
Commercial Property Operations of B
- Page 245 and 246:
Commercial Property Operations of B
- Page 247 and 248:
(b) Adoption of Accounting Standard
- Page 249 and 250:
distributed by GGP. The Business su
- Page 251 and 252:
NOTE 10: OTHER NON-CURRENT LIABILIT
- Page 253 and 254:
(b) Property net operating incomePr
- Page 255 and 256:
NOTE 19: RELATED PARTIESIn the norm
- Page 257 and 258:
The following summary presents fina
- Page 259 and 260:
Report of Independent Registered Ch
- Page 261 and 262:
BROOKFIELD PROPERTY PARTNERS L.P.NO
- Page 263 and 264:
Report of Independent Registered Ch
- Page 265 and 266:
BROOKFIELD PROPERTY PARTNERS LIMITE
- Page 267 and 268:
TRZ HOLDINGS LLC AND SUBSIDIARIESCo
- Page 269 and 270:
Independent Auditor’s ReportTo th
- Page 271 and 272:
TRZ HOLDINGS LLC AND SUBSIDIARIESCO
- Page 273 and 274:
TRZ HOLDINGS LLC AND SUBSIDIARIESCO
- Page 275 and 276:
TRZ HOLDINGS LLC AND SUBSIDIARIESNO
- Page 277 and 278:
the associated lease and any contra
- Page 279 and 280:
Accounting for Uncertain Tax Positi
- Page 281 and 282:
3. REAL ESTATEThe Company’s inves
- Page 283 and 284:
Statement of Operations Information
- Page 285 and 286:
Future amortization of these intang
- Page 287 and 288:
Collateralized Property Loans — P
- Page 289 and 290:
Subsequent to April 9, 2009, in con
- Page 291 and 292:
INDEX TO UNAUDITED PRO FORMA FINANC
- Page 293 and 294:
BROOKFIELD PROPERTY PARTNERS L.P.Un
- Page 295 and 296:
BROOKFIELD PROPERTY PARTNERS L.P.Un
- Page 297 and 298:
The company and Brookfield intend f
- Page 299 and 300:
The unaudited pro forma balance she
- Page 301 and 302:
(g) Exclusion of Brookfield’s 2%
- Page 303 and 304:
REF58435NAME OF PARTNERSHIP:CERTIFI
- Page 305 and 306:
DECLARATIONMade pursuant to The Exe
- Page 307 and 308:
REF58435BERMUDALimited Partnership
- Page 309 and 310:
Registration No. 46137BERMUDACERTIF
- Page 311 and 312:
Dated the 8thday of March 2012.THE
- Page 313 and 314:
THIS LIMITED PARTNERSHIP AGREEMENT
- Page 315 and 316:
11. TERM: DISSOLUTION: CONTINUATION
- Page 317 and 318:
15.2 any certificates or other inst
- Page 319 and 320:
Exhibit 4.1MASTER PURCHASE AGREEMEN
- Page 321 and 322:
2. Covenants to Complete the Reorga
- Page 323 and 324:
4.5 Brookfield and BPY will also, d
- Page 325 and 326:
IN WITNESS WHEREOF the parties here
- Page 327 and 328:
The Australian Operations are compr
- Page 329 and 330:
TABLE OF CONTENTSARTICLE 1INTERPRET
- Page 331 and 332:
MASTER SERVICES AGREEMENTTHIS AGREE
- Page 333 and 334:
1.1.15 “Equity Enhancement Distri
- Page 335 and 336:
1.1.35 “Permit” means any conse
- Page 337 and 338:
1.3.5 any reference to this Agreeme
- Page 339 and 340:
2.3 Other ManagersThe Managers may,
- Page 341 and 342:
3.2.2 For greater certainty and not
- Page 343 and 344:
ARTICLE 6INFORMATION AND RECORDS6.1
- Page 345 and 346:
Recipients elect to pay all or a po
- Page 347 and 348:
ARTICLE 8BROOKFIELD’S OBLIGATIONB
- Page 349 and 350:
and against any claims, liabilities
- Page 351 and 352:
11.2.1.2 any of the Managers engage
- Page 353 and 354:
11.6 Release of Money or other Prop
- Page 355 and 356:
12.4.2 if to the Property Partnersh
- Page 357 and 358:
IN WITNESS WHEREOF the parties have
- Page 359 and 360:
BROOKFIELD DEVELOPMENTS EUROPELTD.B
- Page 361 and 362:
BROOKFIELD BPY PROPERTY HOLDINGS II
- Page 363 and 364:
6. Governing Law. This Joinder will
- Page 365 and 366:
Exhibit 4.4BROOKFIELD ASSET MANAGEM
- Page 367 and 368:
BETWEEN:RECITALS:RELATIONSHIP AGREE
- Page 369 and 370:
over a majority of the voting inter
- Page 371 and 372:
1.3.4 except as otherwise provided
- Page 373 and 374:
partners or financial sponsors and
- Page 375 and 376:
2.7 ReportingSubject to confidentia
- Page 377 and 378:
3.3.4 the execution and delivery of
- Page 379 and 380:
ARTICLE 6GENERAL PROVISIONS6.1 Limi
- Page 381 and 382:
6.7 Other Holding EntitiesThe parti
- Page 383 and 384:
Schedule AIN WITNESS WHEREOF the Ma
- Page 385 and 386:
Schedule BIN WITNESS WHEREOF the Ho
- Page 387 and 388:
Exhibit 4.5BROOKFIELD ASSET MANAGEM
- Page 389 and 390:
THIS AGREEMENT made as of the day
- Page 391 and 392:
1.1.17 “FINRA” means Financial
- Page 393 and 394:
1.1.39 “U.S. Exchange Act” mean
- Page 395 and 396:
Agreement will not operate as a wai
- Page 397 and 398:
2.1.5 Priority on Demand Registrati
- Page 399 and 400:
(b)follows: (i) first, the securiti
- Page 401 and 402:
2.5 Registration ProceduresWhenever
- Page 403 and 404:
(g)(h)(i)(j)(k)as practicable there
- Page 405 and 406:
(o)(p)(q)(r)(s)(t)(u)cause the Regi
- Page 407 and 408:
contained in any Registration State
- Page 409 and 410:
fault of the indemnifying party and
- Page 411 and 412:
have been delivered by BPY and subs
- Page 413 and 414:
IN WITNESS WHEREOF the parties have
- Page 415 and 416:
TABLE OF CONTENTSARTICLE 1INTERPRET
- Page 417 and 418:
ARTICLE 1INTERPRETATION1.1 Definiti
- Page 419 and 420:
1.3.6 in the event that any day on
- Page 421 and 422:
2.1.3.3 any plan or proposal for a
- Page 423 and 424:
3.2.4 the execution and delivery of
- Page 425 and 426:
5.5 NoticesAny notice or other comm
- Page 427 and 428:
IN WITNESS WHEREOF the parties have