
You also want an ePaper? Increase the reach of your titles
YUMPU automatically turns print PDFs into web optimized ePapers that Google loves.
<strong>DataQuest</strong>GlobalIT MarketInsightSEMlllONDUCTOR SUPPLY ANDPRICING WORLDWIDE:Dataquest'S Semiconducto^''^i^ty and Pricing Worl^idM^fOgram responds to thequick iriprmdftjbTi needs of semiconductor users. Cl^Wts of this program receiveindispensable mprmation needed to make solid, intelli^iti and ti^rhely procurementand design-in decisions.Key TopicsWant to learnmore aboutDataquest?Please visitDataquest Interactiveour Internet-basedinformation service at:www. dataquest.comThe Seiriicjondficibr Supplyand Pricing p:^glamprovides advicfe andanalysis to help clientsmake successful businessdecisions. Publicationsinclude a mix of analyticalarticles, weekly newsbulletins and event-drivenfaxes, focused reports, andtimely market statisticspublished on a regularschedule throughout theyear.Briefiilg^^and conferencepresentations bring clientstogether with analysts toshare insights andopinions.Key topics coveredthroughout the year in ourpublications and briefingswill include:• Semiconductorprices/lead times• Semiconductor costmodelsMarJset/product/life cycleanalysesSemiconductor inventorylevelsCapital spending overviewSem^iconductor user surveyson technologies, products,packagingSemiconductor technologyand application trendsPrinted circuit boardmarket trendsMarket CoverageQuarterly Price ForecastsDataquest publishes shortandlong-term forecastseach quarter for more than200 products in thefollowing semiconductorproduct families:• DRAMs• SRAMs• EPROMs• Flash memory ICs• ROMs• Microprocessors• Gate arrays/CBICs• Standard logicQuarterly ProcurementPulse Survey ResultsBased on surveys ofprocurement managers,this quarterly updatetracks critical issues andmarket trends, including:• Average semiconductororder rates• Average semiconductorlead times• Semiconductorinventory levelsMonthly Price/Lead TimeUpdatesDataquest publishesmonthly price and leadtime updates on 25products, three volumelevels, and six regionsworldwide.Market StatisticsThis program also provides atop-level view of the products,markets, and companies of theworldwide semiconductorindustry. Statistics include:• Semiconductor marketshare estimates• Worldwide consuniptionforecasts by regionAnnual Product/MarketUpdatesProduct life cycles, marketrankings, and supplier allianceanalyses are provided for:• DRAMs• SRAMs• Nonvolatile memories• MPUs• ASICs• Semiconductor cost models
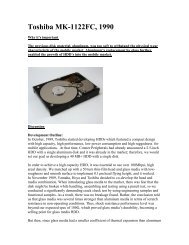
# Dataquestj T p J? T251 River Oaks Parkway • San Jose • CA • 95134-1913 • Phone 408-468-8000 • Fax 408-954-1780First Quarter 1997 Procurement Pulse: Order RatesRebound while Lead Times and Inventories StabilizeThe Procurement Pulse is a quarterly update (with interval updates, if events warrant) of criticalissues and market trends based on surveys of semiconductor procurement managers in theNorth American region. Besides order rate, lead time, and inventory information, this surveyalso notes price status by semiconductor product family and package type, as well as keyproblems facing semiconductor users.Figure 1Averaged Monthly Semiconductor OrdersFigure 2Averaged Semiconductor Lead TimesOrder Index, 12/88 = 100600-flWeeks6/96 7/96 8/96 9/96 10/9611/9612/96 1/97T 1 1 1 r6/96 7/96 8/96 9/96 10/96 11/96 12/96Figure 3Actual vs. Target Inventory Levels(All OEMs)Figure 4Actual vs. Target Inventory Levels(Computer OEMs)T 1 1 1 r6/96 7/96 8/96 9/96 10/96 11/96 12/96T 1 1 1 r6/96 7/96 8/96 9/96 10/96 11/96 12/96Source: Dataquest (January 1996)January 15,1997©1997 Dataquest
SSPS-WW-DA-9701Semiconductor Supply and Pricing WorldwideSemiconductor Order Rate Expected to Bounce Back after Two Months ofCautious ForecastsAs seen in Figure 1, the outlook for semiconductor order activity is expected to pick up afterthe slowdown of forecast expectations over the past two months. Although 37 percent higherthan last December's forecast index, the outlook for January has historically increased over theinventory rundown-influenced year-end low order outlook. This increase in order activity isexpected despite lower overall prices of semiconductors. The continued buoyancy of theelectronics market continues to benefit from these price declines where steady urut volumes arebeing ordered at lower dollar outlays. The overall sample continues to see price cuts for largervolumecontracts in all areas tracked in this survey—DRAM, MPUs, logic, flash memory, andSRAM (especially in DRAM and MPUs). DRAM pricing for the overall sample fell, on average,1.6 percent in December after a 1.1 percent average drop noted in November. The computersubset of the respondents saw a more aggressive DRAM price cut of 4 percent in Decemberafter a 4 percent average drop noted in November. Although overall prices continue to decline,pricing for different semiconductor packaging (except for two respondents using TSOP) hasreached parity.Lead Times for Semiconductors Hover around Nine WeeicsFigure 2 shows that the average lead time for respondents in December inched up to 9.0 weeks,compared with an 8.6-week average noted in November. The relative stability of lead timesaround nine weeks over the past three quarters reflects the excellent availability and pricing ofparts that has kept customer-required delivery schedules the norm. Now, well over a year intoa buyer's market, many procurement managers continue to balance price cuts with supply baserelations. Good service levels combined with ever-lower prices are cementing many long-termsupplier relations. Out of the entire sample, only two respondents noted problems withproducts, those being ASICs and some older standard logic parts. For the vast majority of therespondents and the overall market, however, there are no problems regarding productavailability or pricing. Like last quarter, over half of this month's respondents noted pricefluctuations or inventory adjustments and end-of-life ordering as the key issues now takingprecedence. As noted over the past year, we expect the volatility of the spot market to continueto vacillate around declining contract prices, causing uncertainty for some buyers. The overalltrend, however, is for continued good availability, consistently declining prices, and low leadtimes (eight to 10 weeks) for the next six to nine months.Semiconductor inventories Bacic to Historical LevelsFigures 3 and 4 highlight how inventories have stabilized over the past three quarters and arein synchrony with system unit demand. Even with semiconductor order rates forecast to rise asnoted above, we do not expect semiconductor inventories to rise, as availability is good andprices are expected to continue their decline. The overall targeted and actual semiconductorinventory levels for December were 12.4 days and 14.6 days, respectively, compared withNovember's 9.6-day and 8.6-day inventory levels. The computer subset now appears lessaggressive than the average, possibly realigning increases in inventory with anticipated higherfirst quarter 1997 sales. The current target and actual inventory levels of 17.5 days and 21.5January 15,1997©1997 Dataquest
SSPS-WW-DA-9701Semiconductor Supply and Pricing Worldwidedays compare with November levels of 11.7 and 15.3 days on hand for the computer subset.We continue to expect to see stabilized inventory levels in line with system sales levels.Dataquest PerspectiveAvailability of semiconductors remains very good to excellent, and we expect it to remain thisway for the rest of 1997. Prices continue to decline, despite the efforts of some memorysuppliers to curtail output, and lead times have stabilized to meet customer demand. Evenwith relentlessly low prices on the DRAM spot market, the volume of business through thischannel is surprisingly low. This reflects the focus of users on total cost, not price alone, whendetermining a component buy. Although Dataquest forecasts steady 1997 growth rates for PCsand other electronics relative to 1996, the overall trend follows an upward growth slope. Usersemiconductor inventory levels are now in line with user demand, and we expect to seecontinual balance in these indexes in the near future. Allocations are not a problem, asobsolescence now has users' attention. Dataquest expects to see excellent semiconductoravailability through the end of 1997. DRAM and MPU price elasticity to date have not proppedup prices. Although the spot market continues to lead contract pricing lower, cost barriers willcontinue to moderate steep price cuts in this area. The good news for users is that decliningprices will continue to be with us for the remainder of this year.By Mark A. GiudiciJanuary 15,1997©1997 Dataquest
<strong>DataQuest</strong>J
PerspectiveSemiconductor Supply and Pricing WorldwideMarket AnalysisFourth Quarter 1997 Procurement Pulse: Order Rates Mixed,Lead Times Up, Inventories Jump, and Spot Prices Continue toLead Contracts DownAbstract: The Procurement Pulse is a quarterly update (-with interval updates, if eventswarrant) of critical issues and market trends based on surveys of semiconductorprocurement managers in the North American region. Besides order rate, lead time, andinventory information, this survey also notes price status by semiconductor product familyand package type, as ivell as key problems facing semiconductor users.By Mark A. Giudici>n (-1-^r^OU-LI!DN"Z111.J~->4;,-*^^ V*'^
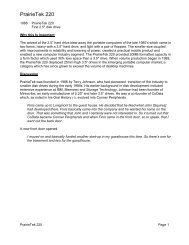
Figure 1Semiconductor Supply and PricingSemiconductor Supply and Pricing"V\/orldwideprices continue to fall, TSOP and BGA packages continue to earn (albeitsmaller) premiums of 1 to 2 percent over more standard package offerings.Section AAveraged Monthly Semiconductor OrdersIndex, 12/88=100Dalian12Section BSpot Market vs. Contract Prices(1MBx16 EDO DRAM)—^ Spot Low Spot High Contract-| \ T 1 T^-^3/97 4/97 5/97 6/97 7/97 8/97 9/97 10/979/11 10/3WeeksSection CAveraged Semiconductor Lead TimesSection DActual vs. Target Inventory Levels(All OEMs)1 r3/97 4/97 5/97 6/97 7/97 8/97 9/97Source: Dataquest (April 1997)T 1 r3/97 4/97 5/97 6/97 7/97 8/97 9/97977147Spot Market Pricing Again Leads Contract Pricing—DownAs a popular bellwether, DRAM spot pricing continues to nose-dive,highlighting the oversupply of memory, as shown in Section B. The secondquarter scheme to control prices succeeded only in the volatile and lowvolumespot market, as shown in the figure. The shift to the 64Mb DRAMdevice is now in full swing; although Dataquest still foresees a marketcrossover from the 16Mb part in the second or third quarter of 1998, someindividual suppliers may already be there (using their own pricing as acrossover benchmark). As noted over the past year, Dataquest expects spotmarket prices to continue to vacillate around declining contract prices,causing uncertainty for some buyers. The overall trend, however, is forSSPS-WW-DP-9714 ©1997 Dataquest October 9,1997
Semiconductor Supply and Pricing Worldwidecontinued good avciilability, consistently declining contract prices, and lowlead times (six to nine weeks) for the next six to nine months for contractbuyers.Lead Times for Semiconductors Remain Manageable: Under Eight WeeksSection C shows that the average lead time for respondents in Septemberedged up slightly, to 7.3 weeks, compared with a 6.7-week average noted inAugust. The current stability of lead times is due in part to the removal ofuncertainty over DRAM supplies and the perception of good availability forthe near future. Even though spot prices are at all-time lows, most buyers aresatisfied with the current low contract pricing and the stability thosedeliveries provide. Good service levels and slowly declining prices arecementing many long-term supplier relationships. Although there were nosupply problems noted in this month's survey, it should be remembered thatgood communication with suppliers often averts problems. With generalavailability good and improving, there now appear to be few supplyproblems to complain about.Semiconductor Inventories Back to Historical LevelsDataquest PerspectiveSection D shows that inventories continue to overshoot targeted levels after asharp dip in August. As respondents forecast semiconductor order rates tomodulate, there is a corresponding slight increase in inventory levels, morein line with historical levels. The overall targeted and actual semiconductorinventory levels for September were 18.2 days and 20.8 days, respectively,compared with August's 12.8-day and 8.9-day inventory levels. Althoughnot shown, the computer subset again appears more conservative than theaverage, with current target and actual inventory levels of 22.5 days and 17.5days, respectively. Dataquest continues to expect to see stabilized inventorylevels in the future, in line with steady systems sales levels.Availability of semiconductors remains very good and is expected to remainthis way for the rest of 1997 and into early 1998. As Dataquest has notedsince last March, contract prices continue to decline despite the efforts ofsome memory suppliers to curtail output, as noted earlier this year. Leadtimes have stabilized to meet customer demand, in line with the moderateprice declines. Dataquest continues to forecast steady 1997 growth rates forPCs and other electronics relative to 1996, with the overall trend following anupward growth slope. User semiconductor inventory levels are now in linewith demand, and continual balance in these indexes is expected in the nearfuture. Real allocations are not a problem, but the attempted quick shift ofsome suppliers to the 64Mb DRAM density appears to be causing thenon-64Mb suppliers with abundant capacity to lower prices faster, resultingin a push-out of plamned crossover time frames. Dataquest expects to seeexcellent semiconductor availability through the second and third quarters ofSSPS-WW-DP-9714 ©1997 Dataquest October 9,1997
Semiconductor Supply and Pricing Worldwide •1998. DRAM and MPU price elasticity to date have not propped up contractprices. The good news for users is that overall declining contract prices willcontinue for the remainder of this year and into the next.r\jl'l"Jl^^l If^Cj"*^'*'*'****^tr*^'^*"A Gartner Group CompanyFor More Information...Mark Giudici, Director and Principal Analyst (408) 468-8258Internet addressinark.g;iudici@dataquest.comVia fax (408)954-1780Dataquest Interactivehttp://www.dataquest.comThe content of this report represents our interpretation and analysis of information generally available to thepublic or released by responsible individuals in the si^bject companies, but is not guaranteed as to accuracy orcompleteness. It does not contain material provided to us in confidence by our clients. Reproduction ordlsclosiire in whole or in part to other parties shall be made upon the written and express consent of Dataquest.©1997 Dataquest—Reproduction ProhibitedDataquest is a registered trademark of A.C. Nielsen Company
PerspectiveSemiconductor Supply and Pricing WorldwideMarket AnalysisFourth Quarter 1997 Quarterly Price Survey HighlightsAbstract: Dataquest has completed its fourth quarter 1997 North American contract pricingsurvey for the semiconductors tracked. This Perspective analyzes the main signals seen, bothoverall and by main family type, and their impact on contract buyers worldwide.By Evelyn CroninVUjNLU—'^General Market CharacteristicsFor most device families, price reductions are set to continue but at acontrolled and stable pace. However, although asynchronous DRAM is stillgetting over its pricing free fall in the third quarter, Dataquest is stillforecasting price reductions for the next 18 months.Most devices in the growth and maturity phase of their life cycle curve cancontinue to expect controlled price reductions. Devices ramping up involume are still showing good price reduction potential. The forecastcontinued good availability allows buyers to play suppliers off against eachother on standard devices to get the best deal.As of the date of this writing, no supplier has gone public with DRAMproduction cutback announcements. This may well change if suppliers arefaced with the choice of losing money in order to sell products or cuttingback production to break even. Often, this decision results in accelerating themigration to newer products and product methods rather than just cuttingproduction.It would be highly unusual for a supplier to vastly scale back DRAMproduction in the fourth quarter, which is widely viewed as the busiestquarter for shipments and sales. Production plans may be tweaked to matchDataqyestProgram: Semiconductor Supply and Pricing WorldwideProduct Code: SSPS-WW-DP-9713Publication Date: September 29,1997Filing: Perspective(For Cross-Tectinology, file in the Semiconductor Devices and User Issues binder)
Semiconductor Supply and Pricing WorldwideDataquest Perspectiveproduction life of these processors, their actual market life will end whenIntel sells out.The MMX family has experienced very aggressive price reductions andcurrently is very attractively priced. These devices are gainingmomentum, and Intel has high hopes for fourth quarter volumes.The Pentium IIMPU family is coming down in price but at a lessdetermined rate than the Pentium MMX family. Although the Pentium IIis not the high-volume player for 1997, Intel has positioned it to take offnext year.The Apple clone market is no more, and PowerPC processors are soldonly to Apple. Thus, there is less incentive for Motorola Incorporatedand IBM to lower prices aggressively.Lead times have increased slightly at the low end of the supply window,up from two to three weeks. Thus, this quarter's lead-time range is threeto eight weeks.The third quarter was particularly slow from^ a DRAM demand perspective.There was a particularly large excess of DRAM, and prices fell dramatically.The DRAM spot market was on a downward price spiral throughout thequarter, and, although DRAM was plentiful there, customer orders werefew. The DRAM contract market also experienced strong, sharp pricereductions, and availability is excellent. Also, because buyers were notholding excess inventory, it is clear that the suppliers had to take the excessinventory risk.Going into the fourth quarter, survey participants remain fairly bullish aboutavailability and pricing on most device families. Although demand isforecast to be strong, all respondents were sure that supply would stillexceed it. Not surprisingly, the survey participants expect good pricereductions across the board. Also, lead times remain good, and thosesurveyed foresaw no major lead-time increases on the horizon.Intel has taken the pricing bull by the horns, and compute microprocessorshave seen some really aggressive price reductions from last quarter. This isparticularly true on the Pentium MMX product family, which is attractivelypriced to hit the volume PC sweet spot for the fourth quarter.Flash and SRAM continue to exhibit solid price reductions on high-densitydevices. Availability is good, and buyers do not see any supply problems onthe horizon. Lead times have remained largely unchanged from the lastquarter for the SRAM and flash devices tracked.DRAM remains a tricky area. There should be an oversupply on a permegabytebasis, but there may well be some product transition issues, whichmay cause instability. The instability may result in an excess of 16Mb EDOproduct and a pricing bloodbath or temporary shortages of certainsynchronous devices. Currently, price parity between EDO and synchronousSSPS-WW-DP-9713 ©1997 Dataquest September 29,1997
Semiconductor Supply and Pricing WorldwideDRAM (SDRAM) is not forecast by most respondents for 1997 or 1998. Thereare a few notable exceptions, though.The excess of EDO 16Mb product resulted in a dramatic price shift down inthe third quarter. All survey participants forecast that this price reductionwill continue, albeit at a less stellar rate. The SDRAM product did notexperience this sudden drop and so is more costly to buy on a per-megabytebasis, on average.On all device families, two-way communication between buyer and supplierremains vital. This is particularly so in the fourth quarter, which is thebusiest for many semiconductor end applications. Thus, keeping thechannels of communication clear and candid helps limit any potential infeedrisk.For More Information...Evelyn Cronin, Senior Industry Analyst (408) 468-8075Internet addressevelyn.cronin@dataquest.comVia fax (408)954-1780Dataquest Interactivehttp://www.dataquest.comThe content of this report represents our interpretation and analysis of information generally available to thepublic or released by responsible individuals in the subject companies, but is not guaranteed as to accuracy orcompleteness. It does not contain material provided to us in confidence by our clients. Reproduction ordisclosure in whole or in part to other parties shall be made upon the written and express consent of Dataquest.©1997 Dataquest—Reproduction ProhibitedOataQuestDataquest is a registered trademark of A.C. Nielsen CompanyA Gartner Group Company
PerspectiveSemiconductor Supply and Pricing WorldwideMarket AnalysisCompute Microprocessor Supplier and Product Update: IntelDominates Despite increased CompetitionAbstract: This article analyzes the events in the compute microprocessor market from auser's perspective, focusing on products, suppliers, and the near-term direction of thiscritical market. We examine major CISC and RISC architecture and supply bases in thisannual update based on 1996 shipment data.By Mark Giudici and Nathan BrookwoodIntroductionsLUN.. LUCL i ^ -•o
SemicondLictor Supply and Pricing Worldwidedata available. The second section examines the strategies of the topsuppliers of advanced MPU products,. The third section analyzes the currentand future supply base for core logic and technology. Combining individualuser company system data with this analysis provides good insight on thecurrent and future supply base.MOS Microprocessor Product Life CyclesThis section uses life cycle information as a guide to assist users in adjustingto the forces that continue to reshape the worldwide MPU marketplace.Life Cycles for MPU Products Again Stretch Because of CompetitionSlipFigure 1 highlights the major change in microprocessor family life cycles,with the rapid acceptance of the fifth-generation processors (Pentium, K5,and 586). Intel Corporation's introductions of its Pentium and Pentium Proproducts have slowed from the torrid pace of 1994 and 1995 to the intervalsof earlier product releases. This is because of an effective level of competitionwith Intel's earlier product introductions. This has resulted in an increase inlife cycle from the pre-1995 range of between 10 and 20 years to the currentrange of 12 to 22 years from initial research and development throughobsolescence (phaseout). The typical MPU life cycle that involves productionvolumes (growth through decline) now generally exceeds eight years.The lengthy R&D phase provides users a valuable opportunity to monitor asupplier's (or prospective supplier's) pace of technical achievement and legalstanding, where applicable, as well as the supplier's timetable for bringing anew, state-of-the-art device to market. The somewhat competitive fifthgenerationmarket continues to afford some price and availability relief asAdvanced Micro Devices Inc. and, to a lesser extent, Cyrix Corporationlegally compete with Intel in this area. The 486 market has declined rapidlyalmost to nonexistence, with the main supplier remaining—AMD. The 8-bitand 16-bit processor market remains solely with embedded applications. The32-bit and up market remains fragmented. While a niomber of competitorsvie for a piece of the Intel money pie. Motorola Incorporated has shifted itscomplete compute microprocessor focus to the PowerPC and has shifted itsaging 68020/030/040 products to the embedded core market. The quicklyaccepted Pentium/MMX and other 32-bit and up RISC products arecurrently on the high end of the price/performance spectrum and areexpected to come down the learning curve quickly over the next one to threeyears.Microprocessor Supplier AnalysisThis section analyzes the product and market strategies of the leadingsuppliers of advanced microprocessors. Because of the interest expressed bySemiconductor Supply and Pricing program clients, this section focuses onsuppliers that strongly serve the European and Americas markets.SSPS-WW-DP-9712 ©1997Dataquest September 22,1997
Semiconductor Supply and Pricing WorldwideFigure 1Microprocessor Product Life Cycle as of September 1997PhaseR&D Introduction Growth Maturity Saturation Decline PhaseoutUnitsTime976319Source: Dataquest (September 1997)Table 1 summarizes the 32-bit CISC computational microprocessor market interms of revenue over the past two years. For all intents and purposes, the32-bit CISC market and the x86 market now are one and the same, followingthe completion of the conversion of the Macintosh line from its earlier 68Kbase to the PowerPC. The market in 1996 grew 34 percent in revenue and 18percent in terms of units, as average selling prices (ASPs) increased. The ASPincrease is all the more impressive given the rapid rate at which Intellowered microprocessor prices to spur personal computer system demand ina year with little technological innovation.Intel, from a large base, and IBM, from a small base, grew faster in 1996 thanthe overall market, while other vendors grew more slowly and lost share.AMD saw both unit volumes and prices fall, driving revenue down 60percent from the prior year. Cyrix's unit volume dropped by 44 percent, butrevenue decreased at only half that rate, because the prices the companycould charge for its fast 6x86 vastly exceeded what it charged for me-too 486technology in the prior year. Cyrix initially set prices for its 6x86 at paritywith those charged by Intel for devices with similar performance but quicklyretreated from this position after its partner, IBM, adopted a more aggressivepricing strategy. Even then, Cyrix was unable to win any designs with major("tier 1") vendors and had to sell its products at lower prices to less wellknownvendors.Table 2 summarizes the 32/64-bit RISC computational microprocessormarket in terms of revenue and unit shipments over the past two years. Thismarket grew 32 percent as measured by dollars but only 12 percent in termsof unit shipments. Unlike the much larger and highly concentrated CISCSSPS-WW-DP-9712 ©1997 Dataquest September 22,1997
Semiconductor Supply and Pricing Worldwidemarket, the RISC market remains fragmented in terms of both architecturesand vendors. In 1996, PowerPC, PA-RISC, and Alpha all outgrew the marketin terms of lonits, while SPARC held its own. The Silicon Graphics Inc./MIPSarchitecture dramatically lost share in computational markets whiledramatically gaining share in the embedded arena, where it dominates.Comparisons in year-to-year revenue changes in this segment arecomplicated by the lack of data for Digital Equipment Corporation in 1995and Hewlett-Packard Company in both years. With the partial dataavailable, Dataquest concludes that SPARC and MIPS revenue increased,driven by dramatic ASP growth, while PowerPC revenue decreased, drivenby rapidly eroding ASPs, as Apple played off Motorola and IBM againsteach other.Table 132-Bit CISC Computational Microprocessor Vendors by Revenue (Millions of Dollars)1995Rank124368571996Rank12345678CompanyNA= Not availableSource: Dataquest (August 1997)IntelAdvanced Micro DevicesIBMCyrixTexas InstrumentsSGS-ThomsonMotorolaUnited MicroelectronicsTotal Market1995Revenue(SM)10,36574367205160451511,4561996Revenue($M)14,6753001741601880015,3351995-1996Growth (%)42-60160-2213NA-100-100341995MarketShare (%)9061200001001996MarketShare (%)962110000100Table 232/64-Bit RISC Computational Microprocessor Vendors by Revenue(Millions of Dollars)1995Rank17328569410996Rank12345678910CompanyNA = Net availableSource: Dataquest (August 1997]IBMDigitalMotorolaTexas InstrumentsSun MicrosystemsNECToshibaIntegrated Device TechnologyFujitsuHewlett-PackardTotal Market1995Revenue($M)52501761800393205101,0031996Revenue($M)43923520919517040323001,3231995-1996Growth (%)-16NA198NA30NA-100NA321995MarketShare (%)52018180430501001996MarketShare (%)331816151332000100SSPS-WW-DP-9712 ©1997 Dataquest September 22,1997
Semiconductor Supply and Pricing Worldwidecould manage the logistics and their expenses well. Dataquest expects that1997 will prove a more challenging year for Intel as it begins the massiveshift to Pentium II and faces revitalized competition from AMD and Cyrixlater in the year.AMDAMD watched as the 486 market evaporated before its K5 microprocessorcould take up the slack, and it lost market share, unit share, and real moneyas a consequence. The company provided an all-too-realistic display of theimpact an 18-month schedule slip can have in a world of 36-month productcycles. The company wisely placed its emphasis on integrating its NexGenacquisition and readying the K6 for market, a task that required closecooperation between its development and manufacturing organizations. Byyear's end, the company had achieved competitive low-end performancewith its K5 and could demonstrate K6 devices with impressive clock speeds.AMD needs to continue executing in this new, more precise manner if it is toavoid a repetition of the disastrous year it experienced in 1996.CyrixLike AMD, Cyrix had a bad year, as it sought first to stabilize and then tosell its 6x86 microprocessor. Cyrix flirted briefly with the notion of chargingIntel-style prices for Intel-style performance but discovered it had to giveprospective purchasers a strong incentive to stray from "Intel Inside."Following the laws of classic economics, voliime picked up as prices fell, andby year's end, Cyrix was selling almost as many chips as it (or, moreaccurately, IBM) could manufacture. The loss of momentum proved fatal toCEO Jerry Rogers' tenure and almost sank the company, as inventory builtwhile cash shrank. Newly arrived CFO and acting CEO Jay Swent managedto stanch the flow of red ink and get the company prepared to launch itslow-cost MediaGX processor and 6x86MX processor early in 1997. The recentannouncement that Compaq Computer Corporation will market low-costMediaGX-based systems may usher in a new and more profitable era for thecompany.IBMIBM, the only vendor to participate in both the 32-bit RISC and the 32-bitCISC arenas, had vastly different experiences in each segment. Its PowerPCcontinued to lead the RISC market in terms of revenue and units, but thecompany saw revenue decrease in response to declining ASPs. In the CISCsegment, where IBM manufactures most of the Cyrix-designed chips that aresold under the IBM and Cyrix brands, IBM's revenue grew rapidly on flatunit volumes; selling prices increased dramatically for the 6x86 over the 486-based products offered in the prior year. The IBM PC Company was one ofthe few major system vendors to include some non-Intel processors in itsproducts, although such products tended to be destined for offshore marketswhere Intel's branding programs present less of a sales issue for a systemvendor.MotorolaUntil 1996, Motorola derived computational microprocessor revenue fromboth its 68K CISC line and its PowerPC RISC offerings. In 1996, Motorola'sSSPS-WW-DP-9712 ©1997 Dataquest September 22,1997
Semiconductor Supply and Pricing Worldwide68K was sold only into embedded markets and had no presence whatsoeverin the computational segment. In its PowerPC business. Motorolamaintained a consistent ASP on a year-to-year basis and managed to growboth unit volumes and revenue by about 20 percent.SunWith its UltraSPARC offering, unveiled late in 1995, Sun Microsystems Inc.once again regained a measure of respectability with regard tomicroprocessor (and workstation) performance. UltraSPARC also enabledSun to collect a reasonable tariff for its products, which translated into a 58percent increase in SPARC revenue, to $365 million, on a 12 percent increasein unit volume to 804,000 units. Because of the previously mentionedproblem in matching SPARC computational revenue with the appropriatevendors in 1995 and 1996, Dataquest bases these comparisons on the totalRISC revenue and shipments for Sun, Fujitsu Ltd., and Texas Instruments.Other Computational Microprocessor Arcliitectures/SuppliersPowerPCThe recent announcement that Microsoft will no longer enhance thePowerPC version of its Windows NT operating system restricts thecomputational market for PowerPC to the Apple Macintosh and IBM AIXenvironments, neither of which is likely to experience dramatic growth overthe foreseeable future. Dataquest forecasts that the Macintosh market willgrow more slowly than the overall PC market, thus restricting opportunitiesfor PowerPC vendors. Dataquest anticipates that IBM and Motorola willboth dedicate increasing portions of their marketing activities towardembedded PowerPC opportunities and products.SPARCAlthough the unit growth of RISC-based workstations has slowed to a crawl,Dataquest anticipates that Sun still has ample growth opportunities in themidrange and high-end server market, where it has achieved credibility withthe IS departments of major corporations and which the WindowsNT/Pentium II juggernaut cannot easily serve.AlphaAlone among the RISC microprocessors that emerged in the late 1980s,Alpha attempts to address compatibility with the huge installed base of x86software applications. This feature, incorporated late in 1996 in Digital'sversion of Windows NT 4.0 and referred to as FX!32, has yet to make itspresence fully felt. Dataquest remains hopeful that with its clearperformance advantages, x86 compatibility story, and increasing priceaggressiveness. Alpha may yet find its niche in the market.MIPSThe MIPS architecture once presented a major threat to x86 desktopdomination, but that threat continues to fade with the passing of WindowsNT for this architecture. Although the MIPS design continues to excel inembedded applications (every Nintendo 64 includes two processors, andevery Sony PlayStation, one), it struggles in computational applications.SSPS-WW-DP-9712 ©1997 Dataquest September 22,1997
Semiconductor Supply and Pricing WorldwidePA-RISCAlthough Hewlett-Packard heis been visibly working with Intel on its nextgeneration"Merced" program, HP continues to enhance its PA-RISC productline and plans a smooth transition to the 64-bit Intel environment beginninglate in this decade. The recently announced PA-8500 incorporates anextremely large on-chip cache (the first ever for an HP processor) that shouldincrease performance and substantially decrease system cost.Review of the 1996 Personal Computer Core Logic li/iarlcetA popular rumor holds that following Intel's serious entry into the core logicmarket in 1993, all other participants abandoned that market. As seen inTable 4, Intel in 1996 increased its share of the core logic market measured indollars from 32 to 62 percent and measured in units from 22 to 52 percent.This still leaves lots of opportunities, especially when compared with the x86microprocessor market, where Intel captured more than 90 percent ofrevenue. During the same period, VIA Technologies Inc. and SiliconIntegrated Systems Corporation, both Taiwan-based, traded the No. 2 andNo. 3 positions, while a greatly weakened OPTi Inc. retained the fourthposition against a rapidly growing Acer Labs entry that ranked fifth overall.Intel entered the largely moribund core logic arena in order to drive its owntechnology initiatives, including the high-speed Peripheral ComponentInterconnect bus (PCI) and the newer Universal Serial Bus (USB). Along theway, it discovered that it could produce core logic chipsets using recentlydecommissioned, fully depreciated microprocessor production equipmentand thus gain an economic advantage. This equipment reuse strategy hasallowed it to increase the pace at which it delivers new microprocessortechnology, and it is this pace that in turn serves to stimulate market growth,a key Intel concern.The vendors that have survived Intel's onslaught have had to learn how todesign their products more quickly and how to achieve higher levels ofsystem performance. Although they generally price their products at adiscount from Intel's, the absolute cost savings (Intel's average chipset sellsfor less than $25) do not allow them to sell products that seriouslycompromise system-level performance.As silicon densities have increased, core logic vendors have moved toexpand product features as a means to preserve average selling prices, andDataquest expects this trend to continue. Two years ago, the core logicabsorbed the typical PC disk controller. Last year, keyboard controllers andreal-time clocks were popular integration candidates. This year, parallel andserial port controllers, along with USB and IEEE 1394 (Firewire) support, aremoving on-chip. Some vendors offer versions that integrate audiocapabilities, while others integrate graphics accelerators. Core logic vendorsserve as miniature vacuum cleaners, sucking up miscellaneous systemfunctions as Moore's law permits vendors to integrate more and morefunction on each chip.SSPS-WW-DP-9712 ©1997 Dataquest September 22,1997
10 Semiconductor Supply and Pricing WorldwideLike VIA, SIS hopes to service the Socket 7 infrastructure that Intel is leavingbehind in its migration to Pentium II.OPTiLike SIS, OPTi saw sales fall by over 30 percent. OPTi moved to strengthenits mobile offering, but its gains in mobile failed to offset substantial losses inthe desktop portion of its business. Like SIS, OPTi hopes to service theSocket 7 infrastructure that Intel is leaving behind in its migration toPentium II.Dataquest PerspectiveAt the start of 1996, Dataquest asked, "Can any vendor compete with Intel in1996?" By the end of the year, it became obvious that none could, at least in1996. Using the narrowest of market definitions, Intel laid claim to $0.96 outof every dollar spent on x86 microprocessors used in computationalapplications, leaving just $0.04 for other x86 vendors to fight over.Alterrrative x86 vendors struggled first to release their products and then tofind customers for them. AMD completed its K5 development, but laggedIntel's Pentium woefully with regard to operating frequency andperformance. It was forced to discount the already low prices it charged forits products and watched its average selling prices erode dramatically. Cyrixfinally squeezed its design onto a die it could manufacture at reasonablecost, only to encounter a variety of subtle thermal problems that restricted itsoperating frequencies. Both vendors watched as red ink gushed from theirbooks, and both hoped to stanch their losses with new products in 1997.The news from the RISC camp was no more encouraging. Microsoft pulledthe plug on future support of the PowerPC in Windows NT, leaving thePowerPC's ultimate fate in computational applications resting solely on thelong-term success of the Macintosh platform, a precarious position at best.Vendors of RISC-based workstations and servers began to feel the heat fromthe combination of Intel's Pentium Pro microprocessor and Microsoft'sWindows NT 4.0 release. NeTpower Inc. and NEC Corporation convertedtheir MlPS-based Windows NT products to Pentium Pro, leading Microsoftto discontinue support for that platform as well. By the end of the year, thearchitecturally neutral Windows NT environment supported only twoarchitectures—Intel and Alpha.Popular rumor holds that all other participants abandoned the core logicmarket that after Intel's serious entry into that market in 1993. According toDataquest, Intel in 1996 increased its share of the core logic market measuredin dollars from 32 to 62 percent and its share measured in units from 22 to 52percent. This still leaves lots of opportunities, especially when comparedwith the x86 microprocessor market, where Intel captured more than 90percent of revenue. During the same period, Taiwan-based VIATechnologies and Silicon Integrated Systems traded the No. 2 and No. 3positions, with a greatly weakened OP*Ti retaining the fourth position and arapidly growing Acer Labs ranked fifth overall.SSPS-WW-DP-9712 ©1997 Dataquest September 22,1997
Semiconductor Supply and Pricing Worldwide 11Add to all of this turmoil AMD's successful breach of the Intel technologywall in 1997, providing some competitive relief with its K6 products. Howlong this will last and whether capacity will be a constraint are the bigquestions this year. The computational MPU market continues toconsolidate, with the Wintel solution becoming ubiquitous.SSPS-WW-DP-9712 ©1997Dataquest September 22,1997
12 Semiconductor Supply and Pricing WorldwideI i S t S O I J C S t^'^^^^^^tr^"'*'A Gartner Group CompanyFor More Information...Mark Giudici, Director and Principal Analyst (408) 468-8258Internet addressmark.giudici@dataquest.comVia fax (408)954-1780Dataquest Interactivehttp://www.dataquest.comThe content of this report represents our interpretatian and analysis of informatjon generally available to thepublic or released by responsible individuals in the subject comparvies, but is not guaranteed as to accuracy orcompleteness. It does not contain material provided to us in confidence by our clients. Reproducbon or'^•^'"^'^ *" whole or in part to other parties shall be made upon the written and express consent of Etetaquest.©1997 DataquKrt—Reproduction ProhibitedOatacjuest is a registered trademark of A.C, Nielsen Company
•<strong>DataQuest</strong>A Gartner Group Company 251 River Oaks Parkway, San Jose, CA 95134-1913(408) 468-8000 Fax (408) 954-1780September 11,1997Dear Client:The enclosed copy of 'The Nonvolatile Memory Picture Becomes Clearer as UsersChoose Long-Term Solutions," product code SSPS-WW-DP-9711, replaces the copypreviously mailed to you. Because of a PostScript printing problem, the titles for Figure 1and Figure 2 on the version previously mailed to you did not appear on the same pages asthe figures themselves. This problem has been corrected. Please discard the copy youpreviously received and replace it with the enclosed one. We apologize for anyinconvenience this may have caused.Sincerely,Gordon Riley (Production Manager%
PerspectiveSemiconductor Supply and Pricing WorldwideMarket AnalysisThe Nonvolatile Memory Picture Becomes Clearer as UsersChoose Long-Term SolutionsAbstract: The nonvolatile memory market (ROM, EPROM, EEPROM, and flash) continuesto grow, but some family members are starting to dominate. This Perspective focuses on thelife cycles and technology trends within the nonvolatile market and analyzes 1996 marketshare data by geographical region and device family.By Evelyn CroninNonvolatile DevicesThe nonvolatile market comprises four distinct devices: flash memory,EPROM, EEPROM, and mask ROM. Following are the Dataquest defirutionsfor these devices, along with some typical applications:>nkjijj—1LU•n!SJf*^!!.[11.J>^4^cc
Life Cycle CurvesSemiconductor Supply and Pricing Worldwiderefreshes. EPROMs are used to store code in applications both inembedded systems and in computers as the bootstrap or basicinput/output subsystem (BIOS) in PCs.EEPROM: Electronically erasable programmable read-only memory.Included are serial EEPROM (S-EEPROM), parallel EEPROM (P-EEPROM) and electronically alterable read-only memory (EAROM).EEPROMs have memory cells consisting of a minimum of two transistorsand do not require memory cell refreshes. This product classification alsoincludes nonvolatile RAM (NV-RAM), also known as shadow RAM.These latter semiconductor products are a combination of static RAM(SRAM) and EEPROM technologies in each memory cell. The EEPROMfunctions as a shadow backup for the SRAM when power is lost.EEPROMs are usually used in specialized applications where theminimal storage capability is acceptable and byte erase is required. Onesuch application is code storage in printers.Mask ROM: Mask-programmable read-only memory. Mask ROM is aform of memory that is programmed by the manufacturer to a user'sspecification using a mask step. Mask ROM is programmed in hardwarerather than software. Mask ROMs are heavily used in the game industryand to hold font software in printers. Also, Apple Computer Inc. usesmask ROMs to hold BIOS software.Examining the life cycle curves for flash, EPROM, EEPROM, and mask ROMgives a useful perspective These life cycle curves are based on unitshipments per technology density.Figure 1 shows the life cycle curves for flash and EPROM at variousdensities. What is immediately obvious is that EPROMs are stronger in thelower-density parts, while flash will dominate densities above 8Mb. Also, atthe same densities, flash and EPROM are usually in different stages, exceptat the 256Kb and 512Kb densities. Both flash and EPROM are in the declinestage at these densities, although EPROM is further along in that stage thanis flash.For flash, 1Mb is solidly in the maturity stage, while the 2Mb has alreadyreached the saturation stage. The 4Mb and 8Mb flash are both still in thegrowth stage, with the 4Mb further into this stage. The 16Mb flash sits in theintroduction stage. Flash at higher densities (32Mb, 64Mb, and 128Mb) is inthe R&D stage.With EPROM, the story is rather different. The 64Kb and 128Kb are both inthe phaseout stage of their life cycle curve based on tmit shipments. EPROMfrom 256Kb to 2Mb are sitting in the decline stage. Thus, the majority ofEPROM sits in the final stages of its life cycle curve. The 4Mb EPROM is inits grow^th stage, with the 8Mb in the introduction stage of its life cycle.EPROM at 16Mb is still at the R&D stage.SSPS-WW-DP-9711 ©1997 Dataquest September 1,1997
Semiconductor Supply and Pricing WorldwideFigure 1Flash and EPROM Life Cycle Stages/DensityR&D3-4 YearsIntroduction2 YearsGrowtli2 YearsIVIaturity2 YearsSaturation2 YearsDecline3 YearsPhaseout1 -3 Yearsi 1>
Semiconductor Supply and Pricing WorldwideFigure 2ROM and EEPROM Life Cycle Stages/Density21MbROMTime976621Source: Dataquest (August 1997)Exchange RatesDataquest uses an average annual exchange rate in converting revenue toU.S. dollar amounts. The rates used for 1995 and 1996 are outlined inTable 1.Table 1Exchange RatesJapan (Yen/U.S.$)France (French Franc/U.S.$)Germany (Deutsche Mark/U.S.$)United Kingdom (U.S.$/Pound Sterling)Source: Dataquest (August 1997)199493.904.971.431.591995108.815.121.501.56SSPS-WW-DP-9711 ©1997 Dataquest September1,1997
Semiconductor Supply and Pricing WorldwideThe Nonvolatile MarketThe nonvolatile market was worth over $6.45 billion in 1996, based onrevenue shipments, a growth of some 3.5 percent from 1995. Table 2 showsthe 1996 revenue for each nonvolatile device. This indicates the widevariation in the growth and contraction rates of each device family.Table 2Worldwide Nonvolatile Revenue by Device Family(Millions of Dollars)Nonvolatile Device Family 1995Flash1,942EPROM1,437EEPROM793Mask ROM2,067Total6,239Source: Dataquest (August 1997)19962,8661,2491,0501,2906,4551996 Growth (%)47.6-13.132.4-37.63.5Flash continues its stellar growth. Its revenue grew by nearly 48 percentfrom 1995 to 1996. Although this is considerably less than the almost 120percent revenue growth from 1994 to 1995, 48 percent is no mean feat,considering the state of the semiconductor market in 1996. Most important,though, is that flash is now No. 1 in revenue of the nonvolatile devices.The three other nonvolatile families, however, had varying fates in 1996.EEPROM grew by over 32 percent in revenue terms, but EPROM and maskROM were not so fortunate—^both posted contraction in 1996, coming in atabout negative 13.1 percent and negative 37.6 percent, respectively. MaskROM is no longer the highest revenue earner; flash took over in 1996.Market ShareTable 3 shows the 1996 nonvolatile market share by supplier, based onfactory revenue. There has been considerable change in the 1996 overallrankings, compared to 1995, but the No. 1 spot remains unchanged. For thesecond straight year, a nonvolatile supplier that offers only one of theseproducts was the overall nonvolatile revenue standings leader. IntelCorporation, by being the No. 1 flash supplier, took the overall nonvolatilemarket share leadership position.Atmel Corporation rose up the ranks to the No. 2 position, trading placeswith Sharp Electronics Corporation. Despite Atmel's fall to No. 4 for flashmarket share, it rose to No. 2 for EPROM and maintained its No. 2 positionin EEPROM.Advanced Micro Devices Inc. came in at third position in the overallrankings, based on revenue. It was the second-largest flash revenue supplierand the third-largest EPROM supplier in 1996. In fourth position for thesecond year was SGS-Thomson Microelectronics B.V. It is still the worldwideSSPS-WW-DP-9711 ©1997 Dataquest September 1,1997
Semiconductor Supply and Pricing WorldwideNo. 1 EPROM and EEPROM supplier, and it also grew its flash revenue in1996, despite its fall to sixth in overall revenue.Sharp plummeted from No. 2 position in 1995 to No. 5 in 1996, despite beingthe No. 1 mask ROM supplier and rising to fifth position in flash. In sixthposition was Fujitsu Ltd., which rose two places in the 12-month period andis now the No. 3 flash supplier worldwide.Table 3Top 10 Nonvolatile Suppliers by Revenue and Product Offering, 1996(Millions of Dollars)1995Rank1996RankCompany Name1996RevenueFlashRankEPROMRankEEPROMRankMaskROM Rank11Intel950152Atmel79342233AMD7082344SGS-Thomson68961125Sharp5265186Fujitsu4033107Macronix2885478NEC287109399Texas Instruments2439461110Samsung2242All Others1,344TotalSource: Dataquest (August 1997)6,455Macronix International Company Ltd. continued its rise up the market shareranks. It ranked No. 7 for 1996, a leap up from 10th position in 1995. NECCorporation, however, dropped a place from 1995 to 1996 and is now rankedeighth.The last two suppliers are Texas Instruments Inc., coming in at ninthposition, and Samsung Electronics Company Ltd., coming in at 10th. TIremains in that position for the second straight year, but Samsung rose aplace to enter the top 10. This mighty Korean company is now beginning tomake its presence felt.In revenue, the top five nonvolatile suppliers all posted earnings greaterthan $500 million. The suppliers in sixth to 10th position all had earningsbetween $250 million and just over $400 million.Of the top five vendors, there are three clear groupings. In a league of itsown is Intel, with revenue of $950 million for 1996. The question is by howmuch it will break the billion-dollar mark next year. Atmel, AMD, and SGS-Thomson all had respectable revenue, earning between $689 million and$793 million, but they still fall in the revenue shadow of Intel. Lagging thetop five is Sharp, whose revenue fell from 1995 to 1996 and which now earnsonly $526 million from the nonvolatile arena.SSPS-WW-DP-9711 ©1997 Dataquest September 1,1997
Semiconductor Supply and Pricing WorldwideMarket Share by Device FamilyFlasliFlash grew revenue by almost 48 percent in 1996, and it is now the highestrevenue generator within the nonvolatile family. Table 4 shows the top fiveflash suppliers by revenue for 1996.Table 4Market Share by Revenue for Flash, 1996 (Millions of Dollars)1995Rank124371996Rank12345Source: Dataquest (August 1997)Company NameIntelAMDFujitsuAtmelSharpAll OthersTotal1996 Revenue9505423693301495262,866All achieved high revenue growth, with Sharp's climb to fifth position in1996 translating into an amazing 231.1 percent revenue growth. In anothergreat year for Fujitsu, the company grew revenue by over 107 percent andjumped into third position overall, based on flash revenue. The NOR flashremains dominated by technology alliances, Intel-Sharp versus AMD-Fujitsu. Both alliances combined account for over 70 percent of the totalworldwide flash market.EPROMFor the EPROM market, 1996 was another year of declining growth. Thetotal worldwide market shrank by over 13 percent from 1995 to 1996. Table 5shows the 1996 market share ranking by revenue for EPROMs.Table 5Market Share by Revenue for EPROM, 1996 (Millions of Dollars)1995Rank143271996Rank12345Source: Dataquest (August 1997)Company NameSGS-ThomsonAtmelAMDTexas InstrumentsMacronixAll OthersTotal1996 Revenue337227166115843201,249SSPS-WW-DP-9711 ©1997 Dataquest September 1,1997
Semiconductor Supply and Pricing WorldwideAlthough Atmel and Macronix both posted growth, the fate of the other topfive players was different. Atmel grew by over 53 percent from 1995 to 1996and Macronix by nearly 17 percent in the same period. SGS-Thomson'srevenue remained largely flat from 1995 to 1996, while both AMD and TIexperienced declines in their EPROM revenue (down 5.1 percent and45.5 percent, respectively).EEPROMThe EEPROM market grew by a healthy 32.4 percent in 1996. Table 6 showsthe top five EEPROM suppliers by revenue for 1996. There is no rankingchange from 1995 among this group. All had revenue growth in 1996, butSGS-Thomson and Atmel were the only two to hurtle past $200 million,growing by over 50 percent each (51.5 percent and 55.3 percent,respectively).Table 6Market Share by Revenue for EEPROM, 1996 (Millions of Dollars)1995Rank123451996Rank12345Company NameSGS-ThomsonAtmelXicorMicrochip TechnologyNational SemiconductorAll OthersTotalSource: Dataquest (August 1997)1996 Revenue256236109104742711,050The other three top five suppliers had individual growth rates less than theoverall EEPROM average. Xicor Inc. grew by less than 8 percent. MicrochipTechnology Inc. by about 27 percent, and National SemiconductorCorporation by less than 20 percent. National Semiconductor was the onlyone of these three suppliers with revenue less than $100 million.Mask ROMTable 7 shows the top five mask ROM suppliers by revenue for 1996. MaskROM revenue is shrinking seriously. Revenue was down 37.6 percent from1995 to 1996. In 1996, flash has knocked it out of tiie No. 1 nonvolatilerevenue spot for the first time.All top five suppliers except Macronix saw their revenue tumble. Macronixmanaged 10 percent revenue growth in this shrinking market. However,Sharp (negative 44.7 percent), Samsung (negative 16.5 percent), NEC(negative 25.5 percent), and Toshiba Corporation (negative 64.3 percent)were not so lucky.SSPS-WW-DP-9711 ©1997 Dataquest September 1,1997
Semiconductor Supply and Pricing WorldwideTable 7Market Share by Revenue for Mask ROM, 1996 (Millions of Dollars)1995Rank123451996Rank12345Company NameSharpSamsungNECMacronixToshibaAll OthersTotalSource: Dataquest (August 1997)1996 Revenue374193184165992751,290Regional Nonvolatile Split by Device TypeJapanese Suppliers (Japanese Companies)The Japanese companies had a tough year in 1996. They were the onlyregional block of suppliers to experience a revenue decline from 1995 to1996, falling from $2.2 billion to $1.8 billion. This is a drop of nearly 20percent in the 12-month period. Figure 3 shows the 1996 revenue bynonvolatile device families for Japanese companies. It can be seen that themisfortunes of the Japanese region companies are tied in to their dependenceon mask ROM. This still represents 45 percent of the region's total revenue in1996 despite m.ask ROM's general decline worldwide. The good news is thatthis region is increasing its flash revenue quite dramatically. Flash accountedfor about 40 percent of total revenue in 1996, a revenue leap of over 127percent from 1995 to 1996. EPROM and EEPROM are both declining inrevenue in Japan and now make up 10 percent and 5 percent, respectively, oftotal nonvolatile market share for 1996.Japanese Buyers (Japanese Region Consumption)Figure 4 shows the nonvolatile revenue by device fairuly for Japan in 1996.This is based on factory revenue from shipments to Japan, expressed in U.S.dollars. Although the Japanese suppliers had the second-highest nonvolatilerevenue (behind the Americas suppliers) for 1996, Japanese buyers were thelargest nonvolatile consumers (ahead of the Americas) for the same period.That said, this region experienced a revenue decline of $72 million from 1995to 1996, coming in at $2.04 billion for 1996. The good news was that flashconsumption increases were amazing. This region has gone from being thethird-largest flash consumer in 1995 to being the second-largest in 1996,switching places with Europe in the process. Flash revenue increased117.7 percent from 1995 to 1996. It now makes up 38 percent of the region'snonvolatile consumption. EEPROM also had a good growth year andaccovmted for 8 percent of the market. Now to the bad news. EPROM andmask ROM both had a bad year in 1996. Mask ROM revenue tumbled by36.7 percent, and EPROM dropped by 20.7 percent.SSPS-WW-DP-9711 ©1997 Dataquest. September 1,1997
10 Semiconductor Supply and Pricing WorldwideFigure 3Japanese Suppliers' Nonvolatile Market Share, by Device Family,1996EEPROM (4.7%)Total = S1.8 BillionS7K25Source: Dataquesl (August 1997)Figure 4Japanese Buyers' Nonvolatile Market Share (Consumption), byDevice Family, 1996EEPROM (8.2%)Total = $2 BillionfffeMt-Source: Dataquest (August 1997)SSPS-WW-DP-9711 ©1997 Dataquest September 1,1997
Semiconductor Supply and Pricing Worldwide 11AmericasAmericas SuppliersThe year 1996 was another very good one for the suppliers in the Americasregion, which represented 51 percent of the worldwide nonvolatile market in1996 and experienced an 18.6 percent revenue increase from 1995 to 1996.Figure 5 shows the nonvolatile revenue by device family for 1996 forAmericas suppliers. Flash accounted for 60 percent of the total Americasnonvolatile revenue at just shy of $2 billion (up 29.8 percent from 1995).EEPROM revenue rose by 40 percent and now makes up one-fifth of theregion's total nonvolatile market. EPROM revenue, on the other hand,decHned by 16 percent, coming in at $649 million for 1996 and accounting for20 percent of the total nonvolatile market for the region.Figure 5American Suppliers' Nonvolatile Market Share, by Device Family,1996/ EEPROM/ (19.6%)-I EPROM 7 Flash 1\ (19.8%) / (60,6%) JTotal = $3.3 BillionEf75527Source: Dataquest (August 1997)Americas BuyersFigure 6 shows the nonvolatile revenue by device family for the Americasregion in 1996. This is based on factory revenue from shipments to theAmericas region, expressed in U.S. dollars. The American suppliers had thehighest nonvolatile revenue for 1996, but American buyers were only thesecond-largest nonvolatile consumers (behind the Japanese) for the sameperiod. Revenue dropped from $1.95 billion in 1995 to $1.82 billion in 1996.This is reflected in the declining consimiption of EPROM, EEPROM, andmask ROM in the region. All three took a dollar decrease from 1995 to 1996and now account for 22 percent, 15 percent, and 11 percent of the region'snonvolatile revenue. Flash, by contrast, had a brilliant year. The Americasregion is the largest flash consumer in the world. Flash makes up 52 percentSSPS-WW-DP-9711 ©1997 Dataquest September 1,1997
12 Semiconductor Supply and Pricing Worldwideof the region's nonvolatile revenue and came in at $950 million for 1996, justbelow the billion-dollar mark.Figure 6American Buyers' Nonvolatile Market Share (Consumption), byDevice Family, 1996Total = $1.8 Billion075szaSource: Dataquest (August 1997)Europe, Africa, and Middle EastEuropean SuppliersThe European group of nonvolatile suppliers had a good year in 1996. Theyincreased their revenue by 18 percent form 1995 to 1996, coming in at $755million. Figure 7 shows the 1996 nonvolatile revenue by family type forEuropean companies. EPROM and EEPROM were the largest in dollarterms, making up 45 percent and 43 percent of total revenue, respectively.For EPROM, revenue was largely flat from 1995 to 1996. However, EEPROMgrew by $100 million (45 percent) in the same period. Flash was up in dollarterms as well, coming in at $96 million for the year, an increase of 17 percentover 1995.European BuyersFigiire 8 shows nonvolatile revenue by device family for the Europeanregion in 1996. This is based on factory revenue from shipments to theEuropean region, expressed in U.S. dollars. With telecommunications sostrong in Europe, it should be of little surprise that flash was ranked No. 1 inEurope, representing about 45 percent of total nonvolatile Europeanrevenue. Flash revenue increased by 32.7 percent and came in at $641million. By contrast, EPROM and mask ROM revenue was down from 1995,by 15.3 percent and 33.3 percent, respectively. EPROM accounts for 20percent and mask ROM for 5 percent of the region's total nonvolatileSSPS-WW-DP-9711 ©1997 Dataquest September 1,1997
Semiconductor Supply and Pricing Worldwide 13consumption for 1996. EEPROM, like flash, had a good year, posting a57.3 percent revenue increase for the year, and now makes up 30 percent ofEurope's nonvolatile consumption in dollar terms.Figure 7European Suppliers' Nonvolatile Market Share, by Device Family,1996Total = $755 MillionsresMSource: Dataquest (August 1997)Figure 8European Buyers' Nonvolatile Market Share (Consumption), byDevice Family, 1996Mask ROM (4.2%)Total = $1.4 BillionB75S30Source: Dataquest (August 1997)SSPS-WW-DP-9711 ©1997 Dataquest September 1,1997
14 Semiconductor Supply and Pricing WorldwideAsia/PacificAsia/Pacific SuppliersAsia/Pacific suppliers had an increase in revenue of just 3.4 percent from1995 to 1996, coming in at $634 million and making the region the smallest indollar terms. The 1996 nonvolatile revenue of Asia/Pacific suppliers isshown in Figure 9. Mask ROM accounts for the bulk of this revenue (overthree-quarters in 1996), and this is a declining market. Mask ROM revenuewas $480 million for this regional group of suppliers in 1996, down some8.4 percent from 1995 in dollar terms. EPROM and flash both had positiverevenue increases from 1995 to 1996, the former 16.7 percent (to $82 million)and the latter a staggering 400 percent (to $70 million).Figure 9Asia/Pacific Suppliers' Nonvolatile Market Share, by Device Family,1996Flash^V(11.0%) / \/ EPROM \/ (13.2%) \V Mask ROM\ (75.8%) #Total = $634 MillionB75S31Source: Dataquest (August 1997)Asia/Pacific BuyersFigure 10 shows the nonvolatile revenue by device family for theAsia/Pacific region in 1996. This is based on factory revenue from shipmentsto the Asia/Pacific region, expressed in U.S. dollars. This was both thesmallest supplier region and the smallest buying region in 1996. Like theJapanese buyers, the Asia/Pacific buyers reported growth for flash andEEPROM and contraction for EPROM and mask ROM for 1996. Flash andEEPROM revenue virtually doubled from 1995 to 1996 and now account for42 percent ($489 million) and 14 percent ($170 million) of the totalnonvolatile market for 1996. EPROM and mask ROM were both down from1995 to 1996, by 6 percent and 31 percent, respectively, and now account for20 percent and 24 percent of the total nonvolatile market.SSPS-WW-DP-9711 ©1997 Dataquest September 1,1997
Semiconductor Supply and Pricing Worldwide 15Figure 10Asia/Pacific Buyers' Nonvolatile Market Share (Consumption), byDevice Family, 1996/ Mask ROM/ (24.4%)Rash \(41.6%) 1\ EEPROM /\ (14.4%) / \ K\ / EPROM \ ^^ ^ (19.6%) \ ^ MTotal = $12 Billionil^l^Source: Dataquest (August 1997)Technology TrendsFlashThe technology trends in flash are:• Domination by strong alliances—Intel and Sharp versus AMD andFujitsu• NOR technology revenue still strongest, but NOR suppliers investigatingNAND technology and vice versa• Trend toward higher densities and lower voltages• Current main flash markets are PC BIOS, digital cellular phones,internetworking, rigid disk drives, and automotive• Future applications include set-top boxes, Web TV, Net PC, digitalcordless phones, digital photo and audio, and personal digital assistants• Forecast good price reductions to continue, especially on higher-densitydevicesEPROMTrends in EPROM are:• Mature market; revenue leveling off• Fewer and fewer suppliers making the high-density partsSSPS-WW-DP-9711 ©1997 Dataquest September 1,1997
_16 Semiconductor Supply and Pricing WorldwideDataquest Perspective• EPROM average selling prices will slowly rise over time, but EPROMsuppliers currently remain price competitive relative to flash at small tomedium densities.EEPROMTechnology trends in EEPROM are:• The most niche-like area of nonvolatile but will have very good growthpatterns in the future• Explosion of consumer electronics devices and increasing PC use helpedfuel growth• In Europe, smart/memory cards growing• Will be second only to flash in revenue by 2001Mask ROMMask ROM technology trends are:• Migration from cartridges to CD-ROMs hurting segment• Lower DRAM prices in 1996 made mask ROM worse• Forecast compound annual growth rate from 1997 to 2001 of 14 percentIn the flash market, 1996 was enormously significant—it was the first yearthat flash overtook mask ROM to become the largest revenue family of thenonvolatile group. Dataquest forecasts that growth will remain healthy asmore and more applications move from EPROM and mask ROM to flash.This growth will continue to the year 2000. From a procurement point ofview, supply has really opened up. The NOR flash market remainsdominated by alliances, w^ith Intel/Sharp and AMD/Fujitsu controlling 70percent of the total flash market, based on revenue. The two camps offerdifferent products (Smart Voltage from Intel/Sharp and True Low Voltagefrom AMD/Fujitsu), and both have ramped up production and continue tomigrate to lower voltages. Good price reductions are to be expected on midtohigh-density devices. Also, some suppliers offer price parity for allvoltages at equivalent densities.EPROM, on the other hand, has a less rosy future. The market is in gradualdecline as users move to flash for volume applications. Dataquest forecastscontinued growth at densities of 4Mb and above. Many EPROM suppliersremain committed to this family, and for many applications, it remains themost cost-effective solution. As with EPROM, mask ROM is in decline bothin units and revenue. Aside from video game applications, there are no newvolume-consuming applications. Most densities are nearing the final stagesof their life cycle curve, and only densities at 32Mb and above are enjoyinggrowth. Dataquest expects the market to continue the overall trenddownward to the end of the decade. EEPROM continues to experience goodgrowth in 1996, a trend Dataquest expects to continue. New applicationssuch as handsets, pagers, smart cards, and other microcontroller-basedSSPS-WW-DP-9711 ©1997 Dataquest September 1,1997
Semiconductor Supply and Pricing WorldwideV7_applications continue to fuel volume demand. Dataquest also sees that thedensity, while still in kilobits, is slowly starting to increase.To summarize, many nonvolatile devices are in decline, so care should betaken on existing and future designs to ensure adequate supply. Buyersshould consult the Dataquest life cycle curves and their individual suppliers'product road maps to ensure supply. In general, flash continues to be thenonvolatile device family that offers the greatest leeway for negotiating priceand availability. However, on lower-density devices, care should be takenbecause supply is more limited in these end-of-life devices. The outlook forEEPROM remains positive, with more and more niche applicationsdeveloping.SSPS-WW-DP-9711 ©1997 Dataquest September 1,1997
18 Semiconductor Supply and Pricing WorldwideFor More Information...Evelyn Cronin, Senior Industry Analyst (408) 468-8075Internet addressevelyn.cronin ©dataquest.comVia fax (408)954-1780Dataquest Interactivehttp://www.dataquest.comTbo content of this report repre^^jents our Interpretation and analysis of information generally availabie to thepublic or released by responsible individuals in the subject companies, but is not guaranteed as to accuracy orcompletenes.'i. It docs not contain material provided to us in confidence by our clients. Reproduction or disclosureTjOTO/^l If^Ct '" whole OT in part to other parties shall be made upon the written and express consent of Dataquest.^"^^^^ ^^i~ ©1997 Dataqucsl—Reproduction ProhibitedA Gartner Group Company Oataquest is a registered trademark of A.C. Nielsen Company
PerspectiveSemiconductor Supply and Pricing WorldwideMarket AnalysisSRAM Demand in Fourth Gear While Supply Stays in Overdrive:SRAM Market UpdateAbstract: The SRAM market remains linked to the PC industry and has remained inoversupply since late 1995. Even those who do not use cache SRAM have been affected by theabundance of parts as suppliers shift production to more profitable noncache devices, thusimproving overall availability. Although not as visible as the DRAM market, the SRAMmarket continues to mirror its volatile cousin in price, with some cache devices going downto or below cost because of oversupply. This update focuses on the life cycles and future ofthese important memory devices and on how the supply base is changing to meet marketdemand.By Mark GiudiciOversupply Remains despite Solid End-Use DemandThe continued need for cache memory in high-performance PCs continues tomold the direction of the overall static RAM (SRAM) market. The cacheRAM requirements of the Pentium class of processors, the PowerPC, andother high-end microprocessors remain strong, and suppliers have beenmore than eager to meet this demand. Intel Corporation's chipsetrequirements have and will continue to heavily influence this market place.By announcing that it will have no more than five cache SRAM suppliers forits Pentium II class of chips, Intel will force all the other suppliers into thenon-Intel market, potentially causing another glut in late 1997 to 1998.The market remained in oversupply for fast cache devices (under 15ns)throughout 1996. The 32Kx32 part quickly became the coinmodity du jour,and pricing under cost was always a possibility. The follow-on 64Kx32 cachedevice appears to be filling in as a potential down-in-the-dirt-priced part asthe next generation of cache products becomes more available. All of thisDataquestProgram: Semiconductor Supply and Pricing WorldwideProduct Code: SSPS-WW-DP-9710Publication Date: July 28,1997Filing: Perspective(For Cross-Technology, file in the Semiconductor Devices and User Issues binder)
Semiconductor Supply and Pricing Worldwidecompetition has caused many SRAM suppliers to re-evaluate their productmix. The cache SRAM suppliers not chosen by Intel will definitely bereviewing long-term supply strategies in the latter half of 1997.The 1996 cache SRAM market, defined as 256K, 1Mb, 4Mb, and 16Mbdevices from imder 4ns to 15ns is valued at $1.7 billion and is forecast tomore than double to $3.8 billion in 1998. As mentioned previously, thismarket continues to be fueled by the increasing need for the high-speed,wide-word memory used by the 64-bit MPUs. Although the cache SRAMsituation gets the most attention, the total SRAM market includes manyother devices at different configurations and access speeds. This documentcovers the entire SRAM market, highlighting the technology trends, life cycleproduct curve, and leading suppliers. This document also provides a unitforecast and a SRAM user perspective.Density and Speed TrendsThe SRAM market is made of many micromarkets delineated by totaldensity, configuration, and speed. Specific applications, such as PCs, cellularphones, or consumer products, among others, drive demand for veryspecific devices. For example, the 256K SRAM continues to be most popularat speeds above 70ns and between 10 and 19ns, with minimal demand atspeeds below 9ns or between 20 and 70ns.The 1996 total SRAM market, valued at $4.8 billion, shrank a dramatic 27percent from 1995's high of $6.2 billion. However in comparison with 1994's$4.5 billion SRAM market, 1996 is relatively flat. The effects of oversupplyshow up directly when comparing annual SRAM average selling prices(ASP, equal to all revenue divided by all units). In 1994, the ASP was $5.11billion, moving slowly up to $5.13 biUion in 1995 because of continued strongdemand and early 1995 supply allocations. The ASP in 1996 was $4.58billion, a sharp 10.7 percent decline from two years of static pricing.Figure 1 shows the trend in demand for the five main speed categories ofSRAM. From 1994 to 1997, the two segments making up the faster-than-20nsdevices (that is, cache applications) grew from 6 percent of the market in1994 to a forecast 28 percent in 1997. Over the same period, the slow SRAMmarket will stabilize from 53 percent in 1994 to 52 percent forecast in 1997because of the migration of these parts to other, non-PC related applications.Figure 2 shows how the density of SRAM supply will change over time. In1996, 69 percent of all SRAMs were at the 256K or smaller density. Dataquestestimates that, by the end of this year, more than half (52 percent) of themarket will be over 1Mb in density. System designers and supply basemanagers need to keep this in mind when planning SRAM requirements, aslower-density SRAM will continue to be harder to source.SSPS-WW-DP-9710 ©1997 Dataquest July 28,1997
Semiconductor Supply and Pricing WorldwideFigure 1Worldwide SRAM Megabyte Shipments by SpeedPercentage of Worldwide Market• ^M ? ^'^m#1It^iiiE laDDs[aPSRAM71ns+45-70ns20-44ns10-19ns0-9nsmnfcrrrni—[rrniinrrr1994 1995 1996 1997 1998 1999 2000 2001mrSource: Dataquest (July 1997)Figure 2Worldwide SRAM Unit Shipments by DensityPercentage of Worldwide lUlarket90 H80706050100-40-30-20-100BSnmmmmAll 16MbAll 4MbAll 2MbAll 1MbAII512KAll 256KAll 64KAII16K1993 1994 1995 1996 1997 1998 1999 2000 2001Source: Dataquest (July 1997)BTSTiaSSPS-WW-DP-9710 ©1997 Dataquest July 28,1997
SRAM Product Life CyclesFigure 3SRAM Life Cycle Stages by DensitySemiconductor Supply and Pricing WorldwideA pragmatic way to look at sourcing the components of a system is to placespecific devices (in this case, SRAMs) on the IC life cycle ciirve. An ICgenerally has a five-stage life cycle: R&D, introduction/growth,maturity/saturation, decline, and phaseout. The Ufe cycle curve shown inFigure 3 is based on actual 1996 SRAM shipment volume. Because of thevaried applications that use SRAM, the overall SRAM life cycle is abouttwice that of DRAM. It is important to note that SRAM used in PCs(primarily pipelined burst x32 product) will have a much shorter-thanaverageSRAM life cycle because of the accelerated life cycle of the endsystemapplication.Introduction Growth Maturity Saturaton Decline PiiaseoutTime975143PSRAM = Pseudo-SRAMSource: Dataquest (July 1997)Knowledge of where a particular device is in its life cycle is critical whendeciding to design in or design out a device. Synchroruzing system life cycleswith semiconductor life cycles requires good coordination among systemdesign engineering, component engineering, cind procurement, ideally witheach having equal weight in design/procurement decisions. The tails of theSSPS-WW-DP-9710 ©1997 Dataquest July 28,1997
Semiconductor Supply and Pricing Worldwidelife cycle curve generally equal limited supplies and high prices, while thedevices in the middle of the curve are available in high volume and at lowerprices.Product/Supplier MatrixThe expanding combination of speed, density, and configurations of SRAMmakes it very difficult to keep track of the worldwide SRAM supply base toensure that all supply sources are explored. Compounding this situation isthe tendency of many SRAM suppliers to focus on selected segments of themarket. In an effort to reduce this confusion. Tables 1 through 7 show whichSRAM derwities and speeds companies actually shipped in 1996. An "x"indicates that a supplier shipped parts at the specified density and speed,and a dash means that no parts were shipped.Supply Base ProfilesTable 116K Devices ShippedThe positions of 1995's top three SRAM suppliers remained unchanged in1996, as shown in Table 8. As it did in DRAMs, Samsung ElectronicsCompany Ltd. maintained its No. 1 position and grew revenue in a marketin which most suppliers' revenue declined. Hitachi Ltd., which had been theSRAM market leader every year since Dataquest began studying the marketuntil it was displaced by Samsung in 1995, maintained its No. 2 ranking bymore than three percentage points of market share above next-rankedMotorola Incorporated. The top three suppliers all had or have broadproduct offerings that balanced the fretful 1996 cache pricing. BelowMotorola there was considerable turbulence (with those more dependent onthe 32Kx32 the more turbulent), yet all of the top 10 manufacturers from1995 made the top 10 list for 1996.CypressFujitsuHitachiIntegrated Device TechnologyLG SemiconMatraRohmSanyoSeiko EpsonSharpUMCWtnbondSource: Dataquest (July 1997)0-9ns 10-19ns 20-44ns 45-70ns 71+ns PSRAMXX..X'>^niiXXXXXXXXXXSSPS-WW-DP-9710 ©1997 Dataquest July 28,1997
B'Semiconductor Supply and Pricing WorldwideTable 264K Devices ShippedAllianceCypressFujitsuG-LinkHitachiHyundaiIntegrated Device TechnologyISSILG SemiconMatraMatsushitaMitsubishiMosel VitelicMotorolaNECOkiRohmSamsungSanyoSeiko EpsonSharpSonyTexas InstrumentsToshibaUMCWinbondSource: Dataquest (July 1997)0-9ns 10-19ns 20-44ns 45-70ns 71+ns PSRAMXXXXXXXXXXXXXXXXXXXXXXXXXXXXXXXXXXXLast year was not a positive one for memory suppliers in general or forSRAM suppliers in particular. Although Japanese suppliers still control overhalf (50.2 percent) of the worldwide SRAM market, tt\ey had the smallestrevenue decline (14.5 percent) compared to suppliers in the other worldregions. Because of the preponderance of cache suppliers in the Americasregion, SRAM revenue there decUned by 32.9 percent, leaving Americas withslightly over a quarter (26.9 percent) of the worldwide market. The thirdrankedAsia/Pacific region also dropped nearly 25 percent from 1995 (24.5percent). Asia/Pacific managed to retain its 22 percent of the worldwideSRAM market, while the small European SRAM supply base retained its lessthan 1 percent market foothold despite a 33 percent drop in 1996 revenue.SSPS-WW-DP-9710 ©1997 Dataquest July 28,1997
_ : •' • •- •• ^^• - ••' • •'•- • •• " •^•- ^ . • .• -• -. - • ^. - •: • : •Semiconductor Supply and Pricing WorldwideTable 3256K Devices Shipped0-9ns10-19ns20-44ns45-70ns71+nsPSRAMAllianceCypressElectronic Designs > Inc.---Xm'-XXX-XX--:--i--FujitsuXXX-X-G-Link-X-Hitachi-XXXX\iiHyundai--XIntegrated Device TechnologyISSILG Semicon-'.X3¥^-X.-XX---X-Matra--XXX-Matsushita---;•ic-.MicronMitsubishiMosel Vitelic•----X-XX->-Xit-•r-..-r-MotorolaXXXX-',NEC-XXXT-.Oki—--X-ParadigmRohm--%X-r--•--•X-r,Samsung' 1^X--X-Sanyo••'•::--^-XSeiko Epson• . ----.-XrSGS-ThomsonSharpSony---X;---XXX-XX-XX-*^ToshibaUMCWinbondSource: Dataquest (July 1997)-^-Xx*XXX^^.-XitXX7^--Samsung• Samsung maintained for the second year its position as the top SRAMsupplier (tied with Hitachi).• Its reluctant entry into the 32Kx32 cache market somewhat lessened thenegative impact of 1996, and Samsvmg declined orUy 10 percent from1995.• Samsvmg introduced a 1.8V family of SRAMs targeted at telecomapplications.SSPS-WW-DP-9710 ©1997 Dataquest July 28,1997
- •• - •• ^- •- • • •• ^ • -• ^- •- •* • •^ - •• ^• -' • -• - ,8 Semiconductor Supply and Pricing WorldwideTable 4512K Devices ShippedAllianceG-LinkHitachiISSIMotorolaSanyoSonySource: Dataquest (July 1997)0-9ns 10-19ns 20-44ns 45-70ns 71+ns PSRAMXXXXXTable 51Mb Devices Shipped0-9ns10-19ns20-44ns45-70ns71+nsPSRAMAlliance-XX---Cypress-~.XX--Electronic Designs Inc.Fujitsu--X--X-XXXX-:-G-Link-X----HitachiIBM MicroelectronicsIntegrated Device TechnologyXX1kX-XX-XX*X--X=-ISSIXX--LG SemiconMatra----X-XX:--^:-Micron-.X--.-Mitsubishi--^-XX-Motorola?cXXX-NEC-XXXX"ii.Oki-•^•••--XParadigm-XX-Rohm-"-X- iSamsungXiXX-X-.Sanyo---X-Seiko Epson--- •X-SGS-Thomson-X-'--Sharp--X:-••ii^SonyXXX%-Toshiba•^X--XXUMC^X----Winbond-X----Source: Dataquest (July 1997)SSPS-WW-DP-9710 ©1997 Dataquest July 28,1997
Semiconductor Supply and Pricing WorldwideTable 62Mb Devices ShippedElectronic Designs Inc.MicronSamsungSource: Dataquest (July 1997)0-9ns 10-19ns 20-44ns 45-70ns 71+ns PSRAMTable 74Mb Devices ShippedElectronic Designs Inc.FujitsuHitachiIBM MicroelectronicsMitsubishiMotorolaNECOkiSamsungSharpSonyToshibaSource: Dataquest (July 1997)0-9ns 10-19ns 20-44ns 45-70ns 71+ns PSRAMXXXXXXXXHitachi• Hitachi scratched back into the top SRAM slot, sharing it with Samsung,last year's usurper.• Hitachi announced a 4Mb (512Kx8) 70ns, 3.3V device for portableapplicatioi\s and a low-voltage (3.3V), high-performance 1Mb (32Kx32)5ns SRAM for advanced nonparity systems.Motorola• Motorola's high-performance products provided a good buffer againstcache SRAM price cuts—1996 revenue remained relatively unchangedover 1995 revenue.• Motorola introduced a line of 2Mb and 4Mb known good die (KGD)SRAMs, called TrueDie, for use in mobile and high-performancecomputing applications.Toshiba Corporation• Based on a Dataquest teardown analysis, Toshiba appears to be one ofthe chosen cache SRAM suppliers for the next-generation Intelprocessors.SSPS-WW-DP-9710 ©1997 Dataquest July 28,1997
10 Semiconductor Supply and Pricing Worldwide• Toshiba was one of the few gainers in 1996 SRAMs, rising from sixthposition worldwide to fourth-ranked SRAM supplier, growing 13.9percent in revenue.• Toshiba and Fujitsu agreed on a BGA multichip package that mountsflash memory and SRAM in a single package.NEC Corporation• Based on a Dataquest teardown analysis, NEC appears to be one of thechosen cache SRAM suppliers for the next-generation Intel processors.• NEC announced at the International Solid-State Circuits Conference a500-MHz, 4Mb double data rate (DDR) SRAM available for sampling asearly as the first half of 1998.• NEC has licensed Artesian Components Inc.'s embedded SRAM familyto complement its growing embedded memory line.Sony Corporation• As one of the companies experiencing the brunt of 1996, Sony sawrevenue decline 26.5 percent last year, dropping it from fourth to sixthplace in the SRAM ranking.• Sony announced a family of six 4Mb SRAM devices manufactured on0.35-micron BiCMOS and CMOS processes, running on 3.3V at speedsranging from 4.5ns to 8ns.Table 8Top 10 Worldwide Companies' Factory Revenue from Shipments of Static RAMWorldwide (Millions of U.S. Dollars)1995Rank1996Rank1995Revenue1996RevenuePercentageChange1996 MarketShare (%)11Samsung672605-10.012.522Hitachi662605-8.612.533Motorola519518-0.210.764Toshiba41747513.99.855NEC4214230.58.746Sony445327-26.56.787Mitsubishi304293-3.66.098Cypress Semiconductor303257-15.25.3109Integrated Device Technology285185-35.13.8710Winbond Electronics309147-52.43.0All Others1,9281,013-47.520.9Americas Companies1,9441,305-32.926.9Japanese Companies2,8442,433-14.550.2Source: Dataquest (July 1997)European CompaniesAsia/Pacific CompaniesTotal Market511,4266,265341,0764,848-33.3-24.5-22.60.722.2100.0SSPS-WW-DP-9710 ©1997 Dataquest July 28,1997
Semiconductor Supply and Pricing Worldwide 11Dataquest PerspectiveMitsubishi Corporation• Based on a Dataquest teardown analysis, Mitsubishi appears to be one ofthe chosen cache SRAM suppliers for the next-generation Intelprocessors.• Mitsubishi unveiled a 113-sq. mm. 32-pin TSOP package for its 1Mb and2Mb SRAM devices.• Mitsubishi annoimced a 4Mb device family (lMbx4, 4Mbxl, and 512Kx8)that runs on either 3.3V or 5V, featuring access times of 12ns, 15ns, and20ns.Cypress Semiconductor Corporation• Although experiencing a 15.7 percent decline in SRAM revenue. Cypressmoved up one rung in the SRAM rankings, from ninth to eighthposition.• CjApress introduced an ultra-low-power family of 256K SRAMs thatoperate down to 1.5V.integrated Device Teclinology Inc.• Highlighting the nature of the 1996 SRAM market, IDT had a revenuedecline of 35.1 percent and yet managed to rise to ninth place from 1995's10th position.• IDT announced a new SRAM family of synchronous dual port devicesmade up of four 512K and two 256K parts with output data rates as fastas 12ns, aimed at networking and telecom applications.Winbond Electronics Corporation• One of the harder-hit SRAM suppliers, Winbond slipped back to 10thposition in 1996 primarily because of the last year's cache SRAM pricedebacle, seeing revenue fall a breathtaking 52.4 percent after aphenomenal rise in 1995 of 119 percent.• Winbond was one of two Taiwanese SRAM suppliers named in asemiconductor dumping suit by Micron Technology Inc.. Winbonddenied the charges.Although the SRAM market remains very closely linked to the PC andDRAM markets, SRAMs differ in that a plethora of applications outside ofcomputers use these parts. Because of the tie with PCs, supply and demandissues in that market indirectly affect the other, lower-volume users. The glutof cache SRAM last year resulted in a scramble to provide other, moreprofitable SRAM or products that could be made on SRAM production lines.The indirect result last year for non-PC companies was good availability ofmost SRAM devices at lower-than-average prices. Although not aU usersrequire wide bus synchronous SRAM, this segment of the market willcontinue to drive technology and density trends. The continuing game ofensuring adequate supplies of older SRAM devices while new systemdesigns take advantage of higher-density SRAM parts was easier to play lastSSPS-WW-DP-9710 ©1997 Dataquest July 28,1997
12 Semiconductor Supply and Pricing Worldwideyear. At current levels of demand and capacity available, the balancinggame of older products and new products should remain easy through thefirst half of 1998. As noted in last year's update, the current buyer's marketfor SRAM should not lull users into thinking that long-term supplierrelationships are no longer needed. Sharing future product and technologyneeds with suppliers will ensure users that they will have competitivesources of products while keeping overall costs down.<strong>DataQuest</strong>A Gartner Group CompanyFor More Information...Mark Giudici, Director and Principal Analyst (408) 468-8258Internet addressmark.guidici@dataquest.comVia fax (408)954-1780Dataquest Interactivehttp://www.dataquest.comThe content of this report represents our interpretation and analysis of information generally available to thepublic or released by responsible individuals in the subject companies, but is not guaranteed as to accuracy orcompleteness. It does not contain material provided to us in confidence by our clients. Reproduction ordisclosure in whole or in part to other parties shall be made upon the written and express consent of Dataquest.©1997 Dataquest—Reproduction ProhibitedDataquest is a registered trademark of A.C. Nielsen Company
iPerspectiveSemiconductor Supply and Pricing WorldwideMarket AnalysisThird Quarter 1997 Procurement Pulse: Qrder Rates Are Mixed,Lead Times and Inventories Inch Upward, and Spot Prices LeadContracts DownAbstract: The Procurement Pulse is a quarterly update (with interval updates, if eventswarrant) of critical issues and market trends based on surveys of semiconductorprocurement managers in the North American region. Besides order rate, lead time, andinventory information, this survey also notes price status by semiconductor product familyand package type, as well as key problems facing semiconductor users.By Mark A. GiudiciSemiconductor Order Rate Expected to Bounce Back after Two Months ofCautious ForecastsAs seen in Section A of Figure 1, the outlook for semiconductor orderactivity has gone up and down and now up again since Dataquest's lastreport. Although slightly higher than June's forecast index, the outlook forJuly has historically been lower, a harbinger of the "summer slows." Thisyear may prove different from other oversupplied years. The spike inDRAM spot pricing noted in Dataquest's last report has since corrected itself,and market dynamics, not supplier schemes, again continue to cause overallpricing to slowly decline. The overall sample continues to see price cuts forlarger-volume contracts in all areas tracked in this survey—MPUs, DRAM,SRAM, and especially flash memory. Highlighting the resumption of actualsupply versus demand, DRAM pricing for the overall sample declined onaverage by 2.9 percent after the relatively flat 0.6 percent decline noted lastmonth. The computer subset of the respondents saw a sharper decline of 3.5percent in DRAM prices after a 2.3 percent cut noted in June. While overallOataQuestProgram: Semiconductor Supply and Pricing WorldwideProduct Code: SSPS-WW-DP-9709Publication Date: July 21,1997Filing: Perspective(For Cross-Technology, file in the Semiconductor Devices and User Issues binder)
Figure 1Semiconductor Supply and PricingSemiconductor Supply and Pricing Worldwideprices continue to decline, pricing for TSOPs and EGAs continues to earn(albeit smaller) premiums of 2 to 5 percent over more standard packageofferings.Section AAveraged Monthly Semiconductor OrdersIndex, 12/88 = 100DollarsSection BSpot Marltet vs. Contract Prices(1IVIBX16E00DRAIVI)Spot Low Spot High Contract\ I \ I I I 1 I12/96 1/97 2/97 3/97 4/97 5/97 6/97 7/971 1 1 r10/2/96 11/23/96 2/2/97 3/26/97 5/18/97 7/11/97WeeksSection CAveraged Semiconductor Lead TimesSection DActual vs. Target Inventory Levels(All OEMs)"I 1 1 1 r12/96 1/97 2/97 3/97 4/97 5/97 6/97•Estimated12/96 1/97 2/97 3/971 r4/97 5/976/97975036Source: Dataquest (April 1997)Spot Market Pricing Again Leads Contract Pricing—DownSince Dataquest's last report, the spot market has resumed its role as marketbellwether, again leading contract DRAM pricing downward, as seen inSection B. The scheme to control prices that began in February and ended inMay did so only in the volatile and low-volume spot market. This was anexpensive way to increase margins, and it became evident to the suppliersinvolved that there are more efficient ways to increase profit thanwithholding product. The shift to the 64Mb DRAM device is now in fullswing, and although Dataquest still foresees a market crossover from the16Mb part in about the second or third quarter of 1998, some leadingSSPS-WW-DP-9709 ©1997 Dataquest July 21,1997
ISemiconductor Supply and Pricing Worldwidesuppliers may already be there. As noted over the past year, we expectcontinued volatility of spot market prices to vacillate around decliningcontract prices, causing uncertainty for some buyers. The overall trend,however, is for continued good availability, consistently declining contractprices, and low (8- to 10-week) lead times for the next six to nine months forcontract buyers.Lead Times for Semiconductors Remain iVIanageabie at under Eight WeeksSection C highlights that the average lead time for respondents in Juneedged up slightly to 7.6 weeks, compared to a 6.9-week average noted inMay. The current stability of lead times is in part because of the removal ofuncertainty over DRAM supplies now that many of the larger Korean andJapanese suppliers have resumed shipments. The acknowledgment by bothbuyers and suppliers that 1996-style price cuts and availability are nowhistory is causing some prudence in overzealous spot buyers, makingcontracted deliveries increasingly attractive. Good service levels combinedwith slowly declirung prices are cementing many long-term supplierrelations. Although there were no supply problems noted in this month'ssurvey, good communications with suppliers often forestall possibleproblems. Last quarter, close to half of the respondents noted DRAMprice/supply issues, but there now appear to be few supply problems tocomplain about.Semiconductor Inventories Back to Historical LevelsDataquest PerspectiveSection D shows that inventories continue to overshoot targeted levels andclosely track target direction. As respondents forecast semiconductor orderrates to modulate, Dataquest sees a corresponding slight increase ininventory levels more in line with historical levels. The overall targeted andactual semiconductor inventory levels for June were 15.3 days and 17.6 days,respectively, compared to May's 12.1-day and 14.4-day inventory levels.Although not shown, the computer subset again appears more aggressivethan the average, with current target and actual inventory levels of 6.0 daysand 10.0 days. Dataquest continues to expect to see stabilized inventorylevels in the future in line with steady systems sales levels.Availability of semiconductors remains very good to excellent, and weexpect it to remain this way for the rest of 1997. As mentioned last March,Dataquest continues to see contract prices decline despite the efforts of somememory suppliers to curtail output. Lead times have stabilized to meetcustomer demand, in line with the moderate price declines. Dataquestcontinues to forecast steady 1997 growth rates for PCs and other electronicsrelative to 1996, with the overall trend following an upward growth slope.User semiconductor inventory levels are now in line with user demand, andwe expect to see continual balance in these indexes in the near future. Realallocations are not a problem, but the quick shift of some suppliers to theSSPS-WW-DP-9709 ©1997 Dataquest July 21,1997
Semiconductor Supply and Pricing Worldwide64Mb DRAM density may well cause some supply dislocation if overalldemand moves more quickly to 64Mb DRAM. With continued pricingcompetition at the 16Mb level, this scenario is possible but not highlyprobable. Dataquest expects to see excellent semiconductor availabilitythrough the end of 1997. DRAM and MPU price elasticity to date have notpropped up contract prices. The good news for users is that overall decliningcontract prices will continue for the remainder of this year.iDataquestA Gartner Group CompanyFor More Information...Mark Giudici, Director and Principal Analyst (408) 468-8258Internet addressmark.giudici@dataquest.comVia fax (408)954-1780Dataquest Interactivehttp://www.dataquest.comThe content of this report represents our interpretation and analysis of information generally available to thepublic or released by responsible individuals in the subject companies, but is not guaranteed as to accuracy orcompleteness. It does not contain n\aterial provided to us in confidence by our clients. Reproduction ordisclosure in whole or in part to other parties shall be made upon the written and express consent of Dataquest.©1997 Dataquest—Reproduction ProhibitedDataquest is a registered trademark of A.C. Nielsen Company
PerspectiveSemiconductor Supply and Pricing WoridwideMarket Analysis xDRAM Product/Market Update 1997: A Market in F!ux\Abstract: 77i«s document provides insight to users of DRAM on how thk current market oversupplyis changing the traditional supply/demand equilibrium. The DRAM market rankingsfor 1996 by product density are examined, and the DRAM life cycle chart for these products isupdated and analyzed.By Evelyn CroninOverviewThis Perspective looks at the DRAM market from a procurement standpoint.It is split into a number of sections. The first section examines the currentstates of the DRAM industry—both technology transitions and market issues.The second section contains the DRAM unit production forecast and life cyclecurve analysis. The analysis of DRAM suppliers by 1996 market share is thethird section, which is followed by a look at strategic DRAM alliances. Thefifth section tracks the supply base by density, based on 1996 shipment data.The sixth section looks at nonstandard DRAM. The Perspective concludeswith a summary and analysis of the DRAM market.The State of the DRAM IndustryFigure 1 shows some of the changes occurring in 1997 with which both buyersand suppliers are grappling—1997 is definitely the year of change.These changes or issues can be split into two categories:• DRAM technology related• DRAM market related<strong>DataQuest</strong>Program: Semiconductor Supply and Pricing WorldwideProduct Code: SSPS-WW-DP-9708Publication Date: June 30,1997Filing: Perspective(For Cross-Technology, file in the Semiconductor Devices and User Issues binder.)
Semiconductor Supply and Pricing WorldwideFigure 1DRAM—Market in Flux16Mb-->• 64MbBuyer's Product Mix AffectsForecasting AbilitySource: Dataquest (June 1997)This Perspective looks at both sections, starting with DRAM technologyrelatedtransitions.DRAM Technology-Related TransitionsThe 16Mb-to-64Mb TransitionThe 64Mb chip is becoming increasingly visible. Certain suppliers claim tobe cutting back 16Mb production already to ramp up the 64Mb density.Many vendors have offered price parity to specific customers for 16Mb and64Mb in an effort to migrate demand to the larger density. These vendors,the technology leaders, hope to gain market share at this newer density andto become the first-choice suppliers that blaze the trail and set the standards.But what should the buyer do?The 5V-to-3V TransitionThe voltage level has also begun to move south. For the longest time, 5Vwas the standard for DRAM. Now, increasingly, 3V is becoming the voltagechoice for customer applications. Thus, suppliers and buyers alike need tomake forecast adjustments to ensure the correct mix.SSPS-WW-DP-9708 ©1997 Dataquest June 30,1997
Semiconductor Supply and Pricing WorldwideThe SIMM-to-DIMM MigrationThis voltage move from 5V to 3V often ties in with the change in moduletype, from single inline memory modules (SIMMs) to dual inline memorymodules (DIMMs). DIMMs are 3V products. For PC buyers, the use of aDIMM reduces the number of sockets required on the motherboard. It alsomeans that the "two SIMMs per Pentium system" rule (meaning that thenumber of memory address Lines must equal the number of Pentium 64address lines, so that two 32-bit SIMMs are needed) becomes a thing of thepast. The DIMM offers 64 address lines per module. However, SIMMs andDIMMs differ in length, socket type, and voltage level, among others.EDO to SDRAMThe technology transition from the asynchronous EDO to the synchronousSDRAM is beginning in earnest in 1997. Intel is backing this move for thePC arena and making it the base memory of choice for certain Pentiumapplication systems. Also, chipset and motherboard support exist and wiUincrease. Most large PC companies have come out with SDRAM-designedsystems, and this number is forecast to increase in the second half of tireyear. Many believe that SDRAM wiU be the technology enabler for multimediaand consumer systems. Interest outside the PC sector is also great.Many other applications are designing in SDRAM chips (at 16Mb and64Mb densities). 'However, there is a large range in price and speed in the SDRAM offeringsfrom different suppliers. Suppliers usually have their own take, dependingon whether the company is a technology leader or laggard. That means thatbuyers hear many (often contradictory) messages fron\ their supplier base.Which one to believe?DRAM Market-Related IssuesOversuppiy to Balanced MarlcetThe DRAM market characteristics are changing. Although Dataquest forecaststhat DRAM will remain in oversuppiy throughout 1997 on a megabytebasis, there will be some short-term capacity constraints on certain products.Also, although the market in 1997 is considered to be in oversuppiy, itwill behave in a different marmer than in 1996. It is important to rememberthat in 1997, the market is making a transition from oversuppiy to supply/demand equUibrium (a balanced market), while in 1996, it made the transitionfrom supply constraint to oversuppiy.Supplier Production Cutback RumorsMany suppliers, particularly those in Korea, were quick to announceDRAM production cutbacks in January 1997. This did cause DRAM pricingto increase sUghtiy in the contract charmel from the first quarter to the secondquarter. However, the suppliers hoped to stabilize the market and todry up the redistribution or spot market for DRAM sales. Spot marketprices increased short term, but they quickly fell back down—trading neverpicked up, and product availability remained. This has led many to questionwhether production was cut back in any significant volume.SSPS-WW-DP-9708 ©1997 Dataquest June 30,1997
Semiconductor Supply and Pricing WorldwideSuppliers' Production IVIixesAll suppliers will be altering production mixes this year. Some suppliers areleading the charge by aggressively pushing the market to accept 64Mbchips, SDRAM technology, or DIMMs. These were the first to deal withinternal production changes.With the move from fast page mode (FPM) to EDO, there was typically a lagof about two months. Suppliers who are leading the migration to the newertechnologies, however, are making changes to their production.Conflicting Supplier Road Maps and MessagesWouldn't it make life a lot easier if all suppliers launched compatible productionon the same day with identical pricing and availability messages?Unfortunately, reality is different. At the monient, contradictory and conflictingmessages are coming from all DRAM suppliers on technology andmarket supply issues. Each has a different take on the market it offers to itscustomers. And the customer is left confused. Who should be trusted? Whoshould be called?From a technology standpoint, the leading DRAM suppliers are split intothree camps:• Technology leaders• As the name would suggest, technology leaders are first to market onnew technologies. They are aggressively moving the market forward.• Technology followers• Followers tjrpically launch products six to nine months after the technologyleaders. They are usually forced to match the pricing of thetechnology leaders when they do.• Technology laggards or also-rans^ These companies are often a year of so behind the leaders. Their businessis generic, standard multisourced devices. Often, their initialoffering of a new technology comes from a sourcing agreement with atechnology leader or follower. However, these companies usually staywith the market longer and will typically ride the product to thephaseout stage of the life cycle curve.Looking at the road maps and listening to the messages of DRAM suppliersmakes it easy to categorize them on SDRAM, 64Mb, and so on. Road mapsand fab or yield capacity issues often explain the seemingly contradictorymessages from the suppliers in times of flux.Buyers' Product Mixes Affect Forecasting AbilityIn an ideal world, the Material/Manufacturing Requirement Plan (MRP)would be 100 percent accurate. When new products came out, they wouldramp up on cue, as predicted, while the older products would tail off as perthe forecast. Of course, suppliers would deliver product on the exact duedate with no slippage. Tragically, real life has dealt the buyer a crueler hand.SSPS-WW-DP-9708 ©1997 Dataquest June 30,1997
Semiconductor Supply and Pricing WorldwideWith so much happening on both the external supply side and the internaldemand side, it is inevitable that wires will be crossed and the forecast willnot be as "accurate" as usual. This puts the buyer in a crucial position, takinga lead role in communicating overall strategy to the suppliers externallyand translating the supply-side road map into realistic volume productiondates for internal planning purposes.Because nearly all buyers are unsure of what their actual demand wiU be,suppliers have problems working out overall customer demand for theirDRAM production staff during this turbulent time. This affects new and oldproduct availability.The bottom line is that those who thought they were out of deep watershould think again! Buyer and supplier alike will be challenged in 1997 inways significantly different from 1996.DRAM Unit Production and Life Cycie CurveFigure 2DRAM Unit Shipments by DensityDensityFigure 2 shows DRAM unit shipments by density. The historic unit shipmentand forecast ir\formation reveals that 4Mb was the DRAM of choicefor 1996, in terms of number of units shipped. However, more megabytes ofDRAM were produced from 16Mb devices than from 4Mb devices in 1996.Millions of Units3,500mD•nm256Mb64Mb16Mb4Mb1Mb1992 1993 1994 1995 1996 1997 1998 1999 2000 2001Source: Dataquest (June 1997)SSPS-WW-DP-9708 ©1997 Dataquest June 30,1997
Semiconductor Supply and Pricing WorldwideFigure 3DRAM Life Cycle CurveIn 1996, over 90 percent of DRAM units shipped were 4Mb and 16Mb chips,with the 1Mb and 64Mb chips accounting for the remaining 10 percent. Thispattern remains essentially the same in 1997 but with 16NIb chips accountingfor over 68 percent of the total units of chips shipped alone. This dominanceof the 16Mb chip increases to over 77 percent in 1998 but falls back toabout 56 percent in 1999. This falloff of 16Mb dominance in 1999 coincideswith the rise in vmit shipments of the 64Mb chip.Despite all the talk about crossover, it is worth noting that 64Mb shipmentsrose from about 0.25 percent in 1996 to 2.6 percent in 1997 and 8.3 percent in1998. In 1999, 64Mb begins to emerge from relative obscurity, with over 31percent of all units shipped being at this density. In the year 2000,61 percentof DRAM imits shipped will be at 64Mb, and by forecast's end in 2001, thiswill have risen to over 76 percent.Figure 3 offers a broader perspective by placing the various DRAM densitiesand configurations in a life cycle curve.VPhaseR&DIntroductionGrowthMaturitySaturationDeclinePhaseout3-5 Years1 -3 Years1-3 Years2 Years2 Years3-5 Years2-5 Years>
Semiconductor Supply and Pricing WorldwideThe position of the devices on the life cycle curve is based on the Dataquestforecast of unit shipments of the devices over time. Figure 3 uses 1996DRAM unit shipments as the starting point and looks to the historicalactual shipment and forecast shipment data to determine the position ofindividual devices.Typically, for the 1Mb and above DRAM chip densities, the xl and x4 configurationsare produced first, with the x8 and the xl6 configurations followinglater.Both the video RAM (VRAM) and DRAM 256Kb chips remain in the phaseoutstage of their life cycle curves. The 1Mb DRAM hovers at the back endof the decline phase, poised to move to the phaseout stage next year. The1Mb VRAM chip remains in the middle of ti\e decline phase of its life cyclecurve.The 4Mb DRAM chip reached its peak in 1995 and now remains at the backedge of the saturation stage of its life cycle curve. The 2Mb VRAM hasmoved to the saturation stage as weU, based on the unit shipments of thisdevice worldwide.The 16Mb DRAM chips (xl and xl6 16Mb and x4 and x8 16Mb) are in thematurity phase of their life cycle curve. They should move to the saturationstage in 1997 in preparation for reaching their peak unit shipment level in1998.The 4Mb VRAM has rapidly moved up its life cycle curve and has enteredits maturity phase. It should reach saturation stage in 1998 (the year of itsforecast maximum unit shipments).The 8Mb sjmchronous graphics RAM (SGRAM) is also progressing veryquickly through the beginning phases of its life cycle curve and is at theentry stage of the maturity phase. Dataquest predicts that this device willreach its saturation stage in 1999 (the year of its maximum unit shipmentlevel).The 64Mb, at all configurations, has entered its growth phase. Dataquestforecasts that this device will move steadily through the growth and maturityphase as its unit shipments ramp up over time. Dataquest forecasts thatthe 64Mb should enter the maturity phase in 1999.Dataquest would recommend not using the 256Kb and 1Mb devices fornew product designs because these products will not be available in highvolumes from most suppliers. These devices will be available for existingcustomers, however, to support older products where a design-out isimpossible.Although the 4Mb volumes are decreasing rapidly, this density will beavailable for nonmodule applications for specific vendors for some time.However, for PC customers, Dataquest would recommend migrating fromthis density except for video applications.The 16Mb will be the chip most easily obtained for the next couple of yearsand, as such, is the ideal choice for cost-competitive solutions. The 64MbSSPS-WW-DP-9708 ©1997 Dataquest June 30,1997
Semiconductor Supply and Pricing Worldwidechip will not reach unit volume crossover with the 16Mb until 2000, but the64Mb will reach price parity with the 16Mb on a megabyte basis in 1998.Therefore, this higher-density chip will be a cost-advantageous choice.Technology TypeFigure 3 also examines the relative position of the DRAM technology typeson the life cycle curve.Top DRAM SuppliersIn terms of technology type, the three main types featured on this life-cyclecurve are FPM, EDO, and synchronous DRAM. Both FPM and EDO DRAMare asynchronous technologies. FPM DRAM has been the main driver forall applications for the past nun\ber of years. However, it was rapidlyreplaced by EDO DRAM in 1996, initially for PC applications.To start with, EDO was launched at price parity with FPM. However, as thebulk of demand moved to the EDO technology, the FPM technologybecame the niche choice. In early 1997, some suppliers began to charge apremium for FPM chips and modules over the equivalent EDO versions. Bysecond quarter 1997, this trend had gained momentum and is forecast tocontinue indefinitely. Although the price adder for FPM over EDO is only amatter of cents, it is still worth noting.Currently, the FPM has moved to the decline phase of its life cycle curve. Itwill still be available for a number of years to come, but it will become moreexpensive relative to EDO over time. Dataquest would not advise using thistechnology if EDO or SDRAM can be substituted for newer designs withexpected long lifetimes.EDO is now at the saturation phase of its life cycle curve. Dataquest expectsthat the oversupply of 16Mb EDO product wiU continue in 1997. EDO productwill remain cheaper than its FPM equivalent for the duration of the forecast.SDRAM is being launched very aggressively by some key suppliers thisyear. Already, some major PC companies have announced products usingthis technology. Also, Intel has strongly backed SDRAM for multimedia PCapplications.Although, ultimately, 64Mb will be the derisity of choice for SDRAM, initially,suppliers wiU use 16Mb SDRAM for certain applications. SDRAMwill take off and Dataquest expects it to be one of the "beUs and whistles"for fourth quarter 1997 PCs.Because of the Limited supply base for SDRAM, Dataquest forecasts shortagepossibilities of certain SDRAM speeds and configurations in fourthquarter 1997. Strong demand for SDRAM will affect the pricing of EDO.EDO will be the generic older technology that wUl be forced to compete onprice only against the SDRAM. Thus, there is a strong potential for pricedestabilization on 16Mb EDO product by end 1997.Table 1 and Figure 4 show market share for the top DRAM suppliers.SSPS-WW-DP-9708 ©1997 Dataquest June 30,1997
Semiconductor Supply and Pricing WorldwideTable 1DRAM Worldwide Market Share (Thousands of U.S. Dollars)1995Rank123475689101996Rank12345678910Company NameSamsungNECHitachiHyundaiLG SemiconToshibaTexas InstrumentsMicron TechnologyMitsubishiFujitsuOthersTotal Market1995Revenue6,5924,5924,2393,9502,5003,4583,4292,4342,2012,0516,80342,2491996Revenue4,6723,1082,7672,1471,8911,8181,7341,5111,2831,1943,80225,9271996 MarketShare {%)18.012.010.78.37.37.06.75.84.94.614.7100.0Source: Dataquest (June 1997)Figure 4Market Share of Top 10 Worldwide DRAM Suppliers, Based on U.S. Dollar Revenue,1995 and 1996Samsung^'/^zm^^:^/ -::>>^%^^%^^%;^:^ I1995 Market Share^1996 Market SharePercent-r161897444aSource: Dataquest (June 1997)SSPS-WW-DP-9708 ©1997 Dataquest June 30.1997
^0Semiconductor Supply and Pricing WorldwideAll DRAM suppliers would like to forget 1996. No company in the top 10had revenue growth; no company even managed flat revenue for this 12-month period.Instead, the top 10 reads like a list of the walking wounded. We are forcedto look at those who suffered the fewest casualties in the DRAM revenuewar between the years!LG Semicon Co. Ltd. lost the least and gained the most. It was the only companyin the top 10 to rise in the ranking table, from seventh to fifth, and italso lost the least in revenue terms (just less than a quarter of its revenue).Samsung Electronics Co. Ltd. was the only other top 10 company to experienceless than a 30 percent revenue change from 1995 to 1996. NEC Corporationand Hitachi Ltd. retained their overall ranking positions, and eachhad negative revenue change of about a third in revenue.These four (LG Semicon, Samsung, NEC, and Hitachi) must have beenthankful—for such a brutal year, they did relatively well. They could havedone better, but they could have done a lot worse, also.However, although the revenue changes and overall ranking tell a sigiuficantportion of the story, the changes in market share from 1995 to 1996 addan important dimension to help complete the fuU picture.Examining market share results of the top 10 suppliers from 1995 to 1996gives a true reflection of which vendors were able to increase their marketr- dominance and which were not, despite the revenue shortcomings experiencedby all.It is hardly surprising that Samsung, NEC, and Hitachi were able to use1996 as an opportunity to gain market share, despite shrinking revenue! Allthree benefited from their strong OEM contract market in the first half;which then enjoyed higher prices than the spot market. All three had soUdEDO production strategies and were able to rapidly and successfully makethe transition to the newer technology in line with customer demand.LG Semicon also gained market share in 1996, albeit by adopting a differentstrategy than the top three. It did not have soUd OEM customer relations tofall back on, although it had made progress on that front in 1995, and itlacked a cutting-edge road map. However, LG Semicon was able to turnthese two seemingly large handicaps into major advantages. LG Semiconlistened to what the market and its customers were saying. It respondedrapidly to the changing market dynamic by cuthng prices on generic, multisourcedproducts and by seeking new sales charmels. Its aggressiveapproach meant it won business away from its more slowly moving "established"competitors (other Japanese and U.S. companies, along withHjrundai).Micron Technology managed to remain flat—neither gaining nor losingmarket share from 1995 to 1996.Those who lost both market share and revenue in the top 10 were HjmndaiElectronics Co. Ltd., Toshiba Corporation, Texas Instruments Inc., MitsubishiCorporation, and Fujitsu Ltd. The hope is that these six companieslearned from their mistakes last year and will at least retain market sharefor 1997, with the aim of building.SSPS-WW-DP-9708 ©1997 Dataquest June 30,1997
Semiconductor Supply and Pricing Worldwide 11Strategic RAM AlliancesAll DRAM suppliers are glad 1996 is over, but Dataquest forecasts thatworse is to come in 1997. All suppliers must be hoping to have learned fromlast year's experiences and to translate these lessons into adequate disasterrelief plans to help them through 1997.Table 2 shows worldwide DRAM technology alliances. Those made in 1996are as follows:• Hitachi announced an extension of its agreement with LG Semicon toinclude a joint venture and fab agreement on 16Mb and 64Mb DRAM.The venture will be 51 percent controlled by Hitachi, 49 percent by LGSemicon. Also, Hitachi and the Singapore government have a joint ventureon 4Mb density DRAM.• Hitachi and Nippon Steel Semiconductor joined forces with the EconomicDevelopment Board (EDB) in Singapore to form Tampines Singapore,a joint venture for 64Mb DRAM. Tampines Singapore will besplit 35:35:30 among Hitachi, Nippon Steel, and EDB, respectively.• Hyundai and Scotland Development unveiled funding for a plant inHalbeath Dunfermline, Scotland, for DRAM production. Also, a licenseagreement was taken by Hjmndai for Rambus Inc. 16Mb and 64Mbtechnology.• Inomicro has a sales agreement with Micron Technology Inc. for generalDRAM. Tanisys has a sales agreement for Siemens memory module manufacture.Kanematsu Semicon has a joint-venture agreement with UMAXComputer Corporation for 16Mb DRAM.• Intel Corporation came out with a very pubUc announcement in December1996 of an alliance with Rambus. Calling it a sales agreement, Intelstated then that Rambus was the architecture for future systems to facilitategreater bandwidth.• NEC and Samsung have agreed to coordinate standards on 16MbSDRAM. As both companies are the technology leaders for synchronoustechnology, this agreement allows customers to have a compatible secondsource of this new technology.• Oki Electric Industries Co. Ltd. made an armouncement on MultibankDRAM, signing a sales agreement with MoSys Inc. Also, Oki establisheda technology exchange and licensing agreement with Silicon Magic Inc.for embedded DRAM.• Texas Instruments has had another busy alliances year. It signed a licensingagreement with Samsung covering DRAM in general. TI also increaseits stake to 33 percent in the joint venture with China Development andAcer in Taiwan.• TI also increased its ties with Kobe Steel Ltd./KTI. In addition to its existing4Mb DRAM deal, TI has a joint venture for 16Mb and 64Mb withKobe Steel/KTI.• Finally, TI imveUed its stake in Alphatec Electronics pic, a joint venturewith Alpha Microsystems (74 percent stake by Alpha, 26 percent stake byTI) in Thailand. This covers 16Mb and 64Mb DRAM.• Toyota Group has decided to wet its feet in DRAM, announcing a jointventure with Texas Instruments for 256Mb DRAM. Tokyo Electron Ltd.has a sales agreement with LG Semicon for general DRAM.SSPS-WW-DP-9708 ©1997 Dataquest June 30,1997
00CO"OCOTable 2Estimated Worldwide DRAM Technology Alliances as of May 1997a•plb~jCI>ooSupplierFujitsuFujitsuFujitsu1Mb DRAM4Mb DRAM16Mb DRAMTSMC (FA)64Mb DRAMTSMC (FA)Hyundai (]D)256Mb DRAMGeneral DRHitachiL(^$erriiean:(^)LG Semicon (FA)LG Semicon (JV,FA)^LG Semicon (JV,FA)^HitachiSingapore governmentQV)HitachiHitachi/NipponSteelHyundaiTIGD)TIOD)EDB/TampinesSingapore (JV)TI (JD)@COCO-vlOair~ttuHyund^ •IBMEnhanced Memory(LA)Enhanced Memory(LA)IBMMicron (LA)IBMIBM1 no microIntelKuroda Electric(FA)Siemens (JD)Siemens/Toshiba(JD)Micron (SARambus (SAKanematsu SemiconLG Semic«nLC SemiconMotorola (SS)Mosel Vitelic (FA)UMAX GV)3CDCOOCOCO-vlLG SemiconLG SemiconMicronMicronNEC (OEM)Sanyo64Kxl6(SS)Hitachi (FA)Siemens (FA)NEC (OEM)NEC (OEM)
COCO-oCOTable 2 (Continued)Estimated Worldwide DRAM Technology Alliances as of May 1997o"DICO~-JCDOO@lOCO•-JoCUI—IlUJ3CD«SupplierMicronMitsubishiMotorolaMotorolaNECNECNECNMBNMBOkiOkiOkiOki1Mb DRAMLG Semicon(OEM)Toshiba (FA)Micron (OEM)4Mb DRAMLG Semicon(OEM)Toshiba (FA)Micron (OEM)Samsung inEurope (FA)RamtronOn)Hitachi (FA)SGS-Thomson (]V)Mosel VJtelic(FA)16Mb DRAMSamsung SDRAM(JD)Elitegroup/Powerchip(|V)Toshiba OV)Micron (OEM)Samsung onSDRAM (CO)Ramtron QV)MoselVitelicGV)64Mb DRAMNan Ya Plastics(LA, TE)256Mb DRAMAT&T (JD)General DOkiCOOSanyoSamsungSamsungSamsungSamsungSiemensTanisysMosaid QV)Sony(FA)Sony aO)Oki SDRAM (JV)NEC on SDRAM(CO)ProMOS/MoselViteUc (JV)NEC QD)ProMOS/MoselVitelic GV)to-vl
CO00"DC/5Table 2 (Continued)Estimated Worldwide DRAM Technology Alliances as of May 1997O-aICO~-JoCOSupplierTITITITI1Mb DRAMMitsubishi (SS)4Mb DRAMHP-Canon (]W)Samsung QV, FA)Acer OV, FA)16Mb DRAMHP-Canon QV)64Mb DRAM256Mb DRAMGeneral DTIKobe Steel (FA)@COCO-vlOCOI—I-CUCOCDCOCOTITITIThom-EMITokyo ElectronToshibaSiemensToshibaToshibaToshibaToyota GroupNMB (LA)Motorola (SS)Siemens (LA)Motorola 0V)Alphatec Ct^tron^ics (jVfMotorola (JV)WinbondtUl,FA)Alphatec EleetainicsOV)^Winbond (L^FA)IBM yv)Hitachi (]D)ii/^!SajpWTIUV)51 percent Hitachi. 49 percent LG Semjcon for 16Mb and 64H^b. in Korea^Economic Development Board 30 percent, Nippon Steel 35 percent, HItactii 35 percent, in Singapore^74 percent Alptia, 26 percent TI for 16Mb and 64Mb, in Chachaersao, TfiailandNotes on agreement types;CO—Coordination agreement. Two companies agree to coordinate standards (usually).FA—Fab agreement. A company offers fab capacity for a partner's product technology,IV—Investment, Companies agree on an investment for a plant or fab,JO—Joint development, Two companies agree jointly to develop new products, wfiicti may or may not be marketed separately,JV—Joint venture. Two companies form a new joint-venture company to develop, manufacture, and market new products,LA—Licensing agreement. A company receives or issues a license to partner for an up-front fee or royalties.OEM—OEM arrangement, A company sells products to an alliance partner, wfiicti are sold under the partner's name,SA—Sates agreement. Two companies agree to allow one party to sell the product of the other.SS—Second-source agreement. Two companies agree to develop consistent specifications to ensure a second source.TE^Technology exchange. Two companies exchange technology, which may or may not include a transfer of money,Source: Oataquest (June 1997)LG Semico
Semiconductor Supply and Pricing Worldwide 15Supply BaseFor all DRAM suppliers, 1996 was a difficult and challenging year. The followingsupply base analysis for the top 10 suppliers makes this assumptionas a starting point and then deals with the approach adopted by thevendors.• Samsung3 An excellent established OEM customer base gave Samsung a revenuehead start for the first two quarters with contract orders.• It remained a consistent technology leader and driver for EDO in 1996,allowing it to minimize its exposure to FPM bloodbath pricing issues.~i Samsung is leading the pack with NEC in the synchronous drive andis weU-positioned for the future (enough capacity, good solid productroad map).• NEC• Like Samsung, NEC is a good, solid performer with a well-mixed customerbase (from the applications side) that gave it good contractorders for the first half of 1996.G Its price fallout was compounded by yen/dollar depreciation issuesin 1996.• Synchronous and 64Mb product strategies are being implementedaggressively, and the road map was well-received by custon\ers.• LG SemiconSupply Base Analysis by Density• LG Semicon was the only supplier to jump up the ranking positions in1996. It was very price competitive on standard generic products forall of 1996.3 Some mix issues on EDO/FPM modules hindered its revenue in thefirst half of 1996, but the company responded rapidly to changing marketdynamics, which helped it in the second half of 1996.• It was less aggressive on synchronous and 64Mb devices (which willaffect leading-edge design-wins and product approvals in PC andworkstation environments), but it will still have plenty of orders forthe generic product, albeit with less margin.Market leaders by density are shown in Table 3. The five top suppliers holdabout 60 percent of the 1Mb and 16Mb densities and over 80 percent of thenewer 64Mb deiisity. The 4Mb density (the No. 1 density in unit shipmentterms for 1996) showed greater supplier polarization. At this density, thetop five suppliers account for 46 percent of products shipped in 1996. Tables4, 5, 6, and 7 give more details on unit production by density.SSPS-WW-DP-9708 ©1997 Dataquest June 30,1997
16 Semiconductor Supply and Pricing WorldwideTable 31996 DRAM Market Leaders by Product Density (Based on Unit Shipments)1996 Rank 1Mb4Mb16Mb64Mb1 SanyoMicronSamsungSamsung2 ToshibaHyundaiHitachiNEC3 Mitsubishi4 FujitsuHitachiTexas InstrumentsNECHyundaiIBM MicroelectronicsHyundai5 OkiMarket Share of Top Five (%) 59.9Samsung46.0LG Semicon60.1LG Semicon82.2Source; Dataquest (June 1997)Supply Base for 1Mb DRAMsThe rankings of 1Mb suppliers, by unit shipments, are shown in Table 4.Total uruts for 1996 were 259 million, down from 340 million in 1995. Thepeak year for 1Mb was 1991, with 831 million units shipped. Note that noneof the top five worldwide DRAM suppliers feature in the top five 1Mb supplierbase.Table 41Mb DRAM Supplier Base, 1996 (Thousands of Units)SanyoToshibaMitsubishiFujitsuOkiNippon SteelHyundaiSamsungMosel VitelicTexas InstrumentsSiemensMatsushitaLG SemiconSharpNECOthersMarket TotalSource: Dataquest (June 1997)Shipments41,00037,20533,00022,50021,5301437014,20014,07012,2008,2458,1008,0057,9506,7156,6003,411259,101Rank123456789101112131415-In 1997, there will be a more dramatic decrease in output from the majorityof 1Mb DRAM manufacturers. Dataquest forecasts that the total number of1Mb units shipped in 1997 will be 151 million. Although this decrease isdramatic, most suppliers will remain in this market because the 1Mb densityis still required for certain end-customer applications.SSPS-WW-DP-9708 ©1997 Dataquest June 30,1997
Semiconductor Supply and Pricing Worldwide 17Supply Base for 4Mb DRAMsTable 5 shows the 1996 4Mb DRAM supplier base, by unit shipments. Totalproduction for 1996 was 1,303 million units, down from 1, 591 n\illion unitsfor 1995.Dataquest forecasts that, in 1997, the 4Mb DRAM production total will falldramatically to 654 million units, a reduction of almost 50 percent for theyear. This rapid faU is mainly because of the aggressive ramp-up of the16Mb. Also, most modules used by PC applications are now populatedwith 16Mb chips, not 4Mb chips. This has helped reduce demand for the4Mb density.Table 54Mb DRAM Supplier Base, 1996 (Thousands of Units)MicronHyundaiHitachiTexas Instruments,.SamsungNECLG SemiconToshibaMitsubishiIBM MicroelectronicsFujitsuSiemensMosel VitelicVanguardNippon SteelOthersMarket TotalSource: Dataquest (June 1997)Shipments170,000116,200109,200105,20099,00091,45090,30072,30064,70060,90060,00057,50052,50042,00030,98080,9301,303,160Rank123456789101112131415Suppliers will continue to manufacture the 4Mb density even though unitshipment numbers are dwindling. This is to satisfy other, non-PC demands,for example, telecommunications or printers.Hyundai, Hitachi, and Samsimg (all in the top five of worldwide DRAMsuppliers by revenue) are in the top five suppliers for worldwide 4Mb unitshipments.Supply Base for 16Mb DRAMsThe 16Mb ramp-up has been very dramatic. Volume of about 21 millionunits in 1993 increased to 344 million units in 1995 and then ramped up to996 million units in 1996.SSPS-WW-DP-9708 ©1997 Dataquest June 30,1997
Semiconductor Supply and Pricing WorldwideDataquest forecasts that 16Mb worldwide production output will almostdouble from 1996 to 1997, to reach 1, 883 million units this year. Dataquestbelieves that 1998 will be the saturation point for 16Mb, with estimated volumesat about 2,461 million units worldwide. The 16Mb will fall off afterthis point, as 64Mb takes a more dominant position.Table 6 shows the 16Mb DRAM supplier base, based on unit shipments,for 1996.Table 616Mb DRAM Supplier Base, 1996 (Thousands of Units)SamsungHitachiNECHyundaiLG SemiconTexas InstrumentsToshibaMitsubishiFujitsuIBM MicroelectronicsMicronSiemensMotorolaOkiMatsushitaOthersMarket TotalSource: Dataquest (June 1997)Shipments170,800121,500118,660101,6258630085,20071,60062,70045,90034,77034,65030,00010,9007,4407,4006,871996316Rank123456789101112131415Supply Base for 64Mb DRAMsShipments of 64Mb devices began in 1996 at a modest 6.7 million units.Dataquest forecasts that this should ramp up dramatically over the nextfew years. Unit shipments are forecast to increase from 72 million in 1997 to265 million in 1998 to 901 million in 1999.By 1999, there wiU be more megabytes of 64Mb shipped than of any otherdensity, and unit shipments of the 64Mb device should be over 1, 841 millionunits. This should increase to 2, 464 million units by 2001.Table 7 shows the 64Mb DRAM supplier base, based on unit shipments,for 1996.SSPS-WW-DP-9708 ©1997 Dataquest June 30,1997
Semiconductor Supply and Pricing Worldwide 19Table 764Mb DRAM Supplier Base, 1996 (Thousands of Units)SamsungNECIBM MicroelectronicsHyundaiLG SemiconSiemensHitachiTexas InstrumentsToshibaFujitsuMitsubishiMotorolaMarket TotalSource: Dataquest (June 1997)Shipments2,4441,8834014004003603002661307260106,726Rank123456789101112Nonstandard RAMAt this point, standard DRAM covers FPM, EDO, and SDRAM. FPM andEDO are forms of asynchronous DRAM, while SDRAM is synchronousDRAM. The push for nonstandard RAM is coming mainly from multimediaand graphics applications that need memory capable of keeping up withfast 32-bit and 64-bit MPUs like the Pentium, PowerPC, and other RISCbasedsystems. Because both video RAMs (VRAMs) and SRAMs havedecreased in price and availability has improved, these are often used forprice-sensitive applications, even though they take up valuable boardspace. There are certain applications, however, that require quite specializedtechnology.The following are some nonstandard RAMs, with descriptions.• Rambus DRAM• This is licensed by 15 semiconductor companies and has been formallyannounced by Cirrus Logic, Hitachi, LG Semicon, LSI Logic Inc., NEC,Oki, Samsung, and Toshiba. Access memory is rated at 500 MB/sec.Nintendo has announced its use of Rambus in 64-bit machines.• MoSys Mulhbank• This is a unique architecture, with several companies reviewing it.Access memory is rated at 660 MB/sec. The graphics version is of mostinterest.• Enhanced Memory Systems Inc.'s (formerly Ramtron's) enhanced DRAMa Taiwan-based Digicom Systems Inc. is selUng fast memory for highperformance486 PCs. IBM announced that it is manufacturingenhanced DRAMs for Enhanced Memory Systems. Ocean InformationSystems is the lone major customer; this technology has limited acceptanceelsewhere. NMB Technologies Inc. also acts as a foundry forEnhanced Memory.SSPS-WW-DP-9708 ©1997 Dataquest June 30,1997
20 Semiconductor Supply and Pricing WorldwideDataquest Perspective• 3-D Memorya This is a Mitsubishi-proprietary design, of interest in graphics applications.Siemens and, possibly. Integrated Device Technology Inc. willact as foundries.• Window RAM^ This is similar to VRAM, with unused features removed. WindowRAM is being developed by a small number of suppliers.• Embedded DRAM2 This concept (where DRAM is embedded into an ASIC design) isreceiving a lot of interest, mairvly at 16Mb. Both NeoMagic Corporationand Silicon Magic have designs and are working with foundries.It is definitely one of the hottest topic areas in system-level integration(SLI).Dataquest defines SLI as an integrated circuit that contains a computeengine, memory, and logic on a single chip and that has more than 100,000utilized gates. There are two types of SLI—appUcation-specific ICs (ASICs)and appUcation-specific standard products (ASSPs, products sold to morethan one user).As years go, 1996 was definitely memorable. Worldwide DRAM revenuedropped by nearly 39 percent from 1995 to 1996. All suppliers suffered battlescars, in spite of their DRAM technology armory, production capacitycannon fodder, and superpowerlike market dominance.From a buyer's perspective, however, after three years of almost no pricenegotiations, suddenly aU suppliers were willing to talk. Prices were first tofall, followed by lead times and a whole host of other factors, which helpedlower the total cost of DRAM ownership.As the market share changes from 1995 to 1996 show, some supphers mighthave lost dollars, but they won the battle by gaining market share. Thesesuccess stories were Samsung, NEC, and LG Semicon. Micron managed tocome out neither losing nor gaining ground. AU other top 10 players lostmarket share, based on Dataquest's revenue data.For suppliers and buyers alike, 1997 is going to be another challenging year.As the second half of 1997 approaches, the DRAM market is becomingmore complex. Newer technologies, voltages, chip densities, and moduletypes are gaining momentum. However, suppUers remain polarized, witheach adopting difference sfrategies and road maps. Tied in to these are therumors from certain sources of possible production cutbacks. A chaUengingtime is ahead for all buyers.DRAM is forecast to remain in oversupply on a per-megabyte basis, butthere is a real possibUity that certain devices and modules wiU be difficultto obtain (for example xl6 64Mb SDRAM and related modules) and certainspeeds will be both expensive and consfrained. Buyers are sfrongly urgedto forecast and communicate requirements to suppUers.SSPS-WW-DP-9708 ©1997 Dataquest .. June 30,1997
Semiconductor Supply and Pricing Worldwide 21But not all messages are of doom and gloom. Price crossover will occur on64Mb chips relative to 16Mb and on SDRAM technology relative to EDOrapidly and before unit shipment crossover. Also, even though certainDRAM products wiU be in short supply by the end of 1997, most buyers arelocking in prices to ensure that the risk of price hikes is minimized.Also, should the SDRAM technology take off rapidly, then the EDO 16Mbis reduced to being a generic, multisourced, older technology. It will bereadily available and potentially oversupplied. This all leads to the conclusionthat price reductions are possible as suppliers compete for a slice of thepie. The question remains as to whether the reductions will be calculatedand controlled or fast, frenzied, and furious!SSPS-WW-DP-9708 ©1997 Dataquest June 30,1997
22 Semiconductor Supply and Pricing Worldwide• JOTO^^l I^Cf^"^•^^^^^^SrA Gartner Group CompanyFor More Information...Evelyn Cronin, Senior Industry Analyst (408) 468-8075Internet addressevelyn.cronin@dataquest.comVia fax (408) 954-1780Dataquest Interactivehttp://www.dataquest.comThe content of this report represents our interpretation and analysis of information generally available to the publicor released by responsible individuals in the subject companies, but is not guaranteed as to accuracy or completeness.It does not contain material provided to us in cor\fidence by our clients. Reproduction or disclosure in whole or inpart to other parties shall be made upon the written and express consent of Dataquest.©1997 Dataquest—Reproduction ProhibitedDataquest is a registered trademark of A.C. Nielsen Company
PerspectiveSemiconductor Supply and Pricing WorldwideMarket AnalysisThird Quarter 1997 Quarterly Price Survey HighlightsAbstract: Dataquest has completed the third quarter 1^7 North American contract pricingsurvey for the semiconductors tracked. This Perspective analyzes the main signals seen, bothoverall and by main family type, and their impact on contract buyers worldwide.By Evelyn CroninGeneral Market CharacteristicsThe main signals are: Price stability has kicked in on existing technologies,but good price reductions are still available on newer technologies and chipdensities. Oversupply is set to continue, but as the market approachessupply/demand equilibrium, certain semiconductor families are beginningto tighten up.Last quarter, many DRAM suppliers went public, annoimdng productioncutbacks. Although prices for 4Mb and 16Mb asynchronous DRAM didincrease in second quarter 1997 as a result, so far there has been no sign ofany availability issues.Also, at the time of this writing, the spot market once again has gone belowthe contract price points. This is a dear sign of excess product andinsufficient customer orders in this channel.As the second half of 1997 approaches, the DRAM market is becoming morecomplex. Newer technologies, voltages, chip densities, and module types aregaining momentum. However, suppliers remain polarized, with eachadopting different strategies and road maps. A challenging time is ahead forall buyers.DataquestProgram: Semiconductor Supply and Pricing WorldwideProduct Code: SSPS-WW-DP-9707Publication Date: June 23,1997Filing: Perspective(For Cross-Technology, file in the Semiconductor Devices and User Issues binder)
Semiconductor Supply and Pricing WorldwideDRAM is forecast to remain in oversupply on a per-megab5rte basis, butthere is a real possibility that certain devices and modules will be difficult toobtain (for example, xl6 64Mb SDRAM and related modules). Buyers arestrongly urged to forecast and communicate requirements to suppliers.For non-DRAM memory devices, the forecast is somewhat different. Flashand SRAM continue to exhibit good price reductions quarter on quarter(especially at higher densities). Availability also remains good. The outlookfor EPROMs and ROMs is similar. Both should enjoy price reduction but at amore stable rate, and lead times remain unchanged. However, it should beremembered that the supply base for EPROMs is limited.Standard logic pricing remains largely unchanged from last quarter.Likewise, for cell-based ICs (CBICs) and gate arrays, pricing has been flat.The buzzwords for appUcation-spedfic ICs (ASICs) are system-levelintegration (SLI) and CBIC Ubraries.All in all, 1997 will be a year in which buyers remain in the driving seat.However, there is a greater need for buyers to broadcast their companies'requirements and to take a stand on the competing technologies available.With DRAM espedeilly, this is not the time to sit on the fence. Regeirdless ofthe buyer's company's end application, communicating current and futurerequirements is crudal.Based on the trends seen in Dataquest's North American Semiconductor PriceOutlook—Third Quarter 1997 (SSPS-SS-MS-9703, Jime 1997), we haveextracted key points.DRAMDataquest has split the DRAM highlights into two sections for thisPerspective:• DRAM devices• DRAM modulesThis has been done for ease of analysis, and both sections interrelate, comingfrom different data sources on the same survey inputs. Figures 1 and 2 show16MB and 32MB DRAM module price crossover trends.DRAM DevicesThe key points to remember about DRAM devices are:• Suppliers' pricing strategies are encouraging the rapid migration tohigher densities, espedally in data processing apphcations.• Also, suppliers are adopting aggressive strategies with the three differenttechnologies, albeit with different suppliers employing quite differentstrategies.• 4Mb remains fairly flat from last quarter's data points.SSPS-WW-DP-9707 ©1997 Dataquest June 23,1997
Semiconductor Supply and Pricing WorldwideFigure 116MB DRAM Module Crossover Points16MB EDO5V SIMM16MB EDO3.3V DIMM16MBSDRAM3.3V DIMM60 1 1Q1/97 Q2/97 Q3/971 1Q4/97 Q1/98T TQ2/98 03/98 04/98Source: Oataquest (June 1997)Figure 232MB DRAM Module Crossover PointsMillions of U.S. Dollars1 Tl 'Millions of U.S. Dollars80-75-70-65-145-* X* X .«32MB EDO 5VSIMM140-135-XN/^^--"i>aj^32MB EDO 3.3VDIMM130-125-^^Gsua^'^^Ci,_ ^32MB SDRAM3.3V DIMM120-1 101/97 02/97 03/97I04/97I01/98102/98I03/98 Q4/989741761Source: Oataquest (June 1997)4Mb fast page mode (FPM) wiU be more expensive than extended dataout (EDO) by third quarter 1997. This ties in with the rapid migrationseen to higher densities for data processing applications and the differingpridng strategies for the older technology t37pes.16Mb pricing is far less bullish on the asynchronous devices, with morelong-term stability expected.SSPS-WW-DP-9707 ©1997 Oataquest June 23,1997
Semiconductor Supply and Pricing Worldwide• Based on the survey input, Dataquest saw a $3 range in lMbxl6 EDOininimiim/maximuin pricing for second quarter 1997.• 16Mb pricing increased from first quarter to second quarter from certainsuppliers, affecting certain customers, on asjntichronous devices• Based on the survey results, 16Mb FPM will be more expensive thanEDO by second quarter 1997. However, sjTichronous DRAM (SDRAM)will be more expensive them FPM at lMbxl6 for the duration of theforecast, according to the survey participants.• For 1997, 64Mb is experiencing far more aggressive price reduction inthis forecast than in the previous forecast. This is mainly on EDOdevices.• However, Dataquest still sees a polarization in the 64Mb supply base.• Time-to-market lags of up to nine months are being seen in volumeproduction of some devices, versus initial product introduction ofothers.3 Seemingly contradictory pricing strategies from different suppliersare being seen. Ultimately, customers' adoption rates of the 64Mb willdetermine pricing points and shortage issues.• For 64Mb devices, there is price parity on x4 and x8 for the individualtechnology types. However, premiimis are charged for faster devices(higher megahertz) that vary from supplier to supplier.• SDRAM will be cheaper than EEKD of eqviivalent speed and pinout for x4and x8 64Mb by second quarter 1997.• For PC graphics applications, the 256Kbxl6 4Mb versus 256Kbx32S5mchronous graphics RAM (SGRAM) debate continues to rage.However, many players are entering this market, and customers clearlywant to move to the newer technology. By first quarter 1998, 8MbSGRAM will be cheaper per megabyte than 4Mb asynchronous chips.• Year-end risks are SDRAM shortages and 16Mb EDO oversupply.DRAM ModulesThe key points to remember about DRAM modules are:• For asynchronous 5V DRAM single in-line memory modvdes (SIMMs),the FPM will be greater than the EDO on all densities, with and withoutparity. This ties into the chip pricing policy of most vendors.• Also, because of the higher second quarter 1997 16Mb chip prices and theflatter long-term forecast, module prices are higher in second quarter1997 than first quarter 1997, and prices are forecast to stay fairly stableover time.Quite a range of SIMM prices is seen at all densities from both users andsuppliers. This would indicate the level of supply uncertainty in themarket and the scaremongering tactics of some suppliers.SSPS-WW-DP-9707 ©1997 Dataquest June 23,1997
Semiconductor Supply and Pricing Worldwide• An interesting situation is forecast for EDO SIMM and dual in-linememory module (DIMM) pricing. Crossover on both (with EDO 3.3VDIMMs cheaper than EDO 5V SIMMs) will occur in 1997, with theaverage timing shown in Table 1.• The forecast for the DIMM crossover from EDO to SDRAM (SDRAMDIMM becoming cheaper than EDO DIMM) is shown in Table 2.m An interesting observation is that the density (16Mb-to-64Mb) crossoveroccurs faster on modules than on devices. The reason could be thatsuppliers wish to target OEM buyers (generally source modules) initially,not third-party module makers (generally source chips).Table 1EDO SIMM/DIMM CrossoverDensity Price Crossover EDO SIMM to EDO DIMM8MB16MB32MBSource: Oataquest (June 1997)Q2/97toQ3/97Q2/97Q2/972Mbx32 to lMbx644Mbx32 to 2Mbx648Mbx32 to 4Mbx64Table 2DIMM EDO/SDRAM CrossoverDensity Price Crossover EDO DIMM to SDRAM DIMM8MB16MB32MBSource: Dataquest (June 1997)Ql/98Q2/98Ql/98lMbx64 to lMbx642Mbx642 to Mbx644Mbx64 to 4Mbx64SRAMThe key points about SRAM are:• Overall pricing is down in this quarter's forecast, especially for thehigher-density devices.• The end-of-life trend that began last quarter is continuing for the lowerdensitydevices tracked (x4 and x8 128Kb and x4 256Kb).• For x8 256Kb cache SRAM, buyers are still bullish about price reductions,despite the public exit of some suppliers from this segment.• For pipeline burst synchronous cache SRAM devices, the 2Mb-to-lMbprice crossover occurred in first quarter 1997 (on a per-megabyte basis).• There is still speculation as to which suppliers Intel will use as the sourceof SRAMs for the new-generation processors (which come with a cachemodule).• WiU this Umit the total number of SRAM vendors?• What will those not chosen do?SSPS-WW-DP-9707 ©1997 Dataquest June 23,1997
Semiconductor Supply and Pricing Worldwide• WiU there be a price free-for-all on noncache SRAMs?On the x8 1Mb, the 15ns is still the cheapest device, while the 20ns and25ns remain at price parity.The x8 4Mb remains cheaper than the xl6 version at eqxiivaient speeds.A premium still remaiiis at 4Mb for 25ns devices over 70ns, and thesiirvey participants forecast it to remain in place for the foreseeablefuture. However, as demand patterns shift, Dataquest expects this tochange.Lead times remain unchanged from last queirter.FlashThe key points about flcish are:• Buyers are more bullish about price reductions this time around. Thismeans that the flash market should offer relatively good availability forthe next 18 months.• Common messages on the trend to lower voltages are: The lower-voltagedevices are forecast to be cheaper long term. Timing on this trend veiriesby flash density.• On 4Mb (512Kbx8 SOP) devices, the 3V will be cheaper than the 5V,which will be cheaper than the 12V by second quarter 1997 for the samespeed. This price forecast remains until 2001.• By third quarter 1997, buyers are predicting that the 3V will cost lessthan the 5V, which will cost less than the 12V on the 8Mb (lMbx8 TSOP)devices for the same speed. According to survey peirticipants, thissequence will remain in place until the end of the forecast period.• For 16Mb (2Mbx8 TSOP) devices, buyers forecast that the 3V will becheaper than the 5V, which in turn will be cheaper than the 12V by thefirst quarter next year, at the same speed.• Lead times remain unchcinged from last quarter on all devices.MicroprocessorsThe key points to remember about MPUs are:• Intel is decreasing prices on "high end" Pentiums very aggressively,effectively planning to make them entry-level PC processors by thefourth quarter of 1997.• Intel's Pentium MMX family has a new member at 233 MHz. All areattractively priced, and Intel clearly is out for market share.• Intel's new Pentium II family has made its debut wdth 512Kb of cacheand frequency ranges of 233 MHz to 300 MHz. All can use the PentiumPro chipsets (440FX and 440LX), which means that some very high-levelSSPS-WW-DP-9707 ©1997 Dataquest June 23,1997
Semiconductor Supply and Pricing Worldwidemachines are being laimched this year. In price, volume acceptance willoccur mainly in 1998.Not to be outdone, the PowerPC camp is coming out very strongly withthe 604 processor family, which offers quite an attractiveprice/performance curve.ASICsThe key points to remember about ASICs are:• One-micron technology is moving quickly to production-orUy statusfrom many ASIC houses—that is, they have a poUcy of no new designsin this technology but will continue to manufacture existing designs.• Generedly, midrange gate count solutions are cheaper in gate arrays.However, for higher gate coimts, cell-based ICs are usually a far morecost-effective solution.• Under-10,000-gate designs are being served by a variety of fieldprogrammablegate array/programmable logic device (FPGA/PLD)providers, each with its own standard.• Pressvire to gain business has pushed prototype lead times down frommost suppliers. However, these lead times are usually less for gate arraysolutions.• The 0.18-micron technology is being launched by many suppliers.However, it will most likely be the second half of 1998 before productiondesigns appear.• SLI desigris are taking off in a big way—this trend is expected tocontinue.Dataquest PerspectiveThe year 1997 should continue to be challenging for buyers. Although thesemiconductor market will remain in oversupply, certain device families willstart to tighten as the market approaches supply/demand equilibrium. Thebottom line: Etemand remains strong for all devices.The real concern this year is the state of flux of the DRAM market. Eachsupplier has its own angle on which variable wiU take off when. Buyers areleft interpreting the data and tying it in with their chipset road maps,motherboard plans, and other factors. It is vital for buyers to commimicateinternal requirements effectively with key suppliers and to lock in futuredemand early.Intel remains a marketing Goliath, influencing not just its direct customersbut also its semiconductor competitors. Intel influences DRAM vendors andwill potentially control which SRAM vendors remain volume cachesuppliers.SSPS-WW-DP-9707 ©1997 Dataquest June 23,1997
Semiconductor Supply and Pricing WorldwideAlthough Intel's road map is often more aggressive than most companiescan realistically achieve in the stated time frame, it should be watched by allbuyers, whether working for a PC company or not. Niche DRAM playerswill remain, but there is a bigger chance of multisoiurced supply by choosingstandard (read PC) product. Likewise, SRAM suppliers not diosen by Intelas an SRAM sovurce for its new processor will have to tackle the noncachemarket aggressively. This coxild translate into further price movement fortelecom, routers, and so on.On all devices, reduction of total cost of ownership is the goal of buyers. Thecheapest buying price does not always translate into the most cost-effectivesolution!<strong>DataQuest</strong>A Gartner Group CompanyFor More Information...Evelyn Cronin, Senior Industry Analyst (408) 468-8075Internet addressevel5n1.cronin@dataquest.comVia fax (408)954-1780Dataquest Interactivehttp://www.dataquest.comThe content of this report represents our interpretation and analysis of information generally avaulable to thepublic or released by responsible individuals in the subject companies, but is not guaranteed as to accuracy orcompleteness. It does not contain material provided to us in confidence by our clients. Reproduction ordisclosure in whole or in part to other parties shall be made upon the written and express consent of Dataquest.©1997 Dataquest—Reproduction ProhibitedDataquest is a registered trademark of A.C. Nielsen Company
PerspectiveSemiconductor Supply and Pricing WorldwideMarket Analysis1996 ASIC Product and Market Update: Reality BitesAbstract: in a year in which overall semiconductor market revenue declined by 63 percent,the ASIC market grew by 27 percent—an outstanding performance. This article highlightsthe status of the ASIC industry and notes important developments in this criticalsemiconductor market from a user's perspective. We provide analysis using the latestmarket data, product life cycle, supplier base, and market outlook information. Strategicrecommendations are made to users.By Evelyn CroninASIC Market 1996: Reality BitesApplication-specific ICs (ASICs) are an arena that has matured over the pastfive years. Last year's performance has convinced even the most skepticalthat it is a force to be reckoned with, a market segment that can buck the tideof the rest of the semiconductor market. Although 1996's growth rate failedto match the record-breaking heights set in 1995, it was extremely healthy,given the djmamics of the semiconductor industry in 1996.An interesting development is the rapid rise of cell-based IC solutions andthe decline of the gate array segment. In 1996, revenue for the cell-based ICbusiness surpassed that of gate arrays for the first time. This trend willcontinue as ASIC suppliers fuel the cell-based IC market to accelerate theirgrowth and improve their n\arket rankings. The winning vendors will bethose that can offer cost-effective solutions from well-stocked cell libraries totheir targeted customer niches.Overall ASIC revenue growth was 17 percent from 1995 to 1996. Gate arrayrevenue pltimmeted by 6.2 percent, with cell-based ICs rising by 27.3percent. Programmable logic devices (PLDs) had a positive growth of 11.9<strong>DataQuest</strong>Program: Semiconductor Supply and Pricing WorldwideProduct Code: SSPS-WW-DP-9706Publication Date: June 9,1997Filing: Perspective(For Cross-Technology, file in the Semiconductor Devices and User Issues binder)
Semiconductor Supply and Pricing Worldwidepercent. There were some shining stars within the top 10 of each category.Overall and within the PLD area. Philips launched itself into the top 10,growing at a mind-boggling 520 percent from 1995 to 1996. Within gatearrays, it was Texas Instruments that challenged the tide of negative growth.TI grew by 19.1 percent in this shrinking market. And among cell-based ICs,it is the worldwide No. 1-ranked supplier (NEC) that stepped into thegrowth spotlight, achieving 114.8 percent revenue growth from 1995 to 1996.This document provides ASIC users with practical and strategic informationfor choosing devices, technologies, and suppliers. Dataquest's analysiscomprises four sections. The first serves as a guide to cost-effective, longtermprocurement by analyzing the ASIC process technology life cycle curveand key milestones. The second section reviews the product strategies of thetop 10 worldwide ASIC suppliers. The third section looks at the supply basefor the three different ASIC components (cell based ICs, gate arrays, andPLDs). The fourth section looks briefly at system-level integration (SLI) andits impact on the ASIC market.This arrangement provides a concise way of assessing the market dynamicsof the ASIC industry and the best way to obtain these devices for theremainder of this decade. The goal of this article is to enable ASIC users tomeet their needs for these critical devices with a sovmd strategy that willprovide a cost-effective, stable, and long-term supply despite shifts in themarket.DefinitionsAn ASIC is a logic product customized for a single user. Dataquest definesan ASIC to include gate arrays, cell based ICs, and PLDs. Dataquest. definesgate arrays as semicustom digital or linear/digital ICs containing aconfiguration of vtncommitted logic elements, which are customized byinterconnecting the logic elements with one or more routing layers. CellbasedICs are customized digital or mixed-linear/digital ICs that use a fullset of masks; the device consists of precharacterized cells or macrosincluding standard cells, megacells, and compilable cells customized byusing automatic place and route. PLDs are ASIC devices that areprogrammed after assembly.Rankings are based on dollar shipments, which include the following foursources of revenue:• Device revenue—^both merchant and intracompany• Nonrecurring engineering (NRE) revenue• ASIC software revenue• PLD development kit revenueAs mentioned earlier, ASIC revenue includes cell-based ICs, gate arrays, andPLDs orUy. Full-custom IC revenue is excluded from the ASIC market share.Also, ASIC revenue is from MOS/BiCMOS products only—it excludesbipolar products.SSPS-WW-DP-9706 ©1997 Dataquest June 9,1997
Semiconductor Supply and Pricing WorldwideAn important point to keep in mind when looking at the ASIC dollarrevenue is the impact of the yen/dollar exchange rate. In 1996, the yendepreciated 13.7 percent against the dollar. Dataquest calculates theexchange rates as ¥93.9 per U.S.$1 in 1995 and ¥108.8 per U.S.$1 in 1996. Thishad a negative impact on the growth rate of all Japanese ASIC companies.ASIC Technology Life CyclesASIC Process Life CycleFigure 1ASIC Technology Life Cycle CurveUnitsFor this Perspective, the process technology life cycles are analyzed, whichcovers the main generational changes to ASICs. This section is designed toassist users in adjusting to forces affecting the marketplace over the short tolong term. Because an ASIC is as much a technology as a specific product,this market does not lend itself to traditional life cycle analysis. Thus, thereare two separate figures in this section—one looking at the life cycle of theASIC technologies (generations), the other looking at the most notable ASICmilestones over a six-year period.Figure 1 shows the ASIC technology life cycle curve for the different processgenerations. Each process can manufacture cell-based ICs, gate arrays, andPLDs. Historically, depending on the supplier, there is typically a lag of oneor two quarters for cell-based ICs over gate arrays, caused by the timeneeded to update cell libraries. Nowadays, certain manufacturers areintroducing cell-based designs at the same time as gate arrays.0.25IVIicronQ.35Micron1.2+Micron0.18 MicronR&DIntroduction—Growthl\^aturity—SaturationDeclinePhaseout1-2 Years1-2 Years1-2 Years1-2 Years2+ Years973822Source: Dataquest (May 1997)SSPS-WW-DP-9706 ©1997 Dataquest June 9,1997
ASIC MilestonesSemiconductor Supply and Pricing WorldwideThe production workhorse designs of the ASIC world are now the 0.5/0.6-micron and 0.8-micron generation designs. (Please note that all sizes refer todrawn gate length.) Based on 1996 shipments, these products had thehighest volumes. Both are established products, in the maturity-saturationphase of their life cycles. Although the 0.5/0.6-micron technology probablyhas about one more year left in this stage, on average, the 0.8-micron is at theright edge of the curve, poised to decline in volume in 1997.The 1.0-micron technology is still being used for many applications but hasmoved to production-only status with many ASIC suppliers (that is to say,no new designs are made in this process, but existing designs are stillmanufactured).The 1.2-micron technology is in the phaseout stage of its life cycle and willremain in this stage for the foreseeable future. Some existing productiondesigns will require support for many years, and suppliers will have tohonor contractual agreements.All process generations greater than 1.2 micron are in the phaseout stage, aswell. However, many larger ASIC suppliers have made 2-micron offeringsobsolete, and a custom manufacturer may be the only choice in some cases ifadditional orders are required.On all purchases of decline- and phaseout-stage ASIC processes, it isextremely important to forecast requirements to ensure that suppliers arefully aware of a purchaser's anticipated needs over time. Also, the fine printon contracts should be checked to see what obligations exist on both sides.Just because the process generation is slipping toward the phaseout stagedoesn't mean that the supplier will switch off production immediately. Inmany cases, a product is in the phaseout stage for up to seven years (orlonger, depending on what was agreed). It may not be the sleekest, sexiestdesign, but it may well be the best fit (read lowest remaining lifetime cost)for the chosen application, and a rework is nonsense.On the other end of the spectrum, the 0.25- and 0.35-micron ASICgenerations are beginning to make their presence known and are in theintroduction-growth phase. The 0.25 micron is barely on the curve,occupjdng a position at the far left side of the introduction stage—it is thereal new kid on the block. The 0.35 micron has been around for slightlylonger and is beginning to grow in volume.The latest and greatest process generation is the 0.18 micron. Suppliers seemto be trying to outdo themselves in the race to launch working designs atthis size. Although some think this could be the year for some designs tocome out in this generation, realistically, next year is more likely.Figure 2 shows some of the notable milestones in the ASIC world. Lookingback, two things hit the ASIC watcher. The first is the awakening of interestSSPS-WW-DP-9706 ©1997 Dataquest June 9,1997
Semiconductor Supply and Pricing WorldwideFigure 2Notable ASIC Milestonesin system-level integration and the production emergence of SLI ASICdesigns around 1993 and 1994. SLI ASIC design started in about 1990, but ittook some time to translate into production. In 1996, a major psychologicalbarrier was broken—cell-based IC revenue surpassed that of gate arrays.Cell-based ICs had come of age! The next notable milestone involved bothPLDs and SLI—over the next 18 months, SLI field-programmable gate array(FPGA) combined products will become possible. And finally, as the decadeand millennium come to a close, DRAM SLI will begin to becomemainstream.A backdrop to those four events is the continued process generation changeoccurring behind the scenes, facilitating achievement of many of themilestones. Newer and newer gate array and cell-based IC designs will usethe smaller-size geometries, and buyers and designers alike will be facedwith the challenge of coming up with the most cost-effective and compactsolution for their given application. Exciting times are ahead as a world ofpossibilities emerge.SLI DesignsGainingAcceptanceFPGA SLIPossibilitiesCrossover Point:Cell-Based IC Revenuer>i->».. r-ri^ . „ . DHAM aLIGate Array Revenuet-"'.i=.r:..- BecomingMainstreamHH1993 1994 1995 1996 1997 1998 1999 2000973eS3Source: Dataquest (May 1997)Supplier AnalysisThis section analyzes the product and market strategies of the leadingsuppliers of ASIC products. This analysis covers product positioning,market rankings, geographic focus, and related issues. Table 1 highlightsDataquest's final 1996 worldwide overall ASIC market share rar\king of thetop 10 suppliers in terms of revenue. This table serves as the background forthe analysis of the top 10 suppliers and also for the product lifecycle/supplier base discussion. Table 2 shows ASIC revenue, both overallSSPS-WW-DP-9706 ©1997 Dataquest June 9,1997
Semiconductor Supply and Pricing Worldwideand for each segment. For information regarding product definitions,exchange rates used, and so on, please refer to the Definitions section earlierin this Perspective.Table 11996 Worldwide Market Share Rankings for Total MOS/BiCMOS ASIC SupplierRanking (Revenue in Millions of Dollars)1995 OverallRankin E;1996 OverallRankingCompany1996 Market Share (%)1996 Revenue123123NECLSI LogicFujitsu11.4in7.61,6891,1361,12064Lucent Technologies7.11,06075IBM6.81,00356Texas Instruments5.784147Toshiba5.683698VLSI Technology4.1615109Hitachi3.9577810Xilinx3.8566Top 10 Subtotal63.79,443Total Market100.014,829Source: Dataquest (April 1997)Table 21996 ASIC Rankings—Overall and by the Three Composite AreasOverall 1996RankingCompanyCell-Based ICRank \xy%Gate ArrayRankingPLDRanking1NEC21-2LSI Logic43••'3Fujitsu82-45Lucent TechnologiesIBM13-76-6Texas Instruments65-7Toshiba114'"8VLSI Technology518-9Hitachi126•10Xilinx--1Source: Dataquest (April 1997)In a year in which the overall semiconductor market fell by 6.3 percent, theASIC market grew by 27 percent—a truly exceptional achievement in such abad year.NEC CorporationNEC retained the No. 1 position for worldwide ASIC sales for the thirdsuccessive year, increasing market share to 11.4 percent and growingSSPS-WW-DP-9706 ©1997 Dataquest June 9,1997
Semiconductor Supply and Pricing Worldwiderevenue by over 29 percent. NEC is the largest gate array supplier, capturingnearly 17 percent of the market despite experiencing a 1.6 percent revenuedecline. Most important, NEC showed that its cell-based IC focus has reallystarted to pay off. The company rose from being No. 6 (in 1995) to being thesecond-largest cell-based IC supplier worldwide, growing its revenue by awhopping 114.8 percent in the process. In CBICs, NEC emphasizes the 0.25-micron generation. Despite aU these achievements, NEC still derives the bulkof its revenue from intracompany or captive business. NEC is improving itsexternal focus with dedicated sales teams targeting certain segments. Itcontinues to build its cell design libraries and has a strong presence in theSLI segment.LSI Logic Inc.Although NEC retains the No. 1 position for overall ASIC sales, LSI Logicremains the No. 1 merchant market and stayed in the No. 2 position forworldwide sales. However, LSI Logic dropped in revenue terms by just over2 percent, so it failed to continue its successes of 1995. LSI Logic retained itsNo. 3 rank for gate array sales but is the No. 1 merchant market supplier inthis category despite decreasing revenue by 14.3 percent. Onedisappoinhnent for LSI Logic was its No. 4 position in cell-based ICs—itslipped from the second slot of 1995 and grew revenue in this segment by ameager 14.6 percent (compared to 114.8 percent by NEC, 48.5 percent byLucent Technologies, and 75.8 percent by IBM). LSI Logic continue to offerleading-edge technology to system designers offering standard cells, gatearrays, embedded arrays, cell-based ICs, and SLIs. However, the 0.35- and0.25-micron products are ceU-based only.Fujitsu Ltd.Fujitsu stayed in No. 3 position for 1996 for overall ASIC sales but saw itsrevenue fall by 3.2 percent from 1995 to 1996 and its market share stay atabout 7.6 percent. For MOS/BiCMOS gate arrays, Fujitsu retains its No. 2position with just vmder a 14 percent market share despite losing 14.3percent in revenue terms. Most of Fujitsu's revenue comes fromintracompany sales, largely driven by the Fujitsu group's monstrous growthin PCs within the Japanese market. On cell-based ICs, Fujitsu remained ineighth position, growing at a modest 8.8 percent.Lucent TeciinoiogiesLucent Technologies (part of AT&T before 1996) continues to move up theoverall ASIC chart, coming in at fourth position in sales revenue for 1996. Itgrew revenue by over 37 percent, the second-highest growth level of a top 10player, and passed the billion-dollar milestone. Lucent really does notfeatiire as a gate array player but is king of the castle in cell-based ICs—retaining the No. 1 position and growing revenue by well over 48 percent. Itcontinues its assavdt on the merchant cell-based IC market, focusing ondesigns with high intellectual property content in large unit volumes. Itsmarket share is now 13.2 percent, but NEC is nipping at its heels. LucentTechnologies PLD performance remains solid, and the company retainedsixth position and grew revenue by 4.2 percent, to reach $75 million.SSPS-WW-DP-9706 ©1997 Dataquest June 9,1997
Semiconductor Supply and Pricing WorldwideIBM CorporationIBM continues to gain momentum, rising from seventh in 1995 to fifthposition in 1996 and growing revenue by nearly 40 percent (the highest of alltop 10 overall ASIC worldwide suppliers). Its revenue also passed thepsychologically important billion-dollar mark. Despite decreasing gate arrayrevenue by 10.6 percent (although remaining at seventh position), it was incell-based ICs that IBM really shone. Its cell-based IC revenue increased by75.8 percent (the second highest in the worldwide cell-based IC revenuerankings), coming in at about $733 million. Like NEC and Fujitsu, IBMtraditionally is a captive suppler. It has been present in the merchant marketonly since 1993, so its rapid rise is a testament to its core strength. Its aim isto supply high-density, cost-effective gate array and cell-based ICs, and it isbuilding up a large design cell library. From its captive experience, IBM hasfocused mainly on data processing but is also looking at consumer andcommunications, as well.Texas Instruments Inc.Texas Instruments was knocked from its No. 5 position to No. 6 by IBM in1996 but did manage a nearly 7 percent overall worldwide ASIC revenueincrease. TI was among the few companies that managed positive growth ingate arrays in 1996, at 19.1 percent, but it did not move from fifth position.For cell-based ICs, however, TI was in the unique position of being the onlytop 10 supplier to shrink its revenue (by 1 percent) in this fast-growingcategory. It also fell to sixth position.Toshiba CorporationThe year 1996 was not a good one for Toshiba, which fell from fourthposition in 1995 to seventh position in 1997 and saw its revenue shrink by 9.4percent in that time as well, based on overall worldwide ASIC revenue. Ingate arrays, Toshiba maintained the No. 4 position but reduced revenue bynearly 16 percent. Also, in the fast-growing cell-based IC segment, Toshibadropped out of the top 10 (coming in at No. 11) and grew by a meager 8.1percent in this exploding segment. There is no denying that Toshiba didsuffer badly from the yen/dollar depreciation. It still does offer a three-dayturnaround for prototype gate arrays, which it must exploit to heighten itsvisibility as both a high-volume and quick high-technology ASIC supplier.Toshiba also still has its design planning methodologies agreement withS5mopsys for deep-submicron geometries.VLSI Technology Inc.VLSI Technology had a much better time in 1995 than in 1996. It rose fromtenth to eighth position in the overall worldwide revenue rankings, growingby 28.4 percent in the process. VLSI had another weak year inMOS/BiCMOS gate arrays, dropping from 13th to 18th position, shrinkingrevenue by nearly 30 percent. Its primary focus remains on cell-based ICs,and this year was another strong year for the company. Positioned No. 5again in cell-based IC worldwide revenue, VLSI grew by 42.6 percent (thefourth highest in the top 10 of this segment).SSPS-WW-DP-9706 ©1997 Dataquest June 9,1997
Semiconductor Supply and Pricing WorldwideBHitachi Ltd.Hitachi managed to rise to ninth position for overall worldwide ASICrevenue, growing revenue by nearly 30 percent and achieving a 3.9 percentmarket share. In gate arrays, it grew by just over 12 percent (with just under7 percent market share) and maintained its sixth position. It also had a greatyear in cell-based ICs, moving from 15th to 12th position and achieving anear 91 percent revenue jump in the process. However, with cell-based ICsales of $266 million, it still is well behind the big boys of the cell-based ICworld. Although Hitachi have been trying to grow its merchant gate arrayand cell-based IC sales, the majority of its revenue still comes fromintracompany sales. Given the decline of the yen against the dollar, it may bethat the company's growth would have been larger if circumstances hadbeen different. For cell-based ICs, Hitachi's focus with its high-densitysolutions is home-use information electronics and multimedia-compatibleequipment applications. To this end, it continues to work on cell designlibraries.Xiiinx Inc.Xilinx dropped by two positions from 1995 to 1995, filling the 10th slot inworldwide overall ASIC revenue. Its revenue is now $566 million,commanding 3.8 percent of the total market. Xilinx is unique in that it is theonly top 10 player that derives its entire revenue from the PLD business.This does limit Xilinx's ability to grow and to tap into the lucrative cell-basedIC market. In PLDs, Xilinx used to be in a league of its own. However, in1996, Altera narrowed the gap considerably and is now No. 11 in overallASIC worldwide sales revenue from its PLD business alone. PLDstraditionally tend to be low-gate-density solutions, but Xilinx is pushing theboundaries, offering 40,000-gate FPGA devices.Supply Base AnalysisThis section uses information on ASIC product/technology life cycles andsuppliers in presenting a product family evaluation of the supply base overthe long term for MOS/BiCMOS gate arrays, cell-based ICs, and PLDs. Thegoals of this section are to provide users with a practical means of gaugingthe long-term supply and direction for these ASICs and to provide help inselecting suppliers for these devices.Each segment contains a table showing the size of the market in terms offactory revenue in 1996 and a rar\king, including suppliers' shares in eachproduct segment. The product/technology life cycle analysis serves as thebasis for a summary assessment from a user's perspective on the availabilityexpected for MOS/BiCMOS gate arrays, MOS/BiCMOS cell-based ICs, andMOS/BiCMOS PLDs. The summary includes a statement on whether theuser faces a favorable or critical supply base for each product technology.Building on the prior sections, factors affecting the supply base, such assupplier strategies, are discussed.SSPS-WW-DP-9706 ©1997 Dataquest June 9,1997
10 Semiconductor Supply and Pricing WorldwideSupply Base for MOS/BiCMOS Gate ArraysAlthough there was no change in the ranking of the top 10 gate arraysuppliers from 1995 to 1996, the market size itself decreased. The marketshrarJc by 6.2 percent, from $5,977 billion in 1995 to $5,609 billion in 1996.Revenue shrank for seven of the top 10 gate array suppliers shown in Table3. The three exceptions were Texas Instruments (growing at 19.1 percent),Hitachi (growing at 12.1 percent), and Motorola (which grew at 1.0 percent).The gate array market had a double whammy in 1996 that accelerated themarket decline. The first was the yen/dollar depreciation (13.7 percentdecrease), which affected all vendors with Japanese customers. The secondwas the rapid migration to cell-based IC solutions. Nine of the top 10 gatearray suppliers are also in the top 20 cell-based IC worldwide rankings—Mitsubishi is the exception. Thus, a lot of the top 10 gate array supplierssacrificed this segment for the cell-based IC applications, which usually offerthe added benefit of higher margins.Table 3 shows the 1996 top 10 gate array suppliers, based on worldwiderevenue, and the percentage market share for each.Table 31996 Supply Base for MOS/BiCMOS Gate Arrays (Percentage Shareof Factory Revenue)CompanyNECFujitsuLSI LogicToshibaTexas InstrumentsHitachiIBMMitsubishiMotorolaGEC-PlesseyOthersTotal Market ($B)Source: Dataquest (April 1997)Market Share (%)16.913.810.310.1IJ6.94.84.03.71.919.95.609Supply Base for MOS/BiCMOS Cell-Based ICsCell-based ICs were cooking with gas in 1996. It was the hottest of the ASICsegments and for the first time was the largest of the three in revenue terms.The market craved cell-based ICs, with customers hvmgry for designs, andthe suppliers were only too willing to obhge. The worldwide cell-based ICmarket grew by 27.3 percent, from $5,747 billion in 1995 to $7,317 billion in1996. This was in spite of yen/dollar exchange fluctuations and increasingprice pressure. This market had the highest number of shakeouts in supplierpecking order of the three ASIC areas.SSPS-WW-DP-9706 ©1997 Dataquest Junes, 1997
Semiconductor Supply and Pricing Worldwide 11Revenue growth rates for the top five were staggering, with NEC achieving114.8 percent and rocketing into second position.Table 4 shows the 1996 top 10 cell-based IC suppliers, based on worldwiderevenue. It also illustrates the percentage market share of each.Table 4Supply Base for MOS/BiCMOS Cell-Based ICs (Percentage Share ofFactory Revenue)CompanyLucent TechnologiesNECIBMLSI LogicVLSI TechnologyTexas InstrumentsHewlett-PackardFujitsuSymbiosSGS-ThomsonOthersTotal Market ($B)Source: Dataquest (April 1997)Market Share (%)13.210.110.07.67.55.55.24.74.74.227.37,317Supply Base for MOS/BiCMOS PLDsAs a segment, PLDs grew by just vmder 12 percent in 1996, from $1,701billion in 1995 to $1,903 billion in 1996. The ranking of the top 10 supplierswas relatively unchanged from 1995, the exception being Philips, whichmoved into ninth position from its No. 12 1995 ranking, knocking outInternational CMOS Technology.The major development was the positive inroads made by Altera on closingthe gap between itself and Xilinx. If Altera keeps it up, first place is reachablein 1997. Advanced Micro Devices was the only top 10 PLD supplier thatshowed a contraction in 1996. There is no denying that 1996 was a toughyear for AMD, but it is poised for better fortune in 1997 with Vantis and adedicated salesforce.Table 5 shows the 1996 top 10 PLD suppliers, based on worldwide revenue,and their percentage market shares.System-Level IntegrationSystem-level integration is placing ever-higher levels of total systemfunctionality on a single chip. It is a term introduced into the market byDataquest in 1995, chosen to illustrate that system design in the future willinclude hardware/software co-design.SSPS-WW-DP-9706 ©1997 Dataquest June 9,1997
12 Semiconductor Supply and Pricing WorldwideDataquest defines SLI as an integrated circuit that contains a computeengine, memory, and logic on a single chip and that has more than 100,000utilized gates. There are two types of SLI—ASICs and application-specificstandard products (ASSPs, products sold to more than one user).Table 5Supply Base for MOS/BiCMOS PLDs (Percentage Share of FactoryRevenue)CompanyXilinxAlteraAdvanced Micro DevicesLatticeActelLucent TechnologiesCypress SemiconductorAtmelPhilipsQuickLogicOthersTotal Market ($B)Source: Dataquest (April 1997)Market Share (%)29.726.112.810.57.83.93.21.81.61.31.31,903The first steps toward SLI brought microprocessors and SRAM on-chip.Now, with advances in silicon process techniques, it is possible to have trueone-transistor (IT) DRAM memory join the other components on the ASIC.The basic difference between a sUicon process optimized for logic and oneoptimized for DRAM is the emphasis on interconnect technology versuscapacitor construction. Embedded DRAM can be defined as a product thatincludes large amounts (more than 100,000 gates) of random logic andsingle-transistor DRAM on a single chip. Embedded SRAM usually has asmaller amoimt of on-chip memory (relative to DRAM). SRAM on an ASICcan be constructed using two different approaches:• Built out of logic gates, typically used on a gate array• Built out of dedicated six-transistor (6T) SRAM bit cells, typically usedfor cell-based or embedded array designsThe main SLI ASIC applications at present are: set-top boxes, multimedia,personal electronics, video games, portable computing, and portablecommunications. It is a segment that Dataquest predicts will skyrocket,accounting for over 50 percent of all ASICs sold by the year 2000.A Perspective on embedded controllers, to be published by theSemiconductor Supply and Pricing Worldwide program in June 1997, willexamine the area of DRAM SLI in more detail.SSPS-WW-DP-9706 ©1997 Dataquest June 9,1997
Semiconductor Supply and Pricing Worldwide 13Dataquest PerspectiveThe year 1996 gave the ASIC market a bite of reality, slowing its seeminglybreakneck growth. However, for the ASIC market to grow by 27 percent in ayear in which semiconductors experienced 6.3 percent contraction and thenet worth of the yen against the dollar decreased by 13.7 percent isremarkable.The fruits of success were reaped by those suppliers with strategies thatwere both focused and fluid. These strategies focused on well-definedcustomer applications, building on past accomplishments. The winningstrategies were also sufficiently fluid to facilitate support for the next "killerapplication."The success of cell-based ICs in 1996 in surpassing the worldwide revenue ofgate arrays for the first time is significant. More and more suppliers arefocusing on this lucrahve market to capture business. However, for asupplier to be successful, it must have a well-stocked and -rounded designcell library focused on SLI and must be able to migrate designs quickly tosmaller geometries.This, of course, opens a Pandora's box of intellectual property (IP) issues. Atpresent, an increasingly large number of suppliers is trying to home in onthe cell-based ICs, often going at the same application area/segment.Likewise, ASIC designers are a scarce and valuable commodity, and manyare changing companies, attracted by better offers. IP is arguably the singlemost valuable asset of an ASIC vendor, and a vendor will surely fight if itfeels its IP is being attacked or threatened by a competitor. It is almostinevitable that lawsuits will follow as rival suppliers fight to protect theirintellectual turf.For buyers, there are two types of IP nightmares:• The buyer suspects that the supplier is using the buyer's ASIC design tosupport a rival customer's solution.• The buyer accepts a design from a suppliers only to discover that thesupplier is being sued by a customer or rival vendor over IPinfringements.Unfortunately, the whole IP area is gray, with little legislation safeguardingthe parties involved. It seems that people on all sides are aware of the issues,but no firm solutions have yet been developed. It is something that buyersneed to become more aware of, because they will be the ones caught in thecrossfire. Knowledge is a weapon—^buyers should arm themselves.Other issues facing buyers are process related. A vital task is managing themigration to smaller geometries and ensuring that the optimal solution isachieved. Sexy new designs may be fun, but the workhorse volume designsin older geometries are still key.One trend that will become more mainstream is embedded SLI design.DRAM SLI and FPGA SLI will both become more and more established overSSPS-WW-DP-9706 ©1997 Dataquest June 9,1997
14 Semiconductor Supply and Pricing Worldwidethe next few years. However, these products are like Flash Gordon's "Mingthe Merciless" for ASIC vendors. Vendors must have an excellent handle ondesign issues and state-of-the-art manufacturing processes. If not, they willperish. Vendors must look at their suppliers' fab and process investmentroad map. Is it sufficient to ensure rapid technology adoption and to expandfor future business? What has its track record been on new designs andnewer geometries, and have there been many teething problems with yields?Is the supplier a leader or a follower?With ASICs, the buyer and supplier need a relationship of trust,understanding, respect, flexibility, and longevity. Product cycle times areshrinking, while more and more front-edge design work is being moved tothe suppliers. Suppliers must understand the buyers' systems andapplication markets, which means that buyers must feel able to trust theirsuppliers. The suppliers' cell libraries must be the right fit for the endmarkets, and suppliers must offer the best all-around total cost ofownership. The suppliers that succeed will be those that best meet the needsof buyers.<strong>DataQuest</strong>A Gartner Group CompanyFor More Information...Evelyn Cronin, Seruor Industry Analyst (408) 468-8075Internet addressevelyn.cronin@dataquest.comVia fax (408)954-1780Dataquest Interactivehttp://www.dataquest.comThe content of this report represents our interpretation and analysis of information generally available to thepublic or released by responsible individuals in the subject companies, but is not guaranteed as to accuracy orcompleteness. It does not contain material provided to us in confidence by our clients. Reproduction ordisclosure in whole or in part to other parties shall be made upon the written and express consent of Dataquest.©1997 Dataquest—Reproduction ProhibitedDataquest is a registered trademark of A.C. Nielsen Company
PerspectiveEmbedded IC UpdateSemiconductor Supply and Pricing WorldwideMarket AnalysisAbstract: This document analyzes the events in the embedded IC market from a user'sperspective, focusing on key products, suppliers, and the near-term direction of this criticalmarket. We examine both major microcontroller and ASIC sides of this market based on1996 shipment data.By Mark Giudici, Tom Stames, and Jordan SelbumVariety of Supply plus On-Board Memory Makes for a User Opportunity andChallengeThis document analyzes the developments of the embedded IC market(embedded microcomponents and embedded application-specific ICs, orASICs) from a market and supply base perspective. The following are somedefinitions that will be helpful in understanding this document better.• Microcontroller (MCU): An MCU is a MOS digital integrated circuitdesigned for standalone operation that includes a programmableprocessing unit, program memory, read/write data memory, and someinput/output capability. The processing unit contains an instructiondecoder, arithmetic logic unit (ALU), registers, and additional logic. TheMCU functions by fetching and executing instructions and manipulatingdata held in on-chip program and data memory (not including cachememories). MCU devices must be available with on-chip program ordata store. As an option, some MCU devices do not have on-chipmemory for use during the debug and development phase of the system.On-chip peripherals often assist in sophisticated input, output, andcontrol functions. The MCU category includes MCUs incorporating, ororiginating from, an ASIC design. Dataquest defines MCUs as notincluding digital signal processors. Pataquest divides MCUs into 4-bit, 8-DataquestProgram: Semiconductor Supply and Pricing WorldwideProduct Code: SSPS-WW-DP-9705Publication Date: June 2,1997Filing: Perspective(For Cross-Technology, file in the Semiconductor Devices and User Issues binder)
Microcontroller Market TrendsSemiconductor Supply and Pricing Worldwidebit, or 16-bit and greater word width. All MCUs are designed intoembedded applications. A similar term is microcomputer.• Word width: This is the width, in bits, of the on-chip integer unit. Thismeasurement is independent of the data bus width or any other busassociated with the device. The processor may operate on wider andnarrower data tj^es resulting with multiple passes through thearithmetic logic unit (ALU) or special hardware. Most microcontrollersare 4 bits, 8 bits, or 16 bits wide. A similar term is bit size.• System-level integration (SLI): This is often referred to as "system on achip." Dataquest defines SLI as: an integrated circuit that contains acompute engine, memory, and logic on a single chip and that has morethan 100,000 utilized gates. There are two types of SLI: ASICs andapplication-specific standard products (ASSPs, which are sold to morethan one user). This article will exaiiune the latest inclusion in thisprocess: embedding DRAM onto customized logic chips.• Embedded applications: All microcontrollers are in embeddedapplications. The designs of embedded applications withmicrocomponents always perform a fixed set of functions once thesystem ships from the manufacturer. Those functions typically define theend product. The system may be reconfigurable by the end user but notprogrammable by a high-level language such as BASIC or FORTRAN.Usually the end user would not even know what type of processor wasin the equipment. These products consist primarily of families such asthe 68HCxx and SOxx and NEC's and Toshiba's families, as well as,recently, an increasing number of ASIC offerings with embeddedmemory. Based on clients' interest level, this Perspective will focus onmicrocontrollers and the emerging SLI market.This document is divided into two sections plus a summary. The first sectionserves as an overview of the microcontroller market, noting market size, topsuppliers, and trends. The second section reviews the nascent SLI arena andthe trends developing that will affect users of this promising but potentiallyconfusing market. A summary section then will review this product segmentand note what users of these parts need in order to make the most of thesecost-effective product solutions.OverviewMCUs are the second of four primary categories of microcomponentsemiconductors. We analyze trends in the marketplace, along with theconditions that will influence their outcome.Microcontrollers had a banner year in 1995, growing over 35 percent. ForMCUs, 1996 has been a mixed bag. Each vendor has its own particularchallenges and timing, depending on its product mix and its nnarkets andcustomers. The year should close out with a 3.4 percent revenue growth formicrocontrollers, with some lagging continuing into 1997. Overall, Dataquestexpects microcontrollers to remain a strong, growing part of theSSPS-WW-DP-9705 ©1997 Dataquest June 2,1997
Semiconductor Supply and Pricing Worldwidemicrocomponent product mix with a growth rate returning to well over 20percent. In total revenue, 16-bit and larger MCUs will grow the most andshow the greatest change, but 8-bit MCUs will continue to dominate themarket well into the new millermium. If the players can tolerate the 1996flatness, real prosperity will return in short order. Watch for a $20 billionbusiness going out of the 20th century, with over 20 percent growth.The Future: What Does It Look Like?To see forward, it helps to know from whence one came. The year 1995 wassuch a boom year that in early 1996, everyone was simply looking up.Perhaps an occasional glance down might have revealed some unexpectedhazards. The phenomenal growth in the personal computer andcommunications industries outstripped suppliers' abilities to serve theircustomers' needs. Protecting their flanks and ignoring some basic businesstenets, customers overordered and developed backup procedures to coverany shortages. Excess inventory was easy to burn off, and pricing did notmatter as much as supply. Vendors worked feverishly to build andrecorifigure fab, assembly, and test facilities to improve capacity to supply aseemingly insatiable market. When the well-documented flood of unusedDRAM hit the market after PC sales slowed before Christmas, compoundeffects in the semiconductor supply and demand system turned the entireindustry upside down. OEMs found too many PCs in the channel and ontheir docks. They stopped ordering chips to build PCs they did not need tobuild. They pushed their subsystem suppliers to quit shipping the diskdrives, monitors, and sound cards they did not need. OEMs pushed theirsubsystem suppliers to slow down but to remain ready to ship more units ona moment's notice. Subsystem manufacturers did not want to hold too muchinventory, so they pushed back on their chip suppliers to ship fewer chipsbut to be ready to restart supply at any time.How did this affect microcontrollers? Other segments, spooked by the wellpublicizedevents in the data processing industry, took a reality check. Firstaffected were the applications in the data processing industry, someseverely. As the semiconductor industry went through its shrinking pains,Wall Stieet and other industries took note. As supply freed up, otherapplication segments became flush with incoming chips. Managementawakened to the dominoes falling in the data processing industry andrevamped its own purchasing policies. Management scrutinized charmelinventories, then made chip inventories leaner. Management then followedup by matching purchase orders more closely with declirung lead times, thenlistening carefully for vendors offering price decreases. Eventually, thedownturn affected all the segments because of fear, because of the balance ofsupply and demand, and because this really is a cyclical business.However, the most perplexing aspect of the business cycle of 1996 is that theglobal economy is still in very good health and electronic equipment ingeneral is still in pretty good demand. To date, there is no global recession,no mass of unemployed workers, no inadequate supply of money to borrow.The demand for the end eqxiipment still seems to be there. As a result of thecontinual steady demand, there has been an ever-increasing ntimber ofSSPS-WW-DP-9705 ©1997 Dataquest June 2,1997
Semiconductor Supply and Pricing Worldwidevendors coming into the microprocessor and microcontroller business. Itshigh growth and reported profits have attracted the attention of the stockmarket, captive and specialty semiconductor manufacturers, DRAMmanufacturers, reduced-instruction-set computing (RISC) vendors, and totalnewcomers. Existing MCU vendors add architectures between formerproduct lines to fill any cracks. Every one of these vendors targets a givenpiece of the pie. Although the pie grows from year to year, the targetedshares still add up to greater than 100 percent. As with any potentiallyoversupplied market, a thinning of the MCU supplier ranks (also known asa shakeout) is very possible as users decide about the long-termcompatibility and viability of their supply bases.Embedded Microprocessors Buck Trend of 1996Microcontrollers (a subset of embedded microprocessors) had their best yearever in 1995, grow^ing 36.4 percent in revenue and 18.7 percent in urutshipments. That was a hard year to beat, and 1996 did not do it. (Note that atthe time of this writing, the finalized microcontroller rankings were not yetcompleted.) In the larger 1996 progranrmiable embedded microprocessormarket, Motorola Inc. held its position as the No. 1 embeddedprogrammable microprocessor vendor, coming out at just an 18 percentmarket share (see Table 1). NEC lost a little more ground in its second-placeslot with a 13 percent share. Texas Instruments Inc., with its strong digitalsignal processor (DSP) presence, was a strong third-place runner in thiscategory, and Hitachi Ltd. was a close fourth place, thanks to big gairis in itsmicrocontroller-classed 32-bit RISC, the SH-1. Intel Corporation is in the topfive MCU vendors, mostly on the strength of its 16-bit i960 product line.Further down in overall MCUs, the 8051 contingent made some significantgains in market share, outpacing the total average. Oddly, the top fivevendors grew much less than the average for all MCUs, and the lowersegment of the supply base had much higher gains.Table 1Leading Embedded Programmable Microprocessor Vendors (Millions of Dollars)1996 Rank12345MotorolaNECTexas InstrumentsHitachiIntelOthersTotalSource: Dataquest (May 1997)1996 Revenue2,6371,84613581,3389676,56514,7111996 Market Share (%)There is no single formula for becoming a successful microcontroller vendor.At the time of this writing, the firtal shipment data by bit width for 1996 wasnot yet complete. Figure 1 illustrates the makeup of the top five 1995vendors' microcontrollers, looking at word width. Motorola clearly has adominant role in 8-bit MCUs, and neither Motorola nor Intel has 4-bit MCUs181399•7:mtmSSPS-WW-DP-9705 ©1997 Dataquest June 2,1997
Semiconductor Supply and Pricing Worldwideon the market. The Japanese companies, with almost a lock on 4-bit MCUs,have products in all three categories, and NEC looks to be the mostbalanced.Please note that data in this document is also in Dataquest's 1996Microcontroller Forecast (MCRO-WW-MT-9603, October 14,1996).Figure 1Word Width of Leading Microcontroller Vendors' Product Portfolioby RevenueMillions of DollarsH•^16-Bit-PlusS-Bit4-BitMotorola NEC Hitachi Mitsubishi Intel973631Source: Dataquest (May 1997)Microcontrollers with Embedded DRAM—The MCU Model toward SLICore processors and peripherals based on the 68000 will soon be availabletogether with dynamic random-access memory (DRAM) on the same pieceof silicon, ushering in a new era for integrated processors. The most popularembedded architecture will be freed from the constraints placed on theprimary component of the memory system that typically feeds it. This willallow the embedded application designers to further distinguish themselvesfrom the PC engineers. There are many interesting aspects of thiscombination of technologies, companies, and products that could change theway embedded application designers think about their system configuration.Typical Embedded System Design and Memory SelectionThe design of the traditional embedded electronic system involves choosinga microprocessor from the selection available in the architecture that bestaccommodates the particular type of product being built, be it a laser printer,a set-top box, or a palm-size communicator. Interfaces, inputs, and outputsdetermine the best combination of peripheral circuits that the new productSSPS-WW-DP-9705 ©1997 Dataquest June 2,1997
Semiconductor Supply and Pricing Worldwideuses. Some chosen might be: serial communications, parallel input/output(I/O), timers, or direct memory access (DMA) peripherals.The configured memory system must feed instructions into the processorand supply data to the programs at run time. The memory might consist ofsemiconductor products such as read-only memory (ROM) or might involvea disk drive in larger systems. Static random-access memory (SRAM) is usedfor the fastest parts of the memory system, especially in caches, but in mostsystems, the largest portion of semiconductor memory will be DRAM.DRAM has the best combination of low cost per bit with very good (but notthe best) performance. This allows a cost-effective product to be builtwithout a serious compromise in performance. Traditionally the largeDRAM memory has been a set of chips separate from the processor. Thisgives flexibility both to the system designer to select the appropriatequantity of memory for the application and to the vendors to optimize themanufacture of the processor independent of the manufacture of thememory chips. DRAMs consistently drive to put the greatest number of bitspossible on the chip at a particular price (that number now sits at 16Mb), andthis is not always the best for embedded applications. (Note that Mbindicates megabits and MB indicates megabytes of memory.)Use Of SRAMStatic RAM has the advantage of being significantly faster than DRAM (15nsversus 60ns), but it achieves this at a very high cost. On a standalone SRAM.chip, four transistors make up the typical SRAM memory cell; six transistorsmake up an SRAM cell processed on the same chip as logic circuits such asmicroprocessors. But just a single transistor makes up the DRAM cell in aDRAM chip—a fourfold or sixfold improvement. The higher packing densityof DRAM drives its price advantage over SRAM.When memory is being added to processor chips, fast SRAM is attractive forcaches, primarily because it uses the same basic IC process lines as theprocessor logic. DRAM, on the other hand, strives so hard for ever-lowercost with its high density that it uses very different techniques through theproduction line than logic circuits. The large caches used by the highestperformanceRISC processors dedicate the majority of their die size to cachesthat range from 64KB to 128KB (512Kb to 1Mb). This may be large for SRAM,but it is small compared to available DRAM chips. If DRAM cells were used,the density of this memory could quadruple.These issues and topics of bandwidth, throughput, power consumption,traiismission line effects, pin count, reliability, and board space haveburdened the microprocessor designer as well as the embedded systemdesigner for years. The two main issues boil down to memory chiporgaruzation and the width of the processor-memory interface. If theprocessor and the DRAM could reside on the same piece of silicon, it wouldopen up many new possibilities in system design, improving both cost andperformance of the final system. Enter Mitsubishi.SSPS-WW-DP-9705 ©1997 Dataquest June 2,1997
Semiconductor Supply and Pricing WorldwideMitsubishi's DRAIVI and tlie First IVIPU with DRAIVI On-ChipMitsubishi has been a significant player in the DRAM memory market forsome years now. In 1995, it was the No. 9 supplier of DRAM to the worldwith over 5 percent market share. Mitsubishi now makes limited 64Mbextended data out (EDO) DRAM and looks for success in this nextgeneration of DRAMs, due out in production by late 1997 or early 1998.Mitsubishi has also been developing some exotic application-specificmemories, such as its CD-F A.M, (a blending of cache SRAM and DRAM),and 3D-RAM, which adds special acceleration hardware to the cache andDRAM to speed up video graphics operations.'Mitsubishi announced a product in March 1996 with a new RISC processordeeply embedded in a DRAM chip. The M32R/D contains a proprietary 32-bit RISC core with a 2KB cache memory and 2MB (16Mb) of DRAM on-chip.Data and instructions are transferred between the caches and the on-chipDRAM over a 128-bit-wide data bus at a rate up to 1 GB/sec. This eliminatesover 60 percent of the time it would take to make these accesses over a 32-bit-wide external bus. Transfers of 128 bits over an external 128-bit buswould be ludicrous in most systems today because of the high pin count,current spikes, and minimum memory configuration that would benecessary to accommodate them. However, when the M32R/D goes toexternal memory, it does so over a more economical 16-bit bus at moderaterates while allowing very fast transfers between the on-chip memories tokeep the processor well fed. This effectively gives the M32R/D a two-level(L2) cache, with the second level containing a whopping 2MB of data orinstructions.However, the M32R/D is a brand-new microprocessor architecture. Newprocessor architectures take a long time to establish themselves, and historyshows them to have a high failure rate. There are numerous issues ofsupport, documentation, knowledgeable programmers, interestedcustomers, legacy, and many other issues that can suffocate a newarchitecture in the highly competitive microprocessor world. Would anembedded system designer use the M32R/D even if it comes with the 2MBof DRAM on chip and is perfect for the specific application? The besttechnical solution does not always win the day (in fact, this happer« rarely).All those other issues come into play and often supersede the technicalmerits. The M32R/D appears to be gaining some special design-wins andhas demonstrated execution of the Java programming language but is arelatively tmknown architectxire. The well-thought-out design of theM32R/D takes advantage of its sizable on-chip DRAM, perhaps thebeginning of what system and chip designers should be considering in theirsystem layout.Mitsubishi made a second, very important achievement in developing theM32R/D. It made a DRAM cell that can be processed on the same wafer,with much the same steps, as a typical logic (ASIC or microprocessor, orMPU) production line. It is also as small as those that run in the fabs usuallydedicated to processing DRAM (for the same process geometries). This is avery valuable technology. DRAM, as a library element available toSSPS-WW-DP-9705 ©1997 Dataquest June 2,1997
Semiconductor Supply and Pricing Worldwidemicroprocessor, microcontroller, or customer-designed ASIC developers,operas a whole new world of opportunities. Maybe Motorola would beinterested in this.Motorola's Established 68000 FamilyMotorola's 68000 architecture is the leading microprocessor architecture forapplications outside DOS-based PCs. Last year, as in many years before, the68000 family was the No. 1 microprocessor architecture in embeddedapplications. In the embedded microprocessor world, among the mostcritical decision factors are the support products that help an OEM designthe microprocessor into its end products. The history and market share of amicroprocessor determines just how much support may be available,whether it is development tools and languages or simply the ability of theOEM to hire qualified programmers with an intimate knowledge of thearchitecture. Motorola's 68000 has a huge advantage here.Integrating microprocessors with a selection of peripheral circuits is anothercrucial factor for success in the embedded marketplace. Motorola has avariety of 68000 family-integrated processors to address a number ofmarkets. Motorola has refined the 68000 architecture for embeddedapplications and customization, culminating in its ColdFire family ofproducts. ColdFire processors will run most of the original 68000 familycode, but are streamlined to run it much faster. Also, the ColdFire chipsintegrate peripherals along with the core processor. The fitting of the rightmatch of processor performance and peripherals to a particular application isone of the key differentiators in today's processor market, and Motorola'searlier 68300 products have a strong position there.One element missing from Motorola's and everyone else's bag of tricks forintegrated processors has been a good DRAM module. The problem hasbeen the mismatch in the silicon fabrication processes used for normalDRAMs and the process used for microprocessors. Maybe Motorola shouldtalk to Mitsubishi.Two Companies Engage to Get Things Really RollingMitsubishi and Motorola got together in early 1996 to compare notes. InOctober, they announced their intention to work together to putmicroprocessor cores together with DRAM on a single chip. Motorola willgive its 68EC000 and the ColdFire core processors to Mitsubishi for use incustomer-specific ASICs. In return, Mitsubishi will give Motorola its logicprocessedDRAM technology for use in integrated microprocessors andASIC-type products, as well as giving Motorola access to its new M32Rprocessor core. Both companies will market products with the 68EC000,ColdFire, and M32R core processor integrated with a set of peripheralcircuits and an appropriate quantity of DRAM on a single piece of silicon. Asa result of the exchange, Mitsubishi may produce customer-specific devices,while Motorola may also produce standard products. This is an excitingengagement for both Mitsubishi and Motorola, as well as the industry. It willchange the way engineers design their electroruc products. Engineers notonly can get their hands on a processor and some peripherals, but they canSSPS-WW-DP-9705 ©1997 Dataquest June 2,1997
Semiconductor Supply and Pricing Worldwidealso bolt large (or small) quantities of DRAM onto their own unique chip—just the right size of DRAM. There are many advantages: fewer chips, fewersolder joints, smaller packages, lower power consumption, and less excess.They can also use their favorite processor architecture with all the familiarsupport and tools. With on-chip memory, there is much greater flexibility foradding or organizing the memory in the best way for the application,without doubling the cost as might happen with external DRAM. Despitethese good ideas, as of this writing, the two companies have yet to announceany specific product families to emanate from this agreement.The Power of Pins on the PackageDRAM MRUs have an advantage in power consumption as well as boardspace. An embedded processor dedicates a noticeable number of pins to I/O.Many of these piiis control the on-chip peripheral circuits on integratedprocessors and nucrocontroUers. As with a microcontroller, if external accessto memory is eliminated or minimized, then the number of pins on thepackage comes down. Even if the pins are there, they can share their timewith other functions (such as peripherals) or at least save power by not beingexercised. A bus used for accessing external peripherals would generally dojust fine with eight data pins and eight or 12 address lines—far fewer thanthe 32 plus 32 that usually get used by memory buses.Any time that electrical signals move from one chip to another, lots ofcurrent is used. It multiplies linearly as the number of signals increases andis worst when the signals must drive an array of chips, as is typical withmemories. A processor with enough on-chip DRAM does not need all theextra pins and power (and the resulting battery drain) required for externalmemory accesses.Nothing is free, of course. Having fewer pins can affect the testing of thesechips. As it is, all the tests typically done on DRAM would need to be doneon the embedded DRAM. Having fewer pins to access the DRAM couldslow the test procedure dramatically, and test time is extremely valuable(longer test time equals greater cost). Verification of all the functionality ofthe microprocessor and peripheral circuits also takes its share of test time.Overall, test time cotald be expected to be about the same as or slightlylonger than the sum of the time needed to test the standalone equivalentMPU and to test a similar-size DRAM.Embedded ASIC Trends toward the SLI GoalSingle-Chip Systems in the HomestretchThere is a strong and accelerating trend in the ASIC industry toward systemlevelintegration, that is, placing higher levels of the total systemfunctionality on a single chip. Starting in the early 1990s, the wideningavailability of processor cores such as the ARM and MIPS microprocessorsand the Oak DSP has made the first step to SLI a reality. Integration ofmixed-signal capability, including digital-to-analog (D/A) and analog-to-SSPS-WW-DP-9705 ©1997 Dataquest June 2,1997
10 Semiconductor Supply and Pricing Worldwidedigital (A/D) converters has reduced the system chip count further. The nextcandidate for widespread integration on an ASIC is single-transistormemory; with this embedded DRAM, the single-chip system becomes less ofa dreana and more of a soon-to-be realizable goal.Dataquest forecasts that ASICs containing embedded DRAM will accovmt forabout 12 percent of the ASIC market by the year 2001. Especially significantis that this segment contains some of the highest added value, and hence thehighest potential profit margin, designs, and these devices are going intosome of the highest-growth markets, such as graphics controllers and digitalvideo, among others.Leading SLI SuppliersMost semiconductor suppliers, regardless of whether they are standardproduct suppliers or ASIC suppliers, realize that there is a sizable marketemerging for systems on a single piece of silicon. The reality is that if acompany does not participate in this market in the near future in some form,the company will find it hard to compete in the semiconductor market in theyear 2000. Therefore, nearly all ASIC suppliers and standard productsuppliers have targeted this market for growth. Leading ASIC suppliers inthe 1996 market included the following:• LSI Logic• IBM• Lucent Technologies (AT&T)• VLSI Technology• NEC• Toshiba• Hewlett-Packard• Texas Instruments• MotorolaOther companies actively pursuing the SLI ASIC market with increasingrevenue include Fujitsu, Hitachi, Mitsubishi, Matsushita, AMS, GEC-Plessey,SGS-Thomson, Symbios, Samstmg, and LG Semicon.Most ASIC suppliers (including LSI Logic) also sell some SLI standardproducts built from past ASICs that have been proven winners. It is moredifficult for standard product suppliers that do not offer ASICs to compete inthe SLI market because they do not have as much experience in designmethodology and library reuse. Standard product suppliers, in many cases,use different foundries for each product and fine-tune the products to reducedie size, which is counterproductive in design rexise and causes increasedtime to market for next-generation products.Embedded DRAM TeclinologyThe conventional approach to system memory has placed small memorycaches on the logic chips (usually ASICs), with the much larger mainSSPS-WW-DP-9705 ©1997 Dataquest June 2,1997
Semiconductor Supply and Pricing Worldwide 11memory implemented in standalone DRAMs. The fundamental differencesbetween a silicon process optimized for logic and one optimized forDRAM—primarily an emphasis on interconnect technology versus capacitorconstruction—have prevented significant integration until recently. Todaywe are beginning to see a merger of logic and memory in something knownas embedded DRAM. This can be defined as a product that includes largeamounts (more than 100,000 gates) of random logic and single-transistor (IT)DRAM on a single chip.What Benefits Does Embedded DRAM Bring?Most of the advantages to bringing system memory on-chip are quitestraightforward. In brief, embedded DRAM allows the following:• Fewer discrete components, hence less printed circuit board (PCB) area,higher reliability, and lower assembly costs• Potentially lower parts cost, particularly if the logic design is I/O-linuted(that is, there is some unused silicon area in the die core); note that theoverall pin count also decreases by eliminating wide memory buses• Higher performance through direct access to the DRAM iristead ofthrough I/O pairs and PCB traces• Lower bit-usage requirement through the finer granvilarity of embeddedmemory• Higher performance through system architecture optimization—forexample, very wide memory buses such as 256 bits, 512 bits, or even1,024 bitsEmbedded DRAIM ImplementationThere are two approaches to embedding single-transistor DRAM into anASIC. Starting with a logic-optimized process, vendors such as Samsungincorporate IT DRAM through a quasi-merged logic/memory process. Thisattempts to preserve logic density and performance but does result in lesssomewhat lower memory density. Conversely, most vendors start with amemory process to embed DRAM into an ASIC. At present, there are twoways in which this can be accomplished, differing in the maimer in whichthe charge-storage device is built: stacked capacitor or trench capacitor.Table 2 shows the current state of the art for embedded DRAM andrepresents the memory technology available in the 0.25-micron generation ofASICs. (All references to gate geometry refer to the drawn gate length of thetransistor.)The current state of the art for embedded DRAM within ASICs is that theseproducts will begin prototype production in the latter half of 1997, with fullproduction beginning to ramp in mid-1998. Products using the enablingembedded memory technology through the 0.18-micron generation will beintroduced in 1998, with full production begiiming in 1999. Dataquestforecasts the that 0.18-micron generation will become the mainstream ASICtechnology starting in 2000 and 2001.SSPS-WW-DP-9705 ©1997 Dataquest June 2,1997
12 Semiconductor Supply and Pricing WorldwideAlternatives to Embedded DRAMIn addition to the embedded DRAM solution discussed earlier, there areother memory alternatives for integration with logic. The primary ones are:• Static RAM• Three-transistor DRAM• Standalone DRAM• Packaging solutions, such as multichip modulesEmbedded Memory PlayersTable 3 shows a sample of ASIC supplier strategies for bringing systemmemory onto the logic chip. Virtually all of the leading ASIC vendors haveeither already announced support for embedded IT DRAM or are exploringthe concept and technology.Table 2Embedded Memory ComparisonMaximum On-Chip MemoryLogic DensityMaximum Memory PerformancePower Consxunption1Mb Approximate Area(0.25-Micron Generation)Note: +++ shows best performance; - shows worst.Source: Dataquest (April 1997)StackedCapacitorDRAM Process+++++-a.2.5 mm^TrenchCapacitor+++++-++2.5 mm^Logic Process3TDRAM 6TSRAM+-+++++++++++++16 mm^ 24 mm^Table 3Representative ASIC Vendors' Memory OfferingsNECLSI LogicFujitsuToshibaLucent TechnologyTexas InstrumentsIBMVLSI TechnologySamsungSource: Dataquest (April 1997)StackedCapacitorXXXXTrenchCapacitorX3TDRAMXXX6T SRAMXXXXXXXXXSSPS-WW-DP-9705 ©1997 Dataquest June 2,1997
Semiconductor Supply and Pricing Worldwide 13_Embedded DRAM ForecastForecast for 1997 to 2001Table 4 shows the five-year forecast for embedded DRAM by application.The expected year 2000 revenue of over $4 billion shows 40-times growthfrom 1997. Although this is a very rapid ramp, this growth reflects thestrength of the SLI trend, and the revenue still represents only about 4percent of the total standalone DRAM forecast.Table 4Worldwide Embedded DRAM ASIC/ASSP Revenue Forecast by Application(Millions of Dollars)19971998199920002001Graphics Controllers601605801,3802,100Disk Drives5903501,0501,700Digital Video1050140390650Networking351204601,1601,900Other Applications0401504801,400Total Embedded DRAM1104601,6804,4607,750Source: Dataquest (April 1997)Three applications dominate the growth of the embedded DRAM market:graphics controllers, disk drive controllers, and networking (LAN/WANhubs and switches). These three markets will account for almost 75 percentof the total in 2000.Dataquest PerspectiveThe embedded IC arena offers many attributes to a large segment of thesemiconductor user community. These products, while often used bycomputer companies, have one of the broadest application bases in the totalIC market. Telecommunications, industrial, consumer, automotive, medical,and even PCs increasingly use embedded ICs as a cost-effective, oftencustom, product solution. The economies of scale and reliability of knownMPU cores, combined with ever-increasing options of I/O, memory and bitwidth, allow for greater flexibility in solving system performance issues.From the more customized ASIC perspective, embedded memory coreswithin logic cells or gates offer both promise and perplexity—the benefits ofcombining the two are well-known, but the road to those benefits is still a bitbumpy. Soxurcing an MCU is much like sotucing an ASIC. The potential userhas the most flexibility and leverage before making the sourdng decisionbecause the outcome often results in a sole-sourced part. Maintainingflexibility in using multiple chip designs and opting for system migrationpath plans that use modifications or integration of existing chip designsoften help in lowering the total cost of the system.SSPS-WW-DP-9705 ©1997 Dataquest June 2,1997
14 Semiconductor Supply and Pricing WorldwideJust as embedded microprocessors represented a quantum leap in ASICcapability, embedded DRAM brings system-level integration one giant stepcloser to fulfillment. Although the technology enabling practical embeddedDRAM is relatively recent and some technical trade-offs and questionsremain, clearly this is a market poised for explosive growth. Many of theapplication areas with the highest growth potential, such as graphicscontrollers, require this technology to fulfill that growth. Within a few years,embedded DRAM will Join processor cores as part of the technologyportfoliorequired of an ASIC vendor in pursuit of high-end business.The embedded DRAM scenario is somewhat similar to that of embedded 6TSRAM. ASICs used SRAM in the early 1990s. Today, seven years later, amajority of ASICs (and virtually all of the SLI designs) contain some 6TSRAM. Embedded DRAM will see a ramp at least as fast as that of SRAM asthe demand for memory bits continues to skyrocket. Although embeddedDRAM is clearly going to have a profound influence on the ASIC industry,the standalone DRAM industry should remain relatively untouched by thistrend over the next five years.Looking qualitatively beyond 2001, Dataquest sees continued strong growthfor embedded DRAMs—to the point at which a majority of SLI ASICs andASSPs will contain some amount of embedded IT memory. Evenprogrammable logic is likely to embrace this technology beyond 2001 in theform of large fixed memory blocks. MCU and embedded DRAMarrangements—^breakthroughs like the Motorola-Mitsubishi deal—^willincrease the expansion of DRAM into the standardized controller market,opening up a design/performance/cost bottleneck. For users, cooperationbetween the design and procurement groups before the part is designed inwill ensure that both the best technical and sourcing solutions are made.DataoyestA Gartner Group CompanyFor More Information...Mark Giudici, Director and Principal Analyst (408) 468-8258Internet addressmark.giudici@dataquest.comVia fax (408)954-1780Dataquest Interactivehttp://www.dataquest.comThe content of this report represents our interpretation and analysis of information generally available to thepublic or released by responsible individuals in the subject companies, but is not guaranteed as to accuracy orcompleteness. It does not contain material provided to us in confidence by our clients. Reproduction ordisclosure in whole or in part to other parties shall be made upon the written and express consent of Dataquest.©1997 Dataquest—Reproduction ProhibitedDataquest is a registered trademark of A.C. Nielsen Company
jPerspectiveSemiconductor Supply and Pricing WorldwideMarket AnalysisSecond Quarter 1997 Procurement Pulse:Order Rates Flatten, Lead Times and Inventories Rise, and SpotPrices Exceed Contract PricesAbstract: The Procurement Pulse is a quarterly update (with interval updates, if eventswarrant) of critical issues and market trends based on surveys of semiconductorprocurement managers in the North American region. Besides order rate, lead time, andinventory information, this survey also notes price status by semiconductor product familyand package type, as well as key problems facing semiconductor users.By Mark GiudiciSemiconductor Order Rate Expected to Bounce Back after Two Months ofCautious ForecastsnOoLU_JAs seen in Section A of Figure 1, the outlook for semiconductor orderactivity has picked up since our last report and is expected to level off in thenear term. While flat with March's forecast index, the outlook for April hashistorically shown where the market heads for the rest of the year, as orderrates and inventory levels generally stabilize. This flattening of the order ratemay in part be because of some short-term upturns in DRAM pricing notedfor the first time in over 16 months. The overall sample continues to see price^; cuts for larger-volume contracts in all areas tracked in this survey—LUmicroprocessors (MPUs), logic, flash memory, and SRAM (except for someDDRAMs). DRAM pricing for the overall sample actually rose an average ofTNi4.4 percent in March after an unchanged price picture in February. The^computer subset of the respondents saw a smaller rise of 2.8 percent inDRAM prices after unchanged prices noted in February. While overall pricescontinue to decline, except for DRAM, in the near term, thin small-outlineLU_J
, •,' ' - - • :Semiconductor Supply and Pricing Worldwidepackages (TSOPs) and ball grid arrays (EGAs) continue to earn premiums of5 to 10 percent over more standard package offerings.IFigure 1Semiconductor SupplySection AAveraged Monthly Semiconductor OrdersOrder Index, 12/88 = 100bUU-f~500-400- n 3• ; ; ' '300- .:i-; PI::';;•V'••'•:vr200- ;.';i:;;••••;;:100-• • : :n_-=:9/9f T 0/9( TT::;1/9612/9( 3 1191 T !/97 1 /97 T3 1 31' 24 t/97Fl1 ';::,:i'•' -11Dollars7/3/96Section BSpot lUlarket vs. Contract Prices(1IVIBX16E0ODRAIUI)Spot Low Spot Higti Contract9/4/96 11/6/96 1/29/97 4/4/97Weeks16-15-14-13-12-11-10-9-8-7Section CAveraged Semiconductor Lead Times1 1 1 1 19/96 10/96 11/96 12/96 1/97 2/97 3/97•EstimatedSource: Dataquest (April 1997)Days251520-10-5-Section DActual vs. Target Inventory Levels(All OEMs)JDverCurrent ActualTargeti 1 1 1 19/96 10/96 11/96 12/96 1/97 2/97 3/97973087Spot Market and Contract Prices Cross PathsIn response to client requests, we have added a new graph to theProcurement Pulse. In addition to the spot market prices provided every weekin Dataquest's Semiconductor DQ Monday Report, we provide Section B tohighlight how contract lMbxl6 DRAM prices compare with spot prices.Although overall demand for semiconductors remains strong, it appears thatselected DRAM suppliers have curtailed production or shipments (or both)to stay the tide of DRAM price decline. In the near term, the spot market hasreacted with higher prices, while contractual buyers have not noticed thismanaged market tactic. As noted over the past year, we expect continuedvolatility, with spot market prices vacillating around declining contractSSPS-WW-DP-9704 ©1997 Dataquest April 21,1997
Semiconductor Supply and Pricing Worldwideprices, causing uncertainty for some buyers. The overall trend, however, isfor continued good availability, consistently declining contract prices, andlow (eight- to 10-week) lead times for the next six to nine months for contractbuyers.Lead Times for Semiconductors Mear tlie 10-Weei( iViarlcSection C highlights that the average lead time for respondents in Marchjumped to 9.9 weeks, compared with a 6.4 week average noted in February.The relative instability of lead times is in part because of the perceiveduncertainty of DRAM supplies despite overall good availability of everyother semiconductor product segment. The acknowledgment by both buyersand suppliers that 1996-style price cuts and availability are now history isencouraging some prudence among overzealous spot buyers, makingcontracted deliveries increasingly attractive. Good service levels combinedwith slowly declining prices are cementing many long-term supplierrelationships. Of the entire sample, over 40 percent noted some problemwith DRAM, but that was the only product area. The other semiconductorproducts enjoy good availability and reasonable pricing. Last quarter, overhalf of the respondents noted price fluctuations/inventory adjustments andend-of-life ordering as the key issues. This month, close to half of therespondents noted only DRAM availability as the main issue.Semiconductor Inventories Bacic to Historical LevelsDataquest PerspectiveSection D highlights how inventories continue to overshoot targeted levelsand closely track target direction. As respondents forecast semiconductororder rates to flatten, as noted earlier, we see a corresponding slight increasein inventory levels—primarily in DRAMs to offset any near-term real orperceived price increases. The overall targeted and actual semiconductorinventory levels for March were 15.6 days and 18.4 days, respectively,compared with February's 10.0-day and 11.2-day inventory levels. While notshown, the computer subset again appears more aggressive than theaverage, with current target and actual inventory levels of 12.0 days and 16.3days. We continue to expect to see stabilized inventory levels in the future inline with system sales levels.Availability of semiconductors remains very good to excellent (despiteDRAM market manipulations) and we expect it to remain this way for therest of 1997. Contiact prices continue to decline, despite the efforts of somememory suppliers to curtail output, and lead times have stabilized to meetcustomer demand. Even with the current increases in the DRAM spotmarket, the volume of business through this channel remains surprisinglylow. This reflects the continued user focus on total cost, not price alone,when determining a component buy. Dataquest continues to forecast steady1997 growth rates for PCs and other electronics relative to 1996, with theoverall trend following an upward growth slope. User semiconductorSSPS-WW-DP-9704 ©1997 Dataquest April 21,1997
Semiconductor Supply and Pricing Worldwideinventory levels are now in line with user demand, and we expect to seecontinual balance in these indexes in the near future. Real allocations are nota problem, but the near-term DRAM issue may well play itself out, forcing aquicker shift to 64Mb DRAMs if enough suppliers can come up with parts.At this time, this scenario is possible but not highly probable. Dataquestexpects to see excellent semiconductor availability through the end of 1997.DRAM and MPU price elasticity to date have not propped up contractprices. While DRAM spot market prices have crossed contract prices on theupward path, the overall DRAM capacity situation will force supplierssooner or later to release inventory or wafer starts because of economicnecessity. The good news for users is that overall declining contract priceswill continue to be with us for the rest of this year.DataquestA Gartner Group CompanyFor More Information...Mark Giudici, Director and Principal Analyst (408) 468-8258Internet addressmark.giudici@dataquest.comVia fax (408)954-1780Dataquest Interactivehttp://www.dataquest.comThe content of this report represents our interpretation and analysis of information generally available to thepublic or released by resporisible individuals in the subject companies, but is not guaranteed as to accuracy orcompleteness. It does not contain material provided to us in confidence by our clients. Reproduction ordisclosure in whole or in part to other parties shall be made upon the written and express consent of Dataquest.©1997 Dataquest—Reproduction ProhibitedDataquest is a registered trademark of A.C. Nielsen Company
iPerspectiveSemiconductor Supply and Pricing WorldwideMarket AnalysisSecond Quarter 1997 Quarterly Price Survey HighlightsGeneral Market CharacteristicsAbstract: Dataquest has completed the second quarter 1997 North American contract pricingsurvey for the semiconductors tracked. This Perspective analyzes the main signals seen, bothoverall and by main family type, and their impact on contract buyers worldwide.By Evelyn CroninThe main signals: Oversupply is set to continue, but the dawning of a periodof relative price stability for DRAM has begun.This period of price stability is greatly aided by the public announcementsfrom certain vendors of DRAM production cutbacks. This new age of DRAMprice stability is significant for all buyers, even those who do not purchasethis commodity. As DRAM is an extremely large chunk of overallsemiconductor revenue, price stability has a positive impact on the revenueof the whole segment. This should translate into a less turbulent year forboth unit DRAM devices and Wall Street share prices in the technologysegment.>0-OLLlU-Z)NZUJ-J
Semiconductor Supply and Pricing Worldwideguarantee the buyer access to leading-edge product in a timely fashion. Thebuyer's company can use this to differentiate its products and to stay at thecutting edge. However, not all DRAM bought will be leading-edge stuff—the bulk will be standard, current product. It is here that the standardpartners shine. These suppliers can be used to obtain the most attractive(lowest) price possible on high-volume standard devices. This suppliermanagement model is equally valid for other multisourced product.For non-DRAM devices, however, opportunities for good price reductionscontinue to exist. On all (save MPUs), there is a fair selection of productsources all competing for a slice of the same demand pie. This means that1997 is set to be another "Year of the Buyer."Based on the trends seen in Dataquest's North American Second Quarter 1997Price Outlook, we have extracted key points.DRAMThe key points to remember about DRAM are:• Fast page mode (FPM) will become more expensive than extended dataout (EDO) by the second half of 1997 as production decreases because ofthe market transition.• The price flattening tiend will continue on all asynchronous devices—price reductions will be minimal for 1997 and 1998.• Long term, prices on 4Mb and 16Mb are set to increase as these devicesmove to the decline stage of the life cycle and suppliers scale backproduction.• Reference pricing for Korean and Japanese suppliers is set to bereintioduced by the European Union, which will further impact sellingand buying strategies there.• Synchronous product is being targeted at a certain segment veryaggressively.• However, for sjmchronous DRAM, 64Mb will be the density of choice—this is going to be far more price competitive per megabyte than the16Mb SDRAM. Also, 64Mb SDRAM will ramp down in price faster than64Mb EDO.• Currently, there is no real adder for dual in-line memory modules(DIMMs) over single in-line memory modules (SIMMs). Any pricedifference is because of pricing strategies on chips.SRAMThe key points about SRAM are:• Starting early in 1998, x4 and x8 64Kb and x4 256Kb will be in the end-oflifestage from many suppliers.SSPS-WW-DP-9703 ©1997 Dataquest March 17,1997
I.• Semiconductor Supply and Pricing WorldwideFor x8 256Kb and x32 1Mb cache devices, lead time polarization fromsuppliers will occur. Some clearly want out of this cutthroat segment andhave adjusted lead times up to nearly five months to dissuadecustomers.Overall, prices are still in decline for higher-density devices as costs permegabyte for the chips decrease.FlashThe key points about flash are:• Lead times are pretty much unchanged this quarter, with one notableexception!• 5V and 3V crossover starts to occur with 8Mb in the third quarter; otherswill follow^.• By the begiruiing of 1998, price parity will exist for 4Mb and above flashdensities, irrespective of voltage.• Moderate price reductions are forecast below 4Mb, with the mostaggressive price reductions forecast for the 4Mb, 8Mb, and 16Mbdensities.• Long-term pricing shows more stabilization.MicroprocessorsThe key points to remember about MPUs are:• Intel is decreasing prices on selected Pentiums fairly aggressively in adeliberate bid to influence fourth quarter 1997 PC buying trends.• Intel's Pentium MMX has launched, and the pricing is very attractive inthe second half of 1997, especially at 166 MHz.• Not to be outdone, the PowerPC camp is coming out very strongly withthe 604 processor family, which offers quite an attractiveprice/performance curve.ASICsThe key points to remember about ASICs are:• One-micron technology is moving quickly to production-only statusfrom many ASIC houses—that is to say, they have a policy of no newdesigns in this technology but will continue to manufacture existingdesigns.• Generally, midrange gate count solutions are cheaper in gate arrays.However, for higher gate covmts, cell-based ICs (CBICs) are usually a farmore cost-effective solution.SSPS-WW-DP-9703 ©1997 Dataquest March 17,1997
Dataquest PerspectiveSemiconductor Supply and Pricing WorldwideUnder-10,000-gate designs are being served by the variety of FPGA/PLDproviders, each with its own standard.Pressure to gain business has pushed prototype lead times down frommost suppliers. However, these lead times are usually less for gate arraysolutions.All in all, 1997 looks like it will continue to be a challenging year. All deviceswill continue to be in oversupply, albeit to a lesser degree than in 1996. Thelevel of oversupply is related to device family. However, with numeroustechnology transitions due this year, there may well be short-term supplyconstraints from some vendors. But these will right themselves quickly.There are many opportunities for reducing total cost of ownership that thesavvy buyer can make happen. However, particularly with DRAM andSRAM, some suppliers suffered badly in 1996, forced to sell below cost, insome cases. Thus, these vendors cannot continue to deliver the same stellarprice reductions in 1997—this year will be more controlled.Also, many DRAM vendors are starting to remove their focus fromnoncontract selling channels. Although this definitely does not put DRAMback on allocation, it does mean that spot markets, among others, may notoffer any price advantage this year. As of this writing, spot market prices areback up to contiact levels and may exceed contract prices in the futurebecause of the previously mentioned supply shift. Of all DRAM saleschannels, contract buyers will be the least affected. DRAM manufacturerswill continue to emphasize the contract channel and may well return to longtermpartnership-type purchasing with key customers.DataquestA Gartner Group CompanyFor More Information...Evelyn Cronin, Seruor Industa-y Analyst (408) 468-8075Internet addressevelyn.cronin@dataquest.comVia fax (408)954-1780The content of this report represents our interpretation and analysis of information generally available to thepublic or released by responsible individuals in the subject companies, but is not guaranteed as to accuracy orcompleteness. It does not contain material provided to us in confidence by our clients. Reproduction ordisclosure in whole or in part to other parties shall be made upon the written and express consent of Dataquest.©1997 Dataquest—Reproduction ProhibitedDataquest is a registered trademark of A.C. Nielsen Company
PerspectiveSemiconductor Supply and Pricing WorldwideMarket Analysis1997 Semiconductor Cost Model UpdateAbstract: This Perspective updates the Dataquest semiconductor cost model and ICpackage cost table. Detailed examples of the 16Mb and next-generation 64Mb DRAM costmodels that use the latest cost variables folloiv a brief revieiv of the model's description.By Mark Giudici3NZ.. LUQ:
Semiconductor Supply and Pricing WorldwideCost Model ApplicationsSemiconductor cost models are predominantly used to compile costs foruse in near-term contract negotiations. By identifying cost reduction areas,price negotiation results often benefit the parts buyer. Applying experiencecurvetheory to cost model applications can give both short- and long-termcost/price scenarios that can be a basis for strategic planning.Strategic use of cost models in long-range planning has been underutilizedbecause of the indirect influence of cost over price as the time horizonexpands. Some users apply different learning curves to individual variablesin the model in combination with price forecast analysis. In this way onecan better understand future trends and have alternate strategies at hand ifany variable actually differs from its expected trend line. We suggest thisuse of cost modeling as a part of a proactive strategic procurement plan.Cost versus PriceIn a competitive market, semiconductor manufacturers pass cost reductionson to their customers. Therefore, a knowledge of semiconductor costs andcost trends is useful for projecting long-term procurement costs and selectingthe most cost-effective semiconductor device for a particularapplication.The cost/price relationship for semiconductor products varies from: productto product, company to company, and with time, as a function of businessconditions. One way to perform cost/price to analysis is to monitorprices and costs over a period of several years for selected product typesand identify the average gross margin for these types. By using this procedure,semiconductor users can develop a good feel for the cost/pricerelationship for the semiconductor products they buy.Cost FactorsAs mentioned above, the key factors affecting the cost of a finished semiconductordevice are the semiconductor process, wafer size, die size, sortyield, package type, and final test yield. The cost of a semiconductor incrementallyincreases by adding the cost of each step in the manufacturingprocess to the finished product. Figure 1 illustrates the typical manufacturingprocess flow for semiconductor devices. Our cost model categorizescosts into the following four areas:• Wafer processing and die sort• Assembly• Final test• Screening, qualification, mark, pack, and shipSSPS-WW-DP-9702 ©1997 Dataquest March 3,1997
Semiconductor Supply and Pricing WorldwideFigure 1Commercial and MIL-STD Manufacturing FlowCommercialStandardProductSilicon WaferMilitary 201OEClass BPracessed WaferXXCommarcial Wafer PrabeWafer Sort 100%ICommercial Visual InspectiorfIScribe and AssemblyICommercial Visual InspectionSealIn-HouseSpecificationsPlasticPackagePlasticMoldVisual SortIAssembly inHermetic Package24-Hour 150°C Bake10 Temp. Cycles ConstantAcceleration 30K Gs,Fine and Gross l^akMilitaryMilitaryClass SBake 6 Hours 150°CRnal Test~\Final Visual InspectionIIWark, Pack, ShipCommercialLimitsElectrical 25°CGo/No Go TestXBum-in 160 HoursI25°C DC Electncals5% PDAClass BClass BClass B125°C and -55°C DC Screenand 25°C AC ScreenClass B' Key Cost PointsIExternal VisualMilitarySource: Dataquest (Marcfi 1997)The manufacturing process begins with a raw, unprocessed silicon waferthat costs from under $15 (100 mm wafer) to approximately $120 (200mmwafer). After completing more than 100 processing steps, the cost of a processedwafer is 10 to 30 times the initial cost of the unprocessed wafer. Thewafer cost is a function of the following:• The relative complexity and maturity of the IC process/lithography• The number of masks• The photolithographic requirements of the process used• The clean room environment required by the processA complex relationship exists for each of these elements with the end costof the product. Some of these interacting relationships involve the depreciationschedule of a fabrication plant (that is, $500 million to $1 billion fab costSSPS-WW-DP-9702 ©1997 Dataquest March 3,1997
Semiconductor Supply and Pricing Worldwideover a five-year period) in relation to wafer output, process learning curveswithin a fab, back-end test cost amortization, and royalty payments (ifrequired) by process or device type.The cost of a wafer increases with each layer required. Additional mask layerscould introduce more defects and decrease yields. In general, more complexprocesses produce more expensive die. Table 1 lists the typical numberof mask layers for most common integrated circuit processes.Wafer costs increase as device features become smaller. However, smallerfeatures result in more die per wafer. Although the wafer cost will behigher, the cost per function per chip because of the increased density oftenwill be lower.The class of fab or clean room environment has a very large impact on thefinal cost of a semiconductor device. As device features become smaller,circuits become more susceptible to yield loss because of the particles in thefab environment (that is, a 0.5-micron particle would not be a major problemin a 1.0-micron fab line, while the same particle would be catastrophicin a 0.6-micron line).Table 1Number of IC Process Mask LayerPiocessSchottky TTLBipolar LinearECLNMOSHMOSCMOSHCMOSBiCMOSSource: Dataquest (March 1997)Single Layer Metal77 to 9889101114Multilayer Metal99 to 1110101112 to 1513 to 1616 to 20Package CostsThe type of packaging a semiconductor device uses often makes up a largeportion of the overall semiconductor cost. For example, going from aceramic to a plastic package using the same die often will reduce the manufacturingcost and related price by a factor of 2. Table 2 shows the latest costestimates for semiconductor packaging in 1997. This table highlights howdifferent packaging options can alter finished semiconductor pricing.Cost Model FormulaDataquest's semiconductor cost model uses the variables and algorithmsshown in Table 3 to estimate semiconductor costs. Because of the flexibilityof the model, a variety of semiconductor devices can be costed out dependingon many of the key variables noted earlier (that is, die size, wafer size,process, package, among others).SSPS-WW-DP-9702 ©1997 Dataquest I\/Iarch3,1997
COCO-•COI-•ICO~>lC3i>oTable 2Total (Die-Free) Assembled Package Cost, 1997 (Dollars per Package) Volume Production, More than@COCOoK.(Ucu—noCOCONo. ofPLru814161820222428324044485256646884100128132144160164169184196208225232240244256296299304308313FllllkRIP0.060.090.110.120.150.170.200.230.310.350.360.420.54CERDIP0.210.220.260.300.300.320.410.450.680.963J04.00Side-Braze1.251.651.651.802.102.552.853.403.954.956.20CeramicPGA4.905.106.207.909.5011.1011.0012.0012501150178518 7021.3036.20PlasticPGA1.202.453.503.704.204.555.907.107.809,509.60116511.3011.9013.1025.90PlasticcaiipCarrierPLCC0.190.190.230.290.330.420550,66CeramicChipCarrier(Leadless)LLCC0.901.001.101.201.301.501.702.302.452.703.103.753.904.BO5.30CeramicChipCarrier(Leaded)LCX1.151.201301.451.752.052.402.904.505.105.5022.1051.6051.2552.75mmSO]0.260.280.320.340.360.38SOIC0.060.100.120.140.160.210.120.230.350.42TSOPlypti0.180.180.270360.420.480.490350.65TSOP•I>peII0,540540.540.630.68SSOP0.210.370.43O.TS:1.08PlasticQUAD0.440.450.480.530.600.610.680.780.751.181.261.321.551.901.962.953.253.854.60TQFPl,4inmBody0.400.440.580.610.700.881.401.601.701.802.302.603.20TQFPImmBody^M0,72UIOCeramicQUAD5,226.129.4011.5013.8015.5017.4021,1027.7031.20MeQUA334446789
COCOT3COTable 2 (Continued)Total (Die-Free) Assembled Package Cost, 1997 (Dollars per Package) Volume Production, More thanOT3IU3•vlC3r\3No. ofPbu32434DFlistlcDIPCERDIPSide-BrazeCeramicPGA50.10PlasticPGAPlasticChipCarrierPLCCCeramicdiipCarrier(Leadless)LLCCCeramicChipCarrier(Leaded)LCC132.00SO)SOICTSOPlypelTSOPType IISSOPPlasticQUADTQFP1.4iunBodyTQFP1mmBodyCeramicQUADMeQUA35236136849.5037651 JO38752.1044.4044244859.00475480@COCO•vjat504625672Package MaterialsLeadFranTELeadFonnWireC194THAuA42THAlA42THAl79.50A42THAu29.50CuAuJC151AuIA42/LDCCGull/NoneAlC194Gull/JAuCI 94Gull/JAuA42/CuGullAuA42/CuCuUAuCuCullAuCuGuUAuCuGullAlCuGullAlA42GullAl44GCALidEpcxyCeramicAu/KovarAu/KovarAu/EpoxyEpoxyAu/KovarEpoxyEpoxyEpoxyEpoxyEpoxyEpoxyEpoxyEpoxyAu/KovarAlcPreformNAGlassAu/SnAu/SnNANAAu/SnNANANANANANANANAAu/SnNNA = Not applicableSource: Dataquest (March 1997)DlCOCO•vl
Semiconductor Supply and Pricing WorldwideTable 3Semiconductor Cost Model Algorithms or VariablesSectionWafer SortWafer Size (Diameter ir\ inches)Capacity Utilization (%)Geometry (Microns)Processed Wafer Cost ($)Die area (Square Mils)Active Area FactorNumber of Masks ijype of Process)Defect Density per Square Inch/per MaskGross Die per WaferProcessed Wafer Cost per Gross Die ($)Test Cost per Hour ($)Wafers Tested per HourWafer Sort Cost per Gross Die ($)Cost per Gross Die at Wafer Sort ($)Wafer Sort Yield (%)Cost per Sorted Die ($)AssemblyMaterial Cost/Sorted Die + Package Cost ($)Number of Package PinsAssembly Yield (%)Cost per Assembled Die ($)Final TestTest Time per Die (Sec.)Cost per Hour of TestingTest Cost per Die ($)Final Test Yield (%)Cost per Final Tested Unit ($)Mark, Pack, and ShipCost at 99 Percent Yield (%)Total Fabrication Cost per Unit ($)Foreign Market Value (FMV) Formula AddersR&D Expense (15 Percent)S,G&A Expense (10 Percent)Profit (8 Percent)Constructed FMVAlgorithm or Variable=A=B=C=D=E=F=G=H=1 =(0.75*pi»(A/2)'^2*10^6)/E=J =(D/I)=K=L=l/((#»I)/3600)=M =(K/L)/I=N =Q+M)=0 =2.718^((-H*G)*E)=P =N*100/O=Q=R=S=T =(P+Q)/S*100=U=v=W =U»V/3600=x=Y =(T+W)/X»100=Z =(Y*0.01)=AA =Y+Z=AB =0.15*AA=AC =(AA+AB)»0.10=AD =(AA+AB+AC)*0.08=AE =(AA+AB+AC+AD)# = Test seconds per dieSource: Dataquest (March 1997)SSPS-WW-DP-9702 ©1997 Dataquest I\^arch3,1997
Semiconductor Supply and Pricing WorldwideUnderstanding YieldsOnly a portion of die on a given wafer will meet the electrical test specificationsto which the die was designed. The percentage of good die per waferis known as yield. As a silicon wafer is processed, each step decreases thefinal yield of good parts that meet specification and are shippable.Calculating YieldThere are several methods to calculate electrical test yields of semiconductorwafers. Dataquest uses a variant of the exponential equation called Murphy'sformula to approximate yield:Yield = e(-°A);where e is the constant 2.72, D is the defect density in defects per squareinch, and A is the area of the chip in square inches. This mathematical formulais useful for analyzing the key factors that affect semiconductoryields: the number of defects on the wafer and the number of chips on thewafer. The number of die per wafer is determined by the area of each chip.Defects on a wafer are caused by particles in the air falling on the wafer orprocess irregularities made during semiconductor manufacture. Anincrease in mask levels requires more time in the fab area, thus increasingthe chance of defects occurring either from the air or processing error.Yield Trade-OffsBy taking a typical 16Mb DRAM with two different die sizes (approximately112,000 square mils and 142,000 square mils) in two different manufacturingareas, one with five defects per square inch and the other with onedefect per square inch, one can easily see in Table 4 the advantages of usinga clean room with fewer particulates. This points out why it is more economicalto ship larger die if the fabrication area is cleaner, because more dieper wafer are shippable.Yield and Related CostsSemiconductor chips are electrically tested several times to separate die thatmeet specifications from those that do not. Wafer sort, assembly, and finaltest are the three areas in semiconductor manufacturing where relatedtesting occurs.Table 416Mb DRAM Yield Loss to Defects (Percentage Good Die/Number of Good Chips per8-Inch Wafer)Chip Size (Mils^)127,000110,000Yield with5 Defects/In. (%)252.956.9Good Die163203Yield withlDefecl/In.2 (%)Note: A cleaner fabrication area allows for more shippable product even if the die size is larger than In a "dirtier" area.Source: Dataquest (March 1997)87.889.4Fab AreaGood Die272320SSPS-WW-DP-9702 ©1997 Dataquest March 3.1997
Semiconductor Supply and Pricing WorldwideElectrical Wafer SortThe first test, electrical wafer sort, is done on processed wafers by a computer-basedtester at a test station specifically designed for that IC. Thetester automatically tests each die on the wafer by contacting each pad oneach chip and marking with an ink dot those dice that do not pass the test.Test costs consist of equipment operating costs, direct operator costs, andthe amount of time required to test each die. Equipment operating costs aredominated by the depreciation of the test equipment. Semiconductor testequipment is generally depreciated over three to five years and can range inprice from $350,000 to over $1 million, depending on test/product requirements.Data quest uses estimates of test costs per hour ranging from $25 to$125 per hour. The most complex integrated circuit test costs range from$65 to $125 per hour.Dataquest assumes that a test operator supports each piece of test equipmentand estimates the labor cost per hour to be $20. The total test cost then,including labor, ranges from $45 to $145 per hour.The time to test a wafer isdetermined by the circuit complexity, the number of chips per wafer, andthe yield. Good dice take about five times as long to test as bad dice. Testprograms are formulated and used to minimize test time by testing functionsof the device statistically proven to most Ukely fail first. Test times forgood dice are kept to a minimum by performing only those tests that assure85 to 90 percent test yield when packaged. Wafer sort times for full-productionVLSI chips take no longer than nine seconds for each chip.Assembly and PackagingSemiconductor chips in the form of processed and tested wafers are electricallyfunctional and could be used as they are. Functional die in wafer form,although theoretically functional, are too fragile unpackaged for practicaluse. In order to have a protective container for a device, various packagesare available to provide different devices with different degrees of ruggedness.Ranging from ceramic packages with gold contacts to blobs of epoxycovering chips on PC boards, the encapsulation method for electricallygood die is determined by the end use of the system that the part goes into.Packaging technology has continuously improved, but the basic assemblysteps have not changed significantly during the past 25 years. The threemain areas of assembly are the following:• Die separation• Die attach and lead/ball bond• EncapsulationDie SeparationThis step refers to the method of separating the individual die on a wafer.One technique is very similar to the method of cutting glass. A plastic filmis attached to the back of the wafer after which a diamond stylus automaticallyscratches the wafer between each die, both horizontal and vertical.Once the total wafer is scribed on these "scribe lines," the wafer is placed ona machine that fractures it along these lines. Some manufacturers use laserscribe machines to etch a line along the scribe line. Thick wafers requirediamond sawing (and commensurate wider scribe lines) in order to preventdie loss because of uncontrolled fractures.SSPS-WW-DP-9702 ©1997 Dataquest March 3,1997
10 Semiconductor Supply and Pricing WorldwideAfter the wafer is completely broken into individual die, each chip is visuallyinspected under a microscope to ensure removal of any that were physicallydamaged during the "slice and dice" procedure. Chips are alsoeliminated at this point if they do not conform to dimensional design rules.Good dice are separated and moved to the next step of manufacture, dieattach, and lead bond.Die Attach and Lead BondAssuming the use of a standard plastic Small Outline (SOJ)-lead package,good dice are attached to metal lead frames with a small amount of moltengold or low-cost epoxy. It is imperative that a die be securely attached tothe lead frame in order for it to withstand later testing requirements madeof the finished device. The next step is bonding the pads of the chip to individualleads of the package with either gold (becoming more rare) or aluminumwire that is less than 1 thousandth of an inch in diameter.Therm ocompression bonding involves heating the lead frame and attacheddie to about 340° C. The bonding wire is automatically pressed against thebonding pad on the heated die, fusing the wire to the die. The wire is thendrawn to its respective bonding pad on the lead frame, which is also thenfused. Automated bonding machines are capable of bonding more than1,500 packages per hour. Once the die is attached with bonded leads,another visual inspection is performed to eliminate devices that weredamaged or bonded incorrectly.EncapsulationAssembled lead frames for plastic SOJs are placed in molds into whichmolten epoxy plastic is injected, thus forming the body of the semiconductordevice. Between 20 and 50 packages are encapsulated at once, resultingin low production costs. The molded packages are then cured in a 200" Coven for 40 hours. Excess metal is then removed from the devices and theleads are formed to the finished product configuration. The parts are testedfor open or shorted circuits that might have resulted during encapsulation.The surviving packaged parts are now ready for final test.Final TestAfter the dice have been packaged, they vindergo one final test. Packagedparts are transferred from assembly to the final test area in static-free plastictubes or trays that are inserted into automated package handlers. The handlerreleases one packaged part at a time into a test socket or head that iswired to an automated test system. Most manufacturers use multiple-headtest systems to increase the throughput of a test system.Each unit is stringently tested at this step, across "worst case" conditions.The circuits are tested for maximum and minimum speeds, for power dissipation,and for many combinations of inputs and ou^uts in order to meetall guaranteed device specifications. The automated test system performsthousands of separate tests in seconds. A typical final test by the manufacturerruns from less than one second for a TTL logic device to up to 10seconds for some 16Mb DRAMs.SSPS-WW-DP-9702 ©1997 Dataquest March 3,1997
Semiconductor Supply and Pricing Worldwide 11Cost Model ExamplesThe final test must be stringent enough to ensure that the device performsover its guaranteed temperature range. The environmental conditions areusually ensured in one of the following two ways:• All devices are tested at the high temperature end of the specifications.• The devices are tested at room temperature over sufficiently wide tolerances(guard bands) so that operation at the temperature extremes isensured.The first approach is obviously the safer (more conservative) method, butit is also much more expensive. As a result, most semiconductor supplierswill correlate the room temperature characteristics with the characteristicsat temperature extremes, add a safety guard band to the room temperaturetest parameters, and then test at room temperature. Samples are regularlytaken from the production lots and tested across the full range of environmentalconditions to ensure that the correlation parameters are accurate.The functions of wafer sort and the final test correlate very closely. Oftenboth tests are performed in the same room and/or on the same testmachine; the chief difference is the test program. One of the main functionsof the wafer sort program is to minimize the amount of additional laborand materials that would be assigned in producing bad ICs.Wafer sort cannot eliminate all potentially defective dice, however,because:• Most sophisticated circuits carmot completely be tested in wafer formbecause of parasitic effects resulting from probes and wiring, incidentroom light, and other factors involved with physically sorting the dice.• Some of the dice may be damaged during the assembly process.• The dice cannot be tested across the temperature range in wafer formbecause the wafer and probes cannot be easily maintained at temperaturesbelow ambient.The objective of wafer sort is to ensure that enough of the potentially rejectablechips are discarded so that final test yields will be high enough to supporta desired level of profitability. Excessively high final test yields are notnecessarily acceptable. This may mean that potentially good devices arebeing thrown away at wafer sort. As a result, many manufacturers willadjust the tightness of their internal wafer sort test to allow the final testyields to fall in the range of 80 to 90 percent good units.Tables 5 and 6 illustrate how cost models can highlight cost differentials ofdifferent DRAM densities. These models use best-case variables from informationgathered in press and trade articles and forecasts yield/costimprovements based on historical trends from previous products.The cost models illustrate how world-class manufacturers can experiencemanufacturing economies of scale as units ramp up in production volume.Comparing these models with actual market prices for the same timeperiod is useful in learning where a given supplier stands concerningtechnology and production efficiency.SSPS-WW-DP-9702 ©1997 Dataquest March 3,1997
12 Semiconductor Supply and Pricing WorldwideTable 516Mb DRAM Cost Model1996199719982000Wafer SortWafer Size (Diameter in inches)8888Capacity Utilization (%)100.00100.00100.00100.00Geometry (Microns)0.600.500.400.35Processed Wafer Cost ($)1550155016501650Die Area (Square Mils)112000896008064072576Active Area Factor1.001.001.001.00Number of Masks16161818Defect Density per Square Inch0.1250.0630.0560.056Gross Die per Wafer359449499554Processed Wafer Cost per Gross Die ($)4.323.453.312.98Test Cost per Hour ($)110.00110.00110.00110.00Wafers Tested per Hour0.110.100.100.11Wafer Sort Cost per Gross Die ($)2.752.442.141.83Cost per Gross Die at Wafer Sort ($)7.075.905.454.81Wafer Sort Yield (%)80919293Cost per Sorted Die ($)8.846.455.915.17AssemblyMaterial Cost/Sorted Die—SOJ pkg.($)0.340.340.340.34Number of Pins28282828Assembly Yield (%)99999999Cost per Assembled Die ($)9.276.866.315.57Final TestTest Time per Die (sec.)15.0015.0015.0010.00Cost per Hour of Testing ($)90.0090.0090.0090.00Test Cost per Die ($)0.380.380.380.25Final Test Yield (%)95959898Cost per Final Tested Unit ($)10.167.626.825.94"Mark, Pack, and Ship"Cost at 99% Yield (%)0.100.080.070.06Total Fabricated Cost per Net Unit ($)10.267.696.896.00FMV Formula AddersR&D Expense (15%)1.541.151.030.90SG&A Expense (10%)1.180.880.790.69Profit (8%)1.040.780.700.61Constructed Foreign Market Value (FMV)14.0210.519.418.19Source: Dataquest (March 1997)SSPS-WW-DP-9702 ©1997 Dataquest I\/Iarch3,1997
Semiconductor Supply and Pricing Worldwide 13Table 664Mb Cost Model1997199819992000Wafer SortWafer Size (Diameter in Inches)8888Capacity Utilization (%)100.00100.00100.00100.00Geometry (Microns)0.400.350.350.35Processed Wafer Cost ($)1550165016501650Die Area (Square Mils)303700242960194368155494Active Area Factor1.001.001.001.00Number of Masks16181818Defect Der«ity per Square InchGross Die per Wafer0.1251240.1111550.1111940.111242Processed Wafer Cost per Gross Die ($)12.4910.638.516.81Test Cost per Hour ($)160.00140.00120.00120.00Wafers Tested per Hour0.160.130.100.08Wafer Sort Cost per Gross Die ($)8.007.006.006.00Cost per Gross Die at Wafer Sort ($)20.4917.6314.5112.81Wafer Sort Yield (%)54626873Cost per Sorted Die ($)37.6128.6721.4017.48AssemblyMaterial Cost/Sorted Die—PQFP pkg.($)0.480.480.480.48Number of Pins44444444Assembly Yield (%)99909090Cost per Assembled Die ($)38.4732.3924.3119.95Final TestTest Time per Die (sec.)90.0080.0060.0060.00Cost per Hour of Testing ($)160.00140.00120.00120.00Test Cost per Die ($)4.003.112.002.00Final Test Yield (%)90909090Cost per Final Tested Unit ($)47.1939.4429.2324.39"Mark, Pack, and Ship"Cost at 99% Yield (%)0.470.390.290.24Total Fabricated Cost per Net Unit ($)47.6639.8329.5324.63FMV Formula AddersR&D Expense (15%)7.155.984.433.70SG&A Expense (10%)5.484.583.402.83Profit (8%)4.824.032.992.49Constructed Foreign Market Value (FMV)65.1254.4240.3433.66Source: Dataquest (March 1997)SSPS-WW-DP-9702 ©1997 Dataquest Marcfi3,1997
14 Semiconductor Supply and Pricing WorldwideDataquest PerspectiveThe individual unit cost of a semiconductor forms the most tangible variablein the total cost of a semiconductor device. Understanding cost modelsand the variables that go into a model allows for more efficient and educatedallocations of resources both in planning and in the execution of thoseplans. By applying different assumptions to different variables in themodel, one may uncover areas of cost not initially considered important.Many different "what if" scenarios are often required to best utilize costmodeling in long-range system analysis As different suppliers improveyields and lower costs, individual company price points can often hint atefficiency gains or losses for differing technologies (ASICs) or the nextgenerationproducts.Models are inherently flexible. If historical data differs from calculatedmodel results, updates quickly correct inconsistencies. Checking andupdating a model against known data ensures that the model is correct andcurrent. Revisions to the existing algorithms to better match reality shouldonly be made when basic changes occur, not for perturbations that deviatefrom the norm. As improvements are made to this model in the upcomingmonths, clients will be notified.Those in procurement use cost modeling and experience curve analysis forboth short- and long-term contract negotiations. The current transition inmarket dynamics from a seller's to a more balanced market again allowsuse of cost base pricing. Good communications with suppliers regardingyield improvements or other cost savings in combination with cost modeluse potentially can allow for price reductions for astute procurementgroups. Periodic "reality checks" of the model assures planners that theyused the best information available at the time. Using cost modeling in thisway provides a tangible benchmark for procurement to use with their suppliersin terms of cost and price reduction for critical semiconductor parts.For More Information...Mark Giudici, Director and Principal Analyst (408) 468-8258Internet addressmark.giudici@dataquest,comVia fax (408) 954-1780DataquestA Gartner Group CompanyThe content of this report represents our interpretation and analysis of information generally available to the publicor released by responsible individuals in the subject companies, but is not guaranteed as to accuracy or completeness.It does not contain material provided to us in confidence by our clients. Reproduction or disclosure in whole or inpart to other parties shall be made upon the written and express consent of Dataquest,©1997 Dataquest—Reproduction ProhibitedDataquest is a registered trademark of A.C. Nielsen Company
PerspectiveSemiconductor Supply and Pricing WorldwideMarket AnalysisFirst Quarter 1997 Procurement Pulse: Qrder RatesRebound while Lead Times and inventories StabilizeAbstract: The Procurement Pulse is a quarterly update (with interval updates, if eventswarrant) of critical issues and market trends based on surveys of semiconductorprocurement managers in the North American region. Besides order rate, lead time, andinventory information, this survey also notes price status by semiconductor product familyand package type, as well as key problems facing semiconductor users.By Mark Giudici>nKJ o'^JLU_iLL5LU~)NZLU—1_^a^^^^cr
- • ' •• : • •' : : ; •• • • : ' .• : :Figure 1Semiconductor Supply and PricingSemiconductor Supply and Pricing Worldwideoverall prices continue to decline, pricing for different semiconductorpackaging (except for two respondents using TSOP) has reached parity.Section AAveraged Monthly Semiconductor OrdersSection BAveraged Semiconductor Lead TimesOrder Index, 12/88 = 1000 -V-f"*!rnimnV . .;;:::fv.;;:; :£.i •'x T 1r\ 1 1 16/96 7/96 8/96 9/96 10/9611/9612/96 1/97-;;• • • •.'." y.s;ill•".''Weeksouu-500-400-300-200-100-16-15-14-13-12-11 -10-9-8-7-\ T T6/96 7/96 8/96 9/961 110/96 11/96 12/96Section CActual vs. Target Inventory Levels(All OEMs)Section DActual vs. Target Inventory Levels(Computer OEMs)Days25^—i»-Current Actual—•—TargetDays30.Current ActualTarget20-115-110-5-Over^0 —1 1 1 1 16/96 7/96 8/96 9/96 10/96 11/96 12/961 1 1 1 \6/96 7/96 8/96 9/96 10/96 11/96 12/96Source: Dataquest (January 1996)Lead Times for Semiconductors Hover around Nine WeelcsSection B of Figure 1 shows that the average lead time for respondents inDecember inched up to 9.0 weeks, compared with an 8.6-week average notedin November. The relative stability of lead times around nine weeks over thepast three quarters reflects the excellent availability and pricing of parts thathas kept customer-required delivery schedules the norm. Now, well over ayear into a buyer's market, many procurement managers continue to balanceprice cuts with supply base relations. Good service levels combined withever-lower prices are cementing many long-term supplier relations. Out ofthe entire sample, only two respondents noted problems with products,SSPS-WW-DP-9701 ©1997 Dataquest January 27,1997
Semiconductor Supply and Pricing Worldwidethose being ASICs and some older standard logic parts. For the vast majorityof the respondents and the overall market, however, there are no problemsregarding product availability or pricing. Like last quarter, over half of thismonth's respondents noted price fluctuations or inventory adjustments andend-of-life ordering as the key issues now taking precedence. As noted overthe past year, we expect the volatility of the spot n\arket to continue tovacillate around declining contract prices, causing uncertainty for somebuyers. The overall trend, however, is for continued good availability,consistently declining prices, and low lead times (eight to 10 weeks) for thenext six to nine months.Semiconductor Inventories Bacic to Historical LevelsDataquest PerspectiveSections C and D of Figure 1 highlight how inventories have stabilized overthe past three quarters and are in synchrony with system unit demand. Evenwith semiconductor order rates forecast to rise as noted above, we do notexpect semiconductor inventories to rise, as availability is good and pricesare expected to continue their decline. The overall targeted and actualsemiconductor inventory levels for December were 12.4 days and 14.6 days,respectively, conipared with November's 9.6-day and 8.6-day inventorylevels. The computer subset now appears less aggressive than the average,possibly realigning increases in inventory with anticipated higher firstquarter 1997 sales. The current target and actual inventory levels of 17.5 daysand 21.5 days compare with November levels of 11.7 and 15.3 days on handfor the computer subset. We continue to expect to see stabilized inventorylevels in line with system sales levels.Availability of semiconductors remains very good to excellent, and weexpect it to remain this way for the rest of 1997. Prices continue to decline,despite the efforts of some memory suppliers to curtail output, and leadtimes have stabilized to meet customer demand. Even with relentlessly lowprices on the DRAM spot market, the volume of business through thischannel is surprisingly low. This reflects the focus of users on total cost, notprice alone, when determining a component buy. Although Dataquestforecasts steady 1997 growth rates for PCs and other electronics relative to1996, the overall trend follows an upward growth slope. User semiconductorinventory levels are now in line with user demand, and we expect to seecontinual balance in these indexes in the near future. Allocations are not aproblem, as obsolescence now has users' attention. Dataquest expects to seeexcellent semiconductor availability through the end of 1997. DRAM andMPU price elasticity to date have not propped up prices. Although the spotmarket continues to lead contract pricing lower, cost barriers will continue tomoderate steep price cuts in this area. The good news for users is thatdeclining prices will continue to be with us for the remainder of this year.SSPS-WW-DP-9701 ©1997 Dataquest January 27,1997
Semiconductor Supply and Pricing WorldwideFor More Information...Mark Giudici, Director/Principal Analyst (408) 468-8258Internet addressmgiudici@dataquest.coinVia fax (408)954-1780The content of this report represents our interpretation and analysis of information generally available to thepublic or released by responsible individuals in the subject companies, but is not guaranteed as to accuracy orcompleteness. It does not contain material provided to us in confidence by our clients. Reproduction orjjOTO/^l If^CT disclosure in whole or in part to other parties shall be made upon the written and express consent of Dataquest.^'^^ ^^tr^"^*" ©1997 Dataquest—Reproduction ProhibitedA Gartner Group Company Dataquest is a registered trademark of A.C. Nielsen Company
B)X"CDI<strong>DataQuest</strong>
<strong>DataQuest</strong>
Dataquest
Dataquest@
<strong>DataQuest</strong>A Gartner Group Company 251 River Oaks Parkway, San Jose, CA 95134-1913(408) 468-8000 Fax (408) 954-1780January 5,1998ErrataThe tables in Dataquest's North American Semiconductor Price Outlook, First Quarter 1998(SSPS-WW-MS-9705, December 29,1997) contained an incorrect source month. Pleasediscard the original document and replace it with this corrected one.Dataquest regrets the error and apologizes for any inconvenience. For furtherinformation, contact Director and Principal Analyst Mark Giudici at (408) 468-8258 or atmark.guidici@dataquest.com.«
RLE COPY:MARIA VALENZUELA<strong>DataQuest</strong>North American Semiconductor PriceOutiooic—First Quarter 1998Market StatisticsProgram: Semiconductor Supply and Pricing WorldwideProduct Code: SSPS-WW-MS-9705Publication Date: December 29,1997Filing: Market Statistics
Nortli American Semiconductor PriceOutlooic—First Quarter 1998Market StatisticsProgram: Semiconductor Supply and Pricing WorldwideProduct Code: SSPS-WW-MS-9705Publication Date: December 29,1997Filing: Market Statistics
North American Semiconductor Price Outiool
Semiconductor Supply and Pricing WorldwideList of TablesTablePage2-1 Estimated Standard Logic Price Trends—North American Bookings 32-2 Estimated Long-Range Standard Logic Price Trends—North American Bookings 52-3 Estimated Microprocessor Price Trends—North American Bookings 62-4 Estimated Long-Range Microprocessor Price Trends—North American Bookings 82-5 Estimated DRAM Price Trends—North American Bookings 92-6 Estimated Long-Range DRAM Price Trends—North American Bookings 112-7 Estimated Static RAM Price Trends-North American Bookings 122-8 Estimated Long-Range Static RAM Price Trends—North American Bookings 132-9 Estimated ROM Price Trends—North American Bookings 142-10 Estimated Long-Range ROM Price Trends—North American Bookings 152-11 Estimated EPROM Price Trends—North American Bookings 162-12 Estimated Long-Range EPROM Price Trends—North American Bookings 172-13 Estimated Flash Memory Price Trends—North AmericanBookings 182-14 Estimated Long-Range Flash Memory Price Trends—North American Bookings 192-15 Estimated Gate Array Pricing—North American Production Bookings 202-16 Estimated CBIC Pricing—North AmericanProduction Bookings 21SSPS-WW-l\/IS-9705 ©1997 Dataquest December 29,1997
Chapter 1Nortli American Semiconductor Price Outlooic—FirstQuarter 1998Methodology and SourcesThis document provides information on and forecasts for the North Americanbookings prices of more than 200 semiconductor devices. Dataquestcollects price information on a quarterly basis from North American suppliersand major buyers of these products. North American bookings priceinformation is analyzed by Semiconductor Supply and Pricing Worldwide(SSPS) analysts for consistency and reconciliation. The information finallyis rationalized with worldw^ide billings price data in association withproduct analysts, resulting; in the current forecast. This document includesassociated long-range forecasts.For SSPS clients that use the SSPS online service through CompuServe, theprices presented here correlate with the quarterly and long-range pricetables dated December 1997 in the SSPS online service. Clients who wantto access the information on the World Wide Web can pay extra for aDataquest Interactive subscription, which allows users to access all theirdeliverables at their desktops. For additional product coverage and moredetailed product specifications, please refer to those sources.Price VariationsActual negotiated market prices may vary from these prices because ofmanufacturer-specific factors such as product quality, special features, service,delivery performance, volume discount, or other factors that mayenhance or detract from the value of a company's product. These pricesare intended for use as price guidelines.SSPS-WW-MS-9705©1997 Dataquest
Chapter 2Market Statistics TablesTables 2-1 through 2-16 show statistics on North American semiconductorprices.Table 2-1Estimated Standard Logic Price Trends—North American Bookings(Volume: 100,000 per Year; Package: PLCC; Dollars)74LS TTL74LS0074LS7474LS13874LS24474AC TTL74AC0074AC7474AC13874AC24474F TTL74F0074F7474F13874F24474HC CMOS74HC0074HC7474HC13874HC24474ALS TTL74ALS0074ALS7474ALS13874ALS24474AS TTL74AS0074AS7474AS13874AS244Q4/970.130.160.170.240.170.200.290.390.140.150.180.220.110.160.170.210.140.160.210.300.190.190.400.63Ql/980.130.160.170.220.150.180.280.360.120.140.170.210.110.150.170.210.140.150.200.270.190.190.400.61Q2/980.130.160.170.220.150.180.280.360.120.140.170.210.110.150.170.210.140.150.200.270.190.190.390.61Q3/980.130.160.170.220.150.170.280.360.110.140.170.210.110.150.170.210.140.150.200.270.190.190.390.61Q4/980.130.160.170.220.150.170.280.360.110.140.170.210.110.150.170.210.140.150.200.270.190.190.390.611998Year0.130.160.170.220.150.170.280.360.120.140.170.210.110.150.170.210.140.150.200.270.190.190.390.61Ql/990.130.160.170.210.140.160.260.330.110.140.170.210.110.150.170.210.140.150.200.260.190.190.370.60Q2/990.130.160.170.210.140.160.260.330.110.140.170.210.110.150.170.210.140.150.200.280.190.190.370.60Q3/990.130.160.170.210.140.160.260.330.110.140.170.220.110.150.170.220.140.160.200.260.190.190.370.59Q4/990.130.160.170.210.140.160.260.330.110.140.170.220.110.150.170.220.140.160.200.260.190.190.370.591999Year0.130.160.170.210.140.160.260.330.110.140.170.210.110.150.170.210.140.150.200.260.190.190.370.60LeadTimes(Weeks)3-83-83-83-83-83-83-83-83-83-83-83-83-83-83-83-83-83-83-83-83-83-83-83-8SSPS-WW-MS-9705©1997Dataquest
Semiconductor Supply and Pricing WorldwideTable 2-1 (Continued)Estimated Standard Logic Price Trends—North American Bookings(Volume: 100,000 per Year; Package: PLCC; Dollars)74BC*74BC0074BC24474BC37374ACT24474ACT24574ABT24474ABT245Q4/970.200.530.550.410.440.570.61Ql/980.190.480.500.380.400.490.52Q2/980.190.480.500.380.400.490.52Q3/980.180.460.460.360.370.480.51Q4/980.180.460.460.360.370.480.511998Year0.190.470.480.370.390.490.52Ql/990.170.440.440.350.360.460.49Q2/990.170.440.440.350.360.460.49Q3/990.170.400.420.330.340.440.46Q4/990.170.400.420.330.340.440.461999Year0.170.420.430.340.350.450.48LeadTimes(Weeks)•Pricing for 74BC excludes 74ABT and 74BCT.Note: Actual negotiated market prices may vary from these prices because of manufacturer-specific factors such as quality, service, andvolume discount. These prices are intended for use as price guidelines.Source: Oataquest (December 1997)3-83-83-83-83-83-83-8SSPS-WW-MS-9705 ©1997 Dataquest December 29,1997
Market Statistics TablesTable 2-2Estimated Long-Range Standard Logic Price Trends—North American Bookings(Volume: 100,000 per Year; Package: PLCC; Dollars)74LS TTL74LS0074LS7474LS13874LS24474AC TTL74AC0074AC7474AC13874AC24474F TTL74F0074F7474F13874F24474HC CMOS74HC0074HC7474HC13874HC24474ALS TTL74ALS0074ALS7474ALS13874ALS24474AS TTL74AS0074AS7474AS13874AS24474BC*74BC0074BC24474BC37374ACT24474ACT24574ABT24474ABT24519980.130.160.170.220.150.170.280.360.120.140.170.210.110.150.170.210.140.150.200.270.190.190.390.610.190.470.480.370.390.490.52•Pricing for 74BC excludes 74ABT and 74BCT.Note: Actual negotiated marl
COCO-oCOTable 2-3Estimated Microprocessor Price Trends—North American Bookings (Volume: 25,000 per Year; Do(Package: 32/64-Bit Devices—Ceramic PGA; Exceptions Noted)COICO-«JC3en68EC020-25 PQFP68EC030-25 PQFPQ4/978.0018.75Ql/988.0018.75Q2/988.0018.75Q3/988.0018.75Q4/988.0018.7519988.0018.75Ql/998.0018.75Q2/998.0018.75Q168040-2522.0022.0022.0022.0022.0022.0022.0022.00268LC040-25 CQFP18422.0022.0022.0022.0022.0022.0022.0022.002Pentium-100 3,3V70.0070.0070.00EOLEOL70.00EOLEOLEPentium400 2.9VPentium-! 20 33V85.0085.0085.0085.0085.0085.00EOLEOLEOLEOL85.0085.00EOLEOLEOLEOLEEPentium420 2.9V85.0085.0085.00EOLEOL85.00EOLEOLEPentium-133 3.3V100.00100.00100.00EOLEOL100.00EOLEOLE@COCO-NIaK.Ol.acCDC/)aCDOCD3Pentium-133 2.9VPentium-150 3.3VPentium-ISO 2.9VPentium-166 33VPentium-200 3.3VPentium MMX 166 MHz 2.8V PGAPentium MMX 200 MHz2.SV PGAPentium MMX 233 MHz 2.8V PGAPentium Pro-180 256K CachePentium pTO-200 256K CachePentium Pro-200 512K CachePentiumPro-2001 MCachePentium II 233 MHz 512K CachePentium II266 MHz 512K CachePentium 11 300 MHz 512K Cache85.00100.00100.0090.00100.00105.00205.00280.00380.00450.00985.002,600.00380.00500.00750.0085.0085.00100.0090.00100.0095.00115.00175.00380.00450.00985.002,600.00248.00350.00505.0085.0085.00100.0090.00100.0085.0090.00125.00380.00450.00985.002,600.00188.00300.00400.00EOLEOLEOLEOLEOL82.5085.00105.00380.00450.00985.002,600.00160.00250.00350.00EOLEOLEOLEOLEOL80.0085.0095.00380.00450.00985.002,600.00150.00225.00310.0085.0085.00100.0090.00100.0085.6393.75125.00380.00450.00985.002,600.00186.50281.25391.25EOLEOLEOLEOLEOLEOLEOL90.00EOLEOL985.002,600.00125.00210.00240.00EOLEOLEOLEOLEOLEOLEOL85.00EOLEOL985.002,600.00125.00210.00190.00EEEEEEE8EE982,60122116INSCOCOCO-vl
COCO-oCOITable 2-3 (Continued)Estimated Microprocessor Price Trends—North American Bookings (Volume: 25,000 per Year; Do(Package: 32/64-Bit Devices—Ceramic PGA; Exceptions Noted)ICOI
Semiconductor Supply and Pricing WorldwideTable 2-4Estimated Long-Range Microprocessor Price Trends—North American Bookings(Volume: 25,000 per Year; Dollars) (Package: 32/64 Bit Devices—Ceramic PGA;Exceptions Noted)68EC020-25 PQFP68EC030-25 PQFP68040-2568LC040-25 CQFP 184Pentium-100 3.3VPentium-100 2.9VPentium-120 3.3VPentium-120 2.9VPentium-133 3.3VPentium-133 2.9VPentium-150 3.3VPentium-150 2.9VPentium-166 3.3VPentium-200 3.3VPentium MMX 166 MHz 2.8V PGAPentium MMX 200 MHz 2.8V PGAPentium MMX 233 MHz 2.8V PGAPentium Pro-180 256K CachePentium Pro-200 256K CacheumPro-200' :K Cache. ..lum Pro-200 IM CachePentium II233 MHz 512K CachePentium II266 MHz 512K CachePentium II300 MHz 512K CachePowerPC 603-80Powe PC 603-133PowerPC 604-166PowerPC 604-225PowerPC 604-240Power PC 604-300Power PC 604-350PowerPC 603e-80Powe PC 603e-133PowerPC 604e-166PowerPC 604e-225PowerPC 604e-240Power PC 604e-300Power PC 604e-35019988.0018.7522.0022.0070.0085.0085.0085.00100.0085.0085.00100.0090.00100,0085.6393.75125.00380.00450.00985.002,600.00186.50281.25391.2560.0090.00130.00253.75266.25287.50461.2560.0033.85135.00160.00185.00275.25359.7519998.0018.7522.0022.00EOLEOLEOLEOLEOLEOLEOLEOLEOLEOLEOLEOL83.75EOLEOL985.002,600.00125.00210.00182.50EOLEOLEOLEOLEOLEOLEOL60.0033.85135.00156.00166.00185.00208.7520008.0018.7522.0022.00EOLEOLEOLEOLEOLEOLEOLEOLEOLEOLEOLEOLEOLErEOLEOLEOLEOLEOLEOLEOLEOLEOLEOLEOLEOLEOLEOLEOLEOL156.00166.00185.00200.00EOL = End of lifeNA = Not availableNote: Actual negotiated marl
Market Statistics Tables2«I—H1—1OD1/3P•VOJaI* ju(QJ2OUCO00aOoPQau•1-M;-iQJB^flj »H w0 0 0 0 0 0 0 0 0 0 0 0 0 0 0 0 0 0 0 0 0 0cncncncocococnmcncococtSopooooooooooooooooooooooQOoooooooooociScrimrfimmmromcocricocricricortcritvO00 Ln(N i-H 00 ON1-H ^N v^ ^CS CO CO CO>oCOCO 1-HinKCO CO CNin LD 0^CNCOONinCNinONIN- * C O ' * i 0 0 Q O 0 0 0 0 0 0 0 0 t NCMCOovinl-HCOinCOegoOinOrjisNOCOCONO*>inCL,OtnF-HcoNOinV}NOs55NO•sCOCOT-HONOiriT-H0000iriT-HKNOv-H-*pONT-HoNOtNT-HCNin00T-HoinONT-HCOind(NT-H00CMCN>mcoNOEnmINNO00CN00T-HdCO^r-HCO"*• *COCOtNo00COoCMiriCOinoINCOopONCOinprHT-HNOiriPHtLi>inoONNOCO0000CO0000^COo^INinCOoCOiriNOCOIN(Nin^cNrHoiinT-HONNOinOHH.>Ultfl [/I [rts s s\D ^ VO55NOCOXiCM55E^XS5\CCOXCOCOINminCOdNDCOin2IN00NONOinT-H^ONCOdINoT-Hsoo00INOT-HCN00(NCMT-HONCIHuu>inCoNOsCMCOXCONOON00NOONinKT-H^COd00NO00dONNONOsNONO0000NO00CNONNOCN|INON00r-HINOT-HC-p->inCOT-HINoinINoONINrHCO00INONK00T-HCMONOINONCMdT-HCOrHT-HU2>m(A ms &NONOs55NDCOX00s55CNCOX00in00COpONT-HmONT-HodT-HoCOT-HT-HCOindT-HCOpT-HT-HininrHT-HOT-HCMT-H^triT-HOD>mIDcoNO55NOCOXinCMTjHt-H8iriT-HONINirirHCONONOr-HCOON00T-HoinINT-HCN00T-HONCOONT-HT-HdCN00NOCNJCNoQw>menCoNO55COX1CNINCOooT-HCOONT-HinCOdCNCNT—HCN00r-H(NininCNCN00inCOCNinNOrJHCNinONiriCMCOCOocjCNg>inUlsNOtnNOCOXCNiSSPS-WW-IVIS-9705 ©1997 Dataquest December 29,1997
enCO-DCOCO-vloCJl©COCO--JoK.(U£3Table 2-5 (Continued)Estimated DRAM Price Trends—North American Bookings (Contract Volume; U.S. Dollars)*4Mbx32 SIMM 60ns 5V EDO4Mbx36 SIMM 60n5 5V EDO8Mbx32 SIMM 60ns 5V EDO8Mbx36 SIMM 60ns 5V EDOlMbx64 6Gns 3.3V EDO2Mbx64 60ns 3.3V EDO4Mbx64 60ns 3.3V EDOlMbx64 3.3V SDRAM2Mbx64 3.3V SDEIAM4Mbx64 3.3V SDRAM256Kxl6 VRAM 70ns SOP256Kx32 66 MHz 3.3V SGRAMQ4/9745.3654.3990.72106.6825.9245.36127.5527.9755.94130.249.155.60Ql/9840.8249.4081.6596.8123.3341.20114.8025.1750.35117.229.105.30Q2/98'Contract volume is at least 100,000 per order, except for VRAMs.Note: Actual negotiated market prices may vary from these prices because of manufacturer-specific factors such as quality, sen/ice, and volume discoas price guidelines.Source: Dataquest (December 1997)38.7847.1977.5792.4222.1639.14103.3223.9247.83105.509.055.24Q3/9836.8445.0873.6988.2521.0537.1892.9922.7245.4494.959.005.05Q4/9835.0043.0870.0084.2720.0035.3388.3421.5843.1790.208.904.92199837.8646.1975.7390.4421.6438.2199.8623.3546.70101.969.015.13Ql/9933.2540.9266.5080.0619.0033.5683.9220.5141.0185.698.884.87Q2/9931.5938.8863.1876.0618.0531.8879.7219.4838.9681.408.854.85Q3/9930.0136.9360.0272.2517.1530.2975.7418.5137.0177.338.844.82aCDnCD3crCD—1roCOCOCO•vl
Market Statistics Tables 11Table 2-6Estimated Long-Range DRAM Price Trends—North American Bookings(Contract Volume; U.S. Dollars)*4Mbxl DRAM 70ns SOJ 5VlMbx4 DRAM 60ns SOJ 5V FPMlMbx4 DRAM 60ns SOJ 5V EDO512Kx8 DRAM 70ns 5V256Kxl6 DRAM 70ns SOJ 5V4Mbx4 DRAM 60ns SOJ 5V FPM4Mbx4 DRAM 60ns SOJ 5V EDOlMbxl6 DRAM 60ns TSOP 5V FPMlMbxl6 DRAM 60ns TSOP 5V EDOlMbxl6 3.3V SDRAM2Mbx8 DRAM 60ns TSOP 5V FPM2Mbx8 DRAM SDRAM 3.3V16Mbx4 DRAM SOJ 60ns 3.3V EDO16Mbx4 DRAM SOJ 3.3V SDRAM8Mbx8 DRAM SOJ 60ns 3.3V EDO8Mbx8 DRAM SOJ 3.3V SDRAM4Mbxl6 DRAM SOJ 60ns 3.3V EDO4Mbxl6 DRAM SOJ 3.3V SDRAMlMbx32 SIMM 60ns 5V FPMlMbx36 SIMM 60ns 5V FPM2Mbx32 SIMM 60ns 5V FPM2Mbx36 SIMM 60ns 5V FPM4Mbx32 SIMM 60ns 5V FPM4Mbx36 SIMM 60ns 5V FPM8Mbx32 SIMM 60ns 5V FPM8Mbx36 SIMM 60ns 5V FPMlMbx32 SIMM 60ns 5V EDOlMbx36 SIMM 60ns 5V EDO2Mbx32 SIMM 60ns 5V EDO2Mbx36 SIMM 60ns 5V EDO4Mbx32 SIMM 60ns 5V EDO4Mbx36 SIMM 60ns 5V EDO8Mbx32 SIMM 60ns 5V EDO8Mbx36 SIMM 60ns 5V EDOlMbx64 60ns 3.3V EDO2Mbx64 60ns 3.3V EDO4Mbx64 60ns 3.3V EDOlMbx64 3.3V SDRAM2Mbx64 3.3V SDRAM4Mbx64 3.3V SDRAM256Kxl6 VRAM 70ns SOP256Kx32 66 MHz 3.3V SGRAM21.6438.2199.8623.3546.70101.969.015.1317.6231.1377.8319.0238.0479.478.854.8415.8628.0170.0517.1234.2371.538.834.7814.4025.4463.6115.5431.0864.958.834.7513.0823.1057.7514.1128.2258.978.904.72"Contract volume is at least 100,000 per order, except for VRAMs.Note: Actual negotiated market prices may vary from these prices because of manufacturer-specific factors such as quality, service, andvolume discount. These prices are intended for use as price guidelines.Source: Dataquest (December 1997)19982.191.751.751.982.504.554.524.534.515.564.555.5623.7824.2823.7824.2823.7824.289.5211.3619.0424.2338.0748.5776.1590.869.4711.3018.9324.1837.8646.1975.7390.4419991.871.501.501.692.123.713.683.693.674.533.714.5318.5318.9218.5318.9218.5318.927.759.3215.5120.3331.0139.9162.0274.607.719.2815.4219.8730.8437.9561.6874.2520001.891.511.511.712.143.633.603.623.604.443.634.4416.6817.0316.6817.0316.6817.037.609.1415.2019.9230.3939.1160.7873.107.569.1015.1119.4730.2237.1960.4572.7720011.911.531.531.732.163.563.533.553.534.353.564.3515.1415.4615.1415.4615.1415.467.458.9614.8919.5229.7838.3359.5771.647.408.9114.8119.0829.6236.4559.2471.3120021.921.541.541.752.183.593.573.583.564.393.594.3913.7514.0413.7514.0413.7514.047.529.0415.0419.7230.0838.7160.1672.367.489.0014.9619.2729.9136.8259.8372.03SSPS-WW-MS-9705 ©1997 Dataquest December 29,1997
COCO-DCOCOCO•~JC3en@(O(D-vloK.(U.£3DCDC3-CDPOCOTable 2-7Estimated Static RAM Price Trends—North American Bookings (Volume: Slow SRAM—50,000 pFast SRAM—20,000 per Year; Package: PDIP; Dollars)16Kx4 35ns8Kx8 25ns8Kx8 100-120ns64Kx4 10ns64Kx4 25ns32Kx8 12ns32Kx9 12ns Burst32Kx8,15ns, 5V32Kx8, 15ns, 3.3V32Kx8 25ns32Kx8 70-100ns SOJ64Kx8 12ns Burst256Kx4 20ns128Kx8,15ns128Kx8, 20ns128Kx8 25ns128Kx8 70-100nsSOJ32Kx3215ns, 3.3V PQFP32Kx32 8ns 3.3V PBSynch64Kx32 8ns 3.3V PBSynch256Kxl6 70-lOOns256Kxl6 25ns5l2Kx8 70ns512Kx8 25nsQ4/972.141.041.205.401.801.263.311.121.121.121.3013.504.153.683.823.823.053.272.775.3014.6017.4813.3117.44Ql/982.091.001.165.011.601.253.271.101.121.121.2613.353.653.373.353.352.963.202.755.0013.5016.6813.0916.91Q2/982.091.001.164.851.601.253.251.101.121.121.2412.203.603.263.243.242.953.152.724.9513.0016.1712.6016.06Note: Actual negotiated market prices may vary from thes9 prices because of manufacturer-specific factors such as quality, service, and voiume discoas price guidelines.Source: Dataquest (December 1997)Q3/982.090.961.144.781.551.273.231.101.141.121.2311.803.453.163.143.142.863.102.694.6812.5015.3312.2614.77Q4/982.110.961.144.771.551.273.211.101.141.121.2211.353.423.123.103.102.833.042.674.6012.2815.0411.8514.0419982.100.981.154.851.581.263.241.101.131.121.2412.183.533.233.213.212.903.122.714.8112.8215.8112.4515.45Ql/992.110.961.114.751.531.273.191.131.151.141.2111.253.332.972.972.972.763.002.674.5512.1514.6111.7013.79Q2/992.110.961.114.681.531.273.191.131.151.141.2111.173.302.962.962.962.732.972.654.5012.0514.3211.6013.32Q3/992.130.961.104.651.511.273.171.131.151.141.2111.033.262.942.942.942.722.952.634.4012.0013.8411.2913.00QCOCO
Market Statistics Tables 13Table 2-8Estimated Long-Range Static RAM Price Trends—North American Bookings (Volume:Slow SRAM—50,000 per Year; Fast SRAM—20,000 per Year; Package: PDIP; Dollars)16Kx4 35ns8Kx8 25ns8Kx8 100-120ns64Kx4 10ns64Kx4 25ns32Kx8 12ns32Kx9 12ns Burst32Kx8,15ns, 5V32Kx8, 15ns, 3.3V32Kx8 25ns32Kx8 70-lOOns SOJ64Kx8 12ns Burst256Kx4 20ns128Kx8,15ns128Kx8, 20ns128Kx8 25ns128Kx8 70-lOOns SOJ32Kx32 15ns, 3.3V PQFP32Kx32 8ns 3.3V PBSynch64Kx32 8ns 3.3V PBSynch256Kxl6 70-lOOns256Kxl6 25ns512Kx8 70ns512Kx8 25nsNote: Actual negotiated market prices may vary from these prices because of manufacturer-specific factors such as quality, service, andvolume discount. These prices are intended for use as price guidelines.Source: Dataquest (December 1997)19982.100.981.154.851.581.263.241.101.131.121.2412.183.533.233.213.212.903.122.714.8112.8215.8112.4515.4519992.120.961.104.671.521.273.181.131.151.141.2111.103.282.942.952.952.732.972.654.4512.0314.1311.4313.2420002.140.961.084.571.511.303.161.181.171.181.2010.603.202.892.892.892.692.932.704.3311.7513.5011.0212.4220012.160.971.084.551.511.353.151.251.251.251.2010.453.182.822.822.822.663.003.105.0011.1012.7510.9511.8920022.171.001.124.551.511.503.151.501.501.501.2010.203.172.792.792.792.623.203.355.5510.7911.9510.7511.12SSPS-WW-iViS-9705 ©1997 Dataquest December 29,1997
COCO-oCOCOICOoen@COCO-~JaK.(U.£3Table 2-9Estimated ROM Price Trends—North American Bookings (Speed/Package: ( 2Mb Density—200ns and Above; 32-Pin PDIP) (Volume: 50,000 per Year; Dollars)128KX8ROM64Kxl6 ROM256Kx8 ROM512Kx8 ROM256Kxl6 ROM^IMbxS ROM^lMbxl6 ROM2Mbx8 ROM2Mbxl6 ROM4Mbx8 ROM4Mbxl6 ROM8Mbx8 ROMQ4/971.641.802.142.802.803.705.655.6511.3011.3015.0014.90Ql/981.581.732.102.702.703.62 .5.555.5511.0011.0014.5014.40Q2/981.551.702.082.682.683.585.505.5011.0011.0014.5014.40Q3/981.511.662.052.552.553.535.465.4610.7010.7014.0013.90^256Kx16 ROM: 150ns and above; 40-pin PDIP^1 MbxB ROM: iSQns and above; 32-pin SOPNote: Actual negotiated market prices may vary from these prices because of manufacturer-specific factors sucfi as quality, service, and volume discoas price guidelines.Source: Dataquest (December 1997)Q4/981.511.662.052.622.623.495.465.4610.4510.4514.0013.9019981.541.692.072.642.643.565.495.4910.7910.7914.2514.15Ql/991.501.642.022.602.603.455.405.4010.3510.3513.8513.75Q2/991.481.612.002.572.573.405.355.3510.3510.3513.8513.75Q3/991.461.591.982.532.533.385.305.3010.2010.2013.6013.50Q41112235510101313oCDOCD3o-CD—^^^COCOCO-vl
Ma rket Statist! cs Tab les 15Table 2-10Estimated Long-Range ROM Price Trends—North American Bookings (Speed/Package:(2Mb Density—200ns and Above; 32-Pin PDIP) (Volume: 50,000 per Year; Dollars)128Kx8 ROM64Kxl6 ROM256Kx8 ROM512Kx8 ROM256Kxl6 ROM^lMbx8 ROM^lMbxl6 ROM2Mbx8 ROM2Mbxl6 ROM4Mbx8 ROM4Mbxl6 ROM8Mbx8 ROM19981.541.692.072.642.643.565.495.4910.7910.7914.2514.15^256Kx16 ROM: 150ns and above; 40-pln PDIP^1Mbx8 ROM: 150ns and above; 32-pln SOPNote: Actual negotiated market prices may vary from these prices because of manufacturer-specific factors such as quality, service, andvolume discount. These prices are Intended for use as price guidelines.Source: Dataquest (December 1997)19991.471.611.992.552.553.405.345.3410.2810.2813.7113.5920001.451.571.962.472.473.305.265.2610.1110.1113.4413.2120011.431.551.942.422.423.285.225.229.899.8913.1312.9720021.421.541.922.42.42.275.185.189.499.4912.8612.56SSPS-WW-MS-9705 ©1997 Dataquest December 29,1997
en05-DCOTable 2-11Estimated EFROM Price Trends—North American Bookings (Volume: 50,000 per Year; Package:Speed: 150ns and Above; Dollars)Q4/97Ql/98Q2/98Q3/98Q4/981998Ql/99Q2/99Q3/99Q4CO•vloCJI32Kx8 EPROM64Kx8 EPROM1.321.391.261.311.231.291.221.271.211.261.231.281.211.251.191.231.181.22128Kx8 EPROM1.801.651.651.601.591.621.561.551.52256Kx8 EPROM2.732.682.662.522.502.592.452.452.42128Kxl6 EPROM3.133.083.032.822.802.932.752.752.71512Kx8 EPROM4.514.064.033.953.913.993.863.863.79256Kxl6 EPROM6.155.335.144.944.745.034.654.604.48lMbx8 EPROM8.207.387.337.186.657.136.636.686.35512Kxl6 EPROM9.308.258.138.007.888.067.557.557.20©COCO-vloCU1-^CU.ac:CDCONote: Actual negotiated market prices may vary from these prices because of manufacturer-specific factors such as quallrty, servlcev and volume discouas price guidelines.Source: Oataquest (December 1997)CDOCD3CTCD—1l\3COCOCO-vl
Market Statistics Tables 17Table 2-12Estimated Long-Range EPROM Price Trends—North American Bookings (Volume:50,000 per Year; Package: Windowed CERDIP; Speed: 150ns and Above; Dollars)32Kx8 EPROM64Kx8 EPROM128Kx8 EPROM256Kx8 EPROM128Kxl6 EPROM512Kx8 EPROM256Kxl6 EPROMlMbx8 EPROM512Kxl6 EPROM19981.231.281.622.592.933.995.037.138.06Note: Actual negotiated market prices may vary from these prices because of manufacturer-specific factors such as quality, service, andvolume discount. These prices are intended for use as price guidelines.Source: Dataquest (December 1997)19991.181.211.542.442.733.824.546.487.3420001.121.151.492.402.673.724.376.166.9620011.111.131.482.372.653.644.326.076.8220021.101.111.472.362.623.604.295.986.77SSPS-WW-MS-9705 ©1997 Dataquest December 29,1997
COCO-QCOCOICO-vlC3tn@COCO-JoK..£3cCD(/>Table 2-13Estimated Flash Memory Price Trends—North American Bookings (12V; Volume: 10,000 per Year64Kx8 PDIP/PLCC64Kx8 TSOP128Kx8 PDIP/PLCC128Kx8 TSOP 12V128Kx8TSOP5V256Kx8 TSOP 12V256Kx8 TSOP/5V512Kx8 PDIP/PLCC512Kx8 TSOP 12V512Kx8 TSOP/5V512Kx8SSOP/3VIMbxS TSOP/12VlMbx8TSOP/5VlMbx8TSOP/3V2Mbx8TSOP/12V2Mbx8 TS0P/5V2Mbx8TSOP/3VQ4/972.332.592.352.432.864.814.314.685.535.234.617.857.777.7015.2215.0415.50Ql/982.192.432.252.242.644.413.884.184.654.474.147.397.256.9513.7813.4313.43Q2/982.152.382.192.212.554.263.804.084.314.183.897.106.896.6013.3812.8912.82Note: Actual negotiated market prices may vary from these prices because of manufacturer-specific factors such as quality, service, and volume discoas price guidelines.Source: Dataquest (December 1997)Q3/982.152.292.172.182.464.163.653.924.284.123.846.906.606.2312.7912.3712.30Q4/982.152.192.142.182.444.093.493.824.203.983.806.556.205.9512.1112.0111.8019982.162.322.192.202.524.233.714.004.364.193.926.996.746.4313.0212.6812.59Ql/992.152.172.142.162.404.053.473.774.153.943.746.386.125.7711.9811.8011.21Q2/992.152.172.142.162.374.033.443.734.103.903.706.306.005.6811.7011.4110.78Q3/992.152.172.132.152.363.983.413.684.053.843.666.255.905.5211.6511.3010.50Q111OCDOCD3roCOCOCO•vl
Market Statistics Tables 19Table 2-14Estimated Long-Range Flash Memory Price Trends—North American Bookings(12V; Volume: 10,000 per Year; Speed: 150ns; Dollars)64Kx8 PDIP/PLCC64Kx8 TSOP128Kx8 PDIP/PLCC128Kx8 TSOP 12V128Kx8 TSOP 5V256Kx8 TSOP 12V256Kx8 TSOP/5V512Kx8 PDIP/PLCC512Kx8 TSOP 12V512Kx8 TSOP/5V512Kx8 SSOP/3VlMbx8 TSOP/12VlMbx8 TSOP/5VlMbx8 TSOP/3V2Mbx8 TSOP/12V2Mbx8 TSOP/5V2Mbx8 TSOP/3V19982.162.322.192.202.524.233.714.004.364.193.926.996.746.4313.0212.6812.59Note: Actual negotiated market prices may vary from these prices because of manufacturer-specific factors such as quality, service, andvolume discount. These prices are intended for use as price guidelines.Source: Dataquest (December 1997)19992.152.172.142.162.374.003.423.704.083.873.676.265.945.6011.7211.4310.7120002.152.162.122.142.303.923.313.573.953.743.566.015.675.3511.4811.0510.1020012.152.162.112.122.283.873.283.513.913.693.515.955.625.3011.3710.9710.0120022.192.182.112.112.273.853.253.483.883.673.495.915.595.2811.3310.929.97SSPS-WW-l\/IS-9705 ©1997 Dataquest December 29,1997
COCO"DCOTable 2-15Estimated Gate Array Pricing—North American Production Bookings (Volume: 20,000 Units; BasOnly; NRE = Netlist to Prototype; Millicents per Gate)COICO-vloenGate Count TechnologyCMOS10-29.99K Gates1998 1999200030-59.99K Gates1998 1999200060-99.99K G1998 10.8 Micron20.0019.0019.0016.0015.0014.0014.0010.6 Micron0.5 Micron0.35 Micron22.0025.0034.0021.0024.0034.0020.0023.0034.0015.0021.0028.0014.0020.0026.0013.0020.0026.0016.0018.0020.00111@(OCO-vla03I—*•03CDcnNRE CMOS Average Charge ($K)Gate Count TechnologyCMOS0.8 Micron0.6 Micron0.5 Micron0.35 MicronNRE CMOS Average Charge ($K)43.00199822.0022.0024.0031.00105.0043.0010-29.99K Gates199921.0021.0022.0030.00103.0043.00200019.0019.0020.0029.00103.0053.001998NR30.0032.0038.00125.0051.00>300K Gates1999NR29.0032.0038.00120.0051.002000NR29.0032.0038.00120.0073.00Lead Time(Weeks)Production:4-104-104-104-10Prototype:NF1 = Not relevantNFlE = Nonrecurring engineering chargeNotes: The actual NRE may vary from these because of device amortization, testing, intellectual property rights, and other factors. Actual negotiatedfrom these because of manufacturer-specific factors such as intellectual property rights, alliances, service, package types, pad or core constraints, an1 million or greater, discount the above prices by a further 50 to 60 percent. For core-limited solutions with volumes greater than 10,000 units, CBICsgate arrays.Source: Dataquest (December 1997)1-47aCDoCD3loCOCOCO-vl
COCO•oCOTable 2-16Estimated CBIC Pricing—North American Production Bookings (Volume: 20,000 Units; Based onNRE = Netlist to Prototype; Millicents per Gate)COICO•~JoCJlCMOS0.8 Micron0.6 Micron0.5 Micron0.35 Micron10-29.99K Gates199824.0025.0027.0039.00199922.0024.0026.0037.00200021.0023.0026.0037.0030-59.99K Gates199816.0016.0024.0035.00199914.0015.0022.0034.00200013.0014.0020.0032.0060-99.99K G1998 111.00 112.00 119.00 124.00 2@COCO-vlaNRE CMOS Average Charge ($K)CMOS0,8 Micron0.6 Micron0.5 Micron0.35 MicronNRE CMOS Average Charge ($K)66.00199815.0014.0012.0011.00133.0065.0010-29.99K Gates199914.0013.0010.0010.00131.0065.00200012.0010.009.009.00131.0072.001998NR18.0015.009.00161.0071.00>300K Gates1999NR17.0014.008.00160.0071.002000NR15.0012.007.00158.0082.00Lead Time(Weeks)Production:6-146-146-146-14Prototype:3-6NH = Not relevantNRE = Nonrecurring engineering chargeNotes: The actual NRE may vary from these because of device amortization, testing, intellectual property rights, and otiier factors. Actual negotiatedfrom these because of manufacturer-specific factors such as intelleclual property rights, alliances, service, package types, pad or core constraints, an1 million or greater, discount the above prices by a further 50 to 60 percent. For core-limited solutions with volumes greater than 10,000 units, CBiCsgate arrays.Source: Dataquest (Decemtier 1997)8aCDCJCD3a-CDCOCOCO--J
For More Information...Evelyn Cronin, Senior Industry Analyst (408) 468-8075Internet addressevelyn.cronin@dataquest.comVia fax (408) 954-1780Dataquest Interactivehttp://www.dataquest.com<strong>DataQuest</strong>A Gartner Group CompanyThe content of this report represents our interpretation and analysis of ii\formation generally available to the publicor released by responsible individuals in the subject companies, but is not guaranteed as to accuracy or completeness.It does not contain material provided to us in confidence by our clients. Reproduction or disclosure in whole or inpart to other parties shall be made upon the written and express consent of Dataquest.©1997 Dataquest—Reproduction Prohibited
DATAQUEST WORLDWIDE OFFICESNORTH AMERICAWorldwide Headquarters251 River Oaks ParkwaySan Jose, California 95134-1913United StatesPhone: 1-408-468-8000Facsimile: 1-408-954-1780East Coast Research CenterNine Technology DriveRO. Box 5093Westborough, Massachusetts 01581-5093United StatesPhone: 1-508-871-5555Facsimile: 1-508-871-6262Dataquest Global Events3990 Westerly Place, Suite 100Newport Beach, California 92660United StatesPhone: 1-714-476-9117Facsimile: 1-714-476-9969DataquestA Gartner Group Company©1997 DataquestEUROPEEuropean HeadquartersTamesis, The GlantyEgham, Surrey TW20 9AWUnited KingdomPhone: +44 1784 431 611Facsimile: +44 1784 488 980Dataquest FranceImmeuble Defense Bergeres345, avenue Georges ClemenceauTSA 4000292882 - Nanterre CTC Cedex 9FrancePhone: +33 1 41 35 13 00Facsimile: +33 1 41 35 13 13Dataquest GermanyMartin-Kollar-Strasse 15D-81829 MiinchenGermanyPhone: +49 89 42 70 4-0Facsimile: +49 89 42 70 4-270JAPANJapan HeadquartersAobadai Hills 4-7-7AobadaiMeguro-ku, Tokyo 153JapanPhone: 81-3-3481-3670Facsimile: 81-3-3481-3644ASIA/PACIFICAsia/Pacific HeadquartersSuite 5904-7, Central Plaza18 Harbour Road, WanchaiHong KongPhone: 852-2824-6168Facsimile: 852-2824-6138Dataquest KoreaSuite 2407, Trade Tower159 Samsung-dong, Kangnam-guSeoul 135-729KoreaPhone: 822-551-1331Facsimile: 822-551-1330Dataquest TaiwanllF-2, No. 188, Section 5Nan King East RoadTaipeiTaiwan, R.O.C.Phone: 8862-756-0389Facsimile: 8862-756-2663Dataquest Singapore6 Temasek Boulevard, #26-02/03Suntec City Tower 4Singapore 038986Phone: 65-333-6773Facsimile: 65-333-6768Dataquest Thailand12/F, Vanissa Building29 Soi ChidlomPloenchit RoadPatumwan, Bangkok 10330ThailandPhone: 662-655-0577Facsimile: 662-655-0576Dataquest Australia80 Alfred StreetMilsons Point NSW 2061AustraliaPhone: 61-2-9941-4860Facsimile: 61-2-9941-4868
)FILE COPY:MARIA VALENZUELA<strong>DataQuest</strong>Nortli American Semiconductor PriceOutiooic—Fourtli Quarter 1997Market Statistics\ Program: Semiconductor Supply and Pricing WorldwideProduct Code: SSPS-WW-MS-9704Publication Date: September 29,1997Filing: Market Statistics
Nortli American Semiconductor PriceOutiooic—Fourtli Quarter 1997Market StatisticsProgram: Semiconductor Supply and Pricing WorldwideProduct Code: SSPS-WW-MS-9704Publication Date: September 29,1997Fiiing: Market Statistics
North American Semiconductor Price Outlool
Semiconductor Supply and Pricing WorldwideList of TablesTablePage2-1 Estimated Standard Logic Price Trends—North American Bookings 42-2 Estimated Long-Range Standard Logic Price Trends—North American Bookings 52-3 Estimated Microprocessor Price Trends—North AmericanBookings 62-4 Estimated Long-Range Microprocessor Price Trends—North American Bookings 82-5 Estimated DRAM Price Trends—North AmericanBookings 92-6 Estimated Long-Range DRAM Price Trends—North AmericanBookings 112-7 Estimated Static RAM Price Trends—North AmericanBookings 122-8 Estimated Long-Range Static RAM Price Trends—North American Bookings 132-9 Estimated ROM Price Trends—North American Bookings 142-10 Estimated Long-Range ROM Price Trends—North AmericanBookings 142-11 Estimated EPROM Price Trends—North AmericanBookings 152-12 Estimated Long-Range EPROM Price Trends—North AmericanBookings 152-13 Estimated Flash Memory Price Trends—North AmericanBookings 162-14 Estimated Long-Range Flash Memory Price Trends—North American Bookings 172-15 Estimated Gate Array Pricing—North AmericanProduction Bookings 182-16 Estimated CBIC Pricing—North American ProductionBookings 19SSPS-WW-l\/!S-9704 ©1997 Dataqu est September 29,1997
Chapter 1North American Semiconductor Price Outloolc—FourthQuarter 1997 ^^^^^^__^^^_^^^^Methodology and SourcesThis docviment provides information on and forecasts for the NorthAmerican bookings prices of more than 200 semiconductor devices.Dataquest collects price information on a quarterly basis from NorthAmerican suppliers and major buyers of these products. North Americanbookings price information is analyzed by Semiconductor Supply andPricing Worldwide (SSPS) analysts for consistency and reconciliation. Theinformation finally is rationalized with worldwide billings price data inassociation with product ar\alysts, resulting in the current forecast. Thisdocument includes associated long-range forecasts.For SSPS clients that use the SSPS online service through CompuServe, theprices presented here correlate with the quarterly and long-range pricetables dated September 1997 in the SSPS online service. Clients who wantto access the information via the World Wide Web can pay extra for aDataquest Interactive subscription, which allows users to access all theirdeliverables at their desktops. For additional product coverage and moredetailed product specifications, please refer to those sources.Price VariationsActual negotiated market prices may vary from these prices because ofmanufacturer-specific factors such as product quality, special features,service, delivery performance, volume discount, or other factors that mayenhance or detract from the value of a company's product. These pricesare intended for use as price guidelines.SSPS-WW-MS-9704©1997 Dataquest
Chapter 2IMarlcet Statistics TablesTables 2-1 through 2-16 show statistics on North American semiconductorprices.SSPS-WW-MS-9704©1997 Dataquest
Semiconductor Supply ant) Pricing WorldwideTable 2-1Estimated Standard Logic Price Trends—North American Bookings (Volume: 100,000 perYear; Package: PLCC; Dollars)Product74LSTTL74LS0074LS7474LS13874LS24474AC TTL74AC0074AC7474AC13874AC24474FTTL74F0074F7474F13874F24474HC CMOS74HC0074HC7474HC13874HC24474ALS TTL74ALSO074ALS7474ALS13874ALS24474AS TTL74AS0074AS7474AS13874AS24474BC*74BC0074BC24474BC37374ACT24474ACT24574ABT24474ABT245Ql0.130.160.170.240.170.200.290.400.130.150.180.220.110.160.170.210.140.160.220.300.190.190.400.630.200.530.550.420.440.580.62Q20.130.160.170.240.170.200.290.400.130.150.180.220.110.160.170.210.140.160.210.300.190.190.400.630.200.530.550.420.440.580.621997Q30.130.160.170.240.170.200.290.390.140.150.180.220.110.160.170.210.140.160.210.300.190.190.400.630.200.530.550.410.440.580.62Q40.130.160.170.240.170.200.290.390.140.150.180.220.110.160.170.210.140.160.210.300.190.190.400.630.200.530.550.410.440.570.611997Year0.130.160.170.240.170.200.290.390.140.150.180.220.110.160.170.210.140.160.210.300.190.190.400.630.200.530.550.410.440.580.62Ql0.130.160.180.240.150.190.280.360.130.150.180.230.120.150.170.220.140.160.200.270.190.190.400.620.190.480.500.390.400.530.57Q20.130.160.180.240.150.190.280.350.130.150.180.230.120.150.170.220.140.160.200.270.190.190.400.620.190.470.490.370.390.530.561998Q30.130.160.170.240.150.180.270.350.130.150.180.230.110.150.170.220.140.160.200.270.190.190.400.620.180.460.460.370.390.510.55Q40.130.160.170.240.140.170.270.350.130.150.180.230.110.150.170.220.140.160.200.270.190.190.400.620.170.440.460.360.370.480.521998Year0.130.160.170.240.150.190.280.350.130.150.180.220.110.150.170.210.140.160.200.270.190.190.400.620.190.470.480.370.390.510.55Lead Time(Weeks)"Pricing for 74BC excludes 74ABT and 74BCT.Note: Actual negotiated market prices may vary from tinese prices because of manufacturer-specific factors such as quality, service, andvolume discount. These prices are intended for use as price guidelines.Source: Dataquest (August 1997)3-63-63-63-63-63-63-63-63-63-63-63-63-63-63-63-63-63-63-63-63-63-63-63-63-63-63-63-63-63-63-6SSPS-WW-l\/IS-9704 ©1997 Dataquest September 29,1997
Market Statistics TablesTable 2-2Estimated Long-Range Standard Logic Price Trends—North American Bookings(Volume: 100,000 per Year; Package: PLCC; Dollars)Product74LSTTL74LS0074LS7474LS13874LS24474ACTTL74AC0074AC7474AC13874AC24474FTTL74F0074F7474F13874F24474HC CMOS74HC0074HC7474HC13874HC24474ALS TTL74ALS0074ALS7474ALS13874ALS24474AS TTL74ASO074AS7474AS13874AS24474BC»74BC0074BC24474BC37374ACT24474ACT24574ABT24474ABT24519970.130.160.170.240.170.200.290.390.140.150.180.220.110.160.170.210.140.160.210.300.190.190.400.630.200.530.550.410.440.580.62•Pricing for 74BC excludes 74ABT and 74BCT.Note: Actual negotiated market prices may vary from these prices because of manufacturer-specific factors such as quality, service, andvolume discount. These prices are intended for use i IS price guidelines.Source: Dataquest (August 1997)19980.130.160.170.240.150.190.280.350.130.150.180.220.110.150.170.210.140.160.200.270.190.190.400.620.190.470.480.370.390.510.5519990.130.160.170.240.140.180.260.340.130.150.180.220.110.150.170.210.140.160.190.250.190.190.400.610.180.450.440.350.360.470.5120000.130.160.170.240.140.170.250.320.130.150.180.220.110.150.170.210.140.160.190.240.190.190.400.60.170.440.420.330.350.450.4920010.130.160.170.240.130.170.240.320.130.150.180.220.110.150.170.210.140.160.190.240.190.190.400.60.170.430.410.320.350.440.48SSPS-WW-l\/IS-9704 ©1997 Dataquest September 29,1997
Z661. '62 J8quj8id9S ;s8nbB^BG Z661© t'OZe-S^-MM-SdSS"0§P-.c5;—;u>XNU1^J-0m3p.c3^CT.(TNNOl1j3ft.§aUlH-»^ ^ ^Qs-Itz>"vDOOoo8SoooVJuooot—*"I-»Ulw\sonooCDioofeooo4^ooooti.OJvjOlIOOJOSn»S-roz>VJ(jioooON01oooOlooaoONuOJ>;^|S3Ooou>vjoooCJt—*oooK)Oloo(Jju^UloOJ00nDIB-mz>CT^OOao(jriOOOOii:^OloooOl»—*o\ON•,M"ONOooohJ"ONooooK)'ONooooKJaoooJOOoboJOooboJO"ONoobo(OooboOJJD^3t±.c3Tl3(booOltoTi.naB-m^^ou>boVCVC.bototobotoOJb^fibototoboIOtobototobol:^boto00ov00tnnoOJot!jtn••a»§h-»VObot—*00VItnh-*00VJtn>—*fXV]tn»—*0000h-*•—*00VJtn•—*00VJtnh-*00*sjtnh-*00*otnt—*OOVJtntoexCTvOOtnnPtootiJtn•flp*s^Sio^ohJouolU•
C/3C/3-aIIODICO-NlC3•;^@COCO•vlOtuTable 2-3 (Continued)Estimated Microprocessor Price Trends—North American Bookings (Volume: 25,000 per Year; DoDevices—Ceramic PGA; Exceptions Noted)ProductPowerPC 601-80PowerPC 601400PowerPC 603-60Powe PC 603-133PowerPC 604-166PowerPC 604-225PowerPC 604-240Power PC 604-300Power PC 604-350Qi70.0080.0063.00125.00200.00400.00500.00NANAQ268.0075,0061.00113.00167.00400.00450.00NANA1997Q368.0075.0061.00110.00167.00325.00375.00400.00600.00EOL = End of lifsNA - Not availableNotsj Actual negotiated market prices may vary from these prices because of manufacturer-specific factors sucli as quality, service, and volume disco-as guidelines.Source: Dataquest (August 1997)Q468.0075.0060.00100.00160.00310.00325.00350.00550.001997Year68.5076.2561.25112.00173.50358.75412.50375.00575.00QiEOLEOL60.0090.00130.00280.00300.00325.00500.00Q2EOLEOL60.0090.00130.00265.00275.00300.00475.001998Q3EOLEOL60.0090.00130.00240.00250.00275.00450.00C/3CD3COCOCO
Semiconductor Supply and Pricing WorldwideTable 2-4Estimated Long-Range Microprocessor Price Trends—North American Bookings(Volume: 25,000 per Year; Dollars) (Package: 32/64 Bit Devices—Ceramic PGA;Exceptions Noted)Product68EC020-25 PQFP68EC030-25 PQFP68040-2568LC040-25 CQFP 184Pentiuin-75Pentium-90Pentium-100 3.3VPentium-lOO 2.9VPentium-120 3.3VPentiuin-120 2.9VPentium-133 3.3VPentiuin-133 2.9VPentium-150 3.3VPentium-150 2.9VPentiuin-166 3.3VPentium-200 3.3VPentium MMX 166 MHz 2.8V PGAPentium MMX 200 MHz 2.8V PGAPentium MMX 233 MHz 2.8V PGAPentium Pro-166CPentium Pro-180 256K CachePentium Pro-200 256K CachePentium Pro-200 512K CachePentium Pro-200 IM CachePentium H 233 MHz 512K CachePentium H 266 MHz 512K CachePentium H 300 MHz 512K CachePowerPC 601-80PowerPC 601-100PowerPC 603-80Powe PC 603-133PowerPC 604-166PowerPC 604-225PowerPC 604-240Power PC 604-300Power PC 604-35019978.0018.8123.7523.7570.0070.0072.5087.5086.2586.25102.50118.75120.00176.25176.25236.25227.50360.00426.67600.00387.50462.50989.002,600.00516.67633.331,153.3368.5076.2561.25112.00173.50358.75412.50375.00575.0019988.0018.7522.0022.00EOLEOLEOLEOLEOLEOLEOLEOLEOLEOLEOLEOL92.50120.00190.00EOL380.00450.00985.002,600.00317.50337.50437.50EOLEOL60.0090.00130.00253.75266.25287.50461.2519998.0018.7522.0022.00EOLEOLEOLEOLEOLEOLEOLEOLEOLEOLEOLEOL90.00120.00190.00EOL225.00375.00635.002,600.00220.00250.00320.00EOLEOLEOLEOLEOLEOLEOL250.00425.0020008.0018.7522.0022.00EOLEOLEOLEOLEOLEOLEOLEOLEOLEOLEOLEOLEOLEOLEOLEOLEOLEOLEOL2,600.00220.00250.00320.00EOL = End of lifeNA = Not availableNote: Actual negotiated market prices may vary from these prices because of manufacturer-specific factors such as quality, service, andvolume discount. These prices are Intended for use as guidelines.Source: Dataquest (August 1997)EOLEOLEOLEOLEOLEOLEOLEOLEOL20018.0018.7522.0022.00EOLEOLEOLEOLEOLEOLEOLEOLEOLEOLEOLEOLEOLEOLEOLEOLEOLEOLEOLEOLEOLEOLEOLEOLEOLEOLEOLEOLEOLEOLEOLEOLSSPS-WW-MS-9704 ©1997 Dataquest September 29,1997
Market Statistics TablesO O a O O O Q O K O O Q O O O Q O O O a O C X i a O a O Q O O O O O Q O a O Q O C X l Q O O O Q O Q O Q O Q O O O C nI I I I I I I I I I I I I I I I I I I I I I I I I I I I I?H >H(-Nt^a\ ^^ CT\ t^•>:(; tN Tj; tv.o o o o oen CO CO CD CO0^ •^ CS ov O '*! I>«•l ts csio m o N O u n t v C v o i N . o t - N O O ' ^ o o o o u i N D i n o or N . . - i ' ^ c o T - ; ^ _ O N c q o N c o o N c o p ' ^ p p o O i - < p c s c s i nN D N l s D t v l t ^ t v ^ K t s l t v t N t ' s K o o . - H C S t l O O ' ^ i - H C N i s D O N O vcsr>lcscscscN'-icscocoNOt^cs^i-i,-icSeoDC/3• VaB^H;5t;2"SoUtnbO•IHoPQrau•fl01oZIIarlOla3a&Na5CV|900COCNCOCOCN0^s COcs CSNO t-HCO CO 5:CN CS CN CS5iCNi-HCOCNNOCNCNin•5fCNtxooCNIV00CNt-t O f~. •^ CTNin CO CN NO pCNJ CN CN CNJ COot-tc^ gNOin0tv•^•=J;LDrHtv^ Oint^NO0KONCv tN.ov£>CNt>; NO00i>xCONOtViri• ^NOCNCvNOt^in1—Ii>NNO LnNO Ots! isl• *00tv0ONin0t^0 0 0 0 000 p in p T->.pT-;po i c N C N C N C N t ^ N D t N l v d o c i l s I o Din m in NO o COin CO CO NO CO i>NCN CNJ c-i CS CO 00O O O C N N O N O N O C O C ON O ^ T j H o q c o N O N O p pc N c N c N c N c o o o o d o c i o c JooCN 00 NO CO NO COin •^ rj< t^ 00 t>Oci Oci 0C> ON 0C3 ONinINin NO LD NO IT) NO^j^ ^ji ^j^ ^^ ^^ ^rCN CS CN CN CN CNCO CO CO CO CO CO00 intv CN• ^• ^COinNO[VCOc o N o c o N o c o N o i n t ^ o o00 cO op CO 00 CO CO ON CO inC O C O C O C O C O C O N ^ O N T - H O C )C O C O C O C 0 C O C O r H t - ( C O C O5;00mc^mONm^ ON ^ ON ^ ON m CO txT-H ^ 00 in CN C^C N C O C S C O C N C O O O O ' 5 J a>
COCO"DCOIkCOICO•vj@CO(O•vjC3tu•—IcuTable 2-5Estimated DRAM Price Trends—North American Bookings (Contract Volume; U.S. Dollars)*Product2Mbx36 SIMM 60ns 5V EDO4Mbx32 SIMM 60ns 5V EDO4Mbx36 SIMM 60ns 5V EDO8Mbx32 SIMM 60ns 5V EDO8Mbx36 SIMM 60ns 5V EDOlMbx64 60ns 3.3V EDO2Mbx64 60ns 3.3V EDO4Mbx64 60ns 3.3V EDOlMbx64 3.3 V SDRAM2Mbx64 3,3V SDRAM4Mbx64 3.3V SDRAM256Kxl6 VRAM 70ns SOP256Kx32 66 MHz 3.3 V SGRAMQl41.5072.2082.75141.20164.2542.1379.25149.0042.1379.25149.0011.6010.00Q243.1872.2083.21143.07165.1240.5878.60141.0040.5878.60141.0010.058.04'Contract volume is at least 100,000 per order, except for VRAMs.Note: Actual negotiated market prices may vary from these prices because at manufactservice, and volume discount. These prices are intended for use asSource: Oataquest (August 1997)1997Q338.9560.3278.03120.88146.7731.0560.98125.0035.0268.80132.479.755.94Q438.3560.1276.95119.76145.1130.8460.58123.7534.5866.11129.989.155.691997Year40.5066.2180.24131.23155.3136.1569.85134.6938.0873.19138.1110.147.42Ql37.8859.4273.09118.06142.2631.5061.22120.8133.5064.15124.459.105.50Q237.1258.7472.83115.98139.2030.8459.32118.0832.2762.58121.809.055.381998Q336.5657.9971.64114.59138.1129.8858.58116.5331.6361.20119.089.005.13COCD•al\3COCOCO•vj
Market Statistics Tables 11Table 2-6Estimated Long-Range DRAM Price Trends—North American Bookings (ContractVolume; U.S. Dollars)*Product4Mbxl DRAM 70ns SOJ 5VlMbx4 DRAM 60ns SOJ 5V FPMlMbx4 DRAM 60ns SOJ 5V EDO512Kx8 DRAM 70ns 5V256Kxl6 DRAM 70ns SOJ 5V4Mbx4 DRAM 60 ns SOJ 5V FPM4Mbx4 DRAM 60ns SOJ 5V EDOlMbxl6 DRAM 60ns TSOP 5V FPMlMbxl6 DRAM 60ns TSOP 5V EDOlMbxl6 3.3V SDRAM2Mbx8 DRAM 60ns TSOP 5V FPM2Mbx8 DRAM SDRAM 3.3V16Mbx4 DRAM SOJ 60ns 3.3V EDO16Mbx4 DRAM SOJ 3.3V SDRAM8Mbx8 DRAM SOJ 60ns 3.3V EDO8Mbx8 DRAM SOJ 3.3V SDRAM4Mbxl6 DRAM SOJ 60ns 3.3V EDO4Mbxl6 DRAM SOJ 3.3V SDRAMlMbx32 SIMM 60ns 5V FPMlMbx36 SIMM 60ns 5V FPM2Mbx32 SIMM 60ns 5V FPM2Mbx36 SIMM 60ns 5V FPM4Mbx32 SIMM 60ns 5V FPM4Mbx36 SIMM 60ns 5V FPM8Mbx32 SIMM 60ns 5V FPM8Mbx36 SIMM 60ns 5V FPMlMbx32 SIMM 60ns 5V EDOlMbx36 SIMM 60ns 5V EDO2Mbx32 SIMM 60ns 5V EDO2Mbx36 SIMM 60ns 5V EDO4Mbx32 SIMM 60ns 5V EDO4Mbx36 SIMM 60ns 5V EDO8Mbx32 SIMM 60ns 5V EDO8Mbx36 SIMM 60ns 5V EDOlMbx64 60ns 3.3V EDO2Mbx64 60ns 3.3V EDO4Mbx64 60ns 3.3V EDOlMbx64 3.3V SDRAM2Mbx64 3.3V SDRAM4Mbx64 3.3V SDRAM256Kxl6 VRAM 70ns SOP256Kx32 66 MHz 3.3V SGRAM19972.512.302.272.643.097.907.737.637.429.008.029.0052.1453.1952.1453.1952.1453.1918.4520.8334.5740.7966.7380.24131.95156.1318.2320.7234.0140.5066.2180.24131.23155.3136.1569.85134.6938.0873.19138.1110.147.4219982.432.362.312.422.897.096.727.086.427.587.107.4230.7730.4930.7730.4930.7730.4917.5420.3231.3937.9059.5473.57119.65140.9716.6019.4030.4936.9058.3971.95115.69139.2830.4459.19117.2932.1061.89120.529.015.2519992.502.452.402.373.006.706.616.706.636.906.706.7526.8826.7426.8826.7426.8826.7418.0021.5032.0039.0060.0076.00124.00148.0015.7518.5728.7535.5556.7568.65111.89135.9928.6256.25111.9428.5056.12111.558.604.7520002.552.552.502.503.607.707.607.707.606.857.706.6731.0025.6825.9325.6825.9325.6818.5022.0033.0041.0062.0079.00126.00156.0016.9519.7530.6338.1159.9872.85122.00144.0027.9554.95109.8527.8554.56109.679.254.5020012.652.652.652.663.918.508.508.508.506.808.506.6032.0024.9725.1124.9725.1124.9719.0022.0033.0043.0070.0085.00130.00168.0019.0021.8037.5041.4572.1283.00141.50165.0027.4054.25107.5027.2254.12107.35'Contract volume is at least 100,000 per order, except for VRAMs.Note: Actual negotiated market prices may vary from these prices becauseof manufacturer-specific factors such as quality, service, and volume discount. These prices are Intended for use asSource: Dataquest (August 1997)SSPS-WW-l\^S-9704 ©1997 Dataquest September 29,199710.004.22
12 Semiconductor Supply and Pricing WorldwideTable 2-7Estimated Static RAM Price Trends—North American Bookings (Volume: SlowSRAM—50,000 per Year; Fast SRAM—20,000 per Year; Package: PDIP; Dollars)Product16Kx4 35ns8Kx8 25ns8Kx8 100-120ns64Kx4 10ns64Kx4 25ns32Kx8 12ns32Kx9 12ns Burst32Kx8,15ns, 5V32Kx8, 15ns, 3.3V32Kx8 25ns32Kx8 70-lOOns SOJ64Kx8 12ns Burst256Kx4 20ns128Kx8,15 ns128Kx8, 20 ns128Kx8 25ns128Kx8 70-lOOns SOJ32Kx3215ns, 3.3V PQFP32Kx32 8ns 3.3V PBSynch64Kx32 8ns 3.3V PBSynch256Kxl6 70-lOOns256Kxl6 25ns512Kx8 70ns512Kx8 25nsQl2.191.181.397.002.061.503.671.211.261.201.5315.155.224.674.824.824.653.593.296.2919.1520.4117.9622.00Q22.171.161.316.281.901.423.421.171.181.161.4014.104.744.304.504.503.783.463.175.8017.9018.7016.5220.721997Q32.161.071.205.741.841.333.321.121.121.121.3414.034.323.934.024.023.153.402.835.4815.1918.1113.9718.37Q42.141.041.205.401.801.263.311.121.121.121.3013.504.153.683.823.823.053.272.775.3014.6017.4813.3117.441997Year2.171.111.286.111.901.383.431.151.171.151.3914.204.614.144.294.293.663.433.025.7216.7118.6715.4419.63Ql2.091.041.205.041.701.273.271.101.101.091.2513.353.853.493.543.543.023.142.725.0313.5716.7913.1116.68Q22.091.031.204.891.701.273.251.101.101.091.2412.203.793.363.413.413.013.092.684.9413.0016.1112.6515.881998Q32.091.031.174.831.601.263.231.091.101.081.2211.803.603.213.253.252.972.952.634.7012.5715.1312.2614.75Q42.111.031.174.831.601.263.211.091.101.081.2111.353.563.153.183.182.952.902.594.5412.3314.5011.8113.701998Year2.101.031.184.901.651.273.241.101.101.091.2312.183.703.303.343.342.993.022.654.8012.8715.6312.4815.25Lead Time(Weeks)Note: Actual negotiated market prices may vary from these prices because of manufacturer-specific factors such as quality, service, andvolume discount. These prices are intended for use as price guidelines.Source: Dataquest (August 1997)2-42-42-42-42-42-42-42-42-42-42A2-42-43-83-83-83-83-63-63-63-83-83-83-8SSPS-WW-MS-9704 ©1997 Dataquest September 29,1997
Market Statistics Tables 13Table 2-8Estimated Long-Range Static RAM Price Trends—North American Bookings (Volume:Slow SRAM—50,000 per Year; Fast SRAM—20,000 per Year; Package: PDIF; Dollars)Product16Kx4 35ns8Kx8 25ns8Kx8 100-120ns64Kx4 10ns64Kx4 25ns32Kx8 12ns32Kx9 12ns Burst32Kx8,15ns, 5V32Kx8, 15ns, 3.3V32Kx8 25ns32Kx8 70-lOOns SOJ64Kx8 12ns Burst256Kx4 20ns128Kx8,15ns128Kx8, 20ns128Kx8 25ns128Kx8 70-lOOns SOJ32Kx32 15ns, 3.3V PQFP32Kx32 8ns 3.3V PBSynch64Kx32 8ns 3.3V PBSynch256Kxl6 70-lOOns256Kxl6 25ns512Kx8 70ns512Kx8 25nsNote: Actual negotiated market prices may vary from these prices because of manufacturer-specific factors such as quality, service, andvolume discount. These prices are intended for use as price guidelines.Source: Dataquest (August 1997)19972.171.111.286.111.901.383.431.151.171.151.3914.204.614.144.294.293.663.433.025.7216.7118.6715.4419.6319982.101.031.184.901.651.273.241.101.101.091.2312.183.703.303.343.342.993.022.654.8012.8715.6312.4815.2519992.121.001.165.801.701.263.201.151.101.151.3511.013.453.143.163.162.942.903.204.4311.0012.5511.0012.5520002.121.001.166.401.801.453.351.301.351.301.4012.154.603.123.143.142.943.504.004.1710.4211.3710.5111.3720012.161.301.406.591.951.703.551.451.451.451.6513.005.103.603.603.603.604.004.704.5010.2010.4010.2410.40SSPS-WW-l\/IS-9704 ©1997 Dataquest September 29,1997
iASemiconductor Supply and Pricing WorldwideTable 2-9Estimated ROM Price Trends—^North American Bookings (Speed/Package: 2Mb Density—200ns and Above; 32-pinPDIP) (Volume: 50,000 per Year; Dollars)Product128Kx8 ROM64Kxl6 ROM256Kx8 ROM512Kx8 ROM256Kxl6 ROM'lMbX8 ROM^lMbxl6ROM2Mbx8 ROM2Mbxl6 ROM4Mbx8 ROM4Mbxl6 ROM8Mbx8 ROMQl1.742.002.203.103.104.006.005.8712.0012.0016.0015.50Q21.691.922.183.003.003.905.805.7211.7511.6015.8015.301997Q31.691.882.142.902.903.805.705.7011.5011.4015.4015.20Q41.641.802.142.802.803.705.655.6511.3011.3015.0014.901997Year1.691.902.172.952.953.855.795.7411.6411.5815.5515.23Ql1.581.732.102.702.703.625.555.5511.0011.0014.5014.401998Q21.581.732.102.702.703.625.555.5511.0011.0014.5014.40Q31.511.662.052.662.663.535.465.4610.7410.7414.0013.90Q41.511.662.052.662.663.535.465.4610.7410.7414.0013.901998Year1.551.702.082.682.683.585.515.5110.8710.8714.2514.15Lead Hme(Weeks)^256Kx16 ROM: 150ns and above; 40-pln PDIP^1Mbx8 ROM: 150ns and above; 32-pln SOPNote: Actual negotiated market prices may vary from these prices because of manufacturer-specific factors such as quality, sen^ice, andvolume discount These prices are intended for use as price guidelines.Source: Dataquest (August 1997)4-84-84-84-84-84-84-84-84-84-84-94-9Table 2-10Estimated Long-Range ROM Price Trends—North American Bookings (Speed/Package:2Mb Density—^200n5 and Above;32-pin PDIP) (Volume: 50,000 per Year; Dollars)Product128Kx8 ROM64Kxl6 ROM256Kx8 ROM512Kx8 ROM256Kxl6 ROM'lMbx8 ROM^lMbxl6 ROM2Mbx8 ROM2Mbxl6 ROM4Mbx8 ROM4Mbxl6 ROM8Mbx8 ROM19971.691.902.172.952.953.855.795.7411.6411.5815.5515.23^256Kx16 ROM: 150ns and above; 40-pin PDIP^IMbxB ROM: 150ns and above; 32-pin SOPNote: Actual negotiated market prices may vary from these prices because of manufacturer-specific factors such as quality, service, andvolume discount. These prices are intended for use as price guidelines.Source: Dataquest (August 1997)19981.551.702.082.682.683.585.515.5110.8710.8714.2514.1519991.501.632.012.602.603.485.385.4010.6010.6013.8013.6520001.471.611.982.562.563.425.305.3010.5010.5013.5013.4020011.441.591.962.522.523.395.225.2210.3510.3513.5013.27SSPS-WW-l\/IS-9704 ©1997 Dataquest September 29,1997
Market Statistics Tables 15Table 2-11Estimated EPROM Price Trends—North American Bookings (Volume: 50,000 per Year;Package: Windowed CERDIP; Speed: 150ns and Above; Dollars)Product32Kx8 EPROM64Kx8 EPROM128Kx8 EPROM256Kx8 EPROM128Kxl6 EPROM512Kx8 EPROM256Kxl6 EPROMlMbx8 EPROM512Kxl6 EPROMQl1.371.431.932.773.654.977.588.509.50Q21.361.431.902.773.314.686.388.409.451997Q31.331.391.832.753.204.586.248.309.40Q41.321.391.802.733.134.516.158.209.301997Year1.351.411.872.763.324.696.598.359.41Ql1.321.381.732.683.084.386.108.159.20Q21.291.361.732.663.034.325.788.109.151998Q31.281.331.702.522.824.205.438.059.10Q41.271.311.702.502.804.175.088.009.051998Year1.291.341.722.592.934.265.598.089.13Lead Time(Weeks)Note: Actual negotiated market prices may vary from these prices because of manufacturer-specific factors such as quality, service, andvolume discount. These prices are intended for use as price guidelines.Source: Dataquest (August 1997)2-32-32-32-32-32-32-32-32-3Table 2-12Estimated Long-Range EPROM Price Trends—North American Bookings (Volume:50,000 per Year; Package: Windowed CERDIP; Speed: 150iw and Above; Dollars)Product32Kx8 EPROM64Kx8 EPROM128Kx8 EPROM256Kx8 EPROM128Kxl6 EPROM512Kx8 EPROM256Kxl6 EPROMlMbx8 EPROM512Kxl6 EPROM19971.351.411.872.763.324.696.598.359.41Note: Actual negotiated market prices may vary from these prices because of manufacturer-specific factors such as quality, service, andvolume discount. These prices are Intended for use as price guidelines.Source: Dataquest (August 1997)19981.291.341.722.592.934.265.598.089.1319991.221.291.682.452.794.145.017.988.9420001.201.261.632.392.724.084.937.898.8720011.201.251.602.372.654.014.887.818.79SSPS-WW-l\/iS-9704 ©1997 Dataquest September 29,1997
16 Semiconductor Supply and Pricing WorldwideTable 2-13Estimated Flash Memory Price Trends—^North American Bookings (12V; Volume: 10,000per Year; Speed: 150ns; Dollars)Product64Kx8 PDIP/PLCC64Kx8 TSOP128Kx8 PDIP/PLCC128Kx8 TSOP 12V128Kx8TSOP5V256Kx8 TSOP 12V256Kx8 TSOP/5V512Kx8 PDIP/PLCC512Kx8 TSOP 12V512Kx8 TSOP/5V512Kx8 SSOP/3VlMbx8 TSOP/12VlMbx8TSOP/5VlMbx8 TSOP/3V2Mbx8 TSOP/12V2Mbx8 TSOP/5V2Mbx8 TSOP/3VQl2.752.832.582.803.185.575.305.606.206.287.6310.0710.2012.0018.1518.5020.00Q22.612.682.362.543.055.004.645.175.905.755.708.648.609.1817.1616.9717.711997Q32.442.632.352.442.924.914.464.885.635.384.778.348.228.1216.1215.9616.52Q42.332.592.352.432.864.814.314.685.535.234.617.857.T77.7015.2215.0415.501997Year2.532.682.422.553.005.074.685.085.825.665.688.738.709.2516.6616.6217.43Ql2.192.432.262.242.644.513.884.294.714.634.377.417.327.1813.8913.8113.81Q22.152.382.192.212.544.423.804.174.394.314.077.136.936.8413.4213.2713.191998Q32.152.292.172.182.454.323.684.014.394.264.046.946.646.5212.8912.7312.54Q42.152.192.142.182.424.093.513.824.254.114.016.596.276.1912.2212.1011.951998Year2.162.322.192.202.514.333.724.074.434.334.127.026.796.6813.1012.9812.87Lead Time(Weeks)Note: Actual negotiated marl
Market Statistics Tables 17Table 2-14Estimated Long-Range Flash Memory Price Trends—North American Bookings(12V; Volume: 10,000 per Year; Speed: 150ns; Dollars)Product64Kx8 PDIP/PLCC64Kx8 TSOP128Kx8 PDIP/PLCC128Kx8 TSOP 12V128Kx8 TSOP 5V256Kx8 TSOP 12V256Kx8 TSOP/5V512Kx8 PDIP/PLCC512Kx8 TSOP 12V512Kx8 TSOP/5V512Kx8 SSOP/3VlMbx8 TSOP/12VlMbx8 TSOP/5VlMbx8 TSOP/3V2Mbx8TSOP/12V2Mbx8 TSOP/5V2Mbx8 TSOP/3V19972.532.682.422.553.005.074.685.085.825.665.688.738.709.2516.6616.6217.43Note: Actual negotiated market prices may vary from these prices because of manufacturer-specific factors such as quality, service, andvolume discount. These prices are intended for use as price guidelines.Source: Dataquest (August 1997)19982.162.322.192.202.514.333.724.074.434.334.127.026.796.6813.1012.9812.8719992.152.182.132.162.354.003.443.724.144.003.876.306.005.9411.7511.4410.8820002.142.172.122.152.303.903.373.604.033.883.746.175.875.7910.8510.6510.1120012.142.162.122.152.273.863.323.543.893.773.666.025.755.5610.2610.119.81SSPS-WW-IVIS-9704 ©1997 Dataquest September 29,1997
18 Semiconductor Supply and Pricing WorldwideTable 2-15Estimated Gate Array Pricing—North American Production Bookings (Volume: 20,000Units; Based on Utilized Gates Only; NRE = Netlist to Prototype; Millicents per Gate)Gate CountTechnologyCMOS0.8 Micron0.6 Micron0.5 Micron10-29.99K Gates199721.0024.0026.00199820.0023.0025.00199919.0022.0024.0030-59.99K Gates199717.0017.0022.00199816.0015.0021.00199914.0014.0020.0060-99.99K Gates1997 199815.00 14.0017.00 16.0020.00 18.00199913.0015.0017.00Lead Time(Weeks)Production:4-124-124-120.35 Micron36.0034.0034.0033.0029.0028.0021.0020.0019.004-12Prototypes:NRE CMOSAverageCharge ($K)44.0044.0043.0054.0052.0052.0074.0073.0073.001-4Gate CountTechnologyCMOS0.8 Micron0.6 Micron100-299.99K Gates199724.0023.00199822.0022.00199921.0021.00>300K Gates1997NR30.001998NR30.001999NR29.00Lead Time(Weeks)Production:4-124-120.5 Micron0.35 Micron27.0032.0024.0031.0022.0030.0033.0041.0032.0039.0032.0038.004-124-12NRE CMOSAverageCharge ($K)107.00106.00105.00123.00120.00120.00Prototypes:NR= Not relevantNRE = Nonrecurring engineering chargeNotes: The actual NRE may vary from these because of device amortization, testing, intellectual property rights,and other factors. Actualnegotiated market prices may vary substantially from these because of manufacturer-specific factors such as intellectual property rights,alliances, service, package types, pad or core constraints, and volume discount. For volumes of 1 million or greater, discount the aboveprices by a further 50 to 60 percent. For core-limited solutions with volumes greater than 10,000 units, CBICs may be more cost-effectivethan gate arrays.Source: Dataquest (August 1997)1-4SSPS-WW-MS-9704 ©1997 Dataquest September 29,1997
Market Statistics Tables 19Table 2-16Estimated CBIC Pricing—North American Production Bookings (Volume: 20,000 Units;Based on Utilized Gates Only; NRE = Netlist to Prototype; Millicents per Gate)Gate CountTechnologyCMOS0.8 Micron0.6 Micron0.5 Micron0.35 Micron10-29.99K Gates199725.0026.0028.0040.00199824.0025.0027.0039.00199922.0024.0026.0038.0030-59.99K Gates199717.0018.0025.0038.00199816.0016.0024.0035.00199914.0015.0022.0034.0060-99.99K Gates199713.0013.0020.0025.00199811.0012.0018.0024.00199910.0010.0017.0022.00Lead Hme(Weeks)Production:7-157-157-157-15Prototypes:NRE CMOSAverageCharge ($K)68.0067.0065.0072.0072.0071.0083.0083.0083.003-6Gate CountTechnologyCMOS0.8 Micron0.6 Micron0.5 Micron0.35 Micron100-299.99K Gates199717.0015.0014.0012.00199815.0014.0012.0011.00199914.0013.0010.0010.00>300K Gates1997NR19.0017.0011.001998NR18.0015.009.001999NR17.0014.008.00Lead Time(Weeks)Production:7-157-157-157-15NRE CMOSAverageCharge ($K)133.00132.00132.00163.00161.00160.00Prototypes:NR = Not relevantNRE = Nonrecurring engineering chargeNotes: The actual NRE may vary from these because of device amortization, testing, intellectual property rights, and other factors. Actualnegotiated market prices may vary substantially from these because of manufacturer-specific factors such as intellectual property rights,alliances, service, package types, pad or core constraints, and volume discount. For volumes of 1 million or greater, discount the aboveprices by a further 50 to 60 percent. For core-limited solutions with volumes greater than 10,000 units, CBICs may be more cost-effectivethan gate arrays.Source: Dataquest (August 1997)3-6SSPS-WW-MS-9704 ©1997 Dataquest September 29,1997
DataquestA Gartner Group CompanyFor More Information...Evelyn Cronin, Senior Industry Analyst (408) 468-8075Internet addressevelyn.cronin@dataquest.comVia fax (408) 954-1780Dataquest Interactivehttp://www.dataquest.comThe content of this report represents our interpretation and analysis of information generally available to the publicor released by responsible individuals in the subject companies, but is not guaranteed as to accuracy or completeness.It does not contain material provided to us in confidence by our clients. Reproduction or disclosure in whole or inpart to other parties shall be made upon the written and express consent of Dataquest.©1997 Dataquest—Reproduction ProhibitedDataquest is a registered trademark of AC. Nielsen Company
DATAQUEST WORLDWIDE OFFICESNORTH AMERICAWorldwide Headquarters251 River Oaks ParkwaySan Jose, California 95134-1913United StatesPhone: 1-108-468-8000Facsimile: 1-408-954-1780East Coast Research CenterNine Technology DrivePO. Box 5093Westborough, Massachusetts 01581-5093United StatesPhone: 1-508-871-5555Facsimile: 1-508-871-6262Dataquest Global Events3990 Westerly Place, Suite 100Newport Beach, CaUfomia 92660United StatesPhone: 1-714-476-9117Facsimile: 1-714476-9969DataquestA Gartner Group Company©1997 DataquestEUROPEEuropean HeadquartersTamesis, The GlantyEgham, Surrey TW20 9AWUnited KingdomPhone:+44 1784 431 611Facsimile: +44 1784 488 980Dataquest FranceImmeuble Defense Bergferes345, avenue Georges Cl&nenceauTSA 4000292882 - Nanterre CTC Cedex 9FrancePhone: +33 1 41 35 13 00Facsimile: +33 1 41 35 13 13Dataquest GermanyMartin-Kollar-Strasse 15D-81829 MiinchenGermanyPhone: +49 89 42 70 4-0Facsimile: +49 89 42 70 4-270,JAPANJapan HeadquartersAobadai Hills 4-7-7AobadaiMeguro-ku, Tokyo 153JapanPhone: 81-3-3481-3670Facsimile: 81-3-3481-3644ASIA/PACIFICAsia/Pacific HeadquartersSuite 5904-7, Central Plaza18 Harbour Road, WanchaiHong KongPhone: 852-2824-6168Facsimile: 852-2824-6138Dataquest KoreaSuite 2407, Trade Tower159 Samsung-dong, Kangnam-guSeoul 135-729KoreaPhone: 822-551-1331Facsimile: 822-551-1330Dataquest TaiwanllF-2, No. 188, Section 5Nan King East RoadTaipeiTaiwan, R.O.C.Phone: 8862-756-0389Facsimile: 8862-756-2663Dataquest Singapore105 Cecil Street#06-01/02 The OctagonSingapore 069534Phone: 65-227-1213Facsimile: 65-227-4607Dataquest Thailand12/F, Vanissa Building29 Soi ChidlomPloenchit RoadPatumwan, Bangkok 10330ThailandPhone: 662-655-0577Facsimile: 662-655-0576Dataquest Australia80 Alfred StreetMilsons Point NSW 2061AustraliaPhone: 61-2-9941-4860Facsimile: 61-2-9941-4868
FILE COPY:MARIA VALENZUELA<strong>DataQuest</strong>Nortli American Semiconductor PriceOutloolc—Tliird Quarter 1997Market StatisticsProgram: Semiconductor Supply and Pricing WorldwideProduct Code: SSPS-WW-MS-9703Publication Date: June 23,1997Filing: Market Statistics
Nortli American Semiconductor PriceOutlooic—Tliird Quarter 1997Market StatisticsProgram: Semiconductor Supply and Pricing WorldwideProduct Code: SSPS-WW-MS-9703Publication Date: June 23,1997Filing: Market Statistics
North American Semiconductor Price Outlook—Third Quarter 1997iTable of ContentsPage1. North American Semiconductor Price Outlook—Third Quarter 1997 1Methodology and Sources 1Price Variations 12. Market Statistics Tables 3SSPS-WW-l\/IS-9703 ©1997Dataquest June 23,1997
Semiconductor Supply and Pricing WorldwideList of TablesTablePage2-1 Estimated Standard Logic Price Trends—North AmericanBookings 32-2 Estimated Long-Range Standard Logic Price Trends—NorthAmerican Bookings 42-3 Estimated Microprocessor Price Trends—North AmericanBookings 52-4 Estimated Long-Range Microprocessor Price Trends—NorthAmerican Bookings 62-5 Estimated DRAM Price Trends—North American Bookings 72-6 Estimated Long-Range DRAM Price Trends—NorthAmerican Bookings 92-7 Estimated Static RAM Price Trends—North American Bookings... 102-8 Estimated Long-Range Static RAM Price Trends—NorthAm^erican Bookings 112-9 Estimated ROM Price Trends—North American Bookings 122-10 Estimated Long-Range ROM Price Trends—NorthAmerican Bookings 122-11 Estimated EPROM Price Trends—North American Bookings 132-12 Estimated Long-Range EPROM Price Trends—NorthAmerican Bookings 132-13 Estimated Flash Memory Price Trends—North Americanookings 142-14 Estimated Long-Range Flash Memory Price Trends—NorthAmerican Bookings 152-15 Estimated Gate Array Pricing—North American ProductionBookings 162-16 Estimated CBIC Pricing—North American Production Bookings.. 17SSPS-WW-MS-9703 ©1997 Dataquest June 23,1997
Chapter 1North American Semiconductor Price Outloolc—Third Quarter 1997 ^-^—^^»—^^——Methodology and SourcesThis document provides information on and forecasts for the NorthAmerican bookings prices of more than 200 semiconductor devices.Dataquest collects price information on a quarterly basis from NorthAmerican suppliers and major buyers of these products. North Americanbookings price information is analyzed by Semiconductor Supply andPricing Worldwide (SSPS) analysts for consistency and reconciliation. Theinformation finally is rationalized with worldwide billings price data inassociation with product analysts, resulting in the current forecast. Thisdocument includes associated long-range forecasts.For SSPS clients that use the SSPS online service through CompuServe, theprices presented here correlate with the quarterly and long-range pricetables dated June 1997 in the SSPS online service. Clients who want toaccess the information via the World Wide Web can pay extra for aDataquest Interactive subscription, which allows users to access all theirdeliverables at their desktops. For additional product coverage and moredetailed product specifications, please refer to those sources.Price VariationsActual negotiated market prices may vary from these prices because ofmanufacturer-specific factors such as product quality, special features,service, delivery performance, volume discount, or other factors that mayenhance or detract from the value of a company's product. These pricesare intended for use as price guidelines.SSPS-WW-MS-9703©1997 Dataquest
Chapter 2Market Statistics TablesTable 2-1Estimated Standard Logic Price Trends—North American Bookings(Volume: 100,000 per Year; Package: PLCC; Dollars)Product74LS TTL74LS0074LS7474LS13874LS24474AC TTL74AC0074AC7474AC13874AC24474FTTL74F0074F7474F13874F24474HC CMOS74HC0074HC7474HC13874HC24474ALS TTL74ALS0074ALS7474ALS13874ALS24474AS TTL74AS0074AS7474AS13874AS24474BC»74BC0074BC24474BC37374ACT24474ACT24574ABT24474ABT2451997Qi0.130.160.170.240.170.200.290.400.130.150.180.220.110.160.170.210.140.160.220.300.190.190.400.630.200.530.550.420.440.580.62Q20.130.160.170.240.170.200.290.400.130.150.180.220.110.160.170.210.140.160.210.300.190.190.400.630.200.530.550.420.440.580.62Q30.130.160.170.240.170.200.290.390.140.150.180.220.110.160.170.210.140.160.210.300.190.190.400.630.200.530.550.410.440.580.62Q40.130.160.170.240.170.200.290.390.140.150.180.220.110.160.170.210.140.160.210.300.190.190.400.630.200.530.550.410.440.570.611997Year0.130.160.170.240.170.200.290.390.140.150.180.220.110.160.170.210.140.160.210.300.190.190.400.630.200.530.550.410.440.580.621998Ql0.130.160.170.240.150.190.280.360.130.150.180.220.110.150.170.210.140.160.200.270.190.190.400.620.190.480.500.390.400.530.57Q20.130.160.170.240.150.190.280.350.130.150.180.220.110.150.170.210.140.160.200.270.190.190.400.620.190.470.490.370.390.530.56Q30.130.160.170.240.150.180.270.350.130.150.180.220.110.150.170.210.140.160.200.270.190.190.400.620.180.460.460.370.390.510.55Q40.130.160.170.240.150.180.270.350.130.150.180.220.110.150.170.210.140.160.200.270.190.190.400.620.180.460.460.360.370.480.521998Year0.130.160.170.240.150.190.280.350.130.150.180.220.110.150.170.210.140.160.200.270.190.190.400.620.190.470.480.370.390.510.55Time(Weeks)•Pricing for 74BC exciudes 74ABT and 74BCT.Note: Actual negotiated market prices may vary from these prices because of manufacturer-specific factors such as quality, service, andvolume discount. These prices are intended for use as price guidelines.Source: Dataquest (June 1997)3-63-63-63-63-63-63-63-63-63-63-63-63-6S-63-63-63-63-63-63-63-63-63-63-63-63-63-63-63-63-63-6SSPS-WW-MS-9703©1997 Dataquest
Semiconductor Supply and Pricing WorldwideTable 2-2Estimated Long-Range Standard Logic Price Trends—North American Bookings(Volume: 100,000 per Year; Package: PLCC; Dollars)Product74LS TTL74LS0074LS7474LS13874LS24474ACTTL74AC0074AC7474AC13874AC24474FTTL74F0074F7474F13874F24474HC CMOS74HC0074HC7474HC13874HC24474ALS TTL74ALS0074ALS7474ALS13874ALS24474ASTTL74AS0074AS7474AS13874AS24474BC*74BC0O74BC24474BC37374ACT24474ACT24574ABT24474ABT24519970.130.160.170.240.170.200.290.390.140.150.180.220.110.160.170.210.140.160.210.300.190.190.400.630.200.530.550.410.440.580.6219980.130.160.170.240.150.190.280.350.130.150.180.220.110.150.170.210.140.160.200.270.190.19 .•Pricing for 74BC excludes 74ABT and 74BCT.Note: Actual negotiated market prices may vary from these prices because of manufacturer-specific factors such as quality, service, andvolume discount. These prices are intended for use as price guidelines.Source: Dataquest (June 1997)0.400.620.190.470.480.370.390.510.5519990.130.160.170.240.140.180.260.340.130.150.180.220.110.150.170.210.140.160.190.250.190.190.400.610.180.450.440.350.360.470.5120000.130.160.170.240.140.170.250.320.130.150.180.220.110.150.170.210.140.160.190.240.190.190.400.60.170.440.420.330.350.450.49*20010.130.160.170.240.130.170.240.320.130.150.180.220.110.150.170.210.140.160.190.240.190.190.400.60.170.430.410.320.350.440.48SSPS-WW-MS-9703 ©1997 Dataquest June 23,1997
Crttn•oC/5COCDTable 2-3Estimated Microprocessor Price Trends—North American Bookings(Volume: 25,000 per Year; Dollars) (Package: 32/64-Bit Devices—Ceramic PGA; Exceptions Noted)Product68EC020-25 PQFP68EC030-25 PQPP68040-2568LC040-25CQFP184Pentium-75Pentium-9DPentium-inO 3.3VPentium-100 2.9VPentium-120 3.3VPentium-120 2,9VPentium433 3.3VPeiitium-133 2.9VPentium'150 3.3VPen tium-150 2,9VPentium-166 3,3VPenriuin'200 3.3VPentium MMX 166-MHz 2.8V PGAPenttum MMX 20D-MHz 2.8V PGAPentium MMX 233-MHz 2.8V PGAPentium Pra-166CPentium Pro-180 256K CachePentium Pro-200 256K CachePentium Pro-200 512K CachePentium II 233-MHz 512K CachePentium 11 266-MHz 512K CachePentium 11 300-MHz 5:2K CachePowerPC 601-80PowerPC 601-100PowerPC 603-80Powe PC 603-133PowerPC 604-166PowerPC 604-225PowerPC 604-2401997Qi8,0019.0025.0025.0070.0070.0075.0090.0090.0090.00110.00150.00140.00250.00295.00450.00350.00500.00NA600.00410.00475.00993.00NANANA70.0080.0063.00125.00200.00400.00500.00Q28.0018.7524.0024.0070.0070.0075.0090.0085.0085.00100.00140.00140.00225.00200.00250.00260.00400.00600.00600.00330.00475.00993.00600.00750.001,900.0068.0075.0061.00113.00167.00400.00450.00Q38.0018.7524.0024.0070.0070.0070.0085.0085,0085.00100,00100.00100,00130,00120,00145.00200,00330,00430.00600.00330.00450.00985.00500.00650,001,900,0068.0075.0061.00110.00167,00400.00400.00Q48.0018.7522.0022.0070,0070,0070.0085.0085.0085,00100.00100,00100.00115,00100.00120.00150.00260.00380,00600.00330.00450,00985.00450.00600.001,800,0068.0075.0060.00100.00160.00400.00400.001997Year8.0018.8123.7523.7570.0070.0072.5087.5086.2586.25102.50122.50120.00180.00178.75241.25240.00372.50470.00600.00350.00462.50989.00516.67666.671,866.6768.5076.2561.25112.00173.50400.00437.501998Ql8.0018.7522.0022.00EOLEOL70.0085.0085.0085.00100.00100.00100.00115.00100.00120.00150.00260.00300.00EOL330.00450.00985.00400.00550.001,700.00EOLEOL60.0090.00130.00370.00400.00Q28.0018.7522.0022.00EOLEOL70.0085.0085.0085.00100.00100.00100.00115.00100.00120.00150.00260.00300.00EOL330.00450.00985.00400.00550.001,700.00EOLEOL60.0090.00130.00270.00375.00Q38.0018.7522.0022.00EOLEOLEOLEOLEOLEOLEOLEOL100.00115.00100.00120.00150.00260.00300.00EOL330.00450.00985.00400.00550.001,700.00EOLEOL60.0090.00130.00250.00375.00EOL = End of liteNA = Not availableNote: Actual negotiated market prices may vary from these prices because of manufacturer-specific factors such as quality, service, and volume discountas guidelines.Source: Dataquest (June 1997)8182222EEEEEEEE100115100120150260300E3304509854005501,700EE6090130250350
Semiconductor Supply and Pricing WorldwideTable 2-4Estimated Long-Range Microprocessor Price Trends—North American Bookings(Volume: 25,000 per Year; Dollars)(Package: 32/64 Bit Devices—Ceramic PGA; Exceptions Noted)Product68EC020-25 PQFP68EC030-25 PQFP68040-2568LC040-25 CQFP 184Pentium-75Pentium-90Pentium-lOO 3.3VPentium-lOO 2.9VPentium-120 3.3VPentium-120 2.9VPentium-133 3.3VPentium-133 2.9VPentium-150 3.3VPentium-150 2.9VPentium-166 3.3VPentiuin-200 3.3VPentium MMX 166 MHz 2.8V PGAPentium MMX 200 MHz 2.8V PGAPentium MMX 233-MHz 2.8V PGAPentium Pro-166CPentium Pro-ISO 256K CachePentium Pro-200 256K CachePentium Pro-200 512K CachePentium E 233-MHz 512K CachePentium II 266-MHz 512K CachePentium n 300-MHz 512K CachePowerPC 601-80PowerPC 601-100PowerPC 603-80Power PC 603-133Power PC 604-166Power PC 604-225Power PC 604-24019978.0018.8123.7523.7570.0070.0072.5087.5086.2586.25102.50122.50120.00180.00178.75241.25240.00372.50470.00600.00350.00462.50989.00516.67666.671,866.6768.5076.2561.25112.00173.5400437.519988.0018.7522.0022.00EOLEOLEOLEOLEOLEOLEOLEOL100.00115.00100.00120.00150.00260.00300.00EOL330.00450.00985.00400.00550.001,700.00EOLEOL60.0090.0013028537519998.0018.7522.0022.00EOLEOLEOLEOLEOLEOLEOLEOLEOLEOL100.00120.00150.00200.00275.00EOL225.00375.00635.00330.00450.001,600.00EOLEOLEOLEOLEOLEOLEOL20008.0018.7522.0022.00EOLEOLEOLEOLEOLEOLEOLEOLEOLEOLEOLEOLEOLEOLEOLEOLEOLEOLEOL300.00450.001,600.00EOL = End of lifeNote: Actual negotiated market phces may vary from these prices because of manufacturer-specific factors such as quality, service, andvolume discount. These prices are intended for use as guidelines.Source: Dataquest (June 1997)EOLEOLEOLEOLEOLEOLEOL20018.0018.7522.0022.00EOLEOLEOLEOLEOLEOLEOLEOLEOLEOLEOLEOLEOLEOLEOLEOLEOLEOLEOLEOLEOLEOLEOLEOLEOLEOLEOLEOLEOLSSPS-WW-IVIS-9703 ©1997 Dataquest June 23,1997
Market Statistics Tables2«Dc/50)BI* ju(3oul»bOcOoCOc(Qu•*^9HVsoZw73CO)QiUtnenCONOenNOtoX00COoir;inCONOONCOtsCMiriCOotsiriCONOPNOCO^H00t~!COCNinCsCO00CONO^HONCOr^iT - ^NOCOD.b>inenCONOseftCMtoXX!CMOpCOISCsONCOCOONCOtsNOONCOoONONCONOpmenCONOenNO'SsCNOOCOootsNOts00inNO^HCONONONOCNIs!NONOin00NOoCNtstsT-HtsNOCNtsCNCMCOtsoCMCNIsG.U.>inenCoNOenCMCOXJD00COCNCNNOI-stsinCsONinints00tsNOtsinONtstsC3Nts.CNJ00tsoCN00ONCN00^H•^CO00inIS.CN00CtL,>menCONOenNOja•cp00COT.HCsT-HCOT-HI^SCNONCNT-HT-HNDOCOoCMCNCOT-H•T*tsCOT-HoCsCNT-HCNinT-HONCsCMT*T!-H00CMin•3"T-HoCMrH•
CO-XICOTable 2-5 (Continued)Estimated DRAM Price Trends—North American Bookings (Contract Volume; U.S. Dollars)*199719971998•vlC3GOProduct8Mbx32 SIMM 60ns 5V EDO8Mbx36 SIMM 60ns 5V EDOQl141.20164.25Q2143.07165.12Q3140.13159.63Q4136.24157.60Year140.16161.65Ql131.19154.19Q2129.63151.21Q3127.58148.53lMbx64 60ns3.3VEDO41.3839.6237.1535.8638.5034.9234.3033.892Mbx64 60ns 3.3V EDO75.7572.5369.6268.0271.4866.8165.2063.924Mbx64 60ns 3,3V EDO146.24140.17134.82133.60138.71129.52126.42124.06lMbx64 3.3V SDRAM42.1340.5839.0338.1539.9734.8734.2033.692Mbx64 3.3V SDRAM79.2578.6071.0168.2174.2767.0164.9663.204Mbx64 3.3V SDRAM149.00141.00136.88133.93140.20129.44126.00123.45256Kxl6 VRAM 70ns SOP11.6010.059.759.1510.149.109.059.00256Kx32 66MHz 3.3V SGRAM10.008.047.306.758.026.406.255.88@L(Oto-vjoK-cu•Contfacl volume is at least 100,000 per order, except for VRAMs.Note: Actual negotiated market prices may vary from these prices because of manufacturer-specific factors such as quality, service, and volume discount.as price guidelines.Source: Dataquest (June 1997)nCDIV3CO
Market Statistics TablesTable 2-6Estimated Long-Range DRAM Price Trends—North American Bookings(Contract Volume; U.S. Dollars)*Product4Mbxl DRAM 70ns SOJ 5VlMbx4 DRAM 60ns SOJ 5V FPMlMbx4 DRAM 60ns SOJ 5V EDO512Kx8 DRAM 70ns 5V256Kxl6 DRAM 70ns SOJ 5V4Mbx4 DRAM 60 ns SOJ 5V FPM4Mbx4 DRAM 60ns SOJ 5V EDOlMbxl6 DRAM 60ns TSOP 5V FPMlMbxl6 DRAM 60ns TSOP 5V EDOlMbxl6 3.3V SDRAM2Mbx8 DRAM 60ns TSOP 5V FPM16Mbx4 DRAM SOJ 60ns 3.3V EDO16Mbx4 DRAM SOJ 3.3V SDRAM8Mbx8 DRAM SOJ 60ns 3.3V EDO8Mbx8 DRAM SOJ 3.3V SDRAMlMbx32 SIMM 60ns 5V FPMlMbx36 SIMM 60ns 5V FPM2Mbx32 SIMM 60ns 5V FPM2Mbx36 SIMM 60ns 5V FPM4Mbx32 SIMM 60ns 5V FPM4Mbx36 SIMM 60ns 5V FPM8Mbx32 SIMM 60ns 5V FPM8Mbx36 SIMM 60ns 5V FPMlMbx32 SIMM 60ns 5V EDOlMbx36 SIMM 60ns 5V EDO2Mbx32 SIMM 60ns 5V EDO2Mbx36 SIMM 60ns 5V EDO4Mbx32 SIMM 60ns 5V EDO4Mbx36 SIMM 60ns 5V EDO8Mbx32 SIMM 60ns 5V EDO8Mbx36 SIMM 60ns 5V EDOlMbx64 60ns 3.3V EDO2Mbx64 60ns 3.3V EDO4Mbx64 60ns 3.3V EDOlMbx64 3.3V SDRAM2Mbx64 3.3V SDRAM4Mbx64 3.3V SDRAM256Kxl6 VRAM 70ns SOP256Kx32 66MHz 3.3V SGRAM19972.542.362.342.663.288.378.298.158.109.708.5056.2955.7956.2955.7919.3921.4437.8142.6472.4082.79142.70161.8119.3221.4137.2241.8671.7782.17140.16161.6538.5071.48138.7139.9774.27140.2010.148.0219982.452.392.302.463.257.797.727.797.718.397.7935.4633.7935.4633.7918.4920.6135.5039.7767.0076.22131.71151.1018.4220.5035.0239.6066.6575.80129.00149.9234.0964.59125.4234.0064.15125.049.016.0819992.452.432.322.443.307.757.617.757.658.007.7527.0026.8027.0026.8018.3520.5035.3539.5066.5075.80130.90149.8818.3020.3534.9939.3965.7574.11128.00146.2033.2061.06120.2533.0160.89119.758.505.9420002.502.502.402.493.608.107.907.997.907.898.1026.0025.7526.0025.7518.9021.1036.0540.9767.7577.05132.48152.6718.7721.0135.8740.6967.2576.95131.99151.8431.2159.79118.7731.0359.49117.899.105.7720012.552.552.452.553.858.508.308.258.258.158.3624.0023.9024.0023.9019.2022.6537.1942.0369.0079.09134.57156.8919.1122.5937.1142.0168.8879.03134.48155.55'Contract volume is at least 100,000 per order, except for VRAMs.Note: Actual negotiated market prices may vary from these prices because of manufacturer-specific factors such as quality, sen/ice, andvolume discount. These prices are intended for use as price guidelines.Source: Dataquest (June 1997)30.5658.09117.7130.2657.77116.619.305.60SSPS-WW-l\/IS-9703 ©1997 Dataquest June 23,1997
cyjC/oIDC/5C/5ICO-vlC3CO@COCO~>jK-cu.at\3COTable 2-7Estimated Static RAM Price Trends—North American Bookings(Volume: Slow SRAM—50,000 per Year; Fast SRAM—20,000 per Year; Package: PDIP; Dollars)Product16Kx4 35ns8Kx8 25ns8Kx8 100-120ns64Kx4 10ns64Kx4 25ns32Kx8 12ns32Kx9 12ns Burst32Kx8,15ns,5V32Kx8, 15ns, 3.3V32Kx8 25ns32Kx8 70-100nsSOJ64Kx8 12ns Burst256Kx4 20ns128Kx8,15 ns128Kx8, 20 ns128Kx8 25ns•l28Kx8 70-100nsSOJ32Kx32 15ns, 3.3V PQFP32Kx32 8ns 3.3V PBSynch64Kx32 8ns 3.3V PBSynch256Kxt670-100ns256Kxt6 25ns512Kx8 70ns512Kx8 25nsQi2.191.181,397.002,061.503.671.211.261.201.5315,155,224,674.824.824.653.593,296,2919.1520.4117.9622.00Q22.171.161.316.281,901.423.421.171.181.161.4014.104.744.304.504.503.783.463.175.8017.9018.7016.5220.721997Note: Actual negotiated market prices may vary from these prices because of manufacturer-specific factors such as quality, service, and volume discountThese prices are intended for use as price guidelines.Source: Dataquest {June 1997)Q32,161.141.305.741.841.393.341.131.141,121.3414,034,484,104,194,193.633,403.025,5116.3818.2116.2019.48Q42.141.121.305.401,801,393,311,121,141,121,3013,504,233.884.014.013.503.272.945,3215.7017.7915.6218.531997Year2.171.151.336,111.901.423.441.161.18^1.151.3914.204.674,244.384.383.893.433.115.7317.2818.7816.5720.18Ql2.091,111,295,041,701,383,331,101,101.101.2713.354.023.733,713,713,473,142,835,1015,2217.1115.2117.23Q22.091.101.294,891,701,383,301,101,101.101.2612.203.943,593,633,633,443.092,805.0414.3016.7014.7916.251998Q3zm1.101.264.831.601.373.261.091.101.091.2411,803.813-463.503.503.372.952.754.8013.8515.5014,2615,49Q42,111.101.264.831.601,373.221.09i.io:1.091,2411,353.733,333.413.413,282.902.704.6213.2015.0013.6214,29COCO
Market Statistics Tables 11Table 2-8Estimated Long-Range Static RAM Price Trends—North American Bookings(Volume: Slow SRAM—50,000 per Year; Fast SRAM—20,000 per Year; Package:PDIP; Dollars)Product16Kx4 35ns8Kx8 25ns8Kx8 100-120ns64Kx4 10ns64Kx4 25ns32Kx8 12ns32Kx9 12ns Burst32Kx8,15ns, 5V32Kx8, 15ns, 3.3V32Kx8 25ns32Kx8 70-lOOns SOJ64Kx8 12ns Burst256Kx4 20ns128Kx8,15ns128Kx8, 20ns128Kx8 25ns128Kx8 70-lOOns SOJ32Kx32 15ns, 3.3V PQFP32Kx32 8ns 3.3V PBSynch64Kx32 8ns 3.3V PBSynch256Kxl6 70-lOOns256Kxl6 25ns512Kx8 70ns512Kx8 25nsEOL = End of lifeNote: Actual negotiated market prices may vary from these prices because of manufacturer-specific factors such as quality, service, andvolume discount. These prices are intended for use as price guidelines.Source: Dataquest (June 1997)19972.171.151.336.111.901.423.441.161.181.151.3914.204.674.244.384.383.893.433.115.7317.2818.7816.5720.1819982.101.101.284.901.651.383.281.101.101.101.2512.183.883.533.563.563.393.022.774.8914.1416.0814.4715.8219992.121.121.295.81.801.463.211.151.21.191.3011.13.503.253.363.363.262.862.904.5012.8713.8612.6012.9820002.121.221.326.401.891.553.301.251.291.301.3512.003.703.233.283.283.233.203.204.2912.1512.1011.8411.9820012.161.301.406.591.981.703.501.301.401.461.4012.254.103.553.593.593.413.853.605.3511.9411.9011.5511.66SSPS-WW-MS-9703 ©1997 Dataquest June 23,1997
12 Semiconductor Supply and Pricing WorldwideTable 2-9Estimated ROM Price Trends—North American Bookings(Speed/Package: 2Mb Density—200ns and Above; 32-pin PDIP) (Volume: 50,000 per Year; Dollars)Product128Kx8 ROM64Kxl6 ROM256Kx8 ROM512Kx8 ROM256Kxl6 ROMIMbXS ROMlMbxl6 ROM2Mbx8 ROM2Mbxl6 ROM4Mbx8 ROM4Mbxl6 ROM8Mbx8 ROM1997Qi1.742.002.203.103.104.006.005.8712.0012.0016.0015.50Q21.691.922.183.003.003.905.805.7211.7511.6015.8015.30Q31.691.882.142.902.903.805.705.7011.5011.4015.4015.20Q41.641.802.142.802.803.705.655.6511.3011.3015.0014.901997Year1.691.902.172.952.953.855.795.7411.6411.5815.5515.231998Qi1.581.732.102.702.703.625.555.5511.0011.0014.5014.40Q21.581.732.102.702.703.625.555.5511.0011.0014.5014.40Q31.511.662.052.662.663.535.465.4610.7410.7414.0013.90Q41.511.662.052.662.663.535.465.4610.7410.7414.0013.901998Year1.551.702.082.682.683.585.515.5110.8710.8714.2514.15Lead Time(Weeks)i256Kx16 ROM: 150ns and above; 40-pin PDIP^IMbxS ROM: 150ns and above; 32-pln SOPNote: Actual negotiated market prices may vary from these prices because of manufacturer-specific factors such as quality, sen/lce, andvolume discount. These prices are intended for use as price guidelines.Source: Dataquest (June 1997)4-84-84-84-84-84-84-84-84-84-84-94-9Table 2-10Estimated Long-Range ROM Price Trends—North American Bookings(Speed/Package: 2Mb Density—200ns and Above; 32-pin PDIP) (Volume: 50,000 per Year; Dollars)Product128Kx8 ROM64Kxl6 ROM256Kx8 ROM512Kx8 ROM256Kxl6 ROMlIMbxS ROM^lMbxl6 ROM2Mbx8 ROM2Mbxl6 ROM4Mbx8 ROM4Mbxl6 ROMSMbxS ROM19971.691.902.172.952.953.855.795.7411.6411.5815.5515.23^256Kx16 ROM: 150ns and above; 40-pln PDIP^IMbxS ROM: 150ns and above; 32-pin SOPNote: Actual negotiated market prices may vary from these prices because of manufacturer-specific factors such as quality, service, andvolume discount. These prices are intended for use as price guidelines.Source: Dataquest (June 1997)19981.551.702.082.682.683.585.515.5110.8710.8714.2514.1519991.501.632.012.602.603.485.385.4010.6010.6013.8013.6520001.471.611.982.562.563.455.305.3010.5010.5013.5013.4020011.441.591.962.522.523.395.225.2210.3510.3513.5013.27SSPS-WW-MS-9703 ©1997 Dataquest June 23,1997
Market Statistics Tables 13Table 2-11Estimated EPROM Price Trends—North American Bookings(Volume: 50,000 per Year; Package: Windowed CERDIP; Speed: 150ns and Above;Dollars)Product32Kx8 EPROM64Kx8 EPROM128Kx8 EPROM256Kx8 EPROM128Kxl6 EPROM512Kx8 EPROM256Kxl6 EPROMlMbx8 EPROM512Kxl6 EPROMQi1.371.431.932.773.654.977.588.509.50Q21.361.431.902.773.314.686.388.409.451997Q31.331.391.832.753.204.586.248.309.40Q41.321.391.802.733.134.516.158.209.301997Year1.351.411.872.763.324.696.598.359.41Qi1.321.381.732.683.084.386.108.159.20Q21.291.361.732.663.034.325.788.109.151998Q31.281.331.702.522.824.205.438.059.10Q41.271.311.702.502.804.175.088.009.051998Year1.291.341.722.592.934.265.598.089.13Lead Time(Weeks)Note: Actual negotiated market prices may vary from these prices because of manufacturer-specific factors such as quality, service, andvolume discount. These prices are intended for use as guidelines.Source: Dataquest (June 1997)2-32-32-32-32-32-32-32-32-3Table 2-12Estimated Long-Range EPROM Price Trends—North American Bookings(Volume: 50,000 per Year; Package: Windowed CERDIP; Speed: 150ns and Above;Dollars)Product32Kx8 EPROM64Kx8 EPROM128Kx8 EPROM256Kx8 EPROM128Kxl6 EPROM512Kx8 EPROM256Kxl6 EPROMlMbx8 EPROM512Kxl6 EPROM19971.351.411.872.763.324.696.598.359.41Note: Actual negotiated market prices may vary from these prices because of manufacturer-specific factors such as quality, service, andvolume discount. These prices are intended for use as guidelines.Source: Dataquest (June 1997)19981.291.341.722.592.934.265.598.089.1319991.221.291.682.452.794.145.017.988.9420001.201.261.632.392.724.084.937.898.8720011.201.251.602.372.654.014.887.818.79SSPS-WW-l\/IS-9703 ©1997 Dataquest June 23,1997
14 Semiconductor Supply and Pricing WorldwideTable 2-13Estimated Flash Memory Price Trends—North American Bookings(12V; Volume: 10,000 per Year; Speed: 150ns; Dollars)Product64Kx8 PDIP/PLCC64Kx8 TSOP128Kx8 PDIP/PLCC128Kx8 TSOP 12V128Kx8TSOP5V256Kx8 TSOP 12V256Kx8TSOP/5V512Kx8 PDIP/PLCC512Kx8 TSOP 12V512Kx8 TSOP/5V512Kx8 SSOP/3VIMbxS TSOP/12VlMbx8 TSOP/5VlMbx8 TSOP/3V2Mbx8 TSOP/12V2Mbx8TSOP/5V2Mbx8 TSOP/3VQi2.752.832.582.803.185.575.305.606.206.287.6310.0710.2012.0018.1518.5020.00Q22.612.682.362.543.055.004.645.175.905.755.708.648.609.1817.1616.9717.711997Q32.442.632.312.442.924.914.494.885.635.474.778.348.228.1216.3316.0016.94Q42.342.592.312.442.864.814.374.685.535.344.617.857.787.7015.4515.3015.931997Year2.532.682.392.553.005.074.705.085.825.715.688.738.709.2516.7716.6917.64Qi2.192.432.192.292.644.513.944.384.714.704.337.417.347.1814.1914.1514.05Q22.152.382.192.242.544.423.824.234.394.374.097.137.056.9013.7213.6113.411998Q32.152.292.192.242.454.323.714.074.394.324.096.946.866.7113.3513.2612.87Q42.152.192.192.242.424.093.523.884.254.164.076.596.536.4112.7912.6712.331998Year2.162.322.192.252.514.333.754.144.434.394.147.026.946.8013.5113.4213.17Lead Time(Weeks)Note: Actual negotiated market phces may vary from these prices because of manufacturer-specific factors such as quality, service, andvolume discount. These prices are Intended for use as guidelines.Source: Dataquest (June 1997)55344444444444444SSPS-WW-MS-9703 ©1997 Dataquest June 23,1997
Market Statistics Tables 15Table 2-14Estimated Long-Range Flash Memory Price Trends—North American Bookings(12V; Volume: 10,000 per Year; Speed: 150ns; Dollars)Product64Kx8 PDIP/PLCC64Kx8 TSOP128Kx8 PDIP/PLCC128Kx8 TSOP 12V128Kx8 TSOP 5V256Kx8 TSOP 12V256Kx8 TSOP/5V512Kx8 PDIP/PLCC512Kx8 TSOP 12V512Kx8 TSOP/5V512Kx8 SSOP/3VlMbx8 TSOP/12VlMbx8 TSOP/5VlMbx8 TSOP/3V2Mbx8 TSOP/12V2Mbx8 TSOP/5V2Mbx8 TSOP/3V19972.532.682.392.553.005.074.70. 5.085.825.715.688.738.709.2516.7716.6917.64Note: Actual negotiated market prices may vary from these prices because of manufacturer-specific factors such as quality, service, andvolume discount. These prices are intended for use as guidelines.Source: Dataquest (June 1997)19982.162.322.192.252.514.333.754.144.434.394.147.026.946.8013.5113.4213.1719992.152.182.182.232.394.053.493.844.224.134.046.556.496.3712.0812.0412.0020002.142.172.172.212.354.003.443.804.094.043.946.496.446.3311.4811.3911.3420012.142.162.162.202.303.903.383.743.923.903.876.456.406.3010.5910.4410.38SSPS-WW-IVlS-9703 ©1997 Dataquest June 23,1997
C/)CO"OC/5Table 2-15Estimated Gate Array Pricing—North American Production Bookings(Volume: 20,000 Units; Based on Utilized Gates Only; NRE = Netlist to Prototype; Millicents per GaCOICO-vloGOGate Count TechnologyCMOS0.8 Micron0.6 Micron0.5 Micron0.35 Micron10-29.99K Gates199721.0024.0026.0036.00199820.0023.0025.0034.00199919.0022.0024.0034.0030-59.99K Gates1997 199817.00 16.0017.00 15.0022.00 21.0033.00 29.00199914.0014.0020.0028.0060-99.99K Ga1997 199815.00 14.0017.00 16,0020.00 18.0021.00 20.00NRE CMOS Average Charge ($K)44.0044.0043.0054.0052.0052.0074.0073.00@(O(O•vjalUX3CDGate Count TechnologyCMOS (Average)0.8 Micron0.6 Micron0,5 Micron0.35 Micron100-299.99K Gates199724.0023.0027.0032.00199822.0022.0024.0031.00199921.0021,0022.0030.001997NR30.0033.0041.00>300K Gates1998NR30.0032.0039.001999NR29.0032.0038.00LPrNRE CMOS Average Charge ($K)107.00106.00NR = Not relevantNRE = Nonreccuring englnaaring chargeNotes: The actual NF1E may vary from these because of device amortization, testing, Intellectual property rights, and other factors. Actual negotiated mafrom these because of manufacturer-specific factors such as intellectual property rights, alliances, service, package types, pad or core constraints, and vintended (or use as price guidelines. For volumes of 1 millton units or greater, discount the above prices by a further 50 to 60 percent. For core-limited so10,000 units, CBICs may be mora cost-effective than gate arrays.Source; Dataquest (June 1997)105.00123.00120.00120.00PrIV)COCOCO-vl
COen-aCOTable 2-16Estimated CBIC Pricing—North American Production Bookings(Volume: 20,000 Units; Based on Utilized Gates Only; NRE = Netlist to Prototype; Millicents per GCO1CO-^oGOGate Count TechnologyCMOS0.8 Micron199725.0010-29.99K Gates199824.00199922.0030-59.99K Gates199717.00199816.00199914.0060-99.99K Gat199713.00199811.000.6 Micron26.0025.0024.0018.0016.0015.0013.0012.000.5 Micron0.35 Micron28.0040.0027.0039.0026.0038.0025.0038.0024.0035.0022.0034.0020.0025.0018.0024.00NRE CMOS Average Charge ($K)68.0067.0065.0072.0072.0071.0083.0083.00@COCO^JoK.01X3aCD(nGate Count TechnologyCMOS0.8 Micron0.6 Micron100-299.99K Gates199717.0015.00199815.0014.00199914.0013.00>300K Gates1997 1998NR NR19.00 18.001999NR17.00LPr0.5 Micron14.0012.0010.0017.0015.0014.000.35 Micron12.0011.0010.0011.009.008.00NRE CMOS Average Charge ($K)133.00132.00NR = Not relevantNRE = Nonreccuring engineering chargeNotes; The actual NRE may vary from these because of device amortization, testing, intellectual property rights, and other factors, Actual negotiated marfrom these because of manufacturer-specific factors such as intellectual property rights, alliances, service, package types, pad or core constraints, and vointended for use as price guidelines. For volumes of 1 million units or greate, discount the above prices by a further 50 to 60 percent. For core-limited solu10,000 units, CBICs may be more cost-effective than gate arrays,Source; Dataquest [June 1997)132.00163.00161.00160.00PrCOCOCO
DataquestA Gartner Group CompanyFor More Information...Evelyn Cronin, Senior Industry Analyst (408) 468-8075Internet addressevel5Ti.crorun@dataquest.co1nVia fax (408) 954-1780Dataquest Interactivehttp://www.dataquest.comThe content of this report represents our interpretation and analysis of information generally available to the publicor released by responsible individuals in the subject companies, but is not guaranteed as to accuracy or completeness.It does not contain material provided to us in confidence by our clients. Reproduction or disclosure in whole or inpart to other parties shall be made upon the written and express consent of Dataquest.©1997 Dataquest—Reproduction ProhibitedDataquest is a registered trademark of A.C. Nielsen Company
iDATAQUEST WORLDWIDE OFFICESNORTH AMERICAWorldwide Headquarters251 River Oaks ParkwaySan Jose, California 95134-1913United StatesPhone: 1^08-468-8000Facsimile: 1-408-954-1780EUROPEEuropean HeadquartersTamesis, The GlantyEgham, Surrey TW20 9AWUnited KingdomPhone: +44 1784 431 611Facsimile: +44 1784 488 980ASIA/PACIFICAsia/Pacific HeadquartersSuite 5904-7, Central Plaza18 Harbour Road, WanchaiHong KongPhone: 852-2824-6168Facsimile: 852-2824-6138East Coast HeadquartersNine Technology DriveRO. Box 5093Westborough, Massachusetts 01581-5093United StatesPhone: 1-508-871-5555FacsimOe: 1-508-871-6262Dataquest Global Events3990 Westerly Place, Suite 100Newport Beach, California 92660United StatesPhone: 1-714-476-9117Facsimile: 1-714-476-9969Sales Offices:Washington, DC (Federal)New York, NY (Financial)Dallas, TXLATIN AMERICAResearch Affiliates and Sales Offices:Buenos Aires, ArgentinaSao Paulo, BrazilSantiago, ChileMexico City, MexicoDataquest FranceImmeuble Defense Bergeres345, avenue Georges ClennenceauTSA 4000292882 - Nanterre CTC Cedex 9FrancePhone: +33 1 41 35 13 00Facsimile: +33 1 41 35 13 13Dataquest GermanyKronstadter Strasse 981677 MiinchenGermanyPhone: +49 89 93 09 09 0Facsimile: +49 89 93 03 27 7Sales Offices:Brussels, BelgiumKfar Saba, IsraelMilan, ItalyRandburg, South AfricaMadrid, SpainJAPANJapan HeadquartersAobadai Hills 4-7-7AobadaiMeguro-ku, Tokyo 153JapanPhone: 81-3-3481-3670Facsimile: 81-3-3481-3644Dataquest KoreaSuite 2407, Trade Tower159 Samsung-dong, Kangnam-guSeoul 135-729KoreaPhone: 822-551-1331FacsimOe: 822-551-1330Dataquest TaiwanllF-2, No. 188, Section 5Ncin King East RoadTaipeiTaiwan, R.O.C.Phone: 8862-756-0389Facsimile: 8862-756-2663Dataquest Singapore105 Cecil Street#06-01 /02 The OctagonSingapore 069534Phone: 65-227-1213FacsimUe: 65-227-4607Dataquest Thailand12/F, Vanissa Building29 Soi ChidlomPloenchit RoadPatumwan, Bangkok 10330ThailandPhone: 662-655-0577Facsimile: 662-655-0576iResearch Affiliates and Sales Offices:Melbourne, AustraliaBeijing, ChinaDataquestA Gartner Group Companyi©1997 Dataquest
FILE COPY:MARIA VALENZUELA<strong>DataQuest</strong>Finall 996 WorldwideSemiconductor l\/larl(et SliareMarket StatisticsProgram: Semiconductor Supply and Pricing WorldwideProduct Code: SSPS-WW-MS-9702Publication Date: May 12,1997Filing: Market Statistics
IFinal 1996 WorldwideSemiconductor Market ShareMarket StatisticsProgram: Semiconductor Supply and Pricing WorldwideProduct Code: SSPS-WW-l\/IS-9702Publication Date: May 12,1997Filing: Market Statistics
Final 1996 Worldwide Semiconductor Market ShareTable of ContentsPageFinal 1996 Worldwide Semiconductor Market Share 1Introduction 1Segmentation 1Definitions 2Product Definitions 2Regional Definitions 4Line Item Definitions 4Market Share Methodology 4Notes on Market Share 5Notes to Market Share Tables 5Exchange Rates 7Section 1: 19'96 Worldwide Market Share 8Section 2: 1996 Worldwide Market Share Rankings 51SSPS-WW-MS-9702 ©1997 Dataquest May 12,1997
Semiconductor Supply and Pricing WorldwideList of TablesTablePage1 Exchange Rates 71-1 Each Company's Factory Revenue from Shipmentsof Total Semiconductors Worldwide (Including Hybrid) 81-2 Each Company's Factory Revenue from Shipmentsof Total Semiconductors Worldwide (Excluding Hybrid) 131-3 Each Company's Factory Revenue from Shipmentsof Total ICs Worldwide (Including Hybrid) 181-4 Each Company's Factory Revenue from Shipmentsof Total Integrated Circuits Worldwide (Excluding Hybrid) 231-5 Each Company's Factory Revenue from Shipmentsof Bipolar Digital Worldwide 281-6 Each Company's Factory Revenue from Shipmentsof Bipolar Logic Worldwide 291-7 Each Company's Factory Revenue from Shipmentsof Other Bipolar Logic/Memory/Microcomponents Worldwide 301-8 Each Company's Factory Revenue from Shipmentsof MOS Digital ICs Worldwide 311-9 Each Company's Factory Revenue from Shipmentsof MOS Memory Worldwide 351-10 Each Company's Factory Revenue from Shipmentsof MOS Microcomponents Worldwide 371-11 Each Company's Factory Revenue from Shipmentsof MOS Digital Logic Worldwide 401-12 Each Company's Factory Revenue from Shipmentsof Analog-Monolithic Worldwide 431-13 Each Company's Factory Revenue from Shipmentsof Total Discrete Worldwide 461-14 Each Company's Factory Revenue from Shipmentsof Total Optical Semiconductors Worldwide 481-15 Each Company's Factory Revenue from Shipmentsof Hybrid Analog Worldwide 502-1 Top 40 Worldwide Companies' Factory Revenue fromShipments of Total Semiconductors Worldwide(Including Hybrid) 512-2 Top 40 Worldwide Companies' Factory Revenue fromShipments of Total Semiconductors Worldwide(Excluding Hybrid) 532-3 Top 40 Worldwide Comparues' Factory Revenue fromShipments of Total ICs Worldwide (Including Hybrid) 552-4 Top 40 Worldwide Companies' Factory Revenue fromShipments of Total Integrated Circuits Worldwide(Excluding Hybrid) 572-5 Top 20 Worldwide Companies' Factory Revenue fromShipments of Bipolar Digital Worldwide 59SSPS-WW-MS-9702 ©1997 Dataquest: I\^ay12,1997
Final 1996 Worldwide Semiconductor Market ShareIList of Tables (Continued)TablePage2-6 Top 20 Worldwide Companies' Factory Revenue fromShipments of Bipolar Logic Worldwide 602-7 Top 13 Worldwide Companies' Factory Revenue fromShipments of Other Bipolar Logic/Memory/MicrocomponentsWorldwide 612-8 Top 40 Worldwide Companies' Factory Revenue fromShipments of MOS Digital ICs Worldwide 622-9 Top 40 Worldwide Companies' Factory Revenue fromShipments of MOS Memory Worldwide 642-10 Top 40 Worldwide Companies' Factory Revenue fromShipments of MOS Microcomponents Worldwide 662-11 Top 40 Worldwide Companies' Factory Revenue fromShipments of MOS Digital Logic Worldwide 682-12 Top 40 Worldwide Companies' Factory Revenue fromShipments of Analog-Monohthic Worldwide 702-13 Top 40 Worldwide Companies' Factory Revenue fromShipments of Total Discrete Worldwide 722-14 Top 349 Worldwide Companies' Factory Revenue fromShipments of Total Optical Semiconductors Worldwide 742-15 Top 29 Worldwide Companies' Factory Revenue fromShipments of Hybrid Analog Worldwide 76SSPS-WW-MS-9702 ©1997 Dataquest May 12,1997
IFinal 1996 Worldwide Semiconductor Market ShareIntroductionThis document contains detailed information on Dataquest's view of thesemiconductor market. Included in this document are the following:• 1994-1996 market share estimates• 1995-1996 market share rankingsWorldwide market share estimates combine data from many countries,each of which has a different and fluctuating exchange rate. Estimatesof non-U.S. market consumption or revenue are based on the averageexchange rate for the given year. Refer to the section titled "ExchangeRates" for more information regarding these average rates. As a rule,Dataquest's estimates are calculated in local currencies and then convertedto U.S. dollars.More detailed data on this market may be requested through Dataquest'sclient inquiry service. Qualitative analysis of this data is provided in theDataquest Perspectives.SegmentationThis section outlines the market segments that are specific to this document.Dataquest's objective is to provide data along lines of segmentationthat is logical, appropriate to the industiy in question, and immediatelyuseful to clients.Dataquest defines the semiconductor industry as the group of competingcompanies primarily engaged in manufacturing semiconductors andrelated solid-state devices. Important products of the semiconductorindustry include integrated circuits, discrete devices, and optoelectronicsdevices.For market share purposes, Dataquest defines the semiconductor marketaccording to the following functional segmentation scheme:• Total Semiconductor (Including Hybrids)• Total Semiconductor (Excluding Hybrids)• Total Monolithic Integrated Circuit (Including Hybrids)• Total Monolithic Integrated Circuit (Excluding Hybrids)• Bipolar Digital ICa Bipolar Logic• Other Bipolar Memory/Microcomponent/Logic• MOS Digital IC• MOS Memory• MOS Microcomponent• MOS LogicSSPS-WW-MS-9702©1997 Dataquest 1
Semiconductor Supply and Pricing Worldwide• Monolithic Analog IC• Hybrid IC• Discrete Semiconductora Optoelectronic SemiconductorDefinitionsThis section lists the definitions that are used by Dataquest to present thedata in this document. For a complete listing of all semiconductor marketsegments tracked by Dataquest, please refer to the Dataquest SemiconductorMarket Definitions Guide.Product DefinitionsTotal Semiconductor (Total Monolithic Integrated Circuit + Total Discrete+ Total Optoelectronic). Defined as an active semiconductor product thatcontains semiconducting material (such as silicon, germanium, or galliumarsenide, but excluding ceramics) and reacts dynamically to an input signal,either by modifying its shape or adding energy to it. This definitionexcludes standalone passive components, such as capacitors, resistors,inductors, oscillators, crystals, transformers, and relays.Total Monolithic Integrated Circuit (Digital Monolithic Bipolar IC + DigitalMonolithic MOS IC + Analog IC). An IC is defined as a large numberof passive and/or active discrete semiconductor circuits integrated into asingle package. A monolithic IC is one in which discrete circuits are integratedonto a single die.Bipolar Digital IC (Bipolar Digital Memory + Bipolar Digital Microcomponent+ Bipolar Digital Logic). A bipolar digital IC is defined as a monolithicsemiconductor product in which 100 percent of the die area performsdigital functions, and concurrently, 100 percent of the die area is manufacturedusing bipolar semiconductor technology. A digital function is one inwhich data-carrying signals vary in discrete values.Bipolar Digital Logic (Bipolar Application-Specific IC -i- Bipolar DigitalStandard Logic + Other Bipolar Logic). Defined as a bipolar digital semiconductorproduct in which more than 50 percent of the die area performslogic functions. Excludes bipolar digital microcomponent ICs.Other Bipolar Digital Memory/Microcomponent/Logic. Defined as abipolar digital semiconductor product in which binary data is stored andelectronically retrieved. Includes ECL random-access memory (RAM),read-only memory (ROM), programmable ROM (PROM), last-in/first-out(LIFO) memory, and first-in/first-out (FIFO) memory. Not included areproducts made with mixed bipolar CMOS (that is, BiCMOS) with TTL orECL outputs, which are classified as MOS.MOS Digital IC (MOS Digital Memory + MOS Digital Microcomponent +MOS Digital Logic). Defined as a monolithic semiconductor product inwhich 100 percent of the die area performs digital functions, and, concurrently,where any portion of the die area is manufactured using metaloxide semiconductor (MOS) technology. A digital function is one in whichSSPS-WW-MS-9702 ©1997 Dataquest I\yiay12,1997
Final 1996 Worldwide Semiconductor Market Sharedata-carrying signals vary in discrete values. Includes mixed technologymanufacturing, such as BiMOS and BiCMOS, v^here there is some MOStechnology employed.MOS Digital Memory (DRAM + SRAM + EPROM + EEPROM + FlashMemory + Mask ROM + Other MOS Digital Memory). Defined as a MOSdigital IC in which binary data is stored and electronically retrieved.MOS Digital Microcomponent IC (MOS Digital Microprocessor + MOSDigital Microcontroller + MOS Digital Microperipheral + ProgrammableDigital Signal Processor). Defined as a MOS digital IC that contains a dataprocessing unit or serves as an interface to such a unit.MOS Digital Logic IC (MOS Digital Logic Application-Specific IC + MOSDigital Standard Logic IC -i- Other MOS Digital Logic IC). Defined as aMOS digital IC in which more than 50 percent of the die area performslogic functions. Excludes MOS digital microcomponent ICs.Total Analog IC (Amplifier/Comparator IC + Voltage Regulator/referenceIC -I- Data Converter/Switch/Multiplexer IC + Interface IC + Telecom IC +Disk Drive IC -i- Other Special-Function IC + Linear Array/ASIC + Mixed-Signal ASIC + Total Special Consumer IC + Special Automotive IC + SmartPower IC). An analog IC is a semiconductor product that deals in therealm of electrical signal processing, power control, or electrical drivecapability. It is one in which some of the inputs or outputs can be definedin terms of continuously or linearly variable voltages, currents, or frequencies.Includes only monolithic analog ICs manufactured using bipolar,MOS, or BiCMOS technologies. A monolithic IC is a single die containedin a single package.Hybrid Integrated Circuit. Defined as a semiconductor product consistingof more than one die contained in a single package. A hybrid IC may perform100 percent linear, 100 percent digital, or mixed-signal (both linearand digital) functions. Includes hybrid implementation of all monolithicIC functions described in the following categories. Includes all hybrid ICsmanufactured using bipolar, MOS, or BiCMOS technologies.Total Discrete (Transistor + Diode + Thyristor + Other Discrete). A discretesemiconductor is defined as a unit building block performing a fundanientalsemiconductor function.Total Optoelectronic (LED Lamp/Display + Optocoupler -i- CCD -i- LaserDiode + Photosensor -i- Other Optoelectronic). Defined as a semiconductorproduct in which photons induce the flow of electrons, or vice versa.Other functions may also be integrated onto the product. This categorydoes not include LCD, incandescent displays, fluorescent displays, cathoderay tubes (CRTs), or plasma displays.SSPS-WW-MS-9702 ©1997 Dataqu est May 12,1997
Semiconductor Supply and Pricing WorldwideRegional DefinitionsAmericasNorth America: Includes Canada, Mexico, and the United States (50 states)South AmericaCentral AmericaMarket Share MethodologyJapanJapan is the only single-country region.Europe, Africa, and tlie Middle EastWestern Europe: Includes Austria, Belgium, Denmark, Eire (Ireland),Finland, France, Germany (including former East Germany), Greece, Italy,Luxembourg, Netherlands, Norway, Portugal, Spain, Sweden, Switzerland,the United Kingdom, and rest of western Europe (Andorra, Cyprus,Gibraltar, Liechtenstein, Monaco, San Marino, Vatican City, Iceland, Malta,and Turkey).Eastern Europe: Includes Albania, Bulgaria, the Czech Republic andSlovakia, Estonia, Hungary, Latvia, Lithuania, Poland, Romania, therepublics of the former Yugoslavia, and the republics of the former USSR(Belarus, Russian Federation, Ukraine, Georgia, Moldova, Armenia,Azerbaijan, Kazakhstan, Uzbekistan, Tadjikistan, Kyrgyzstan, andTurkmenistan).Asia/PacificIncludes Hong Kong, Singapore, South Korea, Taiwan, Australia, Bangladesh,Cambodia, China, India, Indonesia, Laos, Malaysia, Maldives,Myanmar, Nepal, New Zealand, Pakistan, the Philippines, Sri Lanka,Thailand, and Vietnam.Line Item DefinitionsFactory revenue is defined as the money value received by asemiconductor manufacturer for its products. Revenue from the saleof semiconductors sold either as finished goods, dies, or wafers to anothersemiconductor vendor for resale is attributed to the semiconductor vendorthat sells the product to a distributor or equipment manufacturer.Merchant versus captive consumption: Dataquest includes all revenue,both merchant and captive, for semiconductor suppliers selling to themerchant market. The data excludes completely captive suppliers wheredevices are manufactured solely for the company's own use. A productthat is used internally is valued at market price rather than at transfer orfactory price.Dataquest uses both primary and secondary sotirces to produce marketstatistics data. In the fourth quarter of each year, Dataquest surveys allmajor participants within each industry. Selected companies are resurveyedduring the first quarter of the following year to verify final annualSSPS-WW-MS-9702 ©1997 Dataquest; May 12,1997
Final 1996 Worldwide Semiconductor Market Share^results. This primary research is supplemented with additional primaryresearch and secondary research to verify market size, shipment totals,and pricing information. Sources of data used by Dataquest include thefollowing:Notes on Market Share• Information published by major industry participants• Estimates made by knowledgeable and reliable industry spokespersons• Government data or tiade association data (such as WSTS, MITI, andU.S. DOC)• Published product literature and price lists• Interviews with knowledgeable manufacturers, distributors, and users• Relevant economic data• Information and data from online and CD-ROM data banks• Articles in both the general and trade press• Reports from financial analysts• End-user surveysDataquest believes that the estimates presented in this document are themost accurate and meaningful statistics available.Despite the care taken in gathering, analyzing, and categorizing the datain a meaningful way, careful attention must be paid to the definitions andassumptions used herein when interpreting the estimates presented in thisdocument. Various companies, government agencies, and trade associationsmay use slightly different definitions of product categories andregional groupings, or they may include different companies in theirsummaries. These differences should be kept in mind when makingcomparisons between data and numbers provided by Dataquest andthose provided by other sources.In the process of conducting data collection and preparing marketstatistics information, Dataquest will sometimes consolidate or revise aparticular company, model, series, or industry's numbers. In this section,we explain any such changes contained within this document for yourreference.Notes to Market Share Tables1. Appian Technology product lines were acquired by Cirrus Logicin 1994.2. Dialog, Eurosil, Matra, Telefunken, and Siliconix are now knownas TEMIC.3. LG Semicon was formerly known as Goldstar.»4. IMP was formerly known as International Microelectionic Products.5. Inmos revenue is included in SGS-Thomson revenue.SSPS-WW-l\/IS-9702 ©1997 Dataquest • May 12,1997
Semiconductor Supply and Pricing Worldwide6. Linfinity was formerly known as Silicon General.7. NCR was acquired by Hyundai in 1994 and is operated as SymbiosLogic Inc.8. Nippon Steel Semiconductor was formerly known as NMBSemiconductor.9. Philips revenue includes Signetics revenue.10. Thomson Semiconductors Specific (TCS) was formed through themerger of Thomson Composants Microndes (TCM) and Thomson ComposantsMilitaires et Spatiaux (TMS).11. The following companies were added to worldwide market sharetables starting in 1996 and may result in higher 1996 market growth ratesin certain product areas:• C-Cube• Chip Express• Digital Semiconductor• Orbit Semiconductor• Sun Microsystems• Vanguard• VIA Technologies12. Part of IBM's 1994 and 1995 logic revenue has been reclassified andrestated.13. Rockwell's 1994 revenue has been restated.14. National Semiconductor's 1994 revenue has been restated.15. Motorola's 1995 revenue has been restated.16. Comlinear revenue is included in National Semiconductor's revenue.17. Silicon Storage Technology has been added to worldwide market sharestarting in 1995.18. ABB IXYS is now IXYS and has been placed in Americas comparues.19. Texas Instruments purchased Silicon Systems in 1996.20. Rockwell purchased Brooktree in 1996.21. NEC's 1995 revenue has been restated.SSPS-WW-l\/iS-9702 ©1997Dataquest May 12,1997
Final 1996 Worldwide Semiconductor Market ShareExchange RatesDataquest uses an average annual exchange rate in converting revenue toU.S. dollar amounts. Table 1 outlines these rates for 1994 through 1996.Table 1Exchange Rates199419951996Japan (Yen/U.S.$)101.8193.90108.81France (Franc/U.S.$)5.544.975.12Germany (Deutsche Mark/U.S.$)1.621.431.50United Kingdom (U.S.$/PoundSterling)1.531.591.56Source: Dataquest (April 1997)SSPS-WW-MS-9702 ©1997 Dataquest May 12,1997
Semiconductor Supply and Pricing WorldwideSection 1:1996 Worldwide Market ShareTable 1-1Each Company's Factory Revenue from Shipments of Total Semiconductors Worldwide(Including Hybrid) (Millions of U, .S. Dollars)Total MarketAmericas CompaniesACC MicroelectronicsActelAdaptecAdvanced Micro DevicesAllegro MicrosystemsAlliance SemiconductorAlteraAnalog DevicesAppian TechnologyApplied Micro Circuits Corp.ATI TechnologiesAtmelBrooktreeBurr-BrownCalifornia Micro DevicesCatalystC-CubeCherry SemiconductorChip ExpressChips & TechnologiesCID TechnologiesCirrus LogicComlinearCrosspoint SolutionsCypress SemiconductorCyrixDallas SemiconductorDigitalDSP GroupEastman KodakElantecElectronic DesignsETEQ Microsystems1994110,51346,05249761252,13414890199739748037510916510500770894781160400241154018324266Revenue1995151,26260,021401091242,33718522040298394905891201861348087013851,003025532122280603254371996141,69063,617451492141,947200764971,26010561301,02402078541501002515068910251616027727167335514Market Share (%)1994100.041.7000.11.90.100.20.70000.300.100000000.7000.40.20.10000001995100.039.70001.50.10.10.30.60000.400.100000000.7000.40.10.20000001996100.044.900.10.21.40.100.40.90000.700.1000.1000.100.6000.40.10.20.200000SSPS-WW-l\/!S-9702 ©1997 Dataqu est IVlay12,1997
Final 1996 Worldwide Semiconductor Market ShareTable 1-1 (Continued)Each Company's Factory Revenue from Shipments of Total Semiconductors Worldwide(Including Hybrid) (Millions of U .S. Dollars)ExarGeneral InstrumentGermumG-LinkUSAGould AMIHarrisHewlett-PackardHoltHoneywellHughesIBMIC SensorsIMIIMPIntegrated Circuit SystemsIntegrated Device TechnologyIntegrated Information Tech.Integrated Silicon SolutionsIntelInternational CMOS TechnologyInternational RectifierITTIXYSKuliteLatticeLevel One CommunicationsLinear TechnologyLinfinityLogic DevicesLSI LogicLucent TechnologiesMaximMicrelMicro LinearMicro Power SystemsMicrochip TechnologyMicron TechnologyMicrosemi1994169262310136665714955402,5325204981385356010,099123612415520134022544149011,3071692541232121,492100Revenue19951474133414726856481164363,52263554976174415813,1721648631665241867830550171,2691,615189265402712,601118199696362371595629945071392,74073935795545111117,7811252027466020011236551141,2392,110387245403301,558146Market Share (%)19940.20.2000.10.60.60002.300000.3009.100.30.2000.100.2000.81.20.20000.21.40199500.30000.50.40002.300000.400.18.700.30.2000.100.2000.81.10.10000.21.70199600.30000.40.70001.900000.40012.500.40.2000.100.3000.91.50.30000.2LI0.1SSPS-WW-MS-9702 ©1997 Dataqu est May 12,1997
10 Semiconductor Supply and Pricing WorldwideTable 1-1 (Continued)Each Company's Factory Revenue from Shipments of Total Semiconductors Worldwide(Including Hybrid) (Millions of U .S. Dollars)MitelMotorolaNational SemiconductorNovasensorOak TechnologyOptekOPTiParadigmPerformance SemiconductorPowerexQ LogicQuality SemiconductorQuality TechnologiesQuickLogicRamtronRaytheonRockwellS3Seeq TechnologySemtechSensymSierra SemiconductorSilicon Storage TechnologySilicon SystemsSipexSolitronSpectra Diode LabsStandard MicrosystemsSun MicrosystemsSupertexSymbiosSymphony LaboratoriesTeccor ElectronicsTelcomTexas InstrumentsTrident MicrosystemsTseng LabsUnitrode19941007,2382,127136256130362076452249815108514130222581200298167101000303541260185,548878388Revenue1995888,7222,40815846216755289861466116251257443152748014335369168151500353951568177,83113910510319961458,0762,3800172691192309867455225141311,3514643266018891013917153170334581784187,0641802698Market Share (%)199406.51.90000.10000000000.50.10000.100.30000000.30005.0000199505.81.60000.10000000000.50.2000000.20000000.30005.200019960.15.71.700.1000000000001.00.30000.1000000.10.100.30005.00.100SSPS-WW-MS-9702 ©1997 Dataqu est May 12,1997
Final 1996 Worldwide Semiconductor l\/larket Share 11Table 1-1 (Continued)Each Company's Factory Revenue from Shipments of Total Semiconductors Worldwide(Including Hybrid) (Millions of U .S. Dollars)RevenueMarket Share (%)UniversalVLSI TechnologyVTCWaferScale IntegrationWeitekWestern DigitalXicorXilinxZilogZoranOther AmericasJapanese CompaniesFuji ElectricFujitsuHitachiMatsushitaMitsubishiNECNew JRCNippon Steel SemiconductorOkiRicohRohmSankenSanyoSeiko EpsonSharpShindengen ElectricSonyStanley ElectricTokoToshibaYamahaOther JapaneseEuropean CompaniesABB-HafoAustria Mikro SystemeElex19941358870212818410032122203944,7784463,8696,6442,8963,7727,9612181601,4711821,3456082,3212732,1882421,8760917,5563822779,8344011020199515672155363724011452026503360,5995665,5359,1353,4745,27411,3142375492,0282131,9347332,7143132,5923292,33330111310,07644439212,8373814933199606721724800123566286294050,8844864,4278,0713,0034,10010,4282001981,1771681,7316222,4912562,1242981,9830948,06529566713,681014034199400.50000.200.30.20040.50.43.56.02.63.47.20.20.11.30.21.20.62.10.22.00.21.7006.80.30.38.9000199500.40.1000.200.30.20040.10.43.76.02.33.57.50.20.41.30.11.30.51.80.21.70.21.50.206.70.30.38.5000199600.50.100000.40.20035.90.33.15.72.12.97.40.10.10.80.11.20.41.80.21.50.21.4005.70.20.59.7000SSPS-WW-l\^S-9702 ©1997Dataquest May 12,1997
COCO"DCO00ICDno@LCOCDO05CDCD~-Jo1f111oCLw1—»(nns.n75wo00>t^\oh-lww^oowowoNJooh-^(-»oooo1l-tooMK)enoooKJCB.man3(D1—'ronon'Ulno>(^h->00>t^^^J^VOK>Ott^owowC/1no1—(< ^suf?aen3enh-'Oh->h-'K)^I—'K>VIOOoU5!U3enp;3op»|:^"boWNJ"wwKJ0\"•?>.OS4^>;^4^Ulbi>t^b\oeni-t-£-h-i*nK)OlVOUloroOJ•vO00oK)owoOJ2ni-(o2.XK3hoh-"K)VIh-iWUl4^OKJOk)ok)0C/2ft3nO3I—»ONVOVIto"ooONwJO"ro4^wl-lCJl•-'NOh-'ONroWtrnnpN)|oUllO00VItoOS00ok>otooioXCLB.h-iOltoI-'rfi.^wtoIO"to1 ^VIh->j ^toVIh-"ONo'3Qomt—'fDnf-i-1-1o3.n"Ulno00NO1—»oVI>t^VIooo0VIo00VINONOoooaroooOJ004^NO>;^enooo>nni-iVIo00oOloooo>ent-t*su'TdSUQ.nnO313B>5.fDenNO00>t^NO1—'VI"booOl(-»OJ"oio0000NOH-'1—'boNObiOfti-itn>-io'Tift;u3004^h-'oOl*->oOloooNftI-*-ftX4^OOlONOl4^OOo1enr+noaft4^h-»Ol4^Oooo3^ftenenI-iOlrooooooHW1—«nVI1—1NOVIVIOJ00t—'OJoVIoOlpb\HnC/2VI00t-»oo00OJoooC/5HJ-O)tooNOoOJ"oONOJOJ"otoNOMNOtootoh->C/5OC/213^o3enO3|NJON4^OOJ"OJNO(»4i.'h-'1—1|NJtoit"toiotoNOCfift3k-'•^N"1-1O31—»1—'tNj(->toOlh-»ONOP!-'oog'^"enIONOIOoOJ"NOoo4^"tot-iNOtoONK)ON
Final 1996 Worldwide Semiconductor Market Share 13Table 1-2Each Company's Factory Revenue from Shipments of Total Semiconductors Worldwide(Excluding Hybrid) (Millions of U.S. Dollars)RevenueMarket Share (%)199419951996199419951996Total Market108,848149,607140,222100.0100.0100.0Americas Companies45,62759,83563,46841.940.045.3ACC Microelectronics494045000Actel76109149000.1Adaptec1251242140.100.2Advanced Micro Devices2,1342,3371,9472.01.61.4Allegro Microsystems1481731850.10.10.1Alliance Semiconductor902207600.10Altera1994024970.20.30.4Analog Devices6879251,2180.60.60.9Appian Technology7910000Applied Micro Circuits Corp.484956000ATI Technologies00130000Atmel3755891,0240.30.40.7Brooktree10912000.100Burr-Brown105126157000.1California Micro Devices10138000Catalyst504854000C-Cube00150000.1Cherry Semiconductor7787100000Chip Express0025000Chips & Technologies89138150000.1CID Technologies456000Cirrus Logic7811,0038910.70.70.6Comlinear900000Crosspoint Solutions022000Cypress Semiconductor4005535160.40.40.4Cyrix2412121600.20.10.1Dallas Semiconductor1542282770.10.20.2Digital00271000.2DSP Group186067000Eastman Kodak333000Elantec212232000Electronic Designs264351000ETEQ Microsystems674000Exar169147960.200General Instrument2624133620.20.30.3Gennum293237000SSPS-WW-MS-9702 ©1997Dataquest May 12,1997
14 Semiconductor Supply and Pricing WoridwideTable 1-2 (Continued)Each Company's Factory Revenue from Shipments of Total Semiconductors Worldwide(Excluding Hybrid) (Millions of U.S. Dollars)RevenueMarket Share (%)199419951996199419951996G-Link USA01415000Gould AMI13672950.100Harris6656856290.60.50.4Hewlett-Packard7146489450.70.40.7HoltHoneywell9551164071000000Hughes403639000IBM2,5323,5222,7402.32.42.0IC Sensors567000IMI203539000IMP495435000Integrated Circuit Systems819779000Integrated Device Technology3856175540.40.40.4Integrated Information Tech.354451000Integrated Silicon Solutions6015811100.10Intel10,09913,17217,7819.38.812.7International CMOS Technology121612000International Rectifier3614865200.30.30.4ITT2413162740.20.20.2IXYS556566000Kulite20240000Lattice1341862000.10.10.1Level One Communications078112000Linear Technology2253053650.20.20.3Linfinity414748000Logic Devices141714000LSI Logic9011,2691,2390.80.80.9Lucent Technologies1,3071,6152,1101.21.11.5Maxim1651853830.20.10.3Micrel252624000Micro Linear415454000Micro Power Systems2300000Microchip Technology2122713300.20.20.2Micron Technology1,4922,6011,5581.41.71.1Mjcrosemi100118146000.1Mitel7068129000Motorola7,0128,7228,0766.45.85.8National Semiconductor2,1202,4002,3801.91.61.7SSPS-WW-MS-9702 ©1997 Dataqu est May 12,1997
COC/1"OODCOICO-vlOr^o< < d d -5H r" 3 3 reri jT I IfD cfi P-n Q) ft)o,o*(TO"-» VI fTN00 Ult-iw^ Ul w UloI-'OJONeno Ul ON K)o w Ulh-'(Jj >(^ 00o tfi. K)VIwl-»UlVIht^J^h-'KJUl K)UlO N * . O N N O | S J U 1 O Nh-'Ost-'OOOOUlVl>-» vjMONVIN) OVD00 ON(NJl-»00oV]o ON>(:>.(-J00 00»F>.h-1VI»l:^Ul00 IjjOJ(-lVIo•—ienw1—1VI ON OONO1—»1—»t»00o ONONOJK)hfiONJ^Ul W I-' to Ul ht^h-i t-" iti. Ul NJ Ul(JN NOVI 00K) I-"OJ NOo u i p p o o p pO U l O O O O i - ' O O O O J O O O O O O O J O t - ' O O O h - ' U l O O O O O O O O O H - io o u i p o o ° P Pl - ' j i O O O o i s J O O O O J O O h - ' O O O i N O O O O O O M U l O O O O O O O O O l - iCOCO-vlo o O U l p o o p O i - it - ' U l O O O h - ' O O O O O J o l - ' h - i O O O O O h - ' O O O O J O O O O O O O O O O O
16 Semiconductor Supply and Pricing WorldwideTable 1-2 (Continued)Each Company's Factory Revenue from Shipments of Total Semiconductors Worldwide(Excluding Hybrid) (Millions of U.S. Dollars)RevenueMarket Share (%)199419951996199419951996WaferScale Integration213648000Weitek28370000Western Digital18424000.20.20Xicor100114123000Xilinx3215205660.30.30.4Zilog2222652860.20.20.2Zoran0029000Other Americas393340000Japanese Companies43,64259,23049,63940.139.635.4Fuji Electric4245434650.40.40.3FujitsuHitachi3,7536,5085,3868,9984,2937,9533.46.03.66.03.15.7Matsushita2,8963,4743,0032.72.32.1Mitsubishi3,6635,0763,9133.43.42.8NEC7,86311,18410,3037.27.57.3New JRC2182372000.20.20.1Nippon Steel Semiconductor1605491980.10.40.1Oki1,4582,0151,1641.31.30.8Ricoh1822131680.20.10.1Rohm1,2731,8561,6581.21.21.2SankenSanyo3682,1474502,5213682,3140.32.00.31.70.31.7Seiko Epson2733132560.30.20.2Sharp2,1882,5922,1242.01.71.5Shindengen Electric1943012770.20.20.2Sony1,8352,2921,9181.71.51.4Stanley Electric0301000.20Toko8310586000Toshiba7,49710,0028,0296.96.75.7Yamaha3824442950.40.30.2Other Japanese1773786540.30.30.5European Comparties9,73012,73713,6078.98.59.7ABB-Hafo32330000Austria Mikro Systeme1101491400.100Elex203334000Elmos15197000EM Microelectronics Marin657785000Ericsson94105157000.1SSPS-WW-MS-9702 ©1997Dataquest May 12,1997
Final 1996 Worldwide Semiconductor Marl
18 Semiconductor Supply and Pricing WorldwideTable 1-3Each Company's Factory Revenue from Shipments of Total ICs Worldwide (IncludingHybrid) (Millions of U.S. Dollars)RevenueMarket Share (%)199419951996199419951996Total MarketAmericas Companies95,86142,814132,13655,754123,30059,376100.044.7100.042.2100.048.2ACC Microelectronics494045000Actel76109149000.1Adaptec1251242140.100.2Advanced Micro Devices2,1342,3371,9472.21.81.6Allegro Microsystems1391561810.10.10.1Alliance Semiconductor902207600.20Altera1994024970.20.30.4Analog Devices7399831,2600.80.71.0Appian Technology7910000Applied Micro Circuits Corp.484956000ATI Technologies00130000.1Atmel3755891,0240.40.40.8Brooktree10912000.100Burr-Brown1651862070.20.10.2California Micro Devices10138000Catalyst504854000C-Cube00150000.1Cherry Semiconductor7787100000Chip Express0025000Chips & Technologies8913815000.10.1Cirrus Logic7811,0038910.80.80.7Comlinear1600000Crosspoint Solutions022000Cypress Semiconductor4005535160.40.40.4Cyrix2412121600.30.20.1Dallas Semiconductor1542282770.20.20.2Digital00271000.2DSP Group186067000Elantec242535000Electronic Designs264351000ETEQ Microsystems674000Exar169147960.20.10Gennum313437000G-Link USA01415000Gould AMI13672950.100Harris4784573970.50.30.3SSPS-WW-MS-9702 ©1997 Dataqu est May 12,1997
Final 1996 Worldwide Semiconductor Market Share 19Table 1-3 (Continued)Each Company's Factory Revenue from Shipments of Total ICs Worldwide (IncludingHybrid) (Millions of U.S. Dollars)RevenueMarket Share (%)199419951996199419951996Hewlett-Packard2553423800.30.30.3Holt9110000Honeywell232730000Hughes403639000IBM2,5323,5222,7402.62.72.2IMI203539000IMP495435000Integrated Circuit Systems819779000Integrated Device Technology3856175540.40.50.4Integrated Information Tech.354451000Integrated Silicon Solutions6015811100.10Intel10,09913,17217,78110.510.014.4International CMOS Technology121612000International Rectifier81827000ITT1271241930.100.2Kulite20240000Lattice1341862000.10.10.2Level One Communications078112000Linear Technology2253053650.20.20.3Linfirdty445051000Logic Devices141714000LSI Logic9011,2691,2390.91.01.0Lucent Technologies1,2501,5342,0201.31.21.6Maxim1691893870.20.10.3Micrel252624000Micro Linear415454000Micro Power Systems2300000Microchip Technology2122713300.20.20.3Micron Technology1,4922,6011,5581.62.01.3Mitel100881230.100Motorola6,0967,0226,5846.45.35.3National Semiconductor2,0282,2442,2232.11.71.8Novasensor13150000Oak Technology6284172000.1Optek789000OPTi1301671190.10.10Paradigm365523000Performance Semiconductor20280000SSPS-WW-MS-9702 ©1997 Dataqu est May 12,1997
2dSemiconductor Supply and Pricing WorldwideTable 1-3 (Continued)Each Company's Factory Revenue from Shipments of Total ICs Worldwide (IncludingHybrid) (Millions of U.S. Dollars)RevenueMarket Share (%)199419951996199419951996Q Logic456167000Quality Semiconductor224645000QuickLogic81625000Ramtron152514000Raytheon1001121180.100Rockwell5147441,3510.50.61.1S3Seeq Technology1302231527464320.100.200.40SemtechSierra Semiconductor5120191434218800.100.100.2Silicon Storage Technology03591000Silicon Systems29836900.30.30Sipex161613000Solitron224000Standard Microsystems1001501530.10.10.1Sun Microsystems00170000.1Supertex191917000Symbios3543954580.40.30.4Symphony Laboratories121517000Telcom181718000Texas InstrumentsTrident Microsystems5,471877,7721396,9741805.705.90.15.70.1Tseng LabsUnitrode83881051032698000000Uruversal13150000VLSI Technology5886726720.60.50.5VTCWaferScale Integration70211553617248000.100.10Weitek28370000Western Digital18424000.20.20Xicor1001141230.100Xilinx3215205660.30.40.5Zilog2222652860.20.20.2Zoran0029000Other AmericasJapanese Companies036,288049,7224040,568037.9037.6032.9Fuji ElectricFujitsu893,542985,084853,98603.703.803.2SSPS-WW-MS-9702 ©1997 Dataqu est May 12,1997
FinaM 996 Worldwide Semiconductor Market Share 21Table 1-3 (Continued)Each Company's Factory Revenue from Shipments of Total ICs Worldwide (IncludingHybrid) (Millions of U.S. Dollars)RevenueMarket Share (%)199419951996199419951996Hitachi5,7578,1626,9736.06.25.7Matsushita1,9682,3471,9882.11.81.6Mitsubishi3,1724,6443,5043.33.52.8NEC7,15910,2819,3547.57.87.6New JRC2052231880.20.20.2Nippon Steel Semiconductor1605491980.20.40.2Oki1,4371,9881,1381.51.50.9Ricoh1822131680.20.20.1Rohm6438777570.70.70.6Sanken2402832540.30.20.2Sanyo1,7822,0591,9021.91.61.5Seiko Epson2733132560.30.20.2Sharp1,6781,9561,5071.81.51.2Shindengen Electric482821000Sony1,5131,8981,5671.61.41.3Toko404539000Toshiba5,9318,0256,2046.26.15.0Yamaha3824442950.40.30.2Other Japanese8720518400.20.1European Companies7,2789,41810,3807.67.18.4ABB-Hafo28240000Austria Mikro Systeme1101491400.10.10.1Elex203134000Elmos15197000EM Microelectronics Marin657785000Ericsson8384119000European Silicon Structures40590000GEC Plessey2863323030.30.30.2Micronas204333000Mietec1781791900.20.10.2Philips2,1592,8443,2782.32.22.7SGS-Thomson2,2072,8073,5262.32.12.9Siemens1,5862,3142,2381.71.81.8TCS516558000TEMIC3913423470.40.30.3Thesys15200000Zetex341000Other European212521000SSPS-WW-MS-9702 ©1997 Dataqu est May 12,1997
22 Semiconductor Supply and Pricing WorldwideTable 1-3 (Continued)Each Company's Factory Revenue from Shipments of Total ICs Worldwide (IncludingHybrid) (Millions of U.S. Dollars)RevenueMarket Share (%)199419951996199419951996Asia/Pacific CompaniesAcer9,4817017,2428012,976509.9013.0010.50DaewooHoltek387049874599000000Hualon Microelectronics Corp.HyundaiKorean Electronic Co.891,521471074,13245472,2475101.6003.1001.80LG Semicon1,6972,8632,2431.82.21.8MacronixMosel Vitelic2212592715023543980.20.30.20.40.30.3SamsungSilicon Integrated Systems4,6421018,0111276,1491274.80.16.105.00.1United Microelectronics Corp.Vanguard418047704922250.400.400.40.2VIA00110000Winbond Electronics3084913390.30.40.3Source: Dataquesl (April 1997)SSPS-WW-MS-9702 ©1997Dataquest; May 12,1997
Final 1996 Worldwide Semiconductor Market Share 23Table 1-4Each Company's Factory Revenue from Shipments of Total Integrated CircuitsWorldwide (Excluding Hybrid) (Millions of U.S. Dollars)RevenueMarket Share (%)199419951996199419951996Total Market94,196130,481121,832100.0100.0100.0Americas Companies42,38955,56859,22745.042.648.6ACC Microelectronics494045000Actel76109149000.1Adaptec1251242140.100.2Advanced Micro Devices2,1342,3371,9472.31.81.6Allegro Microsystems1391441660.10.10.1Alliance Semiconductor902207600.20Altera1994024970.20.30.4Analog Devices6879251,2180.70.71.0Appian Technology7910000Applied Micro Circuits Corp.484956000ATI Technologies00130000.1Atmel3755891,0240.40.50.8Brooktree10912000.100Burr-Brown1051261570.100.1California Micro Devices10138000Catalyst504854000C-Cube00150000.1Cherry Semiconductor7787100000Chip Express0025000Chips & Technologies8913815000.10.1Cirrus Logic7811,0038910.80.80.7Comlinear900000Crosspoint Solutions022000Cypress Semiconductor4005535160.40.40.4Cyrix2412121600.30.20.1Dallas Semiconductor1542282770.20.20.2Digital00271000.2DSP Group186067000Elantec212232000Electronic Designs264351000ETEQ Microsystems674000Exar169147960.20.10Gennum293237000G-Link USA01415000Gould AMI13672950.100Harris4784573970.50.40.3SSPS-WW-MS-9702 ©1997Dataquest May 12,1997
24 Semiconductor Supply and Pricing WorfdwideTable 1-4 (Continued)Each Company's Factory Revenue from Shipments of Total Integrated CircuitsWorldwide (Excluding Hybrid) (Millions of U.S. Dollars)RevenueMarket Share (%)199419951996199419951996Hewlett-PackardHolt25593421138000.300.300.30HoneywellHughesIBMIMI23402,5322027363,5223530392,74039002.70002.70002.20IMPIntegrated Circuit Systems498154973579000000Integrated Device TechnologyIntegrated Information Tech.3853561744554510.400.500.50Integrated Silicon Solutions6015811100.10Intel10,09913,17217,78110.710.114.6International CMOS Technology121612000International Rectifier81827000ITT1271241930.100.2Kulite20240000Lattice1341862000.10.10.2Level One Communications078112000Linear Technology2253053650.20.20.3Linfinity414748000Logic Devices141714000LSI Logic9011,2691,2391.01.01.0Lucent TechnologiesMaxim1,2501651,5341852,0203831.30.21.20.11.70.3Micrel252624000Micro Linear415454000Micro Power SystemsMicrochip Technology232120271033000.200.200.3Micron Technology1,4922,6011,5581.62.01.3Mitel7068107000MotorolaNational Semiconductor5,8702,0217,0222,2366,5842,2236.22.15.41.75.41.8Novasensor13150000Oak Technology6284172000.1Optek789000OPTi1301671190.10.10Paradigm365523000Performance Semiconductor20280000SSPS-WW-MS-9702 ©1997Dataquest I\^ay12,1997
Final 1996 Worldwide Semiconductor Market Share 25Table 1-4 (Continued)Each Company's Factory Revenue from Shipments of Total Integrated CircuitsWorldwide (Excluding Hybrid) (Millions of U.S. Dollars)RevenueMarket Share (%)199419951996199419951996Q Logic456167000Quality Semiconductor224645000QuickLogic81625000Ramtron152514000Raytheon1001121180.100Rockwell5147441,3510.50.6LIS31303154640.10.20.4Seeq Technology222732000Semtech51942000Sierra Semiconductor1201431880.10.10.2Silicon Storage Technology03591000Silicon Systems29836900.30.30Sipex220000Solitron001000Standard Microsystems1001501530.10.10.1Sun Microsystems00170000.1Supertex191917000Symbios3543954580.40.30.4Symphony Laboratories121517000Telcom181718000Texas Instruments5,4717,7726,9745.86.05.7Trident Microsystems8713918000.10.1Tseng Labs8310526000Unitrode7310398000Universal13150000VLSI Technology5886726720.60.50.6VTC7015517200.10.1WaferScale Integration213648000Weitek28370000Western Digital18424000.20.20Xicor1001141230.100.1Xilinx3215205660.30.40.5Zilog2222652860.20.20.2Zoran0029000Other Americas0040000Japanese Companies35,15248,35339,32337.337.132.3Fuji Electric677564000Fujitsu3,4264,9353,8523.63.83.2SSPS-WW-MS-9702 ©1997Dataquest May 12,1997
COCO-oCOCOICO-~JoN3@CDCO-vlaB3CDCD--Jo3^TOwc;nOfD(U34^4^OOooNroft*(DOJ4^I-"ooo5^re05[flh-'OlhJoooooHMhHnwVOh-lU)t;^K)OJh(^•^Oj^owowHncrUlh-'ON(JlOl00oooV)re'3re3enh-'Xf\00Jvj"wK-lht^^KJTow00h-'S]h-'00(-»boonnC/515^o301O3NJTooJO"boo^^w"InK>0\Is3COKlK3K>^O•^35:•5'enJO"•-»oOlJO"Vi^o00|ow00KJSJhOf-"hO•01ft3C/301l-»*reiI-'i-»o(-1J^soh-lrf^oph-JpJ-lpf-">wtffiPJi-KorNjoI—'VOOOoowreSJ3no3Bls.re01;S^3tu3-w00ro*>•ht'4^rosoOlohfcowoisj5^SIy"bo^JroVI"soOlh-'^Os"I—iOS00OSroOS•-'OlJ-'o^OJroOJvjOJhJoooC/1o3I—""4iVIroh-i"boOlVIt—i"oioroh-1OS•-»it^I—'k)053"B)>-lh-'"bsVI00h-l"soOlOSh-'"oioVI1—»boh-'Olt—'roC/5ret-**?r0Ol§roVIOJOJ(->OJhoOlOSoOJok)otoCDSi3oh-»"bso00h-'"boOSOS1—1"viroOlh-»VI(-14^(—'4i.orOlVIl-iVIsosoOS004^pbspbspbsnO3'1—'00rorot—»OJ»-»OS00pk)ok)ph-'01—'"4^ro4^t-i"soVIOl"h-"KJOlh-'Ol1—»Olpsoz•TSo3U3H-rore^enre3nO3an*-hOI-!h-»OSOOl4^soh-lSO00pkjo4^ok)Zre*—1>dnK)OOlroroOJI—»0000okJokJokJztilnVI"oOSh-1"hJOl(-»so"k>|sjsoVIOlVIboVIbs"""
Final 1996 Worldwide Semiconductor Market Share 27Table 1-4 (Continued)Each Company's Factory Revenue from Shipments of Total Integrated CircuitsWorldwide (Excluding Hybrid) (Millions of U.S. Dollars)RevenueMarket Share (%)199419951996199419951996Asia/Pacific CompaniesAcer9,4817017,2428012,9765010.1013.2010.70Daewoo384945000Holtek708799000Hualon Microelectronics Corp.8910747000Hyundai1,5214,1322,2471.63.21.8Korean Electronic Co.474551000LG Semicon1,6972,8632,2431.82.21.8Macronix2212713540.20.20.3Mosel Vitelic2595023980.30.40.3Samsung4,6428,0116,1494.96.15.0Silicon Integrated Systems1011271270.100.1United Microelectronics Corp.4184774920.40.40.4Vanguard00225000.2VIA00110000Winbond Electronics3084913390.30.40.3Source: Dataquest (April 1997)SSPS-WW-MS-9702 ©1997 Dataquest May 12,1997
28 Semiconductor Supply and Pricing WorldwideTable 1-5Each Company's Factory Revenue from Shipments of Bipolar Digital Worldwide(Millions of U.S. Dollars)RevenueMarket Share (%)199419951996199419951996Total MarketAmericas CompaniesAdvanced Micro DevicesApplied Micro Circuits Corp.HarrisLucent TechnologiesMotorolaNational Semiconductor2,9121,473143206634212212,4551,295100194503812091,8499536230470271161100.050.64.90.70.22.214.57.6100.052.74.10.80.22.015.58.5100.051.53.41.60.23.814.78.7RaytheonTexas InstrumentsJapanese CompaniesFujitsuHitachiMatsushitaMitsubishi225771,2073954652923195139722034422937153407529045119250.819.841.413.616.01.00.80.820.939.68.318.01.21.50.818.440.74.924.41.01.4NEC194109906.74.44.9Oki333641.11.50.2Toshiba68116732.34.73.9European Companies1861741346.47.17.2GEC Plessey1610120.50.40.6Philips121123904.25.04.9SGS-Thomson12600.40.20Siemens3331321.11.31.7Other European4400.10.20Asia/Pacific Companies4614101.60.60.5LG Semicon4614101.60.60.5Source: Dataquest (April 1997)SSPS-WW-MS-9702 ©1997 Dataquest May 12,1997
Final 1996 Worldwide Semiconductor Market Share 29Table 1-6Each Company's Factory Revenue from Shipments of Bipolar Logic Worldwide(Millions of U.S. Dollars)RevenueMarket Share (%)199419951996199419951996Total Market2,6782,1821,620100.0100.0100.0Americas Companies1,4021,15492252.452.956.9Advanced Micro Devices10269623.83.23.8Applied Micro Circuits Corp.2019300.70.91.9Harris6440.20.20.2Lucent Technologies6045702.22.14.3Motorola42035925115.716.515.5National Semiconductor2121381577.96.39.7Raytheon1715120.60.70.7Texas Instruments56550533621.123.120.7Japanese Companies1,05885457739.539.135.6Fujitsu3631837013.68.44.3Hitachi37236137213.916.523.0Matsushita2626191.01.21.2Mitsubishi2337250.91.71.5NEC178100826.64.65.1Oki333641.21.60.2Toshiba6311152.45.10.3European Companies172160HI6.47.36.9GEC Plessey161000.60.50Philips107109794.05.04.9SGS-Thomson12600.40.30Siemens3331321.21.42.0Other European4400.10.20Asia/Pacific Companies4614101.70.60.6LG Semicon4614101.70.60.6Source: Dataquest (April 1997)SSPS-WW-MS-9702 ©1997 Dataquest May 12,1997
30 Semiconductor Supply and Pricing WorldwideTable 1-7Each Company's Factory Revenue from Shipments of Other Bipolar Logic/Memory/Microcomponents Worldwide (Millions of U.S. Dollars)RevenueMarket Share (%)199419951996199419951996Total Market234273229100.0100.0100.0Americas Companies711413130.351.613.5Advanced Micro Devices4131017.511.40Lucent Technologies3501.31.80Motorola122200.48.18.7National Semiconductor97143.826.01.7Raytheon5432.11.51.3Texas Instruments12845.12.91.7Japanese Companies14911817563.743.276.4Fujitsu32202013.77.38.7Hitachi93817939.729.734.5Matsushita3301.31.10NECToshiba165958686.82.13.31.83.529.7European Companies1414236.05.110.0GEC Plessey0012005.2Philips1414116.05.14.8Source: Dataquest (April 1997)SSPS-WW-IVIS-9702 ©1997 Dataquest May 12,1997
Final 1996 Worldwide Semiconductor Market Share 31Table 1-8Each Company's Factory Revenue from Shipments of MOS Digital ICs Worldwide(Millions of U.S. Dollars)RevenueMarket Share (%)199419951996199419951996Total Market76,021110,410100,683100.0100.0100.0Americas Companies34,45646,97949,75245.342.549.4ACC Microelectronics494045000ActelAdaptecAdvanced Micro Devices761251,8041091242,0641492141,77000.22.400.11.90.10.21.8Allegro Microsystems500000Alliance Semiconductor90220760.10.20Altera1994024970.30.40.5Analog Devices851162580.10.10.3Appian Technology7910000Applied Micro Circuits Corp.212521000ATI Technologies00130000.1Atmel3635739880.50.51.0California Micro Devices565000Catalyst494854000C-Cube00150000.1Chip Express0025000Chips & Technologies891381500.10.10.1Cirrus Logic6818877410.90.80.7Crosspoint Solutions022000Cypress Semiconductor4005535160.50.50.5Cyrix2412121600.30.20.2Dallas Semiconductor1542282300.20.20.2Digital00271000.3DSP Group186067000Electronic Designs264351000ETEQ Microsystems674000Exar0169000G-Link USA01415000Gould AMI10572950.100Harris1881931620.20.20.2Hewlett-Packard2553423800.30.30.4Holt230000Hughes212021000IBM2,5323,5222,7403.33.22.7IMI183034000IMP9120000SSPS-WW-MS-9702 ©1997 Dataqu est May 12,1997
32 Semiconcfuctor Supply and Pricing WorldwideTable 1-8 (Continued)Each Company's Factory Revenue from Shipments of MOS Digital ICs Worldwide(Millions of U.S. Dollars)RevenueMarket Share (%)199419951996199419951996Integrated Circuit Systems425250000Integrated Device Technology3856175540.50.60.6Integrated Information Tech.354451000Integrated Silicon Solutions6015811100.10.1Intel10,07913,16317,78113.311.917.7International CMOS Technology121612000ITT1031101830.100.2Lattice1341862000.20.20.2Logic Devices141714000LSI Logic9011,2691,2391.21.11.2Lucent Technologies7851,2001,6491.01.11.6Micrel776000Micro Linear600000Microchip Technology2122713300.30.20.3Micron Technology1,4922,6011,5582.02.41.5Motorola4,5255,6105,1036.05.15.1National Semiconductor8939931,0221.20.91.0Oak Technology6284172000.2OPTi1301671190.20.20.1Paradigm365523000Performance Semiconductor20280000Q Logic456167000Quality Semiconductor224645000QuickLogic81625000Ramtron152514000Rockwell5147441,2300.70.71.2S31303154640.20.30.5Seeq Technology222712000Sierra Semiconductor354762000Silicon Storage Technology03591000Standard Microsystems1001501530.10.10.2Sun Microsystems00170000.2Supertex665000Symbios2982933060.40.30.3Sjonphony Laboratories121517000Texas Instruments4,0526,3254,9045.35.74.9Trident Microsystems871391800.10.10.2Tseng Labs83105260.100SSPS-WW-l\/IS-9702 ©1997Dataquest: May 12,1997
Final 1996 Worldwide Semiconductor Market Share 33Table 1-8 (Continued)Each Company's Factory Revenue from Shipments of MOS Digital ICs Worldwide(Millions of U.S. Dollars)RevenueMarket Share (%)199419951996199419951996Universal780000VLSI Technology5886726720.80.60.7WaferScale Integration213648000Weitek28370000Western Digital18424000.20.20Xicor1001141230.10.10.1Xilinx3215205660.40.50.6Zilog2222652860.30.20.3Zoran0029000Other Americas0040000Japanese Companies29,03441,67733,36138.237.733.1Fuji Electric404641000Fujitsu2,8764,4173,4713.84.03.4Hitachi4,7997,2285,9956.36.56.0Matsushita1,3281,6791,4221.71.51.4Mitsubishi2,5843,9542,8953.43.62.9NEC6,3619,4018,5158.48.58.5New JRC324028000Nippon Steel Semiconductor1605491980.20.50.2Oki1,3651,9111,1031.81.71.1Ricoh1681751180.20.20.1Rohm2103763270.30.30.3Sanyo7979729451.00.90.9Seiko Epson2602972420.30.30.2Sharp1,5821,8511,4152.11.71.4Sony1,0071,3031,0501.31.21.0Toshiba5,0156,9205,1866.66.35.2Yamaha3634162890.50.40.3Other Japanese871421210.10.10.1European Companies3,4994,9315,0404.64.55.0Austria Mikro Systeme466854000Flex202313000Elmos15197000EM Microelectronics Marin024000Ericsson151919000European Silicon Structures40480000GEC Plessey1291641280.20.10.1Mietec323532000SSPS-WW-MS-9702 ©1997 Dataqu est May 12,1997
34 Semiconductor Supply and Pricing WorldwideTable 1-8 (Continued)Each Company's Factory Revenue from Shipments of MOS Digital ICs Worldwide(Millions of U.S. Dollars)RevenueMarket Share (%)199419951996199419951996Philips1,0271,4181,8571.41.31.8SGS-Thomson9981,3181,4841.31.21.5Siemens1,0071,5911,2261.31.41.2TCS314144000TEMICThesysAsia/Pacific CompaniesAcerDaewooHoltekHualon Microelectronics Corp.HyundaiLG SemiconMacronixMosel VitelicSamsungSilicon Integrated SystemsUnited Microelectronics Corp.124159,032702170801,5211,6062212594,4091014181652016,823802787984,1302,8072715027,775127477172012,530502199422,2462,1933543985,8891274920.2011.90000.12.02.10.30.35.80.10.50.1015.200003.72.50.20.57.00.10.40.2012.400002.22.20.40.45.80.10.5VanguardVIAWinbond Electronics0025600442225110284000.3000.40.20.10.3Source: Dataquest (April 1997)SSPS-WW-l\/IS-9702 ©1997 Dataquest May 12,1997
Final 1996 Worldwide Semiconductor Market Share 35Table 1-9Each Company's Factory Revenue from Shipments of MOS Memory Worldwide(Millions of U.S. Dollars)RevenueMarket Share (%)199419951996199419951996Total Market33,50555,28737,807100.0100.0100.0Americas Companies8,43013,6419,39925.224.724.9Advanced Micro Devices4427197111.31.31.9Alliance Semiconductor90210660.30.40.2Atmel3314787931.00.92.1Catalyst4948540.100.1Cypress Semiconductor2854243820.90.81.0Dallas Semiconductor3056000.10Electronic Designs264351000.1G-Link USA01415000Gould AMI44000.100Harris12189000IBM1,5202,1009964.53.82.6IMP100000Integrated Device Technology2524443780.80.81.0Integrated Silicon Solutions601581110.20.30.3Intel4587669501.41.42.5ITT1000000Logic Devices252000Lucent Technologies330000Microchip Technology821021170.20.20.3Micron Technology1,4922,6011,5584.54.74.1Motorola9481,2378272.82.22.2National Semiconductor1791881270.50.30.3Paradigm3655230.100Performance Semiconductor570000Quality Semiconductor7141000Ramtron152514000Seeq Technology560000Silicon Storage Technology03591000.2Texas Instrun\ents1,9313,7541,9845.86.85.2WaferScale Integration151716000Xicor1001141230.30.20.3Japanese Companies15,51924,06215,70846.343.541.5Fujitsu1,6922,5891,6565.04.74.4Hitachi3,2325,1323,5149.69.39.3Matsushita3964923001.20.90.8Mitsubishi1,6522,5471,6144.94.64.3SSPS-WW-MS-9702 ©1997Dataquest May 12,1997
36 Semiconductor Supply and Pricing WorldwideTable 1-9 (Continued)Each Company's Factory Revenue from Shipments of MOS Memory Worldwide(Millions of U.S. Dollars)RevenueMarket Share (%)199419951996199419951996NECNippon Steel SemiconductorOkiRicohRohmSanyoSeiko EpsonSharpSonyToshibaYamahaOther JapaneseEuropean CompaniesPhilipsSGS-ThomsonSiemensTEMICAsia/Pacific CompaniesHoltekHualon Microelectronics Corp.HyundaiLG SemiconMacronixMosel VitelicSamsungUnited Microelectronics Corp.VanguardWinbond Electronics3,0961606971956183428673873,0181211,48414589858238,0720461,5151,5252002594,19419101425,3535491,228661257411,0304894,2641232,02306461,3532415,5610544,1162,6352365027,49820303173,913198541351302197273302,5131261,66907389112011,0312232,2362,0212883985,5011772251609.20.52.100.20.50.12.61.29.0004.401.82.6024.100.14.54.60.60.812.50.600.49.71.02.200.10.501.90.97.7003.701.22.4028.1007.44.80.40.913.60.400.610.30.51.400.10.801.90.96.6004.402.02.4029.2005.95.30.81.114.60.50.60.4Source: Dataquest (April 1997)SSPS-WW-MS-9702 ©1997 Dataquest May 12,1997
Final 1996 Worldwide Semiconductor Market Share 37Table 1-10Each Company's Factory Revenue from Shipments of MOS MicrocomponentsWorldwide (Millions of U.S. Dollars)RevenueMarket Share (%)199419951996199419951996Total Market26,40834,50441,321100.0100.0100.0Americas Companies18,84324,20430,30271.470.173.3ACC Microelectronics4940450.20.10.1Adaptec1251242140.50.40.5Advanced Micro Devices1,0219256243.92.71.5Alliance Semiconductor01010000Analog Devices851162580.30.30.6Appian Technology7910000ATI Technologies00130000.3Atmel52849000.1California Micro Devices565000C-Cube00150000.4Chips & Technologies891381500.30.40.4Cirrus Logic6818877412.62.61.8Cypress Semiconductor4050640.20.10.2Cyrix2412121600.90.60.4Dallas Semiconductor223511300.10.3Digital00271000.7DSP Group18606700.20.2Harris5267490.20.20.1Hughes333000IBM3997037411.52.01.8IMP810000Integrated Device Technology5163700.20.20.2Integrated Information Tech.3544510.10.10.1Intel9,59512,39716,83136.335.940.7ITT121543000.1LSI Logic781071030.30.30.2Lucent Technologies3055106351.21.51.5Micro Linear600000Microchip Technology1301692130.50.50.5Motorola2,3632,9873,1538.98.77.6National Semiconductor4525426271.71.61.5Oak Technology62841720.20.20.4OPTi1301671190.50.50.3Performance Semiconductor15210000Q Logic4561670.20.20.2Rockwell5097381,2261.92.13.0SSPS-WW-MS-9702 ©1997 Dataqu est May 12,1997
38 Semiconductor Supply and Pricing WorldwideTable 1-10 (Continued)Each Company's Factory Revenue from Shipments of MOS MicrocomponentsWorldwide (Millions of U.S. Dollars)RevenueMarket Share (%)199419951996199419951996S31303154640.50.91.1Seeq Technology172112000Sierra Semiconductor3547620.10.10.2Standard Microsystems1001501530.40.40.4Sun Microsystems00170000.4Supertex110000SymbiosSymphony Laboratories81128515102170.300.200.20Texas Instruments1,0061,2541,5503.83.63.8Trident Microsystems871391800.30.40.4Tseng Labs83105260.30.30VLSI Technology216193570.80.60.1WaferScale Integration31830000Weitek283700.10.10Western Digital18424000.70.70Zilog2222652860.80.80.7Zoran0029000Japanese Companies6,1378,0938,11523.223.519.6Fuji Electric233000Fujitsu3906506771.51.91.6Hitachi9981,4411,6293.84.23.9Matsushita4605555341.71.61.3Mitsubishi6989829012.62.82.2NEC1,6782,0612,1796.46.05.3New JRC245000Oki2172331750.80.70.4RicohRohm8350757176660.30.20.20.20.20.2Sanyo1611871640.60.50.4Seiko Epson212822000Sharp1922211840.70.60.4Sony1942331890.70.70.5Toshiba7181,0941,1972.73.22.9Yamaha2732451071.00.70.3Other Japanese0107000European Companies851\A2,2>1,9773.24.24.8Elex152313000EM Microelectrorucs Marin024000SSPS-WW-l\/lS-9702 ©1997 Dataqu est May 12,1997
Final 1996 Worldwide Semiconductor Market Share 39Table 1-10 (Continued)Each Company's Factory Revenue from Shipments of MOS MicrocomponentsWorldwide (Millions of U.S. Dollars)RevenueMarket Share (%)199419951996199419951996GEC Plessey111010000Philips4036621,0851.51.92.6SGS-Thomson2274374820.91.31.2Siemens1282092840.50.60.7TCS162221000TEMIC5168780.20.20.2Asia/Pacific Companies5777749272.22.22.2Acer6877500.30.20.1Daewoo172318000Holtek203444000.1Hyimdai211000LG Semicon2956590.10.20.1Macronix21352000.10Samsung4487990.20.30.2Silicon Integrated Systems1011271270.40.40.3United Microelectronics Corp.2272743150.90.80.8VIA00110000.3Winbond Electronics4860840.20.20.2Source: Dataquest (April 1997)SSPS-WW-MS-9702 ©1997 Dataquest May 12,1997
40 Semiconductor Supply and Pricing WorldwideTable 1-11Each Company's Factory Revenue from Shipments of MOS Digital Logic Worldwide(Millions of U.S. Dollars)RevenueMarket Share (%)199419951996199419951996Total MarketAmericas Companies16,1087,18320,6199,13421,55510,051100.044.6100.044.3100.046.6Actel761091490.50.50.7Advanced Micro Devices3414204352.12.02.0Allegro MicrosystemsAltera51990402049701.201.902.3Applied Micro Circuits Corp.2125210.10.10Atmel27671460.20.30.7Chip Express0025000.1Crosspoint Solutions022000Cypress Semiconductor7579700.50.40.3Dallas Semiconductor1021371170.60.70.5ETEQ Microsystems674000Exar0169000Gould AMI6172950.40.30.4Harris1241081040.80.50.5Hewlett-Packard2553423801.61.71.8Holt230000Hughes1817180.100IBM6137191,0033.83.54.7IMI1830340.10.10.2IMP0110000Integrated Circuit Systems4252500.30.30.2Integrated Device Technology821101060.50.50.5Intel26000.200International CMOS Technology121612000ITT81951400.50.50.6Lattice1341862000.80.90.9Logic Devices121212000LSI Logic8231,1621,1365.15.65.3Lucent Technologies4776871,0143.03.34.7Micrel776000Motorola1,2141,3861,1237.56.75.2National Semiconductor2622632681.61.31.2Quality SemiconductorQuickLogic15832164425000.200.20.1Rockwell564000Supertex555000SSPS-WW-MS-9702 ©1997Dataquest May 12,1997
Final 1996 Worldwide Semiconductor IVlarket Share 41Table 1-11 (Continued)Each Company's Factory Revenue from Shipments of MOS Digital Logic Worldwide(Millions of U.S. Dollars)RevenueMarket Share (%)199419951996199419951996Symbios2172082041.31.00.9Texas Instruments1,1151,3171,3706.96.46.4Universal780000VLSI Technology3724796152.32.32.9WaferScale Integration312000Xilinx3215205662.02.52.6Other Americas0040000.2Japanese Companies7,3789,5229,53845.846.244.2Fuji Electric3843380.20.20.2Fujitsu7941,1781,1384.95.75.3Hitachi5696558523.53.24.0Matsushita4726325882.93.12.7Mitsubishi2344253801.52.11.8NEC1,5871,9872,4239.99.611.2New JRC3036230.20.20.1Oki4514503872.82.21.8Ricoh6694390.40.50.2Rohm1042442100.61.21.0Sanyo4535284792.82.62.2Seiko Epson1972282011.21.10.9Sharp5236005043.22.92.3Sony4265815312.62.82.5Toshiba1,2791,5621,4767.97.66.8Yamaha891701810.60.80.8Other Japanese66109880.40.50.4European Companies1,1641,4751,3947.27.26.5Austria Mikro SystemeElex4656805400.300.300.30Elmos15197000Ericsson151919000European Silicon Structures404800.20.20GEC Plessey1181541180.70.70.5Mietec3235320.20.20.1Philips6107567723.83.73.6SGS-Thomson1822352641.11.11.2Siemens2129310.10.10.1TCS151923000.1TEMIC5073740.30.40.3SSPS-WW-MS-9702 ©1997Dataquest May 12,1997
42 Semiconductor Supply and Pricing WorldwideTable 1-11 (Continued)Each Company's Factory Revenue from Shipments of MOS Digital Logic Worldwide(Millions of U.S. Dollars)RevenueMarket Share (%)199419951996199419951996Thesys15200000Asia/Pacific Companies3834885722.42.42.7Acer230000Daewoo443000Holtek5053530.30.30.2Hualon Microelectronics Corp.3444190.20.20Hyiindai4139000LG Semicon521161130.30.60.5Macronix0046000.2Samsung1711902891.10.91.3Winbond Electronics6665400.40.30.2Source: Dataquest (April 1997)SSPS-WW-MS-9702 ©1997 Dataquest May 12,1997
Final 1996 Worldwide Semiconductor Market Share 43Table 1-12Each Company's Factory Revenue from Shipments of Analog-Monolithic Worldwide(Millions of U.S. Dollars)RevenueMarket Share (%)199419951996199419951996Total Market15,26317,61619,300100.0100.0100.0Americas Companies6,4607,2948,52242.341.444.2Advanced Micro Devices1871731151.21.00.6Allegro Microsystems1341441660.90.80.9Analog Devices6028099603.94.65.0Applied Micro Circuits Corp.755000AtmelBrooktree121091612036000.700.70.20Burr-Brown1051261570.70.70.8California Micro Devices573000Catalyst100000Cherry Semiconductor77871000.50.50.5Cirrus Logic1001161500.70.70.8Comlinear900000Dallas Semiconductor0047000.2Elantec2122320.10.10.2Exar169131871.10.70.5Gennum2932370.20.20.2Gould AMI31000.200Harris2842602311.91.51.2HoltHoneywell72382703000.200.200.2Hughes1916180.100IMI255000IMP4042350.30.20.2Integrated Circuit Systems3945290.30.30.2Intel20900.100International Rectifier8182700.10.1ITT2414100.200Kulite202400.10.10Level One Communications07811200.40.6Linear Technology2253053651.51.71.9Linfinity4147480.30.30.2Lucent Technologies4022843012.61.61.6Maxim1651853831.11.12.0Micrel1819180.10.10Micro Linear3554540.20.30.3Micro Power Systems23000.200SSPS-WW-MS-9702 ©1997Dataquest May 12,1997
44 Semiconductor Supply and Pricing WorldwideTable 1-12 (Continued)Each Company's Factory Revenue from Shipments of Analog-Monolithic Worldwide(Millions of U.S. Dollars)RevenueMarket Share (%)199419951996199419951996Mitel70681070.50.40.6Motorola9241,0311,2106.15.96.3National Semiconductor9071,0341,0405.95.95.4Novasensor13150000Optek789000Raytheon78931030.50.50.5Rockwell00121000.6Seeq Technology0020000.1SemtechSierra Semiconductor58519964212600.60.10.50.20.7Silicon Systems29836902.02.10Sipex220000Solitron001000Supertex131312000Symbios561021520.40.60.8Telcom1817180.100Texas Instruments8429341,7305.55.39.0Unitrode73103980.50.60.5Universal670000VTC701551720.50.90.9Japanese Companies4,9115,7045,21032.232.427.0Fuji Electric2729230.20.20.1Fujitsu1553152911.01.81.5Hitachi3573554092.32.02.1MatsushitaMitsubishiNECNew JRCOkiRicoh6114565061732614639455641183283854739762416018504.03.03.31.10.203.62.63.61.00.20.22.82.13.20.800.3RohmSanyoSeiko EpsonSharp36181113964238941610535778014922.45.300.62.45.100.61.84.000.5SonyTokoToshibaYamahaOther Japanese46532789190554379152849452319096503.00.25.20.103.10.25.20.20.32.30.24.700.3SSPS-WW-MS-9702 ©1997 Dataqu est May 12,1997
Final 1996 Worldwide Semiconductor Market Share 45Table 1-12 (Continued)Each Company's Factory Revenue from Shipments of Analog-Monolithic Worldwide(Millions of U.S. Dollars)RevenueMarket Share (%)199419951996199419951996European Companies3,4894,2135,13222.923.926.6ABB-Hafo201900.10.10Austria Mikro Systeme6481860.40.50.4Elex0821000.1EM Microelectronics Marin6575810.40.40.4Ericsson4950870.30.30.5European Silicon Structures0110000GEC Plessey1351551630.90.90.8Micronas2033330.10.20.2Mietec1461441581.00.80.8Philips9571,2571,2916.37.16.7SGS-Thomson1,1971,4832,0427.88.410.6Siemens5466929803.63.95.1TCS2024140.10.10TEMIC2671771751.71.00.9Zetex341000Asia/Pacific Companies4034054362.62.32.3Daewoo1722240.10.10.1Hualon Microelectronics Corp.995000Hyundai021000Korean Electronic Co.4745510.30.30.3LG Semicon4542400.30.20.2Samsung2332362601.51.31.3Winbond Electronics5249550.30.30.3Source: Dataquest (April 1997)SSPS-WW-MS-9702 ©1997 Dataquest May 12,1997
46 Semicondudtor Supply and Pricing WorldwideTable 1-13Each Company's Factory Revenue from Shipments of Total Discrete Worldwide(Millions of U.S. Dollars)RevenueMarket Share (%)199419951996199419951996Total Market10,76314,31413,475100.0100.0100.0Americas Companies2,5393,7203,41723.626.025.4Allegro MicrosystemsGeneral Instrument9262294131936202.40.22.90.12.7Harris1872282321.71.61.7Hewlett-Packard991461400.91.01.0International Rectifier3534684933.33.33.7ITT114192811.11.30.6IXYS5565660.50.50.5Lucent Technologies600000Microsemi1001181460.90.81.1Motorola1,0971,6501,45210.211.510.8National SemiconductorOptek991164115710.901.101.20Powerex7698980.70.70.7Raytheon81313000Semtech2029240.20.20.2Solitron565000Supertex1116160.10.10.1Teccor Electronics6068840.60.50.6Texas Instruments3216280.30.10.2Japanese Comparues5,6927,1426,77452.949.950.3Fuji Electric3574684013.33.33.0Fujitsu1922832901.82.02.2HitachiMatsushita7985118896319775657.44.76.24.47.34.2MitsubishiNEC4246524798314528183.96.13.35.83.46.1New JRC223000OkiRohmSanken10524334127713981168132804.93.105.42.805.12.4Sanyo3894884413.63.43.3Shindengen Electric1943012771.82.12.1Sony5053430.50.40.3Toko5168550.50.50.4Toshiba1,2041,4281,39011.210.010.3Other Japanese0404200.30.3SSPS-WW-MS-9702 ©1997Dataquest May 12,1997
Final 1996 Worldwide Semiconductor Marl
48 Semiconductor Supply and Pricing WorldwideTable 1-14Each Company's Factory Revenue from Shipments of Total Optical SemiconductorsWorldwide (Millions of U.S. Dollars)Total MarketAmericas CompaniesCID TechnologiesEastman KodakHewlett-PackardHoneywellIC SensorsLucent TechnologiesMitelMotorolaOptekQuality TechnologiesSensymSpectra Diode LabsTexas InstrumentsOther AmericasJapanese CompaniesFujitsuHitachiMatsushitaMitsubishiNECNew JRCOkiRohmSankenSanyoSharpSonyStanley ElectricToshibaOther JapaneseEuropean CompaniesABB-HafoEricssonSiemens19943,8896994336032551045484981045392,7981358941717615011241783415051031304211903781215220Revenue1995 19964,8125475316037681050536101543333,7351688449615120212282865216763638230162314750414163144,9158246342541790224059520176203,542151121450144256928293401486173730471441517023339Market Share (%)1994100.018.00.109.30.80.11.301.21.21.30.20.31.21.071.93.52.310.74.53.90.30.64.60.93.913.18.0010.84.99.70.30.45.71995 3996100.0 100.011.40.103.30.80.1L701.01.11.300.30.90.777.63.51.710.33.14.20.20.65.91.13.513.27.96.312.93.110.50.30.36.516.80.108.60.80.11.80.40.81.21.100.31.3072.13.12.59.22.95.20.20.66.00.83.012.67.609.69.010.500.56.9SSPS-WW-l\/IS-9702 ©1997Dataquest May 12,1997
Final 1996 Worldwide Semiconductor Market Share 49ITable 1-14 (Continued)Each Company's Factory Revenue from Shipments of Total Optical SemiconductorsWorldwide (Millions of U.S. Dollars)RevenueMarket Share (%)199419951996199419951996TCS2634250.70.70.5TEMIC931101132.42.32.3Zetex111000Other European1115160.30.30.3Asia/Pacific Companies1426320.40.50.7Korean Electronic Co.1122240.30.50.5Samsung348000.2Source: Dataquest (April 1997)SSPS-WW-MS-9702 ©1997 Dataquest May 12,1997
50 Semiconductor Supply and Pricing WorldwideTable 1-15Each Company's Factory Revenue from Shipments of Hybrid Analog Worldwide(Millions of U.S. Dollars)RevenueMarket Share (%)199419951996199419951996Total Market1,6651,6551,468100.0100.0100.0Americas Companies42518614925.511.210.1Allegro Microsystems0121500.71.0Analog Devices5258423.13.52.9Burr-Brown6060503.63.63.4Comlinear7000.400ElantecGennum3232300.20.10.20.10.20LinfinityMaxim3434340.20.20.20.20.20.3Mitel3020161.81.21.1Motorola2260013.600National Semiconductor7800.40.50Sipex1414130.80.80.9Solitron2230.10.10.2Unitrode15000.900Japanese CompaniesFuji Electric1,136221,369231,2452168.21.382.71.484.81.4Fujitsu1161491347.09.09.1Hitachi1361371188.28.38.0Mitsubishi1091981876.512.012.7NEC981301255.97.98.5Oki1313130.80.80.9Rohm7278734.34.75.0SarikenSanyo24017428319325417714.410.517.111.717.312.1Shindengen Electric4828212.91.71.4Sony4141652.52.54.4Toko8880.50.50.5Toshiba5974363.54.52.5Other Japanese0141300.80.9European Companies104100746.26.05.0ABB-Hafo8500.50.30Ericsson1915131.10.90.9GEC Plessey6300.40.20Micronas010000.60Philips5446403.22.82.7Other European1721211.01.31.4Source: Dataquest (April 1997)SSPS-WW-MS-9702 ©1997 Dataquest May 12,1997
Final 1996Worldwicle Semiconductor Market Share 51Section 2:1996 Worldwide Marlcet Sliare RanlcingsTable 2-1Top 40 Worldwide Companies' Factory Revenue from Shipments of TotalSemiconductors Worldwide (Including Hybrid) (Millions of U.S. Dollars)1995Rank1996Rank1995Revenue1996RevenuePercentageChange1996MarketShare (%)11Intel13,17217,78135.012.52523NECMotorola11,3148,72210,4288,076-7.8-7.47.45.744Hitachi9,1358,071-11.65.73756ToshibaTexas Instruments10,0767,8318,0657,064-20.0-9.85.75.067Samsung8,3326,464-22.44.688Fujitsu5,5354,427-20.03.1119Philips3,9004,2198.23.01410SGS-Thomson3,3984,11221.02.9911Mitsubishi5,2744,100-22.32.91512Siemens3,0633,029-1.12.11313Matsushita3,4743,003-13.62.11214IBM3,5222,740-22.21.91715Sanyo2,7142,491-8.21.82016National Semiconductor2,4082,380-1.21.71017Hyundai4,1322,247-45.61.61618LG Semicon2,8632,243-21.71.61919Sharp2,5922,124-18.11.52520Lucent Technologies1,6152,11030.71.52221Sony2,3331,983-15.01.42122Advanced Micro Devices2,3371,947-16.71.42423Rohm1,9341,731-10.51.21824Micron Technology2,6011,558-40.11.13025Rockwell7441,35181.61.02826Analog Devices9831,26028.20.92627LSI Logic1,2691,239-2.40.92328Oki2,0281,177-42.00.83629Atmel5891,02473.90.73430Hewlett-Packard64894545.80.72731Cirrus Logic1,003891-11.20.62932TEMIC7738135.20.63333VLSI Technology67267200.53234Harris685629-8.20.4SSPS-WW-IVIS-9702 ©1997Dataquest May 12,1997
52 Semiconductor Supply and Pricing WorldwideTable 2-1 (Continued)Top 40 Worldwide Companies' Factory Revenue from Shipments of TotalSemiconductors Worldwide (Including Hybrid) (Millions of U.S. Dollars)1995Rank3140354338471996Rank353637383940SankenXilinxIntegrated Device TechnologyInternational RectifierCypress SemiconductorAlteraAll OthersSource: Dataquesl (April 1997)Americas CompaniesJapanese CompaniesEuropean CompaniesAsia/Pacific CompaniesTotal Market1995Revenue73352061748655340216,28060,02160,59912,83717,805151,2621996Revenue62256655452051649716,02163,61750,88413,68113,508141,690PercentageChange-15.18.8-10.27.0-6.723.6-1.66.0-16.06.6-24.1-6.31996MarketShare (%)0.40.40.40.40.40.411.344.935.99.79.5100.0SSPS-WW-IVIS-9702 ©1997Dataquest May 12,1997
COCO"OCO• f t ^ W W W W K J N 3 W ( j J K > K J K 3 W ( - ' K ) K ) K ) N 3 > - ' l - 'O ^O O K) W Ol rfi00 c^ ^ 4i w uC/1w w wVI ON Ul SS W W W W K ) K J N J K ) K ) K J h O K J M K ) ( - i h - 'W N J h - ' O ' X ) 0 0 V j a \ 0 l 4 ^ W N J h - ' O ^ ( XvjCT\aii4^whoi-'o\ O 0 0 ' v l C T \ a i t l ^ WCDro@CDCD-~J^3s>(-h5'3 ^!anr-f-•-^rt)i-t5^ft*fDera11fnf-(-reD-u^Ul00NDKlol-»UlVOhoUlI—1hoOSNOVIrfi.J^K)ONoI-'1—»00UlONM|NJNDK)K)WWVIl - > | s J K ) 4 i N J K ) W W W U l W W U 1 0 0 V 1 0 0 O 0CJN Ul 00 (-1 Ul )^ Ul o o (30 W W 00 NO "o "vH-i ^O ON W K>|NJ VI C J l O O W W N O O KONUl ro w NJ h-" oto h^i WVI 00 h^ ON K) 00 K) lO(3Nl-'^-'^olo^oloKJKl^owww^;i.^f!'*>•c^ VI 00 0l-» ro w w oo o oNJi-i 00>;^•-'i-'viNOONONUirovVI»(=>>t^ o W N D W r O N D W h ^ i l J ^ W N D OU 1 ( J 1 U 1 C 3 N O N O O O O N O O I - ' N J K 3 W U 1 0 N N^O^ND>.K)>.VI>.O•*ro>•hti>. '. •« >. »• N N S ^1—»K J U 1 0 N | N j V | ( - » N 0 > f s . t O 0 N W Ul Ul Ul hJ•-> 4^tl::^ OO h t i O N N 0 K ) W l - ' U l h t - * > . C » N D l - > 0 0 0 0 0 0 *> VI OWO WroNO(-» I 1-1 tfi VI ht:^V I O O O O O U l t - i U l W | N joioboiookjkjboNDiNj1N)4^001—»ON4^O1—'1—1OVI1—1CTvW1—1ONVIwoVI00t-1K)h-iVIUlC3N03roo00tororoH-iwON11-1h-1rotoNOro(—1o004^roowtoro4irNO00•-1K-iONh-iNOVIV4iCDCDp o p o p o p p o p o o t - ^j ^ ^ i . ^ ^ t ^ U l O N O N V I V l b o N O N D OiNjt;i.t(i.uiuicjNCTNViviro ro ro ro ro wo M ro bo NO o4^ Ul Ul Ul UON O VI VI b
54 Semiconductor Supply and Pricing WorldwideTable 2-2 (Continued)Top 40 Worldwide Companies' Factory Revenue from Shipments of TotalSemiconductors Worldwide (Excluding Hybrid) (Millions of U.S. Dollars)1995Rank1996Rank1995Revenue1996RevenuePercentageChange1996MarketShare (%)3638Cypress Semiconductor553516-6.70.44739Altera40249723.60.44340United Microelectrorucs Corp.4774923.10.4All Others16,00615,693-2.011.2Americas Companies59,83563,4686.145.3Japanese Companies59,23049,639-16.235.4European Companies12,73713,6076.89.7Asia/Pacific Companies17,80513,508-24.19.6Total Market149,607140,222-6.3100.0Source: Dataquest (April 1997)iSSPS-WW-MS-9702 ©1997 Dataquest May 12,1997
COCO-oCOto-Jro@CDID•-JaOiCDht>.VIwVI^wh-iU1»;^OS»i:^tj^VItoo>(^w00wONa%n1-1on>1—'(Dnftos.nenoH»l^VIVI4^soNJwh->ohp^ht^(->wCJ1>r-t-(BHP)»[:>.ON34^soVIMWbso4^ww^nHmin(nCD0)n'O3CLn»-to1-1UlOlwUnh-iOS1OSVIo4^wh-lwwri)P)reCL0ft)UlVIC/5P)301c3CfP00"oh-lh-lOSh-l4^soKJCOKJUlb4^OS0100oKJUlOSKJO4^KJKJVIUlbVIOl20S3STVIN oKJKJOS•sOl004^IOSisjOlCOw4^SUB:00h-lOSKJONSOVICOh-l4ibsOlVIOsCOXP)0101cr3roa01VIVJVIKJOsSOVI4^h-loCOOlVI
mSemiconductor Supply and Pricing WorldwideTable 2-3 (Continued)Top 40 Worldwide Companies' Factory Revenue from Shipments of Total ICsWorldwide (Including Hybrid) (Millions of U.S. Dollars)1995Rank421996Rank38Symbios1995Revenue3951996Revenue458PercentageChange15.91996MarketShare (%)0.436393940Mosel VitelicHarris502457398397-20.7-13.10.30.3AH OthersAmericas Companies12,14255,75412,13359,376-0.16.59.848.2Japanese Companies49,72240,568-18.432.9European Companies9,41810,38010.28.4Asia/Pacific Companies17,24212,976-24.710.5Total Market132,136123,300-6.7100.0Source: Dataquest (April 1997)SSPS-WW-IVlS-9702 ©1997 Dataquest May 12,1997
Final 1996 Worldwide Semiconductor Market Sliare 57Table 2-4Top 40 Worldwide Companies' Factory Revenue from Shipments of Total IntegratedCircuits Worldwide (Excluding Hybrid) (Millions of U.S. Dollars)1995Rank1996Rank1995Revenue1996RevenuePercentageChange1996MarketShare (%)11Intel13,17217,78135.014.62623NECTexas Instruments10,1517,7729,2296,974-9.1-10.37.65.734Hitachi8,0256,855-14.65.675Motorola7,0226,584-6.25.456Toshiba7,9516,168-22.45.147Samsung8,0116,149-23.25.088Fujitsu4,9353,852-21.93.2139SGS-Thomson2,8073,52625.62.9910Mitsubishi4,4463,317-25.42.71411Philips2,7983,23815.72.71112IBM3,5222,740-22.22.21013Hyundai4,1322,247-45.61.81214LG Semicon2,8632,243-21.71.81815Siemens2,3142,238-3.31.81916National Semiconductor2,2362,223-0.61.82417Lucent Technologies1,5342,02031.71.71618Matsushita2,3471,988-15.31.61719Advanced Micro Devices2,3371,947-16.71.62220Sanyo1,8661,725-7.61.41521Micron Technology2,6011,558-40.11.32122Sharp1,9561,507-23.01.22323Sony1,8571,502-19.11.22924Rockwell7441,35181.61.12525LSI Logic1,2691,239-2.41.01726Analog Devices9251,21831.71.02027Oki1,9751,125-43.00.93228Atmel5891,02473.90.82629Cirrus Logic1,003891-11.20.72830Rohm799684-14.40.63031VLSI Technology67267200.63532Xilinx5205668.80.53133Integrated Device Technology617554-10.20.53334Cypress Semiconductor553516-6.70.44135Altera40249723.60.43836United Microelectronics Corp.4774923.10.44737S331546447.30.4SSPS-WW-IVIS-9702 ©1997 Dataqu est May 12,1997
58 Semiconductor Supply and Pricing WorldwideTable 2-4 (Continued)Top 40 Worldwide Companies' Factory Revenue from Shipments of Total IntegratedCircuits Worldwide (Excluding Hybrid) (Millions of U.S. Dollars)1995Rank1996Rank1995Revenue1996RevenuePercentageChange1996MarketShare (%)4238Symbios39545815.90.43639Mosel Vitelic502398-20.70.33940Harris457397-13.10.3All Others11,61211,6750.59.6Americas Companies55,56859,2276.648.6Japanese Companies48,35339,323-18.732.3European Companies9,31810,30610.68.5Asia/Pacific Companies17,24212,976-24.710.7Total Market130,481121,832-6.6100.0Source: Dataquest (April 1997)SSPS-WW-MS-9702 ©1997 Dataquest May 12,1997
' - •Final 1996 Worldwide Semiconductor Market Share 59Table 2-5Top 20 Worldwide Companies' Factory Revenue from Shipments of Bipolar DigitalWorldwide (Millions of U.S. Dollars)1995Rank1996Rank1995Revenue1996RevenuePercentageChange1996MarketShare {%)21Hitachi4424512.024.412Texas Instruments513340-33.718.433Motorola381271-28.914.744National Semiconductor209161-23.08.755Fujitsu20390-55.74.966Philips12390-26.84.987NEC10990-17.44.978Toshiba11673-37.13.9109Lucent Technologies507040.03.8910Advanced Micro Devices10062-38.03.41311Siemens31323.21.71612Applied Micro Circuits Corp.193057.91.61113Mitsubishi3725-32.41.41414Matsushita2919-34.51.01515Raytheon1915-21.10.81816GEC Plessey101220.00.61717LG Semicon1410-28.60.51218Oki364-88.90.22019Harris4400.21920SGS-Thomson60-100.00All Others4-100.00Americas Companies1,295953-26.451.5Japanese Companies972752-22.640.7,European Companies174134-23.07.2Asia/Pacific Companies1410-28.60.5Total Market2,4551,849-24.7100.0Source: Dataquest (April 1997)SSPS-WW-MS-9702 ©1997 Dataquest May 12,1997
60 Semiconductor Supply and Pricing WorldwideTable 2-6Top 20 Worldwide Companies' Factory Revenue from Shipments of Bipolar LogicWorldwide (Millions of U.S. Dollars)1995Rank1996Rank1995Revenue1996RevenuePercentageChange1996MarketShare (%)21Hitachi3613723.023.01323Texas InstrumentsMotorola505359336251-33.5-30.120.715.558744567National SemiconductorNECPhilipsFujitsu13810010918315782797013.8-18.0-27.5-61.79.75.14.94.310989Lucent TechnologiesAdvanced Micro Devices4569706255.6-10.14.33.81310Siemens31323.22.01511Applied Micro Circuits Corp.193057.91.91114161712131415MitsubishiMatsushitaRaytheonLG Semicon3726151425191210-32.4-26.9-20.0-28.61.51.20.70.66121617ToshibaOki1113654-95.5-88.90.30.220181819HarrisGEC Plessey410400-100.00.201920SGS-ThomsonAll Others640--100.0-100.000Americas Companies1,154922-20.156.9Japanese Companies854577-32.435.6European Companies160111-30.66.9Asia/Pacific Companies1410-28.60.6Total Market2,1821,620-25.8100.0Source: Dataquest (April 1997)SSPS-WW-MS-9702 ©1997 Dataquest May 12,1997
- •Final 1996 Worldwide Semiconductor Market Share 61Table 2-7Top 13 Worldwide Companies' Factory Revenue from Shipments of Other Bipolar Logic/Memory/Microcomponents Worldwide (Millions of U.S. Dollars)1995Rank1996Rank1995Revenue1996RevenuePercentageChange1996MarketShare (%)11Hitachi8179-2.534.5102Toshiba5681,260.029.743Motorola2220-9.18.751945FujitsuGEC Plessey20020120NA8.75.266Philips1411-21.44.877NEC98-11.13.528National Semiconductor714-94.41.789Texas Instruments84-50.01.71110Raytheon43-25.01.3311Advanced Micro Devices310-100.00912Lucent Technologies50-100.001213Matsushita30-100.00All Others-iNA0Americas Companies14131-78.013.5Japanese Companies11817548.376.4European Companies142364.310.0Asia/Pacific Companies00NA0Total Market273229-16.1100.0NA = Not applicableSource: Dataquest (April 1997)SSPS-WW-MS-9702 ©1997 Dataquest May 12,1997
62 Semiconductor Supply and Pricing WorldwideTable 2-8Top 40 Worldwide Companies' Factory Revenue from Shipments of MOS Digital ICsWorldwide (Millions of U.S. Dollars)1995Rank1996Rank1995Revenue1996RevenuePercentageChange1996MarketShare (%)11Intel13,16317,78135.117.722NEC9,4018,515-9.48.543Hitachi7,2285,995-17.16.034Samsung7,7755,889-24.35.855Toshiba6,9205,186-25.15.276Motorola5,6105,103-9.05.167Texas Instruments6,3254,904-22.54.988Fujitsu4,4173,471-21.43.4109Mitsubishi3,9542,895-26.82.91110IBM3,5222,740-22.22.7911Hyundai4,1302,246-45.62.21212LG Semicon2,8072,193-21.92.21913Philips1,4181,85731.01.81414Advanced Micro Devices2,0641,770-14.21.82315Lucent Technologies1,2001,64937.41.61316Micron Technology2,6011,558-40.11.52017SGS-Thomson1,3181,48412.61.51718Matsushita1,6791,422-15.31.41619Sharp1,8511,415-23.61.42220LSI Logic1,2691,239-2.41.21721Rockwell7441,23065.31.21822Siemens1,5911,226-22.91.21523Oki1,9111,103-42.31.12124Sony1,3031,050-19.41.02425National Semiconductor9931,0222.91.03026Atmel57398872.41.02527Sanyo972945-2.80.92628Cirrus Logic887741-16.50.72829VLSI Technology67267200.73330Xilinx5205668.80.62931Integrated Device Technology617554-10.20.63132Cypress Semiconductor553516-6.70.53833Altera40249723.60.53534United Microelectronics Corp.4774923.10.54135S331546447.30.53436Mosel Vitelic502398-20.70.44037Hewlett-Packard34238011.10.4SSPS-WW-MS-9702 ©1997Dataquest May 12,1997
Final 1996 Worldwide Semiconductor IVIarket Share 63ITable 2-8 (Continued)Top 40 Worldwide Companies' Factory Revenue from Shipments of MOS Digital ICsWorldwide (Millions of U.S. Dollars)1995Rank1996Rank1995Revenue1996RevenuePercentageChange1996MarketShare (%)4438Macronix27135430.60.44539Microchip Technology27133021.80.33940Rohm376327-13.00.3All Others7,4667,5160.77.5Americas Companies46,97949,7525.949.4Japanese Companies41,67733,361-20.033.1European Companies4,9315,0402.25.0Asia/Pacific Companies16,82312,530-25.512.4Total Market110,410100,683-8.8100.0Source: Dataquest (April 1997)SSPS-WW-MS-9702 ©1997 Dataquest May 12,1997
64 Semiconductor Supply and Pricing WorldwideTable 2-9Top 40 Worldwide Companies' Factory Revenue from Shipments of MOS MemoryWorldwide (Millions of U.S. Dollars)1995Rank1996Rank1995Revenue1996RevenuePercentageChange1996MarketShare (%)11Samsung7,4985,501-26.614.622NEC5,3533,913-26.910.333Hitachi5,1323,514-31.59.344Toshiba4,2642,513-41.16.655Hyundai4,1162,236-45.75.976LG Semicon2,6352,021-23.35.367Texas Instruments3,7541,984-47.15.298Fujitsu2,5891,656-36.04.4109Mitsubishi2,5471,614-36.64.3810Micron Technology2,6011,558-40.14.11111IBM2,100996-52.62.61612Intel76695024.02.51213Siemens1,353911-32.72.41314Motorola1,237827-33.12.22315Atmel47879365.92.11816SGS-Thomson64673814.22.01517Sharp1,030727-29.41.91718Advanced Micro Devices719711-1.11.91419Oki1,228541-55.91.42020Mosel Vitelic502398-20.71.12521Cypress Semiconductor424382-9.91.02422Integrated Device Technology444378-14.91.02223Sony489330-32.50.92724Sanyo25730217.50.82125Matsushita492300-39.00.82826Macronix23628822.00.86827Vanguard0225NA0.61928Nippon Steel Semiconductor549198-63.90.53029United Microelectronics Corp.203177-12.80.52630Winbond Electronics317160-49.50.43131National Semiconductor188127-32.40.33332Xicor1141237.90.33433Microchip Technology10211714.70.33234Integrated Silicon Solutions158111-29.70.34235Silicon Storage Technology3591160.00.22936Alliance Semiconductor21066-68.60.23937Catalyst485412.50.1SSPS-WW-MS-9702 ©1997Dataquest May 12,1997
Final 1996 Worldwide Semiconductor Marl
COCO-•CO0 o01 OJW W K J h J l - ' J i K ) 0 J N 3 t O ! j J 0 J 0 J > - ' K J N J l - ' ( - ' l - ' i - ' 0 0 ( - ' ( - i » - '• | i . N ) O s ^ O N ) t j J W ( J 1 r f i O O > V I O v j o v O O O V l > t i O l O WK) Oh-i VO ^toON 1-' Ul >ti Wo00cb-Jor\3@COCDW W Wvq (Js Ul ^> n n ^ n ^S^nOnOlp;- ^o- "(D R=nsufung^ «it. ojo ^(T)Og_ 0?01W W W W t O t O t O t O t O t O t O t O t O t O h - ' l - ' h - ' l - ' l - ' t - i t - i l - 'W t O ( - » O V O O O v q o s a i i ^ W t O i - i O v O C » ^ O s i J l i t > . W t OX o^ O§S^(^ G-3 ?en Sm ore ?2g ^01HU5 (/Ir'H P ^ C L E S ^ ' S t^3 " ^ O m CaL B j C11^ §111 o 'S o" pi »^O01v;01F?3n ff OP ^nmOrti
Final 1996 Worldwide Semiconductor Market Share 67ITable 2-10 (Continued)Top 40 Worldwide Companies' Factory Revenue from Shipments of MOSMicrocomponents Worldwide (Millions of U.S. Dollars)1995Rank1996Rank1995Revenue1996RevenuePercentageChange1996MarketShare (%)3538Silicon Integrated Systems12712700.33139OPTi167119-28.70.35940Dallas Semiconductor35113222.90.3All Others2,2811,868-18.14.5Americas Companies24,20430,30225.273.3Japanese Companies8,0938,1150.319.6European Comparues1,4331,97738.04.8Asia/Pacific Companies77492719.82.2Total Market34,50441,32119.8100.0NA = Not applicableSource: Dataquest (April 1997)ISSPS-WW-MS-9702 ©1997 Dataquest May 12,1997
COCO-DCOW W W W W O J t t ^ C O N ) N J N J N J K J N > N J K ) N J l - ' l - ' i - ' t - > N)oN) w yit-» '^ h-"OS O00 ^O U) Ov W ht".COCO-sior\j@COCO~Jo05W W W w w w•vl OS Ul 5^W SJ I-"N J K J K J h J K J h J N J S J K J h O i - ' i - ' h - ' i - ' t - i i - ' l - ' i - 'v O O O v q a ^ U l ^ l ^ W ^ O h - > O ^ O O O ^ O ^ O ^ ^ f i W ^ Jn gLen^^^3'^& 3 ff. ^3 |?&. I i &• ^^1 mil 5^^suO H ofti 05crtSr tfi?C) m E3"^3TOS s S S ^ n1/1^3 cn•TSI^S ^ (n " ' S ^ C/3N S'T3S ^ S 5:a m O S a r fD n ' Tp)3 ? T C L rtnI3 I 3 ?rnn1-1nO O1-!O3 3 a3oCLO^0c;nret-h ^ v ] O N V lv q o o K J O h t » . W O s v O > ( ^ l o m S J K J O O O O K ) W V ] O n O l i - 'O O s O O O O t t i U I W O K J O l O O O O S J O i - ' O l s J v O O s U l ^ O0\ W00 00vq OSt-" (-» WOS vq 1-1K) 00 vqo•;^oOS1-1 rfi *» >^00 O OS \0t O K ) K ) K ) K > K J ( O W W W ( 4 ^ h t ^ 4 i . a i U 1 0 1 U 1 0 s ' v l 0 0 OO O O l - ' O s C T \ O O O O O O O O W V l v £ ) O W O \ O O i - i v J O l OO i - ' r f i O * > 0 0 v 0 O O ^ U 1 ^ 0 v ] t t ^ i - ' 0 s 0 0 U i r O K J W(—'0t—'»l^h-lI-"K)Wh-i h-i h-'h-» I-"ww OS w VJ00 0w•^ wOS1K)OSl-JOSW»t^vahC^h-i•^isoWOSvqOSOlVItn1—1h-i001soh-iw Kso wI—"soU1N)i-Jh-i l-i I KJ 1-' I 1 M W WO h l ^ W s O W p s Q o p o ^ p o N J p s Obsobswi^ooNOooIfih-'t-'UiVIOSh-"SO01N3N>W*» ht^0CDCO0(Jl0Ul0010Ul0010OS0 0 0^ ^000VO0SO0SO^0H J h - ' l - > i - ' ( - ' h - i K ) h J K ) K 3 N J K > K > K J W * » M ^ioMwbobobookJWwLnasvqsobsovi*.VIOlIsjCJlWcnwOS•f^
Final 1996 Worldwide Semiconductor Market Share 69ITable 2-11 (Continued)Top 40 Worldwide Companies' Factory Revenue from Shipments of MOS Digital LogicWorldwide (Millions of U.S. Dollars)1995Rank1996Rank1995Revenue1996RevenuePercentageChange1996MarketShare (%)4038Gould AMI729531.90.43939TEMIC73741.40.33840Cypress Semiconductor7970-11.40.3All Others987837-15.23.9Americas Companies9,13410,05110.046.6Japanese Companies9,5229,5380.244.2European Companies1,4751,394-5.56.5Asia/Pacific Companies48857217.22.7Total Market20,61921,5554.5100.0Source: Dataquest (April 1997)ISSPS-WW-MS-9702 ©1997 Dataquest May 12,1997
70 Semiconductor Supply and Pricing WorldwideTable 2-12Top 40 Worldwide Companies' Factory Revenue from Shipments of Analog-MonolithicWorldwide (Millions of U.S. Dollars)1995Rank1996Rank1995Revenue1996RevenuePercentageChange1996MarketShare (%)11SGS-Thomson1,4832,04237.710.652Texas Instruments9341,73085.29.023Philips1,2571,2912.76.744Motorola1,0311,21017.46.335National Semiconductor1,0341,0400.65.496Siemens69298041.65.187Analog Devices80996018.75.068Toshiba915909-0.74.779Sanyo894780-12.84.01010NEC641624-2.73.21111Matsushita639547-14.42.81212Sony554452-18.42.31613Hitachi35540915.22.11314Mitsubishi455397-12.72.12215Maxim185383107.02.01816Linear Technology30536519.71.91417Rohm423357-15.61.81918Lucent Technologies2843016.01.61719Fujitsu315291-7.61.52120Samsung23626010.21.32021Harris260231-11.21.22422TEMIC177175-1.10.92723VTC15517211.00.92924Allegro Microsystems14416615.30.92625GEC Plessey1551635.20.82326New JRC183160-12.60.82827Mietec1441589.70.83128Burr-Brown12615724.60.83629Symbios10215249.00.83330Cirrus Logic11615029.30.83731Sierra Semiconductor9612631.30.710932Rockwell0121NA0.62533Advanced Micro Devices173115-33.50.64134Level One Communications7811243.60.64335Mitel6810757.40.63836Raytheon9310310.80.53937Cherry Semiconductor8710014.90.5SSPS-WW-MS-9702 ©1997Dataquest May 12,1997
Final 1996 Worldwide Semiconductor IVIarket Share 71ITable 2-12 (Continued)Top 40 Worldwide Companies' Factory Revenue from Shipments of Analog-MonolithicWorldwide (Millions of U.S. Dollars)1995Rank1996Rank1995Revenue1996RevenuePercentageChange1996MarketShare {%)3538Unitrode10398-4.90.53439Sharp10592-12.40.53040Exar13187-33.60.5All Others1,6791,227-26.96.4Americas Companies7,2948,52216.844.2Japanese Companies5,7045,210-8.727.0European Companies4,2135,13221.826.6Asia/Pacific Companies4054367.72.3Total Market17,61619,3009.6100.0Source: Dataquest (April 1997)SSPS-WW-l\/IS-9702 ©1997 Dataquest I\/Iay12,1997
72 Semiconductor Supply and Pricing WorldwideTable 2-13Top 40 Worldwide Companies' Factory Revenue from Shipments of Total DiscreteWorldwide (Millions of U.S. Dollars)1995Rank1996Rank1995Revenue1996RevenuePercentageChange1996MarketShare (%)11Motorola1,6501,452-12.010.822Toshiba1,4281,390-2.710.343Hitachi8899779.97.334Philips1,056941-10.97.055NEC831818-1.66.166Rohm771681-11.75.187SGS-Thomson591586-0.84.378Matsushita631565-10.54.2119International Rectifier4684935.33.71010Mitsubishi479452-5.63.41311Siemens4354523.93.49- 12Sanyo488441-9.63.31213Fuji Electric468401-14.33.01414General Instrument413362-12.32.71615TEMIC32135310.02.61516Sanken398328-17.62.41717Samsung317307-3.22.31918Fujitsu2832902.52.21819Shindengen Electric301277-8.02.12020Harris2282321.81.72121Korean Electronic Co.220193-12.31.42622Eupec12016033.31.22323National Semiconductor164157-4.31.22724Microsemi11814623.71.12425Hewlett-Packard146140-4.11.02526Semikron125109-12.80.82827Powerex989800.7302231282930Teccor ElectronicsmIXYS681926584816623.5-57.81.50.60.60.52931Toko6855-19.10.43432Zetex51522.00.43333Sony5343-18.90.33634GEC Plessey3635-2.80.33935Ericsson202840.00.24036Texas Instruments162875.00.23837Semtech2924-17.20.2SSPS-WW-MS-9702 ©1997 Dataqu est May 12,1997
Final 1996 Worldwide Semiconductor Market Share 73^Table 2-13 (Continued)Top 40 Worldwide Companies' Factory Revenue from Shipments of Total DiscreteWorldwide (Millions of U.S. Dollars)1995Rank1996Rank1995Revenue1996RevenuePercentageChange1996MarketShare (%)3738Allegro Microsystems2919-34.50.14139Supertax161600.14240Raytheon131300All Others221130-41.21.0Americas Companies3,7203,417-8.125.4Japanese Companies7,1426,774-5.250.3European Companies2,9152,784-4.520.7Asia/Pacific Companies537500-6.93.7Total Market14,31413,475-5.9100.0Source: Dataquest (April 1997)ISSPS-WW-MS-9702 ©1997 Dataquest May 12,1997
COC/3-aCOCDo@toCDB3rv)CDCD•vlOSWWcnf-t-WfTncrnwo»—'o1oobowwwK)Nror+nXI—'MOowN)w1—'w0)en3>^oaf>wwoowowonhH0S^op1—'•fDUlUlOSK)Obph-»K)SOK)SO1—HnC/33U3OcnOS^1-1OSklph-'Wh-iKJ00CD010l^00h-1oobok)NJ00hJ^ns-H?0nh-"KJSO1tsJUlboisjN)OSN>OStnfDnft->-tSa05'afDr'COh-"Ulh-"^h-iwwowVII-'roUlr4*'fDH-'oMNJg>OiF>.tsJUlN>4^m
Final 1996 Worldwide Semiconductor Market Share 75^Table 2-14 (Continued)Top 349 Worldwide Companies' Factory Revenue from Shipments of Total OpticalSemiconductors Worldwide (Millions of U.S. Dollars)1995Rank1996Rank1995Revenue1996RevenuePercentageChange1996MarketShare (%)1734 ABB-Hafo140-100.00All Others195457134.49.3Americas Companies54782450.616.8Japanese Companies3,7353,542-5.272.1European Companies5045172.610.5Asia/Pacific Companies263223.10.7Total Market4,8124,9152.1100.0Source: Dataquest (April 1997)ISSPS-WW-MS-9702 ©1997 Dataquest May 12,1997
76 Semiconductor Supply and Pricing WorldwideTable 2-15Top 29 Worldwide Companies' Factory Revenue from Shipments of Hybrid AnalogWorldwide (Millions of U.S. Dollars)1995Rank1996Rank1995Revenue1996RevenuePercentageChange1996MarketShare (%)11Sanken283254-10.217.322Mitsubishi198187-5.612.733Sanyo193177-8.312.144Fujitsu149134-10.19.165NEC130125-3.88.556Hitachi137118-13.98.077Rohm7873-6.45.0128Sony416558.54.499Burr-Brown6050-16.73.41010Analog Devices5842-27.62.91111Philips4640-13.02.7812Toshiba7436-51.42.51313Shindengen Electric2821-25.01.41414Fuji Electric2321-8.71.41515Mitel2016-20.01.119161617Allegro MicroSystemsEricsson1215151325.0-13.31.00.91718Sipex1413-7.10.91819Oki131300.92220Toko8800.52421Maxim4400.32622Linfinity3300.22723Elantec3300.22824Solitron2350.00.22025Micronas100-100.002126National Semiconductor80-100.002327ABB-Hafo50-100.002528GEC Plessey30-100.002929Gennum20-100.00All Others3534-2.92.3Americas Companies186149-19.910.1Japanese Companies1,3691,245-9.184.8European Companies10074-26.05.0Asia/Pacific Companies0NA0Total Market1,6551,468-11.3100.0NA = Not applicableSource: Dataquest (April 1997)SSPS-WW-l\/IS-9702 ©1997 Dataquest May 12,1997
€For More Information...Kevin McClure, Market Research Analyst (408) 468-8505Internet addresskevin.mcclure@dataquest.coniVia fax (408) 954-1780Dataquest Interactivehttp://www.dataquest.comThe content of this report represents our interpretation and analysis of information generally available to the publicor released by responsible individuals in the subject companies, but is not guaranteed as to accuracy or completeness.^^It does not contain material provided to us in corrfidence by our clients. Reproduction or disclosure in whole or inI JJII Jl/^l I^^^T P^' *° othe'' parties shall be made upon the written and express consent of Dataquest.^"^•^ ^'%Sr ©1997 Dataquest—Reproduction ProhibitedA Gartner Group Company Dataquest is a registered trademark of A.C. Nielsen Company
DATAQUEST WORLDWIDE OFFICESNORTH AMERICAWorldwide Headquarters251 River Oaks ParkwaySan Jose, California 95134-1913United StatesPhone: 1-408-468-8000Facsimile: 1-408-954-1780East Coast HeadquartersNine Technology DrivePO. Box 5093Westborough, Massachusetts 01581-5093United StatesPhone: 1-508-871-5555Facsimile: 1-508-871-6262Dataquest Global Events3990 Westerly Place, Suite 100Newport Beach, California 92660United StatesPhone: 1-714-476-9117Facsimile: 1-714-476-9969Sales Offices:Washington, DC (Federal)New York, NY (Financial)Dallas, TXLATIN AMERICAResearch Affiliates and Sales Offices:Buenos Aires, ArgentinaSao Paulo, BrazilSantiago, ChileMexico City, MexicoEUROPEEuropean HeadquartersTamesis, The GlantyEgham, Surrey TW20 9AWUnited KingdomPhone: +44 1784 431 611Facsimile: +44 1784 488 980Dataquest FranceImmeuble Defense Bergeres345, avenue Georges ClemenceauTSA 4000292882 - Nanterre CTC Cedex 9FrancePhone: +33 1 41 35 13 00Facsimile: +33 1 41 35 13 13Dataquest GermanyKronstadter Strasse 981677 MiinchenGermanyPhone: +49 89 93 09 09 0Facsimile: +49 89 93 03 27 7Sales Offices:Brussels, BelgiumKfar Saba, IsraelMilan, ItalyRandburg, South AfricaMadrid, SpainJAPANJapan HeadquartersAobadai Hills 4-7-7AobadaiMeguro-ku, Tokyo 153JapanPhone: 81-3-3481-3670Facsimile: 81-3-3481-3644ASIA/PACIFICAsia/Pacific HeadquartersSuite 5904-7, Central Plaza18 Harbour Road, WanchaiHong KongPhone: 852-2824-6168Facsimile: 852-2824-6138Dataquest KoreaSuite 2407, Trade Tower159 Samsung-dong, Kangnam-guSeoul 135-729KoreaPhone: 822-551-1331Facsimile: 822-551-1330Dataquest TaiwanllF-2, No. 188, Section 5Nan King East RoadTaipeiTaiwan, R.O.C.Phone: 8862-756-0389FacsimUe: 8862-756-2663Dataquest Singapore105 Cecil Street#06-01 /02 The OctagonSingapore 069534Phone: 65-227-1213FacsimUe: 65-227-4607Dataquest Thailand12/F, Vanissa Building29 Soi ChidlomPloenchit RoadPatumwan, Bangkok 10330ThailandPhone: 662-655-0577Facsimile: 662-655-0576Research Affiliates and Sales Offices:Melbourne, AustraliaBeijing, ChinaDataquestA Gartner Group Company©1997 Dataquest
IFILE COPY:MARIA VALENZUELA<strong>DataQuest</strong>Nortli American Semiconductor PriceOutloolc—Second Quarter 1997\Market Statistics\ Program: Semiconductor Supply and Pricing WorldwideProduct Code: SSPS-WW-MS-9701Publication Date: March 10,1997Filing: Market Statistics
iNorth American Semiconductor PriceOutiooic—Second Quarter 1997iMarket StatisticsProgram: Semiconductor Supply and Pricing WorldwideProduct Code: SSPS-WW-MS-9701Publication Date: March 10,1997Filing: Market Statistics
Nortli American Semiconductor Price Outlook—Second Quarter 1997Table of ContentsPageNorth American Semiconductor Price Outlook—Second Quarter 1997 1Methodology and Sources 1Price Variations 1SSPS-WW-I\/IS-9701 ©1997Dataquest IVlarchIO, 1997
Semiconductor Suppiy and Pricing WortdwideList of TablesTablePage1 Estimated Standard Logic Price Trends—North American Bookings 22 Estimated Long-Range Standard Logic Price Trends—North American Bookings 33 Estimated Microprocessor Price Trends—North American Bookings 44 Estimated Long-Range Microprocessor Price Trends—North American Bookings 55 Estimated DRAM Price Trends—North American Bookings 66 Estimated Long-Range DRAM Price Trends—North American Bookings 87 Estimated Static RAM Price Trends—North American Bookings 9$ Estimated Long-Range Static RAM Price Trends—North American Bookings 109 Estimated ROM Price Trends—North American Bookings 1110 Estimated Long-Range ROM Price Trends—North American Bookings 1111 Estimated EPROM Price Trends—North American Bookings 1212 Estimated Long-Range EPROM Price Trends—North American Bookings 1213 Estimated Flash Memory Price Trends—North American Bookings 1314 Estimated Long-Range Flash Memory Price Trends—North American Bookings 1415 Estimated Gate Array Pricing—North AmericanProduction Bookings 1516 Estimated CBIC Pricing—North AmericanProduction Bookings 16SSPS-WW-MS-9701 ©1997 Dataquest March 10,1997
North American Semiconductor Price Outlook—Second Quarter 1997 ^^.^^^^_^^^^Methodology and SourcesThis document provides information on and forecasts for the NorthAmerican bookings prices of more than 200 semiconductor devices.Dataquest collects price information on a quarterly basis from NorthAmerican suppliers and major buyers of these products. North Americanbookings price information is analyzed by Semiconductor Supply andPricing Worldwide (SSPS) analysts for consistency and reconciliation. Theinformation finally is rationalized with worldwide billings price data inassociation with product analysts, resulting in the current forecast. Thisdocument includes associated long-range forecasts.For SSPS clients that use the SSPS online service through CompioServe, theprices presented here correlate with the quarterly and long-range pricetables dated March 1997 in the SSPS online service. Clients who want toaccess the information via the World Wide Web can pay extra for aDataquest Interactive subscription, which allows users to access all theirdeliverables at their desktops. For additional product coverage and moredetailed product specifications, please refer to those sources.Price VariationsActual negotiated market prices may vary from these prices because ofmanufacturer-specific factors such as product quality, special features,service, delivery performance, volume discount, or other factors that mayenhance or detract from the value of a company's product. These pricesare intended for vise as price guidelines.SSPS-WW-MS-9701©1997 Dataquest
Semiconductor Supply and Pricing WorldwideTable 1Estimated Standard Logic Price Trends—North American Bookings(Volume: 100,000 per Year; Package: PLCC; Dollars)Product74LSTTL74LS0074LS7474LS13874LS24474AC TTL74AC0074AC7474AC13874AC24474FTTL74F0074F7474F13874F24474HC CMOS74HC0074HC7474HC13874HC24474ALSTrL74ALS0074ALS7474ALS13874ALS24474ASTTL74AS0074AS7474AS13874AS24474BC*74BC0074BC24474BC37374ACT24474ACT24574ABT24474ABT2451996Q40.130.170.180.240.170.210.310.430.140.150.180.230.120.160.180.230.160.180.230.310.190.190.400.650.230.550.570.450.480.600.65Qi0.130.160.170.240.170.210.290.400.140.150.180.220.110.160.170.210.140.160.220.300.190.190.400.630.200.530.550.430.460.580.63Q20.130.160.170.240.170.210.290.400.140.150.180.220.110.160.170.210.140.160.210.300.190.190.400.630.200.530.550.430.460.580.631997Q30.130.160.170.240.170.210.290.400.140.150.180.220.110.160.170.210.140.160.210.300.190.190.400.630.200.530.550.410.460.580.63Q40.130.160.170.240.170.210.290.400.140.150.180.220.110.160.170.210.140.160.210.300.190.190.400.630.200.530.550.410.460.580.631997Year0.130.160.170.240.170.210.290.400.140.150.180.220.110.160.170.210.140.160.210.300.190.190.400.630.200.530.550.420.460.580.63Qi0.130.160.170.240.150.190.280.360.130.150.180.220.110.150.170.210.140.160.200.270.190.190.400.620.190.480.500.390.410.520.57Q20.130.160.170.240.150.190.280.360.130.150.180.220.110.150.170.210.140.160.200.270.190.190.400.620.190.470.490.380.410.520.561998Q30.130.160.160.240.150.180.270.350.130.150.180.220.110.150.170.210.140.160.200.260.190.190.400.620.180.460.460.380.400.510.55Q40.130.160.160.240.140.170.270.350.130.150.180.220.110.150.170.210.140.160.200.260.190.190.400.620.170.440.460.360.380.480.521998Year0.130.160.170.240.150.180.270.350.130.150.180.220.110.150.170.210.140.160.200.260.190.190.400.620.180.460.480.380.400.510.55Lead Times•Pricing for 74BC excludes 74ABT and 74BCT.Note: Actual negotiated market prices may vary from these prices because of manufacturer-specific factors such as quality, service, andvolume discount. These prices are intended for use as price guidelines.Source: Dataquest (March 1997)2-62-62-62-62-62-62-62-62-62-62-62-62-62-62-62-62-62-62-62-62-62-62-62-62-62-62-62-62-62-62-6SSPS-WW-IWS-9701 ©1997 Dataquest IVIarch 10,1997
North American Semiconductor Price Outlook— Second Quarter 1997Table 2Estimated Long-Range Standard Logic Price Trends—North American Bookings(Volume: 100,000 per Year; Package: PLCC; Dollars)Product74LSTTL74LS0074LS7474LS13874LS24474AC TTL74AC0074AC7474AC13874AC24474FTTL74F0074F7474F13874F24474HC CMOS74HC0074HC7474HC13874HC24474ALS TTL74ALS0074ALS7474ALS13874ALS24474ASTTL74BC»74AS0074AS7474AS13874AS24474BC0074BC24474BC37374ACT24474ACT24574ABT24474ABT2451997Year0.130.160.170.240.170.210.290.400.140.150.180.220.110.160.170.210.140.160.210.300.190.190.400.630.200.530.550.420.460.580.63'Pricing for 74BC excludes 74ABT and 74BCT.Note: Actual negotiated market prices may vary from these prices because of manufacturer-specific factors such as quality, service, andvolume discount. TInese prices are intended for use as price guidelines.Source: Dataquest (March 1997)1998Year0.130.160.170.240.150.180.270.350.130.150.180.220.110.150.170.210.140.160.200.260.190.190.400.620.180.460.480.380.400.510.551999Year0.130.150.160.240.130.160.250.310.130.140.170.210.110.140.160.210.130.160.200.250.190.190.400.610.170.430.450.350.370.470.512000Year0.130.150.150.240.130.150.240.280.120.140.170.200.110.140.160.210.130.150.200.240.190.200.400.610.160.420.430.330.350.420.492001Year0.130.150.150.240.120.150.220.270.120.140.170.200.110.130.160.210.130.150.200.240.190.200.400.610.160.410.420.320.340.400.48SSPS-WW-IVIS-9701 ©1997 Dataquest March 10,1997
COCO-uCO(O(OTable 3Estimated Microprocessor Price Trends—North American Bookings(Volume; 25,000 per Year; Dollars) (Package: 32/64-Bit Devices—Ceramic PGA; Exceptions Noted)Product68EC020-25 PQFP68EC030-2S PQFP68040-2568LC040-25 CQFP 184PentiuTn-75Pentimn-90Pentium-100 3.3VPentium-IDO 2.9VPentium-120 3.3VPentiuTn-1202,9VPentium-133 3.3VPentium-133 2.9VPentiiim-1503.3VPeiitium-150 2.9VPentium-166 3.3VPentium-200 3.3VPentium MMX 166-MHz 2.8V PGAPentium MMX 200-MHz 2.8V PGAPentiumPRO-166CPentiumPRO-180 256k CachePentiumPRO-200 2S6k CachePentiumPRO-200 512k CachePowerPC601-80PowerPCeOl-lOOPowerPC603-«0P(}wePC603-133PowerPCfi04-166PowerPC604-22SPowerPC6G4-2401997Ql8.0019.0025.0025.0070.0070.0075.0090.0090.0090.00110.00150.00140.00250.00295.00450.00350.00500.00600.00410.00475.00993.0070.0080.0063.00125.00200.00400.00500.00Q28.0018.7524.0024.0070.0070.0075.0090.0085.0085.00100.00140.00140.00200.00200.00400.00300.00400.00600.00330.00475.00993.0068.0075.0061.00115.00180.00360.004S0.D0EOL = End of lifeNote: Actual negotiated market prices may vary from these prices because of manufacturer-specific factors such as quality, service, and volume discounas guidelines.Source: Oataquest (March 1997)Q38.0018.7524.0024.0070.0070.0070.0085.0085.0085.00100.00140.00130.00150.00200.00300.00200.00350.00600.00280.00425.00895.0068.0075.0061.00110.00180.00330.00400.00Q48.0018.7522.0022.0070.0070.0070.0085.0085.0085.0090.00110.00130.00150.00175.00300.00200.00300.00600.00280.00375.00895.0068.0075.0060.00110.00170.00330.00400,001997Year8.0018.8123.7523.7570.0070.0072.5087.5086.2586.25100.00135.00135.00187.50217.50362.50262.50387.50600.00325.00437.50944.0068.5076.2561.25115.00182.50355.00437.501998Ql8.0018.7522.0022.00EOLEOL70.0085.0085.0085.0090.00110.00100.00150.00140.00300.00200.00300.00600.00225.00375.00700.00EOLEOL60.00100.00170.00300.00400.00Q28.0018.7522.0022.00EOLEOL70.0085.0085.0085.0090.00110.00100.00150.00140.00300.00200.00300.00600.00225.00375.00700.00EOLEOL60.0090.00170.00300.00375,00Q38,0018.7522.0022.00EOLEOL70.0085.0085.0085.0090.00110.00100.00150.00140.00300.00200.00300.00600.00225.00375.00635.00EOLEOL60.0090.00150.00280.00375.008182222EE7085858590110100150140300200300600225375635EE6090150280350
North American Semiconductor Price Outlool
Z66l.'0I.L|OJE^ ;s8nbEiBGZ66|.@ |.0Z6-Slrtl-MM-SdSStocra\en20\o3w3tnOOi-jU1oobiw(J1Ulu00j^VJfeoV)(ji•-»OlCOasUlw0\LoaU)oUlCOIn4^.ti.100fOroyiONO3cn->(->too4=.o1"00OOtoe^VJVIbiVIOSbosoVIOS^to00e^OSop^•-»(-J;2ONVI^bh—>:2botn45.1001:3tooo\sobooOS00b1—'ONVI4^OOSsol—^VJOS0\4^UlOS4^so00OS4^4^OSOStosoOS4^soOS004i.>-'UlofeatosoOS00tosoUl^toVIOi00UlUlw00h-lONtoVISO00VIOSOw00bVI4^100hototnOSUlUl)astotnUl00OJ4^Ultotososo^soOSuto^wwKJwtotobIOtotoso1—>tototo4^100crastnONO3cntn
COCO-QCOCO-^cs@COCOaK-OlTable 5 (Continued)Estimated DRAM Price Trends—North American Bookings (Contract Volume; U.S. Dollars)"4Mbx32 SIMM 60ns 5V EDO4Mbx36 SIMM 60ns 5V EDO8Mbx32 SIMM 60ns 5V EDO8Mbx36 SIMM 60ns 5V EDOlMbx64 60ns 3.3V EDO2Mbx64 60ns 3.3V EDO4Mbx64 60ns 3.3V EDOlMbx64 3.3 V SDRAM2Mbx64 3.3V SDRAM4Mbx64 3.3V SDRAM256Kxl6 VRAM 70ns SOP256Kx32 66-MHz 3.3V SGRAM199772.2082.75141.20164.2541.3875.75146.2442.1376.25149.0011.6010.0069.0877.75134.86154.2540.4073.39141.0040.5877.39141.0010.679.2567.6476.65132.08152.0539.1371.06137.0539.0371.01136.9010.308.5066.8075.77131.67145.8937.5068.81132.0036.9368.21131.958.807.50199768.9378.23134.95154.1139.6072.25139.0739.6773.22139.719.708.81199864.9875.11129.50147.0035.5467.13130.0035.4267.02130.009.207.2563.7774.15125.72145.0035.1765.01126.0535.1564.98126.009.207.0062.4973.79124.75141.0034.2663.59123.75'Contract volume is at least 100,000 per order, except for VRAMs.Note: Actual negotiated market prices may vary from these prices because of manufacturer-specific factors such as quality, service, and volume discouas price guidelinesSource: Dataquast (I^Aarch 1997)33.9663.20123.509.006.75DlC?COCO•vl
Semiconductor Supply and Pricing WorldwideTable 6Estimated Long-Range DRAM Price Trends—North American Bookings(Contract Volume; U.S. Dollars)*Product4Mbxl DRAM 70ns SOJ 5VlMbx4 DRAM 60ns SOJ 5V FPMlMbx4 DRAM 60ns SOJ 5VEDO512Kx8 DRAM 70ns 5V FPM256Kxl6 DRAM 70ns SOJ 5V FPM4Mb X 4 DRAM 60ns SOJ 5V FPM4MbX4 DRAM 60ns SOJ 5V EDOlMbxl6 DRAM 60ns TSOP 5V FPMlMbxl6 DRAM 60ns TSOP 5V EDOlMbxl6 3.3V SDRAM2Mbx8 DRAM 60ns TSOP 5V FPM16Mbx4 DRAM SOJ 60ns 3.3V EDO16Mbx4 DRAM SOJ 3.3V SDRAM8Mbx8 DRAM SOJ 60ns 3.3V EDO8Mbx8 DRAM SOJ 3.3V SDRAMlMbx32 SIMM 60ns 5V FPMlMbx36 SIMM 60ns 5V FPM2Mbx32 SIMM 60ns 5V FPM2Mbx36 SIMM 60ns 5V FPM4Mbx32 SIMM 60ns 5V FPM4Mbx36 SIMM 60ns 5V FPM8Mbx32 SIMM 60ns 5V FPM8Mbx36 SIMM 60ns 5V FPMlMbx32 SIMM 60ns 5V EDOlMbx36 SIMM 60ns 5V EDO2Mbx32 SIMM 60ns 5V EDO2Mbx36 SIMM 60ns 5V EDO4Mbx32 SIMM 60ns 5V EDO4Mbx36 SIMM 60ns 5V EDO8Mbx32 SIMM 60ns 5V EDO8Mbx36 SIMM 60ns 5V EDOlMbx64 60ns 3.3V EDO2Mbx64 60ns 3.3V EDO4Mbx64 60ns 3.3V EDOlMbx64 3.3V SDRAM2Mbx64 3.3V SDRAM4Mbx64 3.3V SDRAM256Kxl6 VRAM 70ns SOP256Kx32 66-MHz 3.3V SGRAM19972.552.352.332.683.318.057.997.827.799.818.5363.7563.2563.7563.2518.3920.6134.9640.2769.1778.38135.16155.5518.2920.5434.9240.0768.9378.23134.95154.1139.6072.25139.0739.6773.22139.719.708.8119982.382.292.182.443.297.517.347.497.398.378.0337.5035.5037.5035.5017.5019.4633.2338.0764.9674.85130.40144.8617.2519.1233.0336.5463.3474.05125.92142.7534.6564.38125.3434.5064.18125.249.086.8819992.382.292.202.443.317.517.357.517.398.158.0430.0029.0030.0029.0017.7019.6633.2538.0864.9974.86130.40144.8817.2519.1233.0436.5563.3474.05125.93142.7533.3063.00123.0033.2062.00122.009.086.1920002.452.332.332.553.507.777.667.807.668.008.1029.0028.0029.0028.0018.2020.0533.7038.9065.6076.01132.00146.0017.4019.8033.4037.0064.0075.50127.00145.0033.4060.00117.9033.4058.00117.009.155.9920012.662.402.402.803.608.108.008.058.008.108.2028.0027.2528.0027.2518.4020.5034.2039.5066.1078.00135.00155.0018.0021.0034.8038.2065.2077.75135.00155.0033.8058.00115.00'Contract volume is at least 100,000 per order, except for VRAMs.Note: Actual negotiated market prices may vary from these prices because of manufacturer-specific factors such as quality, service, andvolume discount. These prices are intended for use as price guidelines.Source: Oataquest (March 1997)33.8056.00114.009.305.88SSPS-WW-MS-9701 ©ig97Dataquest March 10,1997
COCO-•COCOto-NlTable 7Estimated Static RAM Price Trends—North American Bookings(Volume: Slow SRAM—50,000 per Year; Fast SRAM—20,000 per Year; Package: PDIP; Dollars)Product16Kx4 35ns8Kx8 25ns8Kx8 100-120ns64Kx4 10ns64Kx4 25ns32Kx8 12ns32Kx9 12ns Burst32Kx8,15ns, 5V32Kx 8,15ns, 3.3V32Kx8 25ns32Kx8 70-lOOns SOJ64Kx8 12ns Burst256Kx4 20ns128Kx8,15ns128Kx8,20ns128Kx8 25ns128Kx8 70-lOOns SOJ32Kx3215ns, 3.3V PQFP32Kx32 8ns 3.3V PBSynch64Kx32 8ns 3.3V PBSynch256Kxl6 70-lOOns256Kxl6 25ns512Kx8 70ns512Kx8 25nsQl2.191.181.397.002.061.503.671.211.261.201.5315.155.224.674.824.824.653.593.296.2919.1520.4117.9622.00Q22.171.221.386.681.921.503.541.201.241.191.4014.204.924.444.574.574.293.463.195.8218.4418.9817.5220.761997Note: Actual negotiated market prices may vary from these prices because of manufacturer-specific factors such as quality, service, and volume discouThese prices are intended for use as price gujdeiines.Source: Dataquest (March 1997)Q32.161.221.366.381.891.483.391.161.221.161.3014.134.724.254.294.294.103.443.075.5818.1718.2717.2619.95Q42.141.221.336.131.891.483.331.161.221.161.2713.554.473.984.144.143.883.312.965.3817.5417.8816.6619.561997Year2.171.211.366.551.941.493.481.181.231.181.3714.264.834.344.454.454.233.453.135.7718.3318.8917.3520.57Ql2.091.211.295.831.761.473.331.151.201.151.2013.414.283.843.823.823.713.172.845.1617.1416.1516.2818.45Q22.091.211.295.771.771.473.301.151.201.151.1812.514.283.683.813.813.633.122.815.0716.5516.4515.7217.501998Q32.061.211.265.661.731.463.261.141.191.141.1711.964.223.573.753.753.552.982.774.8515.9716.0615.1816.97Q2.01.21.25.81.71.43.21.11.11.11.111.64.23.43.73.73.42.92.74.612.215.914.415.5
10 Semiconciuctor Supply and Pricing WorldwideTable 8Estimated Long-Range Static RAM Price Trends—North American Bookings(Volume: Slow SRAM—50,000 per Year; Fast SRAM—20,000 per Year; Package: PDIP;DollarsProduct16Kx4 35ns8Kx8 25ns8Kx8 100-120ns64Kx410ns64Kx4 25ns32Kx8 12ns32Kx9 12ns Burst32K X 8,15ns, 5V32Kx8, 15ns, 3.3V32Kx8 25ns32Kx8 70-lOOns SOJ64Kx8 12ns Burst256Kx4 20ns128Kx8,15ns128Kx8,20ns128Kx8 25ns128Kx8 70-100ns SOJ32Kx32 15ns, 3.3V PQFP32Kx32 8ns 3.3V PBSynch64Kx32 8ns 3.3V PBSynch256Kxl6 70-lOOns256Kxl6 25ns512Kx8 70ns512Kx8 25ns1997Year2.171.211.366.551.941.493.481.181.231.181.3714264.834.344.454.454.233.453.135.7718.3318.8917.3520.571998Year2.081.211.285.781.751.463.281.151.201.151.1812.394.253.633.783.783.593.052.794.9415.4816.1615.4217.131999Year2.101.221.306.401.781.483.221.181.221.201.2511.204.223.433.733.733.453.003.004.8214.9015.1013.9014.902000Year2.101.251.306.451.801.553.251.201.251.221.3012.004.753.433.703.703.423.003.404.8213.4014.1013.0513.602001YearEOL = End of lifeNote: Actual negotiated market prices may vary from these prices because of manufacturer-specific factors such as quality, service, andvolume discount. These prices are Intended for use as price guidelines.Source: Dataquest (March 1997)2.151.301.406.501.901.663.301.251.301.261.3812.204.903.453.683.683.403.053.604.8412.6513.0012.4512.60SSPS-WW-MS-9701 ©1997 Dataquest March 10,1997
North American Semiconductor Price Outlool
12 Semiconductor Supply and Pricing WorldwideTable 11Estimated EPROM Price Trends—North American Bookings(Volume: 50,000 per Year; Package: Windowed CERDIP; Speed: 150ns and Above;Dollars)Product32Kx8 EPROM64Kx8 EPROM128Kx8 EPROM256Kx8 EPROM128KX16 EPROM512Kx8 EPROM256KX16 EPROMlMbx8 EPROM512KX16 EPROMQl1.371.431.932.773.654.977.588.509.50Q21.371.451.902.773.594.977.108.409.451997Q31.371.431.832.753.474.876.638.309.40Q41.361.431.802.733.404.776.158.209.301997Year1.371.441.872.753.534.896.868.359.41Ql1.351.421.732.683.334.606.508.159.20Q21.331.421.732.673.204.486.008.109.151998Q31.321.371.702.522.984.405.508.059.10Q41.331.371.702.502.954.335.008.009.051998Year1.331.391.722.593.114.455.758.089.13Lead Time(Weeks)Note: Actual negotiated market prices may vary from these prices because of manufacturer-specific factors such as quality, service, andvolume discount. These prices are intended for use as guidelines.Source: Dataquest (March 1997)2-32-32-32-32-32-32-32-32-3Table 12Estimated Long-Range EPROM Price Trends—North American Bookings(Volume: 50,000 per Year; Package: Windowed CERDIP; Speed: 150ns and Above;Dollars)Product32Kx8 EPROM64Kx8 EPROM128Kx8 EPROM256Kx8 EPROM128Kxl6 EPROM512Kx8 EPROM256Kxl6 EPROMlMbx8 EPROM512Kxl6 EPROM1997Year1.371.441.872.753.534.896.868.359.41Note: Actual negotiated market prices may vary from these prices because of manufacturer-specific factors such as quality, service, andvolume discount. These prices are irrtended for use as guidelines.Source: Dataquest (March 1997}1998Year1.231.271.552.392.384.234.618.089.131999Year1.221.271.522.102.253.964.497.898.932000Year1.201.261.492.002.193.854.357.488.462001Year1.201.261.481.952.123.704.227.228.11SSPS-WW-MS-9701 ©1997 Dataquest IVIarchIO, 1997
aiCO-oCO(O@(OCO•-JK.DlTable 13Estimated Flash Memory Price Trends—North American Bookings(12V; Volume: 10,000 per Year; Speed: 150ns; Dollars)Product64KxS, PDIP/PLCC64Kx8, TSOP128Kx8, PDIP/PLCC128Kx8, TSOP 12V128Kx8,TSOP5V256Kx8, TSOP 12V256Kx8,TSOP/5V512Kx8, PDIP/PLCC512Kx8, TSOP 12V512Kx8, TS0P/5V512Kx8, SS0P/3VlMbx8TSOP/12VlMbx8TS0P/5VlMbx8 TS0P/3V2Mbx8 TSOP/12V2Mbx8 TSOP/5V2Mbx8TSOP/3VQl2.752.832.582.803.185.575.305.606.206.287.6310.0710.2012.0018.1518.5020.00Q22.602.752.402.603.085.104.735.306.056.056.658.808.8510.0017.5517.7518.401997Q32.502.702.352.503.005.004.635.005.785.785.308.508.508.5016.7516.7517.60Note: Actual negotiated market prices may vary from these prices because of manufacturer-specific factors sucli as quality, service, and volume discounas guidelines.Source: Dataquest (March 1997)Q42.402.662.352.502.954.904.534.805.685.685.108.008.008.0015.8516.0016.551997Year2.562.732.422.603.055.144.805.185.935.946.178.848.899.6317.0817.2518.14Ql2.352.602.302.452.804.754.204.755.055.055.057.807.807.8015.2015.5015.90Q22.302.552.302.402.704.654.104.604.704.704.707.507.507.5014.7014.9014.901998Q32.302.452.302.402.604.554.004.454.704.704.707.307.307.3014.3014.3014.30Q42.302.352.302.402.604.303.854.254.554.554.556.906.906.9013.7013.7013.70COCO
14 Semiconductor Supply and PricinQ WorldwideTable 14Estimated Long-Range Flash Memory Price Trends—North American Bookings(12V; Volume: 10,000 per Year; Speed: 150ns; Dollars)Product64Kx8, PDIP/PLCC64Kx8, TSOP128Kx8, PDIP/PLCC128Kx8, TSOP 12V128Kx8, TSOP 5V256Kx8, TSOP 12V256Kx8, TSOP/5V512Kx8, PDIP/PLCC512Kx8, TSOP 12V512Kx8, TSOP/5V512Kx8, SSOP/3VlMbx8 TSOP/12VIMbxS TSOP/5VlMbx8 TSOP/3V2Mbx8 TSOP/12V2Mbx8 TSOP/5V2Mbx8 TSOP/3V1997Year2.562.732.422.603.055.144.805.185.935.946.178.848.899.6317.0817.2518.141998Year2.312.492.302.412.684.564.044.514.754.754.757.387.387.3814.4814.6014.701999Year2.292.442.272.342.554.103.704.154.274.274.276.946.946.9412.0812.0812.082000Year2.282.432.232.292.404.003.504.024.094.094.096.746.746.7411.5011.5011.502001YearNote: Actual negotiated market prices may vary from these prices because of manufacturer-specific factors such as quality, service, andvolume discount. These prices are intended for use s is guidelines.Source: Dataquest (March 1997)2.272.412.202.262.353.913.423.853.923.923.926.406.406.4010.6010.6010.60#SSPS-WW-I\/IS-9701 ©1997 Dataqu est IVIarch 10,1997
COCO-aCOIICOICO•NlC3Table 15Estimated Gate Array Pricing—North American Production Bookings(Volume: 20,000 Units; Based on Utilized Gates Only; NRE = Netlist to Prototype; Millicents per GGate Count TechnologyCMOS (Average)0.8 Micron0.6 Micron0.5 Micron0.35 Micron199721.0024.0026.0036.0010-29.99K Gates199820.0023.0025.0034.00199919.0022.0024.0034.00199717.0017.0022.0033.0030-59.99K Gates199816.0015.0021.0029.00199914.0014.0020.0028.00199715.0017.0020.0021.0060-99.99K Gate199814.0016.0018.0020.0019913.015.017.019.0NRE CMOS Average Charge ($K)44.0044.0043.0054.0052.0052.0074.0073.0073.0@COCO-vlIGate Count TechnologyCMOS (Average)0.8 Micron100-299.99K Gates199724.00199822.00199921.00>300K Gates1997 1998NR NR1999NRLead Tim(WeekProductio4-10.6 Micron23.0022.0021.0030.0030.0029.004-10.5 Micron27.0024.0022.0033.0032.0032.004-10.35 Micron32.0031.0030.0041.0039.0038.004-1Oi-1nNRE CMOS Average Charge ($K)107.00106.00105.00123.00120.00120.00PrototypeNR = Not relevantNFtE - Nonreccuring engineering chargeNotes: The actual NRE may vary from these because of device amortization, testing, intellectual property rights, and other factors. Actual negotiated mfrom these because of manufachjrer-specific factors such as intellsctual property rights, alliances, service, package types, pad or core constraints, andintended for use as price guidelines For volumes of 1 million units or greater discount the above prices by a further 50 to 60 percent. For core-limited sthan 10,000 units, CBICs may be more cost-effective than gate arraysSource: Oataqusst (March 1997)1COCO•vl
COen-aViTable 16Estimated CBIC Pricing—North American Production Bookings(Volume: 20,000 Units; Based on Utilized Gates Only; NRE = Netlist to Prototype; Millicents per GCOICO^JGate Count Technology10-29.99K Gates1997 1998 199930-59.99K Gates1997 1998 199960-99.99K Gates1997 19981999CMOS0.8 Micron25.0024.0022.0017.0016.0014.0013.0011.0010.000.6 Micron26.0025.0024.0018.0016.0015.0013.0012.0010.000.5 Micron28.0027.0026.0025.0024.0022.0020.0018.0017.000.35 Micron40.0039.0038.0038.0035.0034.0025.0024.0022.00NRE CMOS Average Charge ($K)68.0067.0065.0072.0072.0071.0083.0083.0083.00@COCO^JoD>Gate Count TechnologyCMOS100-299.99K Gates1997 1998 1999>300K Gates1997 19981999Lead TimeWeeks)Production0.8 Micron17.0015.0014.00NRNRNR7-150.6 Micron15.0014.0013.0019.0018.0017.007-150.5 Micron14.0012.0010.0017.0015.0014.007-150.35 Micron12.0011.0010.0011.009.008.007-15PrototypesNRE CMOS Average Charge ($K)133.00132.00132.00163.00161.00160.003-6DlONR = Not relevantNRE = Nonreccuring engineering chargeNotes: The actual NRE may vary from these because of device amortization, testing, intellectual property rights, and other factors. Actual negotiated marsubstantially from these because of manufacturer-specific factors such as intellectual property rights, alliances, service, package types, pad or core consdiscount. These prices are Intended for use as price guidelines For volumes of 1 million units or greater discount the above prices by a further 50 to 60limited solutions with volumes greater than than 10,000 units, CBICs may be more cost-effective than gate arrays,Source: DataqueSt (March 1997)COCO# ^
For More Information...Evelyn Cronin, Senior Industry Analyst (408) 468-8075Internet addressevelyn.cronin@dataquest.comVia fax (408) 954-1780<strong>DataQuest</strong>A Gartner Group CompanyThe content of this report represents our interpretation and analysis of information generally available to the publicor released by responsible individuals in the subject companies, but is not guaranteed as to accuracy or completeness.It does not contain material provided to us in confidence by our dients. Reproduction or disdosure in whole or inpart to other parties shall be made upon the written and express consent of Dataquest.©1997 Dataquest—Reproduction ProhibitedDataquest is a registered trademark of A.C. Nielsen Company
DATAQUEST WORLDWIDE OFFICESNORTH AMERICAWorldwide HeadquartBrs251 River Oaks ParkwaySan Jose, California 95134-1913United StatesPhone: 1^08-468-8000Facsimile: 1^08-954-1780East Coast HeadquartersNine Technology DriveP.O. Box 5093Westborough, Massachusetts 01581-5093United StatesPhone: 1-508-871-5555Facsimile: 1-508-871-6262Dataquest Global Events3990 Westerly Place, Suite 100Newport Beach, California 92660United StatesPhone: 1-714-476-9117Facsimile: 1-714^76-9969Sales Offices:Washington, DC (Federal)New York, NY (Financial)Dallas, TXLATIN AMERICAResearch Affiliates and Sales Offices:Buenos Aires, ArgentinaSao Paulo, BrazilSantiago, ChileMexico City, MexicoEUROPEEuropean HeadquartersTamesis, The GlantyEgham, Surrey TW20 9AWUnited KingdomPhone:+44 1784 431 611Facsimile: +44 1784 488 980Dataquest FranceImmeuble Defense Bergeres345, avenue Georges ClemenceauTSA 4000292882 - Nanterre CTC Cedex 9FrancePhone: +33 1 41 35 13 00Facsimile: +33 1 41 35 13 13Dataquest GermanyKronstadter Strasse 981677 MiinchenGermanyPhone: +49 89 93 09 09 0Facsimile: +49 89 93 03 27 7Sales Offices:Brussels, BelgiumKfar Saba, IsraelMilan, ItalyRandburg, South AfricaMadrid, SpainJAPANJapan HeadquartersAobadai Hills 4-7-7AobadaiMeguro-ku, Tokyo 153JapanPhone: 81-3-3481-3670FacsimUe: 81-3-3481-3644ASIA/PACIFICAsia/Pacific HeadquartersSuite 5904-7, Central Plaza18 Harbour Road, WanchaiHong KongPhone: 852-2824-6168Facsimile: 852-2824-6138Dataquest KoreaSuite 2407, Trade Tower159 Samsung-dong, Kangnam-guSeoul 135-729KoreaPhone: 822-551-1331Facsimile: 822-551-1330Dataquest TaiwanllF-2, No. 188, Section 5Nan King East RoadTaipeiTaiwan, R.O.C.Phone: 8862-756-0389FacsimUe: 8862-756-2663Dataquest Singapore105 Cecil Street#06-01/02 The OctagonSingapore 069534Phone: 65-227-1213Facsimile: 65-227-4607Dataquest Thailand12/F, Vanissa Building29 Soi ChidlomPloenchit RoadPatumwan, Bangkok 10330ThailandPhone: 662-655-0577Facsimile: 662-655-0576Research Affiliates and Sales Offices:Melbourne, AustraliaBeijing, ChinaDataquestA Gartner Group Company©1997 Dataquest
<strong>DataQuest</strong>
iio^AtiiiiKoou^/^^uiP^^^<strong>DataQuest</strong>Nortli American SemiconductorPrice Outlook—First Quarter 1997Market StatisticsProgram: Semiconductor Supply and Pricing WorldwideProduct Code: SPSG-WW-MS-9605Publication Date: January 6,1997Filing: Market Statistics
9North American Semiconductor Price OutloolcFirst Quarter ''QQ^Methodology and SourcesThis document provides information on and forecasts for the North Americanbookings prices of more than 200 semiconductor devices. Dataquestcollects price information on a quarterly basis from North American suppliersand major buyers of these products. North American bookings priceinformation is analyzed by Semiconductor Supply and Pricing Worldwide(SPSG) analysts for consistency and reconciliation. The information finallyis rationalized with worldwide billings price data in association withproduct analysts, resulting in the current forecast. This document includesassociated long-range forecasts.For SPSG clients that use the SPSG onUne service, the prices presented herecorrelate with the quarterly and long-range price tables dated September1996 in the SPSG orUine service. For additional product coverage and moredetailed product specifications, please refer to tiiose sources.9Price VariationsActual negotiated market prices may vary from these prices because ofmanufacturer-specific factors such as product quality, special features,service, delivery performance, volume discount, or other factors that mayenhance or detract from the value of a company's product. These prices areintended for use as price guidelines.9SPSG-WW-MS-9605©1997 Dataquest
Semiconductor Supply and Pricing WortdwideTable 1Estimated Standard Logic Price Trends—North American Bookings(Volume: 100,000 per Year; Package: PLCC; Dollars)Product74LSTTL74LS0074LS7474LS13874LS24474ACTrL74AC0074AC7474AC13874AC24474FTTL74F0074F7474F13874F24474HC CMOS74HC0074HC7474HC13874HC24474ALSTTL74ALSO074ALS7474ALS13874ALS24474ASTTL74AS0074AS7474AS13874AS24474BC»74BC0074BC24474BC37374ACT24474ACT24574ABT24474ABT2451996Q40.130.170.180.240.170.210310.430.140.150.180.230.120.160.180.230.160.180.230.310.190.190.400.650.230.550.570.450.480.600.651997Ql0.130.160.170.240.170.210.290.400.140.150.180.220.110.160.170.210.140.160.220.300.190.190.400.630.200.530.550.430.460.580.63Q20.130.160.170.240.170.210.290.400.140.150.180.220.110.160.170.210.140.160.210.300.190.190.400.630.200.530.550.430.460.580.63Q30.130.160.170.240.170.210.290.400.140.150.180.220.110.160.170.210.140.160.210.300.190.190.400.630.200.530.550.410.460.580.63Q40.130.160.170.240.170.210J290.400.140.150.180.220.110.160.170.210.140.160.210.300.190.190.400.630.200.530.550.410.460.580.631997Year0.130.160.170.240.170.210.290.400.140.150.180.220.110.160.170.210.140.160.210.300.190.190.400.630.200.530.550.420.460.580.631998Ql0.130.160.170.240.150.190.280.360.130.150.180.220.110.150.170.210.140.160.200.270.190.190.400.620.190.480.500.390.410.520.57Q20.130.160.170.240.150.190.280.360.130.150.180.220.110.150.170.210.140.160.200.270.190.190.400.620.190.470.490.380.410.520.56Q30.130.160.160.240.150.180.270.350.130.150.180.220.110.150.170.210.140.160.200.260.190.190.400.620.180.460.460.380.400.510.55Q40.130.160.160.240.140.170.270.350.130.150.180.220.110.150.170.210.140.160.200.260.190.190.400.620.170.440.460.360.380.480.521998Year0.130.160.170.240.150.180.270350.130.150.180.220.110.150.170.210.140.160.200.260.190.190.400.620.180.460.480.380.400.510.55Lead Time(Weeks)•Pricing for 74BC excludes 74ABT and 74BCT.Note: Actual negotiated market prices may vary from these prices because of manufacturer-specific factors such as quality, service, andvolume discount. These prices are intended for use as price guidelines.Source: Dataquest (December 1996) 0)2-62-62-62-62-62-62-62-62-62-62-62-62-62-62-62-62-62-62-62-62-62-62-62-62-62-62-62-62-62-62-6SPSG-WW-MS-9605 ©1997 Dataniip
.ini^iiuan ociiiiuuiiuuuiui moc uuLJuu^. i iiai uutiaBi laa/Table 2Estimated Long-Range Standard Logic Price Trends—North American Bookings(Volume: 100,000 per Year; Package: PLCC; Dollars)8Product74LSTTL74LS0074LS7474LS13874LS24474ACTTL74AC0074AC7474AC13874AC24474FTTL74F0O74F7474F13874F24474HC CMOS74HC0074HC7474HC13874HC24474ALSTTL74ALS0O74ALS7474ALS13874ALS24474ASTrL74BC»74AS0074AS7474AS13874AS24474BC0074BC24474BC37374ACT24474ACT24574ABT24474ABT245•Pricing for 74BC excludes 74ABT and 74BCT.Note: Actual negotiated mari
C/JnoCOOCOo>oen@=3c:lu
North American Semiconductor Price Outlook: First Quarter 1997^9Table 4Estimated Long-Range Microprocessor Price Trends—North American Bookings(Volume: 8-Bit, 16-Bit, and 32-Bit—25,000 per Year; Dollars)(Package: 8/16-Bit Devices—PDIP; 32-Bit Devices—Ceramic PGA; Exceptions Noted)Product68EC020-25 PQFP68EC030-25 PQFP68040-2568LC040-25 CQFP 184Pentium-75Pentium-90Pentium-100 3.3VPentium-100 2.9VPentium-120 3.3VPentium-120 2.9VPentium-133 3.3VPentium-133 2.9VPentivim-150 3.3VPentium-ISO 2.9VPentium-166 3.3VPentium-200 3.3VPentium Pro-166CPentium Pro-180Pentium Pro-200 256K CachePentium Pro-200 512K CachePowerPC 601-80PowerPC 601-100PowerPC 603-80PowerPC 603-1331997Year8.0018.8823.7523.7541.2548.7561.2590.0083.75122.5092.50176.25135.00223.75168.75280.00600.00318.75418.75944.0068.5076.2560.50100.001998Year8.0018.7522.0022.0040.0045.0050.0090.0080.00120.0075.00170.00120.00220.00110.00145.00600.00270.00350.00700.0068.0075.0060.0075.001999Year8.0018.7522.0022.0040.0045.0050.0090.0080.00120.0075.00170.00120.00220.00110.00145.00600.00270.00350.00700.0068.0075.0060.0075.002000Year8.0018.7522.0022.0040.0045.0050.0090.0080.00120.0075.00170.00120.00220.00110.00145.00600.00270.00350.00700.0068.0075.0060.0075.002001Year8.0018.7522.0022.0040.0045.0050.0090.0080.00120.0075.00170.00120.00220.00110.00145.00600.00270.00350.00Notes: Pricing excludes accessory parts like floating point and memory management.Actual negotiated market prices may vary from ttiese prices because of manufacturer-specific factors sucti as quality, service, and volumediscount. These pnces are intended for use as guidelines.Source: Dataquest (December 1996)700.0068.0075.0060.0075.009SPSG-WW-IVIS-9605 ©1997 Dataquest Januarys, 1997
CO"OenTable 5Estimated DRAM Price Trends—North American Bookings(Contract Volume; U.S. Dollars)*1996199719971998ProductIMbxl DRAM 70-80ns (DIP/SOJ) 5VQ42.25Ql2.24Q22.23Q32.23Q42.23Year2.23Ql2.22Q22.21Q32.20Q42.19256Kx4 DRAM 60ns SOJ 5V2.152.122.082.072.082.092.022.012.011.994Mbxl DRAM 70ns SOj 5V2.972.722.672.642.622.662.582.392.382.30lMbx4 DRAM f.Ors SO) 5V FPM2.812.402.452.442.402.422.392.182.202.201 Mbx4 DRAM 60ns SOJ 5V EDO2.842.422.452.442.402.432.382.182.202.20512Kx8 DRAM 70ns 5V3.292.822.692.562.432.622.332.332.312.31256Kxl6 DRAM 70ns SO] 5V3.673.363.403.343.243.333.173.103.002.954Mb X 4 DRAM 60 ns SOJ 5V FPM10.209.008.678.388.178.557.967.847.797.734MbX4 DRAM 60ns SOJ 5V EDO10.169.008.678.388.178.557.%7.847.797.73lMbxl6 DRAM 60ns TSOP 5V FPM9.008.948.748.448.068.547.757.567.437.291 Mbxl6 DRAM 60ns TSOP 5V EDO9.008.938.738.448.048.547.757.507.257.022Mbx8 DRAM 60ns TSOP 5V FPM9.569.068.658.047.%8.437.537.367.277.1816Mbx4 DRAM SOJ 60ns 3.3V EDO100.0086.8878.7573.7567.5076.7260.0054.5050.2540.3316Mbx4 DRAM SOJ 3.3V SDRAM85.0085.8381.2568.5059.0073.6551.2545.7541.7538.50lMbx32 SIMM 60ns 5V FPM22.6320.0719.3218.6217.9418.9917.4417.1816.7916.53lMbx36 SIMM 60ns 5V FPM2Mbx32 SIMM 60ns 5V FPM2Mbx36 SIMM 60ns 5V FPM26.0038.2541.9322.7535.8740.8021.5034.8539.2220.2533.5038.6319.5032.1537.0021.0034.0938.9119.0031.1234.8719.0030.4334.6218.7530.4234.5518.5030.0734.104Mbx32 SIMM 60ns 5V FPM79.7375.0772.3770.0067.5871.2564.9864.5563.5762.234Mbx36 SIMM 60ns 5V FPM84.8582.6080.4376.2573.0878.0970.7369.5568.8867.708Mbx32 SIMM 60ns 5V FPM8Mbx36 SIMM 60ns 5V FPM1 Mbx32 SIMM 60ns 5V EDO1 Mbx36 SIMM 60ns 5V EDO2Mbx32 SIMM 60ns 5V EDO2Mbx36 SIMM 60ns 5V EDO4Mbx32 SIMM 60ns 5V EDO4Mbx36 SIMM 60ns 5V EDO8Mbx32 SIMM 60ns 5V EDO159.47175.8720.3824.8936.6342.1980.1685.26166.08150.13166.0019.6223.0835.9741.0275.9882.85151.85144.73160.3419.0822.7535.0239.4572.6380.67146.55139.60155.0118.3721.9033.5038.6270.0076.23141.90135.16150.3717.6921.1232.1236.9867.4973.02138.29142.41157.9318.6922.2134.1539.0271.5378.19144.65129.97144.6517.1920.8031.0934.8764.8570.59129.97128.51143.2217.0520.6031.0234.5964.4469.52128.53126.48141.2916.6719.4030.9534.3063.5668.88126.44124.46138.3416.4119.0630.6534.0562.2167.70124.46
oiOen•DtnoCOa>otn@(OCD--JCJOlTable 5 (Continued)Estimated DRAM Price Trends—North American Bookings(Contract Volume; U.S. Dollars)*Product8Mbx36 SIMM 60ns 5V EDOlMbx64 60ns 3.3V EDO2Mbx64 60ns 3.3V EDO4Mbx64 60ns 3.3V EDO256Kx4 VRAM 70ns SOJ128Kx8 VRAM 70ns SOj256KX16 VRAM 70ns SOP256Kx32 66-MHz 3.3V SCRAM1996Q4178.5445.0090.00180.005.735.9312.0014.381997Ql166.4046.3497.33182.675.755.9311.3313.63Q2160.4544.8689.33177.335.725.9110.6712.88Q3155.0343.5086.67172.535.715.9010.3311.63Q4150.4142.3484.27169.125.695.899.9710.381997Year158.0744.2689.40175.415.725.9010.5812.131998Ql144.6041.4579.73153.755.645.839.258.26Q2143.26"Contract volums is at least 100,000 per order, except for VRAMs.Note: Actual negotiated market prices may vary from these prices because of manufacturer-specific factors such as quality, sen/ice, and volume discoas guidelines.Source: Dataquest (December 1996)41.9478.62155.705.585.779.018.20Q3141.2441.4577.60153.715.535.728.788.09dCDC/>c:CO•5o>COCO-J
Semiconductor Supply and Pricing WotldwideTable 6Estimated Long-Range DRAM Price Trends—North American Bookings(Contract Volume; U.S. Dollars)*ProductIMbxl DRAM 70-80ns PIP/SOJ) 5V256Kx4 DRAM 60ns SOJ 5V4Mbxl DRAM 70ns SOJ 5VlMbx4 DRAM 60ns SOJ 5V FPMlMbx4 DRAM 60ns SOJ 5V EDO512Kx8 DRAM 70ns 5V256Kxl6 DRAM 70ns SOJ 5V4Mb X 4 DRAM 60 ns SOJ 5V FPM4MbX4 DRAM 60ns SOJ 5V EDOlMbxl6 DRAM 60ns TSOP 5V FPMlMbxl6 DRAM 60ns TSOP 5V EDO2Mbx8 DRAM 60ns TSOP 5V FPM16Mbx4 DRAM SOJ 60ns 3.3V EDO16Mbx4 DRAM SOJ 3.3V SDRAMlMbx32 SIMM 60ns 5V FPMlMbx36 SIMM 60ns 5V FPM2Mbx32 SIMM 60ns 5V FPM2Mbx36 SIMM 60ns 5V FPM4Mbx32 SIMM 60ns 5V FPM4Mbx36 SIMM 60ns 5V FPM8Mbx32 SIMM 60ns 5V FPM8Mbx36 SIMM 60ns 5V FPMlMbx32 SIMM 60ns 5V EDOlMbx36 SIMM 60ns 5V EDO2Mbx32 SIMM 60ns 5V EDO2Mbx36 SIMM 60ns 5V EDO4Mbx32 SIMM 60ns 5V EDO4Mbx36 SIMM 60ns 5V EDO8Mbx32 SIMM 60ns 5V EDO8Mbx36 SIMM 60ns 5V EDOlMbx64 60ns 3.3V EDO2Mbx64 60ns 3.3V EDO4Mbx64 60ns 3.3V EDO256Kx4 VRAM 70ns SOJ128Kx8 VRAM 70ns SOJ256Kxl6 VRAM 70ns SOP256Kx32 66-MHz 3.3V SGRAM1997Year2.232.092.662.422.432.623.338.558.558.548.548.4376.7273.6518.9921.0034.0938.9171.2578.09142.41157.9318.6922.2134.1539.0271.5378.19144.65158.0744.2689.40175.415.725.9010.5812.13'Contract volume is at least 100,000 per order, except for VRAMs.Note: Actual negotiated market prices may vary from these prices because of manufacturer-specific factors such as quality, service, andvolume discount. These prices are intended for use as guidelines.Source: Dataquest (December 1996)01998Year2.212.012.412.242.242.323.067.837.837.517.387.3451.2744.3116.9918.8130.5134.5363.8369.21127.35141.8816.8319.9730.9334.4563.7769.17127.35141.8541.4578.14153.745.565.748.908.141999Year2.121.932.322.152.152.222.937.527.527.217.087.0435.0031.0016.3118.0629.2933.1561.2866.44122.26136.2016.1619.1729.6933.0761.2166.41122.25136.1832.9761.01123.005.345.518.545.882000Year2.031.852.222.072.072.142.827.227.226.926.806.7627.0127.0015.6517.3428.1231.8358.8363.79117.37130.7515.5118.4028.5031.7558.7763.75117.36130.7329.0058.21117.095.125.298.205.402001Year1.951.782.131.981.982.052.706.936.936.646.536.4925.8425.1115.0316.6426.9930.5556.4861.23112.67125.5214.8917.6627.3630.4856.4261.20112.67125.5027.4656.09111.974.925.087.875.10SPSG-WW-l\/IS-9605 ©1997 Dataquest Januarys, 1997
i #o •oCO•oC/5C5C/JI
10 Semiconductor Supply and Pricing WorldwideTable 8Estimated Long-Range Static RAM Price Trends—North American Bookings(Volume: Slow SRAM—50,000 per Year; Fast SRAM—20,000 per Year; Package: PDIP;Dollars)Product16Kx4 35ns8Kx8 25ns8Kx8 100-120ns64Kx410ns64Kx4 25ns32Kx812ns32Kx9 12ns Burst32K X 8 15ns 5V32K X 8 15ns 3.3V32Kx8 25ns32Kx8 70-lOOns SOJ64Kx8 12ns Burst256Kx4 20ns128K x 8 15ns128K x 8 20ns128Kx8 25ns128Kx8 70-lOOns SOJ32Kx32 15ns 3.3V PQFP32Kx32 8ns 3.3V PB Synch1997Year2.251.501.496.542.101.743.621.301.361.291.5313.735.444.904.844.844.603.343.18Note: Actual negotiated marl
iMonn American Semiconductor Price Outlool
^•12 Semiconductor Supply and Pricing Worldwide]3i5i7Table 11Estimated EPROM Price Trends—North American Bookings(Volume: 50,000 per Year; Package: Windowed CERDIP;Speed: 150ns and Above; Dollars)Product32Kx864Kx8128Kx8256Kx8128Kxl6512Kx8256Kxl61996Q41.801.902.603.805.806.859.001997Ql1.751.852.503.705.006.308.50Q21.751.852.403.604.805.908.00Q31.701.802.303.504.605.607.50Q41.701.802.203.404.405.407.001997Year1.731.832.403.554.705.937.751998Ql1.651.752.103.304.205.206.50Q21.651.752.103.304.005.006.00Q31.601.702.003.203.804.805.50Q41.601.702.003.203.604.605.001998Year1.631.732.053.253.904.905.75Lead Time(Weeks)Note: Actual negotiated market prices may vary from these prices because of manufacturer-specific factors such as quality, service, emdvolume discount. These prices are intended for use as price guidelines.Source: Dataquest (Decemt>er 1996)t % '^ STable 12'Estimated Long-Range EPROM Price Trends—North American Bookings(Volume: 50,000 per Year; Package: Windowed CERDIP; Speed: 150ns and Above;Dollars)Product32Kx864Kx8128Kx8256Kx8128Kxl6512Kx8256Kxl61997Year1.731.832.403.554.705.937.75Note: Actual negotiated market prices may vary from these prices because of manufacturer-specific factors such as quality, service, andvolume discount. These prices are intended for use as price guidelines.Source: Dataquest (December 1996)1998Year1.631.732.053.253.904.905.751999Year1.601.692.003.153.794.754.952000Year1.581.661.943.083.654.624.7022222222001Year1.581.641.913.013.554.304.50)0)SPSG-WW-MS-9605 ©1997 Dataquest January 6 1997
-«§CO-aenaC/}(Oa>ocri@COCO•~JESDI1X3isL.1'
mmtm •w14 Semiconductor Supply and Pricing WoridwideTable 14Estimated Long-Range Flash Memory Price Trends—North American Bookings(12V; Volume: 10^,000 per Year; Speed: 150ns; Dollars)Product64Kx8 PDIP/PLCC64Kx8 TSOP128Kx8 PDIP/PLCC128Kx8 TSOP 12V128Kx8TSOP5V256Kx8 TSOP 12V256Kx8 TSOP/5V512Kx8 PDIP/PLCC512Kx8 TSOP 12V512Kx8 TSOP/5VINfbxS TSOP/12VlMbx8 TSOP/5V2Mbx8 TSOP/12V2Mbx8 TSOP/5V1997Year2.562.812.512.713.685.505.155.485.665.799.449.5917.1617.35Note: Actual negotiated market prices may vary from these prices because of manufacturer-specific factors such £is quality, service, andvolume discount. These prices are intended for use as guidelines.Source: Dataquest (December 1996)1998Year2.242.492.242.443.334.884.404.534.754.807.767.8514.4314.601999Year2.152.302.122.323.164.634.004.124.324.377.067.1412.9813.142000Year2.092.182.022.253.064.493.763.874.064.026.506.5711.6811.832001Year2.002.101.982.203.004.403.613.723.903.786.116.1810.5210.64»)SPSG-WW-l\/IS-9605(FMOOT n~*-
iCOT3COCDCOICOenC301Table 15Estimated Gate Array Pricing—North American Production Bookings(Volume: 20,000 Units, Based on Utilized Gates Only; NRE = Netlist to Prototype, Millicents pGate Count TechnologyCMOS (Average)1.0 Micron0.8 Micron0.6/0,5 Micron0.3 Micron10-29.99K Gates199731.0027.0025.00NR199827.0023.0021.00NR199925.0022.0019.0024.0030-59.99K Gates199730.0023.0018.00NR199826.0020.0016.00NR199923.0018.0015.0020.0060-99.9199728.0023.0017.0016.00NRE CMOS Average Charge ($K)44.0044.0043.0054.0052.0052.0074.00@^-LCOCO•«JoEa01.oGate Count TechnologyCMOS (Average)1.0 Micron0.8 Micron0.6/0.5 Micron0.3 Micron100-299.99K Gates1997NR24.0018.0017.001998NR21.0016.0015.00199933.0019.0015.0014.00>300K Gates1997 1998NR NRNR NR20.00 17.0019.00 16.00199936.0034.0016.0015.00Lead T(WeProducNRE CMOS Average Charge ($K)107.00106.00105.00123.00120.00120.00PrototyNR = Not relevantNotes: The actual NRE charge may vary from these because of device amortization, testing, intellectual property fights, and other factors.Actual negotiated market prices may vary from these prices because of manufacturer-specific factors such as Intellectual property rfgfits, alliancesdiscount. These prices are Intendect for use as price guidelines. Forvotumes of 100,000 units or greater, discount the above prices by a further 40For high-density solutions with volumes greater than 150,000 units or for low-density solutons with volumes greater than 500 units, CBICs may bSource: Dataquest (December 1996)c=D3•3a>COCO-J
n•o7iTable 16Estimated CBIC Pricing—North American Production Bookings(Volume: 20,000 Units, Based on Utilized Gates Only; NRE = Netlist to Prototype, Millicents per Gale)10-29.99K Gates30-59.99K Gates60-99.99K GatesGate Count Technology199719981999199719981999199719981999CMOS1.0 Micron37.0030.0027.0033.0028.0024.0031.0027.0025.000.8 Micron31.0026.0025.0024,0021.0019.0025.0021.0019.000.6/0.5 Micron26.0022.0019.0021.0018.0017.0020.0017.0016.000.3 MicronNRNR21.00NRNR20.0019.0015.0014.00NRE CMOS Average Charge ($K)68.0067.0065.0072.0072.0071.0083.0083.0083.00100-299K Gates2300K GatesLead TimeGate Count Technology199719981999199719981999(Weeks)CMOSProduction:1.0 MicronNRNR30.00NRNR38.007-130.8 Micron26.0022.0020,00NRNR36.007-130.6/0.5 Micron22.0019.0018.0024,0021.0019.007-130.3 Micron21.0017.0016.0022.0019.0018.007-13Prototypes:NRE CMOS Average Charge ($K)133.00132.00132.00163.00161.00160.004-8NR = Not relevantNotes: Tiie actual NFIE ctiarge may vary from ttiese because of device amortization, testing, intellectual property rigtits, and other factors.Actual negotiated market prices may vary from ttiese prices because of manufacturer-specific factors such as intellectual property rights, alliances, service, package tydiscount. These prices are intended for use as price guidelines. For volumes ot 100,000 units or greater, discount ttie above prices by a further 40 percent to 60 perceFor high-density solutions with volumes greater than 150,000 units or for low-density solutions with volumes greater than 500 units, CBICs may be more cost-effectiveSource: Dataquest (December 1996)
FILE COPY:MARIA VALENZUELA<strong>DataQuest</strong>1997 Semiconductor User Wants andNeeds: They Want IViore!User Wants and NeedsProgram: Semiconductor Supply and Pricing WorldwideProduct Code: SSPS-WW-UW-9701Publication Date: December 8,1997Filing: Reports
I1997 Semiconductor User Wants andNeeds: They Want More!IUser Wants and NeedsProgram: Semiconductor Supply and Pricing WorldwideProduct Code: SSPS-WW-UW-9701Publication Date: December 8,1997Filing: Reports
1997 Semiconductor User Wants and Needs: They Want More!Table of ContentsPage1. Executive Summary 1Three Semiconductor Applications Categories 1Survey Objective 22. Introduction 3Management Summary 3Report Contents 53. Survey Participant Demographics 7Survey Methodology 7Respondents' Function Groups 7Respondents' Demographics 9Respondents' Market Size 104. Show Me the Money: Spending and TCO 13Semiconductor Spending ; 13Survey Participants versus Total North America Market 14Targeted Semiconductor Inventory Holding 15Semiconductor Inventory Holding: Actual versus Target 16Future Semiconductor Inventory Holding Targets 16Total Cost of Ownership 165. How Buyers Buy: Procurement Sourcing Chaiuiels 19Role of Distribution 19Pros and Cons of Distribution 20Spot Market 20Strategy toward the Spot Market 21Semiconductor Device Families Procured from the Spot Market.. 226. Who Buyers Deal With: Supply Base Analysis 25Current Supply Base 25Changes from 1996 25Changes Expected in 1998 27Stiategic Suppliers 277. How They Are Doing: Vendor-of-Choice Programs and Trends 29Do They or Don't They? 29Frequency of VoC 30Suppliers That Are Tracked 31Management's View 318. What Matters: Importance versus Satisfaction 33Delivery Issues 33Quality Issues 34Responsiveness Issues 34Technical Support Issues 36Flexibility Issues 37Total Cost of Ownership Issues 38Price Issues 39Summary 40SSPS-WW-UW-9701 ©1997 Dataquest December 8,1997
Semiconductor Supply and Pricing WorldwideTable of Contents (Continued)Page9. Truth or Token? Supplier and Buyer Trust 41Vendor of Choice Feedback to Suppliers 41How Is Information Shared? 42Buyer and Vendor Trust 44Value and Goal Sharing 4610. Teaniwork: Supplier and Buyer Joint Approval 47Joint Qualification: Yes or No 47Which Device Families 48If Not Now, What about the Future? 4911. Roundup: Conclusions and Comparisons 51SSPS-WW-UW-9701 ©1997 Dataquest December 8,1997
1997 Semiconductor User Wants and Needs: They Want More! IjjList of FiguresFigurePage2-1 Percentage of Buyers Surveyed Using the Spot Marketfor the Listed Semiconductor Device Families 32-2 Importance versus Satisfaction Ratings for TotalCost of Ownership 43-1 Type of Functional Group 83-2 Respondents' Semiconductor Purchases 83-3 Respondents' Application Markets 93-4 Level of Purchasing Responsibility 103-5 Sales of Respondents 114-1 Semiconductor Spending of Respondents, 1996 134-2 Semiconductor Purchasing Power Growth 144-3 Current Targeted Semiconductor Inventory Holding Levels 154-4 Change Expected in Targeted Semiconductor Level, 1998 174-5 Current Measurement of TCO 175-1 Percentage of Semiconductor Spending throughDistribution Channels 195-2 Spot Market Purchases of Semiconductors 215-3 Percentage of Respondents Buying Each Device Familyon the Spot Market 236-1 Number of Suppliers Used by Respondents in 1997 266-2 Strategic Suppliers versus Regular Suppliers 277-1 Performance of Regular Vendor Evaluation 297-2 Frequency of Performance Evaluation 307-3 Priority of VoC Program for Nonpurchasing Management 328-1 Delivery Issues 348-2 Quality Issues 358-3 Responsiveness Issues 358-4 Technical Support Issues 368-5 Flexibility Issues 378-6 Total Cost of Ownership Issues 388-7 Pricing Issues 399-1 VoC Feedback to Vendors 419-2 Level of VoC Feedback to Vendors 429-3 Changes in VoC Feedback to Vendors 439-4 Level of Trust in Vendors 449-5 Change in Level of Trust in Vendors 459-6 Vendors' and Respondents' Shared Goals 4610-1 Semiconductor Joint Qualification—Vendors and Respondents.... 4710-2 Jointly Qualified Devices—Level of Participation 4810-3 Plans for Joint Qualification 49SSPS-WW-UW-9701 ©1997 Dataquest December 8,1997
Semiconductor Supply and Pricing WorldwideList of TablesTablePage4-1 Semiconductor Inventory Levels: Current versus Target 165-1 Spot Market Strategies 215-2 Device Families Bought on the Spot Market 226-1 Change in Number of Suppliers since 1996 266-2 Change in Number of Suppliers Expected in 1998 277-1 Vendors Evaluated Regularly 31iiSSPS-WW-UW-9701 ©1997 Dataquest December 8,1997
Chapter 1Executive SummaryThree Semiconductor Applications CategoriesFor the purposes of estimating semiconductor consumption, Dataquesthas segmented electronics equipment production into three broad groups.These three groups are data processing, communications, and others.These groups in turn are broken into narrower electronic product categories,as shown below:• Data processing• Computers• Data storage• Input/output devices• Dedicated systems• Other data processing• Communications• Premise telecom• Public telecom• Mobile communications• Broadcast and studio equipment• Other communications• Others• Industrial• Consumer• Military/civil aerospace• TransportationAccording to Dataquest's spring 1997 semiconductor application forecast,data processing accounts for 51 percent of 1996 semiconductor consumption(revenue-based), communications for 22 percent, emd others for27 percent.For the purposes of this report, Dataquest selected the demographics ofthe companies participating so that 50 percent of respondents representedthe data processing segment, 25 percent, communications, and iiie rest,others.SSPS-WW-UW-9701©1997 Dataquest
Semiconductor Supply and Pricing WorldwideSurvey ObjectiveDataquest wanted to examine the buyer/supplier relationship from theprocurement/user standpoint. Users of semiconductors, primarily buyers,were surveyed on various aspects of their supplier relationship.The objective of the survey was to complete 100 surveys with the respondents'demographics: 50 percent data processing companies, 25 percentcommunications companies, and 25 percent industrial, military, medical,and consumer companies.Project Analysts: Evelyn Cronin and Mark GiudiciIiSSPS-WW-UW-9701 ©1997 Dataquest December 8,1997
, . . • , •• • • • • : • • . • : : • • • : : : . • • :- - ' • — • • - - - • • -• - ' - - - - • - - —tChapter 2IntroductionManagement SummaryDataquest completed a survey of 104 semiconductor users that exploredthe relationship between users (buyers) and vendors and how procurementis conducted. Those surveyed account for over 15 percent of the totalsemiconductor spending for North America in 1996, based on Dataquest'stotal North American semiconductor market revenue. The results werevery interesting.For example, it was discovered that the device family most widely sourcedin the spot market by the buyers surveyed was programmable logicdevices (PLDs)—over 43 percent of all buyers who use the spot marketsource PLDs there. Figure 2-1 plots these results.The next group consisted of two memory devices, DRAM and SRAM.Thirty-eight percent of buyers who use the spot market buy these devicesthere. EPROM, compute processors, and controllers form the next group,with 36 percent of spot market users selecting these categories.IIFigure 2-1Percentage of Buyers Surveyed Using the Spot Market for the Listed SemiconductorDevice FamiliesProgrammable Logic DevicesDRAM (Including Modules)SRAMEPROMCompute MicroprocessorsControllersFlash MemoryEEPROMOptoelectronicsDigital Signal ProcessorsOthersSource: Dataquest (November 1997)-fes-^:: ;•; -v;^1^30i• 111J1—1 r—35 40\—I4;97 8330SSPS-WW-UW-9701©1997 Dataquest
Semiconductor Supply and Pricing WorldwideClose behind were flash and EEPROMs, which were bought by 33 percentof the group. Thirty-one percent of respondents who use the spot marketbuy or have bought optoelectronics there, while DSPs and others werebought by 25 percent. The "others" category is a mixed bag made up of clientswho refused to state which devices they bought, those buying discretes,and those who bought a wide variety but would not specify.Another area covered was the differences in importance and satisfactionrating for key purchasing criteria (see Figure 2-2). One of the criteria studiedwas total cost of ownership (TCO). The buyers have spoken—they arenot satisfied with their vendors' efforts to reduce TCO. In fairness to vendors,though, TCO is probably the hardest of the three to pin down. It issubject to so many variations in itself, and the way it is tracked by buyersseems to be in a state of flux (according to the vendors). That said, however,any means by which the TCO can be reduced by vendors is appreciatedby buyers, and the buyers certainly believe the vendors can and needto do more.Figure 2-2Importance versus Satisfaction Ratings for Total Cost of OwnershipVendor Base ReductionTCO5I6 bv_ j ^B Importance# SatisfactionInventory ControlI97fl33iSource: Dataquest (November 1997)SSPS-WW-UW-9701 ©1997 Dataquest Decembers, 1997
IntroductionReport ContentsThe report has been divided into 11 chapters. Chapter 1 is the executivesummary, and Chapter 2 is the management summary. Chapter 3 coversthe demographics of the survey participants. Chapter 4 looks at the users'areas of semiconductor spending and their relation to total market size aswell as to inventory holding and total cost of ownership.Chapter 5 covers procurement sourcing charuiels, specifically the distributionand spot market channels. It looks at advantages and disadvantagesand sourcing strategies. Chapter 6 deals with supply base and the vendortrends. It also covers strategic versus nonstrategic suppliers. Chapter 7looks at vendor measurement, its frequency, and its perception by nonprocurementmanagement.Chapter 8 explores the importance versus satisfaction ratings for delivery,quality, responsiveness, technical support, flexibility, total cost of ownership,and price. Chapter 9 looks at information sharing between buyersand suppliers and also covers the issue of tiust and goal sharing in therelationship. Chapter 10 deals with buyer and vendor joint approval ofsemiconductors. The report firushes with conclusions and comparisons inChapter 11.SSPS-WW-UW-9701 ©1997 Dataquest December 8,1997
k Chapter 3Survey Participant DemograpliicsSurvey MethodologyDataquest's 1997 Semiconductor Procurement study contains the results ofa telephone survey conducted by Dataquest's Worldwide Research Operationsgroup. The survey questionnaire was developed by analysts fromDataquest's Semiconductor Supply and Pricing Worldwide program(SSPS). The questionnaire comprises a total of 45 questions. Many of thequestions allowed or required more than one response. On average, arespondent was asked to answer about 40 questions because not all questionsapplied to each respondent. Trained interviewers conducted the 20-minute survey using a computer-aided telephone interviewing (CATI)system. About 15 percent of each interviewer's work was monitored forvalidation. Worldwide Research Operations analysts tabulated the surveyresults using SPSS, a statistical analysis software package.Dataquest conducted the study during September 1997. The sample listwas obtained from a Computer Intelligence database. Dataquest obtaineda total of 2,303 randomly selected names. The titles represented were president/generalmanager, senior financial executive, PC manager, and purchasemanager in the computer and equipment, household appliance,household, communications, transportation, military and civil aerospace,medical, optical instrument, environment, and process control industries.Dataquest placed a total of 3,056 calls. The sample disposition was asfollows:• 104 completed interviews• 129 bad numbers• 2,097 unable to contact subject, left message, or others• 125 refused interviewRespondents' Function Groups• 601 did not qualify to participate in studyThe functional groups of those responding to the survey ranged from theentire company to division and department levels. As shown in Figure 3-1,more than one-third (34.6 percent) of the sample purchased for their entirecompanies, over 15 percent (16.3 percent) represented divisions, and closeto half (46.2 percent) represented their departments. The high percentageof department-level respondents accounts for the size of the purchasesmade. Figiire 3-2 shows that, again, close to half the respondents(44.2 percent) bought up to $1 million in semiconductors in 1996, a quarter(25 percent) bought between $1 million and $9.9 milUon, and 25.9 percentbought over $10 million semiconductors last year. The total of semiconductorspurchased in 1996 was $5.82 billion (12.98 percent of all 1996 semiconductorsconsumed in the Americas).SSPS-WW-UW-9701©1997 Dataquest
Semiconductor Supply and Pricing WorldwideFigure 3-1Type of Functional Group (N = 104)Others (2.9%STBSS^Source: Dataquest (November 1997)Figure 3-2Respondents' Semiconductor PurchasesDo Not Know/Refuse (4.9%)978333Source: Dataquest (November 1997)SSPS-WW-UW-9701 ©1997 Dataquest Decembers, 1997
Survey Participant DemographicsIRespondents' DemographicsThe makeup of the survey response closely reflects the North Americanelectronics industry from which it was polled. As shown in Figure 3-3,respondents from the data processing industry (any nonsofbvare companymanufacturing or selling computers or equipment used with computers)make up 50 percent of the sample. One-quarter of the responsecame from communications comparu.es, and the remaining 25 percent ofthe sample is made up of industrial, consumer, and military/civil aerospacecompanies. Based on the spring 1997 forecast for 1996 semiconductorrevenue by application, 51 percent of the overall North Americanelectrorucs industry is data processing companies, 22 percent is communicationscompanies, and 27 percent is industrial, consumer, transportation,and military/civil aerospace companies.Figure 3-3Respondents' Application Markets (N = 104)/ others/ (25%)Data Processing 1(50%) 1\ Communications\ (25%)37833^Source: Dataquest (November 1997)SSPS-WW-UW-9701 ©1997 Dataquest Decembers, 1997
10 Semiconductor Supply and Pricing WorldwideRespondents' Market SizeThe level of purchasing control also ranged from large to small. The spectrumsparmed from handling worldwide operations to handling only thelocation at which the respondent worked. As shown in Figure 3-4, overone-quarter (26.9 percent) of the respondents were responsible for worldwidesemiconductor procurement, 10.6 percent were responsible for U.S.purchases, 17.3 percent handled divisional semiconductor procurement,and close to half (45.2 percent) were responsible for their work location.This response sample represents a good mix of tactical and strategic procurementrequirements.Figure 3-4Level of Purchasing Responsibility (N = 104)j i ^UnitedX\. States/ \ (10.6%)/ Division \f (17.3%) \Working 11 Location Only 1\ (45.2%) J,\ Worldwide\ (26.9%)97B336Source: Dataquest (November 1997)SSPS-WW-UW-9701 ©1997 Dataquest Decembers, 1997
Survey Participant Demographics 11Figure 3-5Sales of Respondents (N = 104)There was a large spread in the size of the companies for which therespondents worked. The largest group (25 percent) came from companiesranging from $10 million to $49 million in sales; the next-largest group ofrespondents (16.3 percent) had sales of more than $1 billion. The full detailof 1997 and 1998 sales estimates is shown in Figure 3-5. Most companieswith more than $100 million in sales (except those ranging from $500 millionto $999 million) expected to grow from 1997 to 1998, while thoseunder $100 million all expected either to shrink or stay the same.Less than$1 Millionn ~T-$1 Million- $10 Million- $50 Million- $100 Million-$500 Million- More than Do Not$9.9 Million $49.9 Million $99.9 Million $499.9 $999.9 $1 Billion Know/Million Million RefuseSource: Dataquest (November 1997)SSPS-WW-UW-9701 ©1997 Dataquest Decembers, 1997
Chapter 4Show Me the Money: Spending and TCOSemiconductor SpendingThis chapter covers what many consider the backbone of the procurementfunction: semiconductor spending, inventory holding, and total cost ofownership.A survey is a useful tool for getting feedback on the mood of a given baseon selected issues. However, the usefulness is largely related to the survey'srelevance to the readers. Buyers always want to know the bottomline—are those surveyed big fish or little fish in the pond that is called procurementspending?The participants were asked to state their actual 1996 semiconductorspending. Figure 4-1 shows that the survey included a good spread, fromsmaller companies to quite large organizations. The sum of the semiconductorspending by the respondents was $5,818 billion.Figure 4-1Semiconductor Spending of Respondents, 1996 (N = 104)Do Not Know/Refuse (4.9%Total = $5.818 BillionSource: Dataquest (November 1997)SSPS-WW-UW-9701 ©1997 Dataquest 13
14 Semiconductor Supply and Pricing WorldwideSurvey Participants versus Total Nortti America IVlarlcetFigure 4-2Semiconductor Purchasing Power GrowthPutting the survey respondents into the context of their North Americanmarket. Figure 4-2 shows that the results are impressive. The purchasingpower in 1996 of the surveyed 104 respondents represents 13 percent of allthe semiconductors consumed in the Americas ($44.8 billion). The outlookof these respondents is to increase their purchases relative to Dataquest'sforecast to 14.1 percent of 1997's semiconductor consumption and16.2 percent of 1998's Americas semiconductor consumption.Billions of Dollars60-50HI40 HI30 HTotalSemiconductorPurchasesTotal AmericasSemiconductorConsumption20101997 19983^0338Source: Dataquest (November 1997)Targeted Semiconductor inventory HoidingDataquest next asked about semiconductor inventory holding levels. Buyersare usually set a targeted inventory holding level (in days) that theyaim to achieve. However, there is often a difference between the inventorytarget goal and the actual semiconductor inventory levels maintained.All 104 of the buyers surveyed responded to this question. Figure 4-3shows the ranges of the targeted semiconductor inventory holding levelsfor the surveyed buyers in 1997. The largest group had the lowest targetfor inventory holding (between one and 10 days)—38 percent of respondentsfell into this category.SSPS-WW-UW-9701 ©1997 Dataquest Decembers, 1997
Show Me the Money: Spending and TCO 15IThe second-largest group had a targeted semiconductor holding levelbetween 21 and 30 days—33 percent. Fourteen percent of respondentscited ranges of 11 to 20 days, and 15 percent named levels of 31 to 90 days.Based on the target semiconductor inventory holding information givenby the buyers surveyed, the mean inventory holding target was 24 days.Figure 4-3Current Targeted Semiconductor Inventory Holding Levels (N = 84, Do Not Know/Refused = 20)Source: Dataquest (November 1997)Semiconductor Inventory Holding: Actual versus TargetTheory and practice are often different. Dataquest asked buyers to statewhether their current actual inventory holdings were at, below, or abovetheir target inventory levels. The results of this are shown in Table 4-1.Even though 8 percent of respondents maintained inventory levels lowerthan their targets, the vast majority of buyers surveyed did not exceedexpectations! Although 43 percent of participants said that their actualsemiconductor inventory holding level was the same as their target, a full39 percent said that they were rurming with more inventory than their target.One-tenth of participants refused to comment.SSPS-WW-UW-9701 ©1997 Dataquest Decembers, 1997
16 Semiconductor Supply and Pricing WorldwideTable 4-1Semiconductor Inventory Levels: Current versus TargetSame as TargetHigher than TargetLower than TargetDo Not Know/RefuseTotalSource: Dataquest (November 1997)Number of Respondents4541810104Percentage4339810100Future Semiconductor Inventory Holding TargetsDataquest was interested to learn what would happen to the participants'targets for semiconductor inventory in the next 12 months. The buyerssurveyed were asked how their 1998 inventory holding target wouldchange compared to their present target. Figure 4-4 shows the results.Over 40 percent of those participating in the survey said that their inventorytarget would remain the same for 1998 as it is for 1997. A further37 percent, however, stated that next year's inventory target would belower than their current target. However, 15 percent of the buyers surveyedacknowledged that their inventory holding target would be higherin 1998 than in 1997. The remaining respondents either refused to commentor did not know how next year's target would compare to this year's.Figure 4-4Change Expected in Targeted Semiconductor Level, 1998 (N = 104)Do Not Know/Refuse (7%)^/ Higher than \/ Current Target \/ (15%) \Same as 1Current Target 11 \ (41%) 1\ Lower than \ m\ Current Target \ m\ (37%) \ M-37«yaSource: Dataquest (November 1997)SSPS-WW-UW-9701 ©1997 Dataquest Decembers, 1997
Show Me the Money: Spending and TCO 17Total Cost of OwnershipFigure 4-5Current Measurement of TCO (N = 104)The concept of TCO is often bandied about now. Pick up any procurementor logistics magazine and one will find articles that discuss this notion invarying depths. However, Dataquest wanted to see if there was any firebehind the smoke of TCO debate. The survey respondents were askedsimply if their companies measured total cost of ownership of the semiconductordevices being purchased at present.Figure 4-5 shows the results of TCO use by the buyers surveyed. It can beseen that the respondents were split almost down the middle. Half saidthey did measure TCO, while just under half said they did not measure itat the moment. It looks as if the jury is still out on TCO implementation fora lot of those surveyed. That said, though, it is very encouraging to seethat half of the companies had implemented TCO within theirorganizations.Source: Dataquest (November 1997)SSPS-WW-UW-9701 ©1997 Dataquest Decembers, 1997
Chapter 5How Buyers Buy: Procurement Sourcing ChannelsRole of DistributionWhen buyers want to obtain product, they have a number of sotircingchannels open to them. These channels can be divided into threecategories:• From the device manufacturer (OEM)• From a distributor• From a redistributor or broker in the spot marketOEM procurement is direct procurement; the other two channels are indirect.That is about the only similarity between the distributor and redistributorcharmels. As any buyer will testify, there is a world of differencebetween buying from an authorized distributor and buying from the spotmarket.In this chapter, Dataquest looks at the indirect sourcing channelsbutionand the spot market.-distri-Dataquest asked the buyers surveyed to state what percentage of theirsemiconductor spending was sourced through distribution channels. Figure5-1 shows the results. Of the 95 respondents who answered this question,10 said that they sourced no semiconductors from distribution(0 percent), while, on the opposite end of the spectrum, six buyers statedthat all their semiconductors were sourced through distribution(100 percent).Figure 5-1Percentage of Semiconductor Spending through Distribution Channels (N = 95)Number of Respondents30-100-10Percent111-50Percent51-70Percent71-89Percent90-100Percentg7B342Source: Dataquest (November 1997)SSPS-WW-UW-9701 ©1997 Dataquest 19
20 Semiconductor Supply and Pricing WorldwidePros and Cons of DistributionFor ease of analysis, the responses have been grouped into five ranges.Figure 5-1 resembles a reverse bell curve, with the two largest groups fallingwithin the 10 percent at either end of the spectrum. One-quartersourced up to 10 percent from distribution, and just over one-quarter ofthose surveyed sourced 90 to 100 percent from distribution. Just over40 percent of buyers sourced less than half of their semiconductor needsfrom distribution, but about 60 percent sourced more than half of theirneeds from distribution.Dataquest wanted to obtain the buyers' views on the advantages and disadvantagesof distribution. All survey respondents commented, and manychose more than one response.The most commonly mentioned advantages of distribution were:• Faster delivery• Shorter lead times• Greater flexibility• Expected higher priority from distributor than OEM/felt more valuedby distributor• Greater support from distributor for inventory holding and stock supportissuesThe most commonly mentioned disadvantages of distribution were:• Higher price• Lack of in-depth technical supportThus, for many, the advantages outweighed the disadvantages.Spot IVlarlcetBecause the spot market is a nnuch-discussed area for product redistribution,Dataquest was interested to learn what percentage of buyers usedthis charmel and what strategies they used. Also, Dataquest asked them tosay which semiconductor device families they sourced from the spotmarket.Dataquest first wanted to establish the percentage of buyers in the surveywho used the spot market to source semiconductors. Figure 5-2 shows thatabout 53 percent of the respondents did use the spot market, and38 percent said they did not use it. Over 9 percent either did not know ifthey used the spot market or refused to comment.SSPS-WW-UW-9701 ©1997 Dataquest: December 8,1997
How Buyers Buy: Procurement Sourcing Channels 21Figure 5-2Spot Market Purchases of Semiconductors (N = 104)Source: Dataquest (November 1997)Strategy toward the Spot MarketThose who admitted to using the spot market on occasion for semiconductorsourcing were asked for their strategy for using it. The results areshown in Table 5-1. Ninety percent sciid they use the spot market onlyw^hen they have to. This means that they source product from the redistributtonchannel only as a last resort. Five percent were opportunistic—theysource some product from the spot market if it is cheaper than their usualsuppliers. The remaining 5 percent source product only from the spot market.One wonders how wise it is to single-source semiconductors from thespot market.Table 5-1Spot Market StrategiesNumber of RespondentsUse Only When Necessary 49Use When the Spot Market Is Cheaper 3Buy All Products from the Spot Market 3Total 55Source: Dataquest (November 1997)Percentage9055100SSPS-WW-UW-9701 ©1997 Dataquest Decembers, 1997
22 Semiconductor Supply and Pricing WorldwideSemiconductor Device Families Procured from tlie Spot IVIarketDataquest sought to discover which semiconductor device families weresourced from the spot market. The buyers surveyed were asked to selectwhich of a list of device families they bought from the spot market. Theresults of their selection are grouped in Table 5-2.Table 5-2Device Families Bought on the Spot Market (N = 55)Programmable Logic DevicesDRAM (Including Modules)SRAMEPROMCompute MicroprocessorsControllersFlash MemoryEEPROMOptoelectronicsDigital Signal ProcessorsOthersSource: Dataquest (November 1997)Number of Respondents2321212020201818171414Percentage4238383636363333312525Please note that buyers were asked to select as many device families aswere applicable, so each percentage shown in Table 5-2 is independent ofthe others. Each shows the percentage of the 55 participants who buy orhave bought that device family from the spot market.For ease of viewing. Figure 5-3 graphs the frequency with which eachdevice was selected and its percentage. The device famUy most widelysourced in the spot market was PLDs—42 percent of all buyers who usethe spot market source PLDs there.The next group consisted of two memory devices, DRAM and SRAM. Ofthose buyers using the spot market, 38 percent buy these devices there.EPROM, compute processors, and controllers form the next group, with36 percent of spot market users selecting these categories.Close behind were flash and EEPROM, which were bought by 33 percentof the group. Thirty-one percent of respondents who use the spot marketbuy or have bought optoelectronics, while DSPs and other devices werebought by 25 percent. The "others" listing is a mixed bag made up of clientswho refused to state what devices they bought, those who bought discretes,and those who bought a wide variety but would not specify.SSPS-WW-UW-9701 ©1997 Dataquest Decembers, 1997
How Buyers Buy: Procurement Sourcing Channels 23Figure 5-3Percentage of Respondents Buying Each Device Family on the Spot MarketO-•-Percentage SelectingFrequencyofSelecSonFrequencyr25205H
Chapter 6Who Buyers Deal With: Supply Base AnalysisCurrent Supply BaseChanges from 1996Talk to most buyers for any length and the question of vendor base reductionalways surfaces as a concern. Buyers talk about adopting a scheme tomaximize the commercial benefits to the company while minimizing thenumber of vendors employed. However, because of the variety of componentneeds of the end product and because of vendor specialization, buyersare often forced to deal with more vendors than they would like. Itbecomes a juggling act for buyers to manage all of the vendor interfaces toensure that the best deal is being obtained.Many talk about the concept of strategic vendors—vendors that have beendeemed to be of the utmost importance to the buyer's company and integralto its continued success. In short, these are the suppliers that play avital role in the life of the buyer's company.This chapter examines the supply base trends of the 104 participants. Itlooks at how many vendors they currently deal with and how this haschanged from 1996 and will change in 1998. Chapter 6 also explores theconcept of strategic suppliers. Issues such as vendor-of-choice (VoC) programs,trust, and the sharing of information between buyers and suppliersare discussed in Chapters 7 and 9.Dataquest asked all survey participants how many vendors they currentlyuse. Figure 6-1 shows the results. Nearly seven out of 10 buyers surveyeddeal with fewer than 40 vendors. About two out of 10 buyers surveyeddeal with 40 to 100 suppliers, while one out of 10 buyers has a total vendorbase of between 101 and 700.Most buyers have between two and 10 suppliers—36 percent of respondentsfell into this range. Those with 11 to 39 vendors accounted for33 percent of buyers surveyed. The rest of those surveyed deal with morethan 40 different vendors. Based on the 104 completed responses gatheredby Dataquest, the mean number of vendors used by buyers is 56.However, given that a mere 10 percent of buyers deal w^ith more than 100vendors, the vendor base of 56 is artificially high. Removing these 10respondents and reducing the sample size to 94 produces a differentresult. In this case the n\ean number of vendors used by the buyers is 29.Figure 6-1 details the current number of vendors with which buyers deal.However, Dataquest wanted to see if the vendor base strategy of the participatingbuyers had altered much from 1996, so the surveyed buyerswere asked how their current vendor base has changed from 1996.SSPS-WW-UW-9701 ©1997 Dataquest 25
26 Semiconductor Supply and Pricing WorldwideFigure 6-1Number of Suppliers Used by Respondents in 1997 (N = 104)Source: Dataquest (November 1997)Table 6-1 shows how the current size of the supply base has changed from1996. Well over half of the respondents stated that the size of their vendorbase remained tmchanged from 1996 to 1997. This would mean either thatthese buyers had conducted a vendor rationalization program before 1996and reached a vendor base number with which they are satisfied or thatthese buyers have not done a vendor reduction exercise and are just usingthe previous year's supply base.iTable 6-1Change in Number of Suppliers since 1996SameIncreasedDecreasedDo Not Know/RefuseSource: Dataquest (November 1997)Number of Respondents5717273Percentage5516263Interestingly, over one-quarter of the buyers surveyed said that they havedecreased their vendor base from 1996. This would indicate that thesebuyers are in the process of vendor rationalization. This reduction programcould be deliberate, through purchasing consolidation, or accidental,through product changes.About 16 percent of surveyed buyers said that they have increased thenumber of vendors they deal with from 1996.SSPS-WW-UW-9701 ©1997 Dataquest Decembers, 1997
Who Buyers Deal With: Supply Base Analysis 27'Changes Expected in 1998Dataquest also sought to discover what plans the buyers had for their vendorbase size. Table 6-2 shows that about half of the participants have noplans to change their vendor size—in line with the results in Table 6-1.One-fifth of buyers in the survey plan to increase their vendor base size in1998, and about one-third plan to decrease their vendor base size nextyear.Table 6-2Change in Number of Suppliers Expected in 1998SameIncreasedDecreasedDo Not Know/RefuseSource: Dataquest (November 1997)Number of Respondents4921331Percentage4720321Strategic SuppliersAs was shown in Figure 6-1, all buyers surveyed deal with multiple suppliers.There has been a trend for buyers to rank vendors into strategic andnonstrategic categories. The reasons why one supplier is strategic andanother is not are many and may include spending, component importance,technology access, corporate goals, and manufacturing capability.Dataquest wanted to see if the buyers in this survey had strategic suppliers.Instead of asking the participants for a straight "yes or no" answer,Dataquest asked them to pick a statement that best fit their company'sopinion on strategic suppliers. The results are shown in Figure 6-2.Figure 6-2Strategic Suppliers versus Regular SuppliersNone Strategic (4%)Only a CertainNumber Strategic(12%)978*46Source: Dataquest (November 1997)SSPS-WW-UW-9701 ©1997 Dataquest Decembers, 1997
28 Semiconductor Supply and Pricing WorldwideOnly 4 percent of respondents stated that none of their current vendorswas strategic, while an impressive 23 percent of respondents stated that alltheir suppliers were strategic.Nearly three-quarters of participants had a certain number of strategicsuppliers, although it is interesting to see which statement they chose ofthe two offered by the survey that would have been appropriate responsesto the question. The two choices were "some suppliers are more strategicthan others" and "only a certain number of suppliers is strategic." Bothphrases have the same meaning but express it differently. The first phraseis more "touchy-feely" and less clearly defined, while the second phrase ismore logical, more definite, and less open to interpretation. Interestingly,the majority of the surveyed buyers picked the first phrase. What does thissay about the buyers? If only I were a psychologist and not an analyst, Icould respond.SSPS-WW-UW-9701 ©1997 Dataquest December 8,1997
Chapter 7How They Are Doing: Vendor-of-Choice Programsand Trends ^^-^^^^^^-.^^^^^_Do They or Don't They?One of the most far-reaching changes over the past five years impactingsuppliers of all products are vendor-of-choice—or similar—programs.VoC programs involve a regular review of supplier compliance withagreed-to goals as part of efforts to improve suppUer performance. Theconcepts of strategic vendors, vendor reduction, and total cost of ownership^1 involve VoC and are all dependent on a VoC program in one formor another.Figure 7-1Performance of Regular Vendor EvaluationDataquest wanted to see what percentage of the surveyed buyers actuallyconduct formalized, regular vendor measurement. In other words,Dataquest sought to discover whether buyers had a vendor-of-choice program.As shown in Figure 7-1, more than half (55 percent) of the respondentsperformed regular vendor reviews, highlighting both theimportance and opportunity of this increasingly important practice. It isimportant in that many semiconductor suppliers are now being regularlyreviewed for improvement, and it is an opportunity for users to lowertotal costs by beginning some sort of VoC program.Source: Dataquest (November 1997)SSPS-WW-UW-9701 ©1997 Dataquest 29
30 Semiconductor Supply and Pricing WorldwideFrequency of VoCThe frequency of vendor review often is cited as a critical part of the overallreview process. Reviews that are either too frequent are too time consumingfor the benefits gained; those that are not regular enough can be soinfrequent that they fail to reveal any meaningful improvement. Eachcompany needs to determine the frequency of vendor review that will providethe most cost-effective improvement schedule for both supplier anduser companies. Thus, Dataquest wanted to see what the frequency distributionwas for the surveyed buyers.Figure 7-2 shows that quarterly reviews are the most popular frequencyfor those respondents that perform reviews, with over one-third(38.2 percent) of the sample. The next-most-popular frequency is monthlyreviews, with over one-quarter of the sample (27.3 percent) following thisrigorous schedule. About one-third (32.6 percent) of those that reviewtheir supplier base do so every six months or armually—these companieseither have very good relations with their suppliers or are in relatively stablemarkets that do not require frequent performance reviews. It wasinteresting to note that respondents were evenly split over which suppliersthey reviewed. Emphasizing the need for each company to determinewhat is cost-effective, half of the respondents that performed reviews evaluatedonly strategic suppliers, while the other half reviewed all suppliers.Figure 7-2Frequency of Performance Evaluation (N = 55)Do Not Know/Refuse (1.9%)Source: Dataquest (November 1997)SSPS-WW-UW-9701 ©1997 Dataquest Decembers, 1997
How They Are Doing: Vendor-of-Choice Programs and Trends 31Suppliers That Are TrackedThe majority of buyers have strategic and nonstrategic vendors—aresounding 96 percent had either some strategic vendors or had only strategicvendors. However, only 55 percent of the sample also had a regularlyconducted VoC program. Dataquest then asked this 55 percent to indicatethe vendors with which they conducted this performance evaluation.Table 7-1 shows the results.Table 7-1Vendors Evaluated RegularlyAll VendorsOnly Strategic VendorsDo Not Know/RefuseSource: Dataquest (November 1997)Number of Respondents28281Percentage49492Management's ViewIt can be seen that the percentage of those who performed vendor-ofchoiceevaluations for their entire vendor base was the same as those whoperformed it only for their strategic vendors, 49 percent. The "do notknow/refused" responses accounted for the remaining 2 percent.Although VoC programs are critical to those directly involved, they aresometimes given only lip service by the rest of management within a participatingcompany. We asked the sample whether their VoC program wasa priority for the nonpurchasing management of their companies. Figure7-3 shows that, for most, the rest of management is either actively(48.1 percent) or partly (20.4 percent) involved, while close to one-fifth(18.5 percent) of the respondents still had no outside managementinvolvement in this critical area. Although it is encouraging that morethan 80 percent of the sample saw management outside of purchasing takeVoC programs as some sort of a priority, it is still disconcerting that closeto 20 percent of companies that have VoC programs do not have buy-infrom management outside of purchasing.SSPS-WW-UW-9701 ©1997 Dataquest Decembers, 1997
32 Semiconductor Supply and Pricing WorldwideFigure 7-3Priority of VoC Program for Nonpurchasing ManagementGiven Information Only(13.0%)None \(18.5%) \Yes, ActivelyInvolved(48.1%)--'^es, but Not 1\ Actively Involved 1\ (20.4%) tSTSs^eSource: Dataquest (November 1997)SSPS-WW-UW-9701 ©1997 Dataquest Decembers, 1997
Chapter 8What IVIatters: Importance versus SatisfactionThere are many factors that create a good working relationship betweenthe buyer and the seller, and the vendors' ability to perform what's neededby their customers when it matters is crucial. However, it is often difficultfor vendors to assess how they're doing and which of many issues mattersmost to their customers (the buyers). In other words, it is sometimes difficultto see the forest for the trees—of aU the issues floating out there,which are the most important to buyers, and how do the vendors shapeup? This chapter attempts to gauge the importance to buyers of key procurementissues and to measure their satisfaction levels.For ease of analysis, this chapter has been broken into seven subsections.Each subsection covers a key purchasing topic, and the survey participantswere asked to rate importance and satisfaction levels for a list ofrelated criteria. The seven subsections are: delivery issues, quality issues,responsiveness issues, technical support issues, flexibility issues, total costof ownership issues, and price issues.The participating buyers were asked to rate the importance of a criterionand also how satisfied they were with their vendors on that criterion. Thescale of measurement was 1 to 5, with 1 being the least important or leastsatisfied and 5 being the most important or most satisfied. All 104 surveyparticipants responded, and their mean score is plotted.Delivery IssuesDataquest broke delivery into three issues: logistics, lead times, and ontimedelivery. Figure 8-1 plots the mean score given by buyers on importanceversus satisfaction levels for these issues. From this it can be seenthat vendors were underachieving on each of the three delivery issues—that is, the mean satisfaction score was lower than the mean importancescore.For logistics, the importance and satisfactions levels were relatively close.However, according to the buyers surveyed, logistics was the least importantof the three delivery issues. Ironically, it received the highest satisfactionscore.On-time delivery was the most important of the delivery issues, followedclosely by lead times. This is not surprising. If buyers cannot trust theaccuracy of vendors' delivery schedules, what can they trust? If buyerscannot procure product within a reasonable time, how do they survive?However, it is clear from the results that most buyers believe that theirvendors have some w^ork to do on these fronts. The difference between themean importance score and the mean satisfaction score was 1.12 and 1.1for on-time delivery and lead times, respectively, with satisfaction laggingimportance in both cases.SSPS-WW-UW-9701 ©1997 Dataquest 33
34 Semiconductor Supply and Pricing WorldwideFigure 8-1Delivery IssuesImportanceSatisfactionOn-Time DeliveryLead Time97S350Source: Dataquest (November 1997)Quality IssuesQuality issues were divided into two parts: product reliability and environmentalissues. From Figure 8-2 it can be seen that the results are somewhat mixed. Buyers are less concerned about envirortmental issues thanreliability issues. However, the satisfaction level on the environmentalissues exceeds the importance level. Clearly, vendors have done more thanenough on this front, and buyers are happy.Responsiveness IssuesFor quality and reliability, the mean score was 4.88 (of a maximum of 5).Product reliability is crucicil in the buyer/seller relationship, a fact thatbuyers clearly recogruze. Product reliability is the foundation on which therelationship is built. No matter how tall a building the buyers and sellersbuild, without solid product reliability, it will topple and fall. Buyers arefairly pleased with the results of their vendors giving a mean satisfactionrating of 4.29 (just 0.59 behind the mean importance score). However, thisis a key issue sellers can keep working on—there is no such thing as aproduct that is too reliable in the minds of customers!This subsection covers three issues: product availability, vendor responsiveness,and the speed with which new products are brought to market.The mean scores are shown in Figure 8-3. AU received very high importanceratings—4.72,4.69, £ind 4.53 for availability, responsiveness, and newproduct speed to market, respectively.SSPS-WW-UW-9701 ©1997 Dataquest Decembers, 1997
What Matters: Importance versus Satisfaction35Figure 8-2Quality Issues^ImportanceSatisfactionSource: Dataquest (November 1997)Figure 8-3Responsiveness IssuesAvailability of Products5ImportanceSatisfactionNew Product Time to MarketResponsiveness of Vendor97S3SSource: Dataquest (November 1997)SSPS-WW-UW-9701©1997 DataquestDecembers, 1997
36 Semiconductor Supply and Pricing WorldwideTechnical Support IssuesFigure 8-4Technical Support IssuesHowever, for each of the three criteria, buyers' mean scores for satisfactionwere lower than the mean scores for importance. For both product availabilityand speed of new product introduction, the difference betweenimportance and satisfaction was 1.2. For vendor responsiveness, the differencewas 0.98.Vendors: There is definite room for improvement in this arena!Technical support comprises three parts: vendor product changes or roadmaps, technical support, and design-in issues. The mean scores have beenplotted in Figure 8-4. Design-in issues were the least important (a score of3.72), while actual technical support (at 4.2) was the most important of thethree. However, once again, satisfaction levels are lower than importancelevels for all three.For design-in issues, the difference between importance and satisfaction isa mere 0.16. Clearly, buyers believe that, once a device has been approvedby engineering (designed in), this becomes a less important technical issuein the buyer/supplier relationship. The difference for the other two criteriais large enough to warrant greater focus on them by vendors.Vendor Product Changes/Road Maps5ImportanceSatisfactionDesign-In IssuesTechnical SupportSource: Dataquest (November 1997)SSPS-WW-UW-9701 ©1997 Dataquest Decembers, 1997
What Matters: Importance versus Satisfaction 37Flexibility IssuesDataquest asked about three criteria: vendor flexibility, managing theprice variation between different vendors, and long-term agreements andpartnerships. The mean scores for importance and satisfaction are plottedin Figure 8-5.Of the three criteria measured, vendor flexibility received the highestimportance score but the lowest satisfaction score. The mean satisfactionscore trailed the mean importance score by 0.84. The other two criteriareceived almost the same importance mean score—4.15 and 4.13 for pricevariations and long-term agreements, respectively. However, in bothcases, satisfaction lags behind importance.This is a difficult area for vendors. Aside from the criterion of vendor flexibility,many suppliers feel that it is hard for them to improve on the otherflexibility issues. For a criterion such as price variations between differentvendors, obviously a buyer would like vendors to match the lowest priceoffered. Often a vendor feels powerless, because manufacturing costs andpricing strategies vary from company to company. However, if a buyerbelieves that a vendor has too high a margin and if the buyer can buy thesame product for less from another vendor, then chances are high that thebuyer will! Buyers do not expect price parity between vendors, but theydo expect a vendor to follow market trends and to react to changing marketdynamics.Figure 8-5Flexibility IssuesFlexibility of Vendor5ImportanceSatisfactionLong-Term Agreements/PartnershipsPrice Variations of Different Vendors9JB354Source: Dataquest (November 1997)SSPS-WW-UW-9701 ©1997 Dataquest Decembers, 1997
38 Semiconductor Supply and Pricing WorldwideTotal Cost of Ownership IssuesFigure 8-6Total Cost of Ownership IssuesFor long-term agreements, it is true that often it is the buyers' companythat sets the framework, but a vendor can negotiate—a buyer and sellerthen come up with an agreement that works for both of them. A buyer hasto feel that the vendor's company is making compromises for the greatercommercial good of both parties and is truly committed to the future ofthe partnership. The words must be backed by actual deeds for credibilityto exist. The meem scores in Figure 8-5 show that the surveyed buyers aresatisfied with their vendors' performance to date.Dataquest asked about three different criteria—total cost of ownership,inventory control, and vendor base reduction. The mean scores for importanceand satisfaction are shown in Figure 8-6.Inventory control was clearly the most important of the three criteria measured,with a mean score of 4.39. And the vendors seem to be responding,because the satisfaction mean score was highest for inventory control.However, it still trails behind the importance score, so vendors definitelyneed to keep working on this one.TOO5i9 Satisfaction^' N5 \Vendor Base Reduction"^5In i/entory ControlS7B355Source: Dataquest (November 1997)SSPS-WW-UW-9701 ©1997 Dataquest Decembers, 1997
What Matters: Importance versus Satisfaction 39TCO came in as the second most important of the three criteria, receiving amean score of 4.27. However, its satisfaction mean score was the lowest ofthe three. The buyers have spoken—they are not satisfied with their vendors'efforts to reduce TCO. In fairness to vendors, though, TCO is probablythe hardest of the three to pin down. It is subject to so many variationsin itself, and the way it is tracked by buyers seems to be in a state of flux(according to the vendors). However, any means to reduce the TCO on theside of the vendors is appreciated by buyers, and the buyers certainlybelieve that the vendors can and need to do more.For vendor base reduction, the mean scores speak for themselves. Buyersdo not rate it as important as the other total cost of ownership issues butare more than satisfied with their vendors on this front.IPrice IssuesFigure 8-7Pricing IssuesThe last of the areas covered is price, and Dataquest asked about threeissues—fluctuating market price, obsolescence risk, and second sourcing.Of the three, obsolescence risk was the most important but scores the loweston satisfaction (see Figure 8-7). Clearly, buyers think that vendors arenot doing as much as they could to minimize their obsolescence risks or toshare the cost pain. Again, this is something that needs more focus fromvendors.Fluctuating market price and second sourcing scored almost the same forboth mean importance (4.22 and 4.21, respectively) and mean satisfaction(3.47 and 3.45, respectively). Both are importcint to buyers, and vendorshave room for growth.Ructuating Market Price5ImportanceSatisfactionSecond SourcingObsolescence Risks978396Source: Dataquest (November 1997)SSPS-WW-UW-9701 ©1997 Dataquest Decembers, 1997
40 Semiconductor Supply and Pricing WorldwideSummaryThe buyers have spoken and their words are true.Vendors are doing a reasonably good job of satisfying the buyers but stillfall short of their customers' expectations. Some vendors would argue thatthe buyers' standards are too high and that a vendor cannot please everybuyer all of the time. However, it must be remembered that tiie buyer isforking out the money and has a right to expect certain standards.i^iSSPS-WW-UW-9701 ©1997 Dataquest December 8,1997
Chapter 9Truth or Token? Supplier and Buyer TrustOver the years, supplier-buyer relations have rxm the gamut from the equivalentto warring camps, wiih each side out to beat their "opponent," to submissionto "lovefests," with each company bearing in mind that suppliershave feelings, too, and should not be seen as the enemy. As the supplier/buyer pendulum continues to swing, it now appears that the most pragmaticapproach to lowering overall costs and providing adequate revenue to supplierscorrelates directly to the level of trust between the two partiesinvolved. The bottom line is this: The more trust, the better the business relationship.Total costs are lower, and revenue streams are more consistent.Critical in gaining and keeping trust between buyer and seller is the level ofirvformation exchange. Vendor-of-choice programs are regularly used byDataquest's sample of semiconductor users. A linchpin of trust retentioninvolves user feedback about VoC findings to the supplier, with a program ofscheduled improvement where warranted.Vendor of Choice Feedback to SuppliersFigure 9-1VoC Feedback to VendorsDataquest asked the buyers surveyed whether they give VoC feedback totheir vendors. As shown in Figure 9-1, a strong majority of more than90 percent of the sample mvolved with VoC programs share their findingswith their suppliers. This was expected, because the main focus of VoC is thegoal of improving performance through agreed-upon metrics. What wasinteresting is the 7 percent of VoC participants that keep the information tothemselves. This appears to contradict the purpose of the VoC concept, butthe practice of sharing once-confidential information can be an incrementalprocess for some companies.y\ '^^/ \(7%)YesM(93%) mS7B^7Source: Dataquest (November 1997)SSPS-WW-UW-9701 ©1997 Dataquest 41
42 Semiconductor Supply and Pricing WorldwideHow Is Information Shared?Figure 9-2Level of VoC Feedback to VendorsHow VoC information is shared often involves the type of information andwith whom it is shared. Over half (51 percent) of the respondents withVoC programs share all the information gathered with all suppliers, asshown in Figure 9-2, while close to 40 percent (38.8 percent) of the respondentsshare information only with their strategic suppliers. A muchsmaller percentage shares limited information with selected suppliers.Close to 10 percent (8.2 percent) share certain information confidentiallywith vendors on a need-to-know basis only, while 2 percent of the respondentsshare select information with only some suppliers. Again, it appearsthat old habits are hard to break in the sharing of information, with someusers reluctant to share all with their supply base. This should changetoward sharing all information as the process becomes more comfortable.Certain InformationShared with Some Vendors(2.0%)Certain InformationShared Confidentially(8.2%)978358Source: Dataquest (November 1997)SSPS-WW-UW-9701 ©1997 Dataquest Decembers, 1997
Truth or Token? Supplier and Buyer Tjxist 43IAlong these lines, Dataquest asked the sample to note how the practice ofsharing information has changed and whether the respondents thought itwould change in the future. Figure 9-3 shows that close to two-thirds(60.9 percent) of the study had changed the information shared over thepast five years and tliat almost the balance (38.0 percent) plan on changingpractices down the road. It was somewhat interesting that 8 percent wereon the fence about whether to change practices in the future. This could beeither a move toward or away from increased sharing of information withsuppliers. One would hope the direction is toward the former rather thanthe latter.Figure 9-3Changes in VoC Feedback to VendorsPercent70-fl60 H^Five Years Ago50• Future4030m^MiM»20100YesMm^—JMaybe378:^9Source: Dataquest (November 1997)SSPS-WW-UW-9701 ©1997 Dataquest Decembers, 1997
MSemiconductor Supply and Pricing WorldwideBuyer and Vendor TrustFigure 9-4Level of Trust in VendorsA prerequisite for the overall practice of VoC is a level of trust betweensupplier and buyer. When users were asked about the level of their trust intheir vendors, most of the responses were cautious, as shown Figure 9-4.Although more than one-third (34.7 percent) of the sample said theytrusted all of their vendors, one-quarter of them trusted only their strategicvendors. Over one-fourth (28.6 percent) of the respondents trustedtheir suppliers "within reason." The concept of trust appears to be an areain which suppliers, in general, have room to improve, because only2 percent of the users sampled absolutely did not trust their suppliers.This leaves room for suppliers to improve relations with those customersstill somewhat receptive to opening lines of communication.No (2.0%)iWithin Reason(8.9%)^6360Source: Dataquest (November 1997)SSPS-WW-UW-9701 ©1997 Dataquest Decembers, 1997
Truth or Token? Supplier and Buyer Trust 45IAs shown in Figure 9-5, when polled on whether their levels of trust hadchanged over the past five years, over half (52.9 percent) of the respondentssaid "no," while over one-third (36.5 percent) had seen their level oftrust change. It was another confirmation to note that over one-quarter(26.9 percent) of the sample were planning to change the levels of trustthey now had w^ith their suppliers. As in the other responses, improvedlevels of trust and information sharing are now being planned by at leastthis sample of semiconductor users.Figure 9-5Change in Level of Trust in VendorsK] Five Years AgoaFuture4030-20'100YesIf CompanyPolicy ChangesIf VendorPolicy ChangesDo Not KnowToo DistantSource: Dataquest (November 1997)SSPS-WW-UW-9701 ©1997 Dataquest Decembers, 1997
A6^Semiconductor Supply and Pricing WorldwideValue and Goal SharingIn order for a VoC program to provide benefit to both the user and supplier,both parties must generally share the same goals. Close to half(41.4 percent) of the respondents felt that all their vendors shared the samegoals, while close to one-third (30.8 percent) noted that some did (see Figure9-6). Interestingly, the percentage of respondents who noted that onlytheir strategic suppliers (10.6 percent) shared the same market goals wasnearly the same as those who noted that their suppliers did not share similargoals (11.5 percent). Although a strong majority of the sample seems toshare similar market goals, as with improvement in plarmed sharing ofinformation and trust, companies for which the VoC process is still evolvingmay also increase their levels of shared goals.iFigure 9-6Vendors' and Respondents' Shared CoalsDo Not Know Never Thought about It (5.7%)Yes, with Strategic Vendors (10Source: Dataquest (November 1997)SSPS-WW-UW-9701 ©1997 Dataquest Decembers, 1997
I»Chapter 10Teamwork: Supplier and Buyer Joint ApprovalJoint Qualification: Yes or NoThe concept of having buyer and seller on the same side with similar goalsand benchmarks may strike many as odd at best or collusive at worst.When both semiconductor customer and vendor know each other's technologyroad maps and planned market focus, many of the problemsinvolving new product development, phasing products in or out, andcompetitive pricing are solved proactively rather than reactively. This canprovide the semiconductor user with a time-to-market or technology edgeover the competition.A key part of semiconductor suppliers and users working as a team is thejoint qualification of devices used. Dataquest asked the sample whetherthey jointly qualified or approved semiconductors with their vendors. Figure10-1 shows that more; than half (59.6 percent) of the respondents eitherjointly qualified all devices (25.9 percent) or at least jointly qualified critical,selected devices (33.7 percent). At one end of the spectrum, close toone-third (30.8 percent) of the respondents qualified all devices used internally,while at the other end, a small fraction (3.8 percent) had their suppliersqualify all products. The relatively high percentage of jointly qualifiedparts (especially for the selected parts) highlights the importance of thispractice to the respondents. Companies that internally qualify all theirparts are (with a few exceptions) generally smaller and may not have theresources yet in place to complete joint qualification procedures.Some semiconductor devices are more likely to be jointly qualified thanothers, because of the level of customization required, such as specialtesting.Figure 10-1Semiconductor Joint Qualification—Vendors and RespondentsNo, Qualification Done —•by Another Company or Division(1.0%)No, Vendors Qualify All Devices(3.8%)Others (1.0%Do Not Know/Refuse (3.8%)ISource: Dataquest (November 1997)SSPS-WW-UW-9701 ©1997 Dataquest 47
• '• : ; - - : • :• • • • • - • •: • • : ' • ' : • :48 Semiconductor Supply and Pricing WorldwideWhich Device FamiliesDataquest asked those that did jointly qualify parts which parts familieswere included in the process. As shown in Figure 10-2, the averages byproduct family ranged from a low^ of 23.7 percent for optoelectronicdevices and DSPs to a high of 39.5 percent for compute microprocessors(that is, Pentiums, K6s, and PowerPCs, among others). The devices thathave the higher (31 percent and up) rates of joint qualification are partsthat, with the exception of flash memory, require some level of supplierassistance because of the customized nature of the product (such as microprocessorsor specialized speeds and configurations of memory). It isinteresting to note that, traditionally, customized microcontrollers anddigital signal processing (DSP) chips are not ranked higher in the jointqualification process. The commodity optoelectronic devices and programmablememory parts (flash and EEPROM) are usually jointly qualifiedas new generations are developed and released.Figu] re 10-2Jointly Qualified Devices—Level of ParticipationPercent40-35-30-25-20-15-10-5-•;:*-^i:;«l%m.y%, ^;^:iiS^^i:•,•••;••..•..••,.••• ^ » > - • - ' • > •ii:^:i'^:|Ir^^ ^• ; ; ; ; • . . ; ;..uiMRUs1DRAM1 1EPROM PLDs: • :". y- '1 1SRAMI--?-:•: -J>'. -v•;>•.•.•-!'--•••..•Flashs.s. . . .• • • • • • • ^ ^J • •••••;•;..••Jv/:•••;•s!^; :••;.:1 — 1 —EEPROMl-fi'v-Controllers..••.-••-••v..-ii.•••..•v..-v-i1I 1Optoelec- DSPs1tronice97B36I1ISource: Dataquest (November 1997)iSSPS-WW-UW-9701 ©1997 Dataquest Decembers, 1997
Teamwork: Supplier and Buyer Joint Approval 49'IIf Not Now, What about the Future?Dataquest asked the respondents that currently do not jointly qualifysemiconductors whether they were planning on doing so within the nextyear. Figure 10-3 shows that close to two-thirds (64.5 percent) of those notjointly qualifying will begin the process during 1998. The majority of thecompanies expecting to begin the joint qualification process are the largercompanies with semiconductor piirchase levels of over $10 million. Therest of the companies, which expect to continue to qualify parts on theirown, appear to be in niche markets where customer-spedfic requirementsat the hardware level are not critical.Figure 10-3Plans for Joint QualificationNo(35.5%)Yes 1(64.5%) f978365Source: Dataquest (November 1997)ISSPS-WW-UW-9701 ©1997 Dataquest Decembers, 1997
Chapter 11Roundup: Conclusions and ComparisonsThe buyers surveyed account for about 15 percent of total North Americansemiconductor spending, based on Dataquest's revenue results for 1996.The companies surveyed reinged from small companies to huge organizations,and they were split among data processing (50 percent), communications(25 percent), and others (25 percent). This split more or less alignedthe survey respondents with Dataquest's consumption by applicationarea. Thus, the findings of the report are fairly representative of the viewsand feelings of the North American buying community.It was found that few buyers maintain actual inventory levels lower thantheir targets. The vast majority of buyers were running with inventory levelseither at or above their target. So, clearly, any help that vendors cangive to users on this front would be much appreciated!Importance versus satisfaction ratings always unearth interesting findings,and the users in this survey certainly were not shy. Although mostvendors did not exceed expectations, the buyers all ranked their vendorsabove 3 on a scale of 5. However, there is plenty of work to be done; theusers have high standards and do not like to be disappointed. Also, giventhe current excess of semiconductor capacity, the vendors that performbest will be kept. Those who do not will be discarded like yesterday'snewspapers.Much is said about total cost of ownership. Although buyers clearly wantthe best overall deal for their companies, only half of those surveyedadmitted that they actually measure TCO formally. However, the importanceand satisfaction section showed that this was an area in which buyerswanted more from their vendors.Likewise, questions about distribution and spot market channels assources of supply yielded some interesting results. Charting the range ofprocurement spending through distribution showed that the resultsformed an inverse bell curve, with one-quarter of participants using it for0 to 10 percent of total spending and another quarter using it for 90 to100 percent of their requirements. Only 53 percent admitted to using thespot market to obtain product. The most popular device bought in the spotmarket was PLDs, with DRAM coming close behind. Only 3 percent of allrespondents used the spot market as a channel when it was less expensivethan contract pricing. This probably explains why a DRAM surplusremains in the spot market.The survey revealed some interesting information on the current vendorbase size and how it has evolved from 1996 and is plarmed to change in1998. Even more interesting, it was impressive that 96 percent of respondentshad some strategic vendors or had only strategic vendors. Thiswould indicate a high level of professionalism and sophistication in thebuyers surveyed.SSPS-WW-UW-9701 ©1997Dataquest 51
52 Semiconductor Supply and Pricing WorldwideVendor-of-choice programs or other forms of vendor measurement wereused by well over half of the respondents. Of those who use them, halfmeasured all vendors, and half measured only strategic vendors. Measurementwas usually conducted monthly, quarterly, or semiannually.IDataquest discovered that 90 percent of those who conduct VoC programsshare the findings with their vendors. However, only half shared findingsopenly with all suppliers, with 40 percent sharing them only with strategicsuppliers.Questions about trust between users and vendors showed that only onethirdof the sample trusted all their vendors, one-quarter trusted only strategicvendors, and another one-quarter had boundaries for trust. Keepthose communication channels open, vendors! It was also discovered thatabout 60 percent of the respondents jointly qualify all or some semiconductorswith their vendors—an example of practical trust.4iSSPS-WW-UW-9701 ©1997 Dataquest December 8,1997
iIDataquestA Gartner Group CompanyFor More Information...Evelyn Cronin, Senior Industry Analyst (408) 468-8075Internet addressevelyn.cronin@dataquest.comVia fax (408) 954-1780Dataquest Interactive http://wfww?.dataquest.com ^|The content of this report represents our interpretation and aralysis of information generally available to the publicor released by responsible individuals in the subject companies, but is not guaranteed as to accuracy or completeness.It does not contain material provided to us in confidence by our clients. Reproduction or disclosure in whole or inpart to other parties shall be made upon the written and express consent of Dataquest.©1997 Dataquest—Reproduction ProhibitedDataquest is a registered trademark of A.C. Nielsen Company^^H
DATAQUEST WORLDWIDE OFFICESINORTH AMERICAWorldwide Headquarters251 River Oaks ParkwaySan Jose, California 95134-1913United StatesPhone: 1-408-468-8000Facsimile: 1-408-954-1780EUROPEEuropean HeadquartersTamesis, The GlantyEgham, Surrey TW20 9AWUnited KingdomPhone: +44 1784 431 611Facsimile: +44 1784 488 980ASIA/PACIFICAsia/Pacific HeadquartersSuite 5904-7, Central Plaza18 Harbour Road, WanchaiHong KongPhone: 852-2824-6168Facsimile: 852-2824-6138East Coast Research CenterNine Technology DrivePO. Box 5093Westborough, Massachusetts 01581-5093United StatesPhone: 1-508-871-5555Facsimile: 1-508-871-6262Dataquest Global Events3990 Westerly Place, Suite 100Newport Beach, California 92660United StatesPhone: 1-714-476-9117Facsimile: 1-714-476-9969Dataquest FranceImmeuble Defense Bergeres345, avenue Georges ClemenceauTSA 4000292882 - Nanterre CTC Cedex 9FrancePhone: +33 1 41 35 13 00Facsimile: +33 1 41 35 13 13Dataquest GermanyMartin-KoUar-Strasse 15D-81829 MiinchenGermanyPhone: +49 89 42 70 4-0Facsimile: +49 89 42 70 4-270Dataquest KoreaSuite 2407, Trade Tower159 Samsung-dong, Kangnam-guSeoul 135-729KoreaPhone: 822-551-1331Facsimile: 822-551-1330Dataquest TaiwanllF-2, No. 188, Section 5Nan King East RoadTaipeiTaiwan, R.O.C.Phone: 8862-756-0389Facsimile: 8862-756-2663IJAPANJapan HeadquartersAobadai Hills 4-7-7AobadaiMeguro-ku, Tokyo 153JapanPhone: 81-3-3481-3670Facsimile: 81-3-3481-3644Dataquest Singapore105 Cecil Street#06-01/02 The OctagonSingapore 069534Phone: 65-227-1213Facsimile: 65-227-4607Dataquest Thailand12/F, Vanissa Building29 Soi ChidlomPloenchit RoadPatumwan, Bangkok 10330ThailandPhone: 662-655-0577Facsimile: 662-655-0576Dataquest Australia80 Alfred StreetMilsons Point NSW 2061AustraliaPhone: 61-2-9941-4860Facsimile: 61-2-9941-4868DataquestA Gartner Group Company©1997 Dataquest
•RLE COPY:MARIA VALENZUELA<strong>DataQuest</strong>PCB Market Trends: Slirinks Continueto Affect MarketFocus ReportProgram: Semiconductor Supply and Pricing WorldwideProduct Code: SSPS-WW-FR-9704Publication Date: August 4,1997Filing: Reports
PCB n/iarket Trends: Slirinks Continueto Affect n/larketFocus Report
PCB Market Trends: Shrinks Continue to Affect IVIarketTable of ContentsPage1. Executive Summary 12. Introduction 3Market Size 3Statement of Research Methodology 43. PCB Market Overview 7Top Public PCB Suppliers 7PCB Survey Mix versus Overall Market 7PCB SuppUers Used 8PCB Market Drivers 114. PCB Supply Choice Factors 13Forecasting PCB Needs 13Critical PCB User Issues 155. PCB Supply Base Issues 176. Prices per PCB Layer 21Methodology 21Buyers' Average PCB Costs 21Buyers' Mean Price per PCB Layer 24Suppliers' Average PCB Prices 25Suppliers' Mean Price per Layer 29Comparison of Buyers' and Suppliers' Mean Prices 297. Lead Hme Resvilts 31Buyers' Average Lead Times 31Buyers' Mean Lead limes per PCB Layer 34Suppliers' Average Lead limes 34Suppliers' Mean Lead limes per PCB Layer 38Comparison of Buyers' and Suppliers' Mean Lead Times 388. Premiums for Faster Lead Times and Effect on MeanPrice per Layer 41Buyers 41Suppliers 43Comparison 439. Summary and Conclusions 47Appendix A—PCB Suppliers Noted by User Sample 49SSPS-WW-FR-9704 ©1997 Dataqu est August 4,1997
List of FiguresSemiconductor Supply and Pricing WorldwideFigurePage2-1 Worldwide Regional PCB Production, 1996 32-2 Worldwide PCB Market Forecast, 1996 to 2000 42-3 Survey Demographics—End-Product Application (N = 82) 52-4 Regional Location of PCB User Sites 63-1 Survey Demographics: User and Supplier Spending andSales, 1997 (N = 79) 83-2 PCB Supplier Use: Protot3rpe Supplier 93-3 PCB Supplier Use: Large OEM's Internal Supply (N = 82) 93-4 PCB Supplier Use: Contract Manufacturer 103-5 PCB External Design Use 114-1 Long-Term Forecasting of PCB Demand 144-2 Long-Term PCB Forecast Windows 144-3 PCB User Issues: Importance of Issue and UserSatisfaction (N = 82) 155-1 PCB Supply Base (N = 78) 185-2 PCB Supplier Performance Measurement (N = 82) 185-3 Frequency of Measuring PCB Supplier Performance (N = 74) 195-4 PCB Supplier Review Impact (N = 75) 196-1 Buyers' Average PCB Price for Two-Layer PCBs 226-2 Buyers' Average PCB Price for Four-Layer PCBs 226-3 Buyers' Average PCB Price for Six-Layer PCBs 236-4 Buyers' Average PCB Price for Eight-Layer PCBs 236-5 Buyers' Mean Price per Layer 246-6 Suppliers' Average PCB Price for Two-Layer PCBs 256-7 Suppliers' Average PCB Price for Four-Layer PCBs 266-8 Suppliers' Average PCB Price for Six-Layer PCBs 266-9 Suppliers' Average PCB Price for Eight-Layer PCBs 276-10 Suppliers' Average PCB Price for 10-Layer PCBs 276-11 Suppliers' Mean Price per Layer 287-1 Buyers' Average Lead Times for Two-Layer PCBs 327-2 Buyers' Average Lead Times for Four-Layer PCBs 327-3 Buyers' Average Lead Times for Six-Layer PCBs 337-4 Buyers' Average Lead Times for Eight-Layer PCBs 337-5 Buyers' Mean Lead lime per PCB Layer 357-6 Suppliers' Average Lead Times for Two-Layer PCBs 357-7 Suppliers' Average Lead Times for Four-Layer PCBs 367-8 Suppliers' Average Lead Times for Six-Layer PCBs 367-9 Suppliers' Average Lead Times for Eight-Layer PCBs 377-10 Suppliers' Average Lead Times for 10-Layer PCBs 377-11 Suppliers' Average Lead Times for 12-Layer PCBs 387-12 Suppliers' Mean Lead Times per PCB Layer 398-1 Willingness of Buyers to Pay Extra for a Quicker OrderTurnaround 428-2 Average Premiums for Faster Turnaround Buyers Would Pay 428-3 Suppliers Whose Customers Willingly Pay Extra for aQuicker Turnaround 448-4 Average Premiums for Faster Turnaround ThatSuppliers' Customers (Buyers) Pay 44SSPS-WW-FR-9704 ©1997 Dataquest August 4,1997
PCB Market Trends: Shrinks Continue to Affect IVIarketiiiList of TablesTablePage3-1 Top Eight Public PCB Companies 76-1 Comparison of Mean Price per Layer for Buyers and Suppliers.... 307-1 Comparison of the Mean PCB Lead Times from Buyersand Suppliers 398-1 Buyers' Mean Price per Layer for Mean Lead Timesand Premium Required for Quick Turnaround Orders 438-2 Suppliers' Mean Price per Layer for Mean Lead Timesand Premium Required for Quick-Tumaroimd Orders 45SSPS-WW-FR-9704 ©1997Dataquest August 4,1997
Chapter 1Executive SummaryThe printed circuit board (PCB) market remains in flux after a dramaticconsolidation period from the late 1980s to 1996. The recent turmoil in thesemiconductor industry pales in comparison with the fallout rate in thePCB industry. The continued impact of increasing capital costs, environmentalregulations, and worldwide competition has forced improved efficienciesthat still shape the survivors of tixe recent market shakeout. Citingindustry data from the Institute for Interconnecting and Packaging ElectronicCircuits (IPC), this report gives a brief overview of the PCB marketand reviews PCB user issues. Based on Dataquest's latest survey of over1,000 calls to more than 400 PCB suppliers and users, this report goes intodetail regarding critical user issues and their satisfaction levels, supplierchoice criteria, forecast trends, costs, and lead time issues. It can be used inPCB benchmarking programs by both users and suppliers toward the goalof a better-served market. An example of the top three criteria used byusers in choosing a PCB supplier are:• Facility• Cost savings• EquipmentSome of the other key findings of the report involving quality levels andsupplier flexibility buck current thinking and should serve notice to suppliersof what their customers are now demanding. Tactical benchmarkdata and analysis regarding PCB costs, average lead times for productionand quick turn jobs, as well as prototype price premiums combine withthe strategic analysis to form a solid guidebook on what is of current concernin the PCB world. An appendix of commendable PCB suppliers notedby the user respondents rounds out this report.Project Analysts: This report was -prepared hy Director and Principal AnalystMark Giudici and Senior Industry Analyst Evelyn Cronin (both of SemiconductorSupply and Pricing Worldmde). The survey was developed and programmedby Mei Ye (Research Operations).SSPS-WW-FR-9704©1997 Dalaqu est
Chapter 2IntroductionMarket SizeThe printed circuit board market remains in flux. Many of the issuesbrought out in Dataquest's survey of 103 PCB users and suppliersemphasize how the consolidation over the past five years or more hasaltered many of the parameters that go into sourdng PCB technology andsuppliers.As shown in Figure 2-1, the worldwide PCB market in 19% was$28 billion. North America has taken over as the largest single-regionproducer of PCBs (28 percent), followed closely by Japan (26 percent),then Western Europe (18 percent). The relatively large percentage of PCBscoming from the rest of the world (28 percent) includes Eastern Europe,Russia, Korea, Taiwan, China, and the rest of Asia. Figure 2-2 shows theestimated growth of this market. Although it will grow at an average7.6 percent over the next four years (1996 to 2000), the emergence of thebudding (but volatile) Asian supply base may well alter the current topsuppliers in the future.Figure 2-1Worldwide Regional PCB Production, 1996/ RestofWorid/ (28%)North America \(28%) 1\ Western /\ Europe /\ (18%) /Japan m(26%) M1996 Total Worldwide 1 >CB Sales = $28 Billion9^4790Source: IPCSSPS-WW-FR-9704©1997Dataquest
Semiconductor Supply and Pricing WorldwicfeFigure 2-2Worldwide PCB Market Forecast Growth = 7.6 Percent, 1996 to 2000Billions of Dollars40.0-37.51995974791Source: IPCStatement of Research MethodologyDataquest's 1997 PCB study contains the results of a telephone surveyconducted by Dataquest's Research Operations group. Tile survey questionnairewas developed by analysts from Dataquest's SemiconductorSupply and Pricing Worldwide program (SSPS) and comprising110 questions. On average, a respondent was asked to answer about55 questions because not all questions applied to each respondent. Trainedinterviewers conducted the survey using a computer-aided telephoneinterviewing (CATI) system. Research C^erations anal5^ts tabulated thesurvey results using the Siuvey Systems software package.Dataquest conducted the study during May 1997. We contactedrespondents based on a list of PCB buyers published by the researchcompany Printed Circuit Directories and PCB vendors from the IPC listingof PCB assembly suppliers. The ninth edition of \Nho Buys Printed CircuitBoards in High Volume (February 1997) contains contact information on364 companies in 22 states with major electronics manufacturing. The IPCdatabase lists all IPC members that manufacture PCB boards.Dataquest placed a total of 1,037 calls to about 455 names from the twolists. The sample disposition is as follows:• 103 completed interviews• 208 unable to contact respondents, left message, or "others• 289 refused interview/wrong telephone number/did not qualify toparticipate in studySSPS-WW-FR-9704 ©1997 Dataquest August 4,1997
IntroductionThe application markets that the user respondents represent is slightlyskewed to the industrial/instrumentation/medical segment at theexpense of the computer and communications segments. Issues involvingquality, flexibility, and total cost of ownership, however, cut across applicationboundaries (see Figure 2-3). Figure 2-4 shows the regional makeupof the responding users, highlighting the continued vitality of the domesticmarket along with selected offshore plants. It is interesting to note thatthe third-ranked region in this sample is China.Figure 2-3Survey Demographics- -End-Product Application (N = 82)Military/Civil Aerospace (4.9%)Refused (2.4%)Data Processing (4.9%)Transportation (6.1%)Number of Responses = 82974792Source: Dataquest (June 1997)SSPS-WW-FR-9704 ©1997 Dataquest August 4,1997
Semiconductor Supply and Pricing WorldwideFigure 2-4Regional Location of PCB User SitesKorea (0.9%)—•, -— Rest of World (0.9%)Europe (0.9%) —^ i 1Mexico (1.8%) —.\\,Japan (3.5%) ^^-^rTTfTaiwan (4.4%) —jy\ \ \\\/China\ \ \\l|jQ6.1%) \ \ \ 1/ Canada ^^^^i]^(10.5%) ^_,--^United States m(71.0%) aNumber of Responses = 82974793Source: Dataquest (June 1997)SSPS-WW-FR-9704 ©1997 Dataquest August 4,1997
Chapter 3PCB Market OverviewTop Public PCB SuppliersThe PCB supply base has continued to contract since Dataquest did its lastsurvey of this market. In 1994, there were fewer than 900 worldwide PCBsuppliers. According to IPC estimates, there are sUghtiy more than 670PCB companies, of which fewer than 15 have sales of greater than $100million and more than 550 have sales of less than $10 million. As an indicationof the ongoing consolidation of this market, it is now estimated thatthe top eight merchant suppliers produce over 20 percent of North AmericanPCBs. (In 1994, the top 10 made over 20 percent of this market.)Table 3-1 shows the top publicly traded PCB suppHers with their 1996revenue. As can be seen in this Ust, the market consolidation trendimpacted both the largest and smallest, and both ends of the spectrummade acquisitions last year.Table 3-1Top Eight Public PCB CompaniesCompanyHadco (with Zycon)SanminaMerixAltronElexysPraegitzerContinental CircuitsTyco (with ElectroStar)SubtotalOthersTotalSource: Dataquest (June 1997)PCB Survey Mix versus Overall Market1996 Revenue ($M)594302171165135119107711,6646,1347,800North AmericanMarket (%)7.63.91.12.11.71.51.40.921.378.7100.0The types of PCB suppliers noted as supporting the users in our surveycompare well with the specialty boards required by the industrial segment.Figure 3-1 shows tiie broad makeup of the survey respondents, witha mix of smaller and large users and a like mix of small, medium-size, andlarge suppliers. This sample represents many of the companies that havesurvived consolidation and, alttiough smaller, still highlight the needs andofferings of a vital segment of the industry.SSPS-WW-FR-9704©1997 Dataquest
Semiconductor Supply and Pricing WorldwideFigure 3-1Survey Demographics: User and Supplier Spending and Sales, 1997 (N = 79)$5 Million-$14.9 Milfion (2%)$15 Million-$100 Million (2%)$501,000-$1.5 Million (6%)$1.5 Million-$5 Million (7%)User Sample Total Spending = $162.4 MillionNsSOTotal Suppliers' Sales = $694 MillionN = 23974794Source: Dataquest (June 1997)Although some of the larger suppliers were noted, the majority of PCB vendorsused would fall into the "less than $10 million" category that makes upthe majority of the PCB supply base. Appendix A lists the PCB suppliersthat were noted by the user respondents for excellence in flexibility, quality,price, lead time, engineering support, and total cost of ownership,PCB Suppliers UsedThere are three main t57pes of PCB suppliers:• Prototype suppliers• Suppliers within large system OEM companies• Contract manufacturers of PCBsFigures 3-2,3-3, and 3-4 show how survey respondents use these three typesof suppliers and show what proportion use this type of supplier exclusively.Figure 3-2 shows that dose to half (45 percent) of the user sample usesquick-turn prototype PCB suppliers, yet only one respondent uses prototypesuppliers as an exclusive source of PCBs. Slightly less than half thesample (49 percent) has internal PCB manufacturing capability, as shown inFigure 3-3. Of these 40 companies, only 42.5 percent use their capacity to theexclusion of outside suppliers. Figure 3-4 shows that over half (51 percent)of the sample uses external PCB supplier s or contract manufacturers, andclose to half of that half (47.6 percent) uses external suppliers exclusively.SSPS-WW-FR-9704 ©1997 Dataquest August 4,1997
PCB Market OverviewFigure 3-2PCB Supplier Use: Prototype SupplierUse Prototype Suppliers Exclusively (2.7%)Total Users = 82 Number Using Prototype Suppliers = 37Source: Dataquest (June 1997)Figure 3-3PCB Supplier Use: Large OEM's Internal Supply (N = 82)Total Users = 82 Number Using Internal Capability = 4097*7^Source: Dataquest (June 1997)SSPS-WW-FR-9704 ©1997 Dataquest August 4,1997
10 Semiconductor Supply and Pricing WorldwideFigure 3-4PCB Supplier Use: Contract ManufacturerSource: Dataquest (June 1997)Total Users = 82 Number Using PCB Contract Manufacturers = 42974797Quick-turn prototjrpe PCB suppliers often are used by companies withinternal capability because of the flexibility and turnaround times thatthese suppliers provide. Of companitjs that have internal PCB manufacturing,those that also use external suppliers often take advantage of newerequipment outside or use external suppliers to maintain older PCBdesigns that underutiLize internal equipment. The large number of usersthat use outside suppliers only fits the trend of outsourcing manufacturingbecause of high capital equipment costs and shrinking system life cycles.Because many companies in the user sample are small to medium-size, theoutlay needed for PCB manufacturing equipment generally can be usedmore efficiently in other critical areas.The outsourcing of PCB design was also investigated. Figure 3-5 showsthat dose to a third (29.3 percent) use outside designers, and of those,29 percent use outside designers exclusively. Although use of externaldesigners often allows flexibility and access to state-of-the-art technology,continued extensive use has the potential of diluting the viability of theoutsourced companySSPS-WW-FR-9704 ©1997 Dataquest August 4,1997
PCB Market Overview 11Figure 3-5PCB External Design UseUser \External \Designers \(29.3%) 1/ 1-14%/ External/ Designer Use7 (29.2%)100% \External 1Designer Use(29.2%)i Do Not Use ^^-^^^ 1\ External Designers '~-~~~m\ (70.7%) mV 15-34%\ External\ Designer Use\ (20.8%)35-99% ^ ^External iDesigner Use M(20.8%) ^N = 82N = 24974793Source: Dataquest (June 1997)PCB Market DriversThe North American electronics market was about $302 billion(35.5 percent) of the $850 billion 1996 worldwide electrorucs market. NorthAmerica's predominant equipment markets are computers, telecommunicationsequipment (wired and wireless), and data storage devices. All ofthese markets are driven by the currently strong industrial economy.Steady and sustainable growth in the United States and other regions ofthe world should keep this area of demand strong. The second-largest areaof dem.and is for automotive and digital consumer electronics, which is apotentially large market driven by the volatile mix of consumer confidenceand interest rates. The slowest-growth area of electronics is the military/aerospacemarket. This m.arket continues to slowly shrink or remainstatic as high-technology defense budgets around the world stabilize ordedine in the absence of the Cold War.Because the U.S. market is heavily weighted toward computer and communicationsmarkets, where multilayer PCBs predominate, this segmentof the market wiQ continue to show steady increases in demand whilehigher-volume, siagle- or double-layer PCBs from Asia that go into consumerproducts will remain somewhat dependent on the fickle taste ofconsumers and on the interest rates that influence disposable incomelevels.SSPS-WW-FR-9704 ©1997 Dataquest August 4,1997
Chapter 4PCB Supply Choice FactorsForecasting PCB NeedsIn choosing an external PCB supplier, many factors are taken into accountby potential customers. The raiik order of PCB supplier choice criteria forthe 38 users of external suppliers (90 percent) that responded is as follows:• Facility• Cost savings• Equipment• Volume• Quality• Prototype• ogistics management/lead time• Design tools/geographic location• OtiiersThese findings reinforce the notion that PCB users need facilities that arecost-effective and have equipment that provides technological advantagesover in-house capacity. Although they are listed, the issues of quality, prototypeturnaround, and logistics support and supplier location are secondaryto having access to affordable, state-of-the-art facilities.Forecasting for a critical component such as PCBs would seem automatic,but as seen in Figure 4-1, the user sample was evenly split between thosethat do formally forecast and those that do not. It is possible that the49 percent that do not forecast may be the same 40 companies that haveinternal PCB manufacturing capability, so that sales may forecast system,and therefore PCB, demand of the factory. The level of forecast activitycorrelates well with the size of the respondent company (that is, the largerthe company, the higher the likelihood of forecasting activity). When thesame question was asked of the manufacturers in the survey, theyreported that a solid 56.5 percent of their customers did forecast. What isof concern is the relatively high percentage (43.5 percent) of customers andthe potential number of users that do not forecast their demand levels.For users that do forecast their needs, the forecast window ranges fromone to over 18 months, as seen in Figure 4-2, with an average forecastwindow of 3.3 months. PCB mantifactvu-ers noted a forecast window rangebetween one and six months, with an average of 3.5 months, similar to theuser response. Of the users not currently forecasting their needs. Figure4-2 shows that only 17 percent plan on forecasting in 1998. The remaining34 companies that will not forecast may well be those compaiues withinternal PCB capacity that have other departments forecasting PCB needs.SSPS-WW-FR-9704 ©1997Dataquest 13
14 Semiconductor Supply and Pricing WorldwideFigiire 4-1Long-Term Forecasting of PCB Demand-Do Not Know/Refused (2.4%)Source: Dataquest (June 1997)Users That Forecast = 82 Manufacturers' Customers That Forecast = 23Figure 4-2Long-Term PCB Forecast Windows97479918+Months (2.5%)—:,1 12-17.9 \1 Months I/ (30.0%) \O^S'-y.^Months/ \,,^[7.S%y \3-5.9Months(27.5%)Do Not Know/Refused (2-3%) ~^___^NotNowNvForecasting, N.but Plan XForecasting ^ \in 1998 ^y^ \(le.T^K"^ \'V^'^/'^ 6-8.9\ j ^ Months''\. (30.0%M \ Not Now Forecasting, Mm \ and Do Not Plan Mw \ Forecasting in 1998 Wf \ (81.0%) M9-11.9 Months (2.5%)Number Forecs sting Needs = 40Source: Dataquest (June 1997)Number Forecasting Needs = 23974800SSPS-WW-FR-9704 ©1997 Dataquest August 4,1997
PCB Supply Choice Factors 15Critical PCB User IssuesFigure 4-3 is a satisfaction gap analysis of the most critical issues facingcustomers of PCB suppliers and how well their suppliers are meetingthese ranked issues. Dataquest asked users on a scale of one (low) to five(high) what they deemed important and, on the sam.e scale, how happythey were with their suppliers on that issue. The graph lists the highestrankedissue (quality) and goes in a clockwise direction to the next-highest-rankedissue (total cost of ownership), and so on. Once ranked in orderof importance, these criteria were then scrutinized for how well suppliersmet these needs. The four top issues (quality = 4.9, total cost of ownership= 4.4, flexibility = 4.3, and price = 4.2) show very small gaps between levelof importance and how well suppliers meet their customers' needs. Thelast two ranked issues, lead time = 4.0 and engineering support = 3.7,actually have levels of satisfaction higher than the deemed level ofimportance.Figure 4-3PCB User Issues: Importance of Issue and User Satisfaction (N = 82)Quality—•Importance1 SatisfactionEngineering Support 21 Total Cost of Ownership^ 2-Lead Time ^^FlexibilityPri ce974S01Note: 1 = low, 5 = highSource: Dataquest (June 1997)SSPS-WW-FR-9704 ©1997 Dataquest August 4,1997
16 Semiconductor Supply and Pricing WorldwideUsers still deem quality to be the top issue, yet improvement stiU needs tobe made (importance = 4.9, satisfaction = 4.6). The issue of total cost ofownership actually includes all of the issues listed is rartked second andalso has some way to go (importance = 4.4, satisfaction = 4.3) to fuUy meetcustomer needs. The ranked issues of flexibility, price, and lead time aUhave a "satisfaction gap" of one or less, indicating that suppliers are doinga good job in meeting customer needs, with only small improvementsneeded, if any. The last-ranked issue, engineering support (importance =3.7), has a satisfaction rating of 4.2, indicating that suppliers are farexceeding customer needs and could possibly scale back in this area andput more emphasis on quality or total cost of ownership. It appears that,while there is some room for improvement, most users in this study arerelatively satisfied with their PCB supply base.SSPS-WW-FR-9704 ©1997 Dataquest August 4,1997
Chapter 5PCB Supply Base IssuesThe number of suppliers of a given product often affects the level of quality,cost, and support involved with that product. The number of PCB suppliersthat respondents in this study have ranges from one to 12 suppliers.Figure 5-1 highlights that the majority of the sample have under six suppliersand in 1997 averaged 4.0 suppliers. The outlook for next year notes aslight increase in the number of suppliers, with an average of 4.3. Theusers that currently have four to six suppliers wiU expand their supplybase of PCB suppliers. Supplier reduction programs have passed tiu-oughmost companies and reduced costs and sim.plified sourcing logistics, butson\e users with an above-average number of suppliers plan on increasingtheir supply base, possibly in an effort to improve quality or lower totalcost of ownership. For those using imder the average number of suppliers,all but one wiU leave their supply base unchanged. This indicates that themajority of users has made the dramatic supplier reductions that contributedthe contraction of the market. Although this is a small sample, wemay now be seeing the begirming of a stabilization in the number of PCBcompaiues.Periodic review of a supply base to ensure how well the supplier meetscustomer needs has become more and more common. Figure 5-2 showsthat over 80 percent of Dataquest's survey respondents perform regularPCB supplier reviews. Of those that currently do not, dose to half plan onimplementing a program next year. In line with the supply base managementnoted, a regular review of suppliers ensures that a customer'srequirements and a supplier's offerings match. How often companies performreviews generally tracks with the products the PCBs go into. Productswith short life cycles have more frequent review cycles, and productswith longer life cycles may have longer periods between review. Figure 5-3 shows that over half of the users either have nionthly or quarterly supplierreviews. The 23 percent with review periods different from nionthly,quarterly, or annually report review periods ranging from biw^eekly to 18months.The reason most companies perform supplier reviews is to influence theirsupply base to meet their needs better. Figure 5-4 shows that the vastmajority (84 percent) of respondents said that supplier review affects currentbusiness levels; that is, if needs are met, the business relationship ismaintained. Only 15 percent note that levels of business are not affectedby supplier reviews. A like percentage of users (86 percent) notes thatfuture levels of business are affected by supplier review programs. Forexample, customers generally will change suppliers after a period of supplierreview if improvements identified as needed have not been made.Although the number of PCB suppliers appears to be stabilizing for thissample, the overall PCB market will remain in the throes of worldwidecompetition. As noted earlier, geographic location was not a top prioritywhen determining a PCB supplier. If offshore suppliers can successfullymeet customer needs for quality, total cost of ownership, and flexibility,there may be further change in the number of PCB suppliers and in theirlevel of regional support.SSPS-WW-FR-9704 ©1997Dataquest 17
18 Semiconductor Supply and Pricing WorldwideFigure 5-1PCB Supply Base (N = 78)12+Suppliers (3%)7-12 Suppliers (6%)12+Suppliers (3%)7-12 Suppliers (9%) —^1997 Average = 4.0 SuppliersN = 781998 Forecast Average = 4.3 SuppliersN = 78Source: Dataquest (June 1997)Figure 5-2PCB Supplier Performance Measurement (N = 82)Do Not Measure PCB Supplier Performance (16%)i— Do Not Know/Refused (1%)N = 82 N = 13Source: Dataquest (June 1997)SSPS-WW-FR-9704 ©1997 Dataquest August 4,1997
PCB Supply Base Issues 19Figure 5-3Frequency of Measuring PCB Supplier Performance (N = 74)N = 74Source: Dataquest (June 1997)Figure 5-4PCB Supplier Review Impact (N = 75)Do Not Affect Current Business Levels (15%) v— Do Not Affect Future Business Decisions (13%)Do Not Know/Refused (1 %) \ j — Do Not Know/Refused (1 %)Do Supplier Measurements AffectCurrent Business Levels?N = 75Do Supplier Measurements AffectFuture Business Decisions?N = 75Source: Dataquest (June 1997)SSPS-WW-FR-9704 ©1997 Dataquest August 4,1997
Chapter 6Prices per PCB LayerThis chapter looks at the average prices or costs per layer of PCBs as disclosedby the survey participants. As both the users (buyers) and manufacturers(suppliers) were both asked the same question, this chapter hasbeen split into three sections:• Buyers' PCB prices• Suppliers' PCB prices• Com.parison of buyers' and suppliers' PCB pricesDataquest obtained information on the average costs per layers from eachgroup and then calculated the mean cost per layer for both buyers andsuppliers.MethodologyThe survey mix was largely composed of industrial and military applications.However, for the purpose of the data on average cost per layer,Dataquest looked only at norunilitary applications participants.Buyers' Average PCB CostsAlso, because many companies view pricing as a key component in thesuccess of their organization, many were reluctant to release this informationto Dataquest. Thus, in some cases, the sample size may be too small,and Dataquest will not have a value for it. This is true mainly for thehigher-layer boards.Dataquest asked survey participants to estimate the average price or costof the different layers of PCB in square inches. This was done because thePCBs procured or manufactured were not a standard size. It would makeno sense to compare average board prices—some boards could be 1 inch x4 inches, with others 144 inches x 144 inches and still be four-layer boards!Board complexity could not be factored. Each application has its owndesign requirentents and PCB functionality and complexity requirements.This factor explains why the range of average cost per PCB layer variesgreatly from participant to participant.Dataquest asked the PCB buyers to estimate their average cost per squareinch per PCB layer. Cost is defined as the buyer's price from the supplieror internal division. It does not refer to the total cost of ownership of thePCB.Figures 6-1 to 6-4 have classified the actual price given by the participatingbuyers into ranges. Please note that the buyers gave their own numericvalue for their average price per layer. The range is used only to show howthese average prices are clustered. These ranges were then graphed. However,to calculate the overall mean price per layer, Dataquest used theactual average price given by each supplier.SSPS-WW-FR-9704 ©1997 Dataquest 21
22 Semiconductor Supply and Pricifig WorldwideFigure 6-1Buyers' Average PCB Price for Two-Layer PCBsSource: Dataquest (June 1997)974806Figure 6-2Buyers' Average PCB Price for Four^Layer PCBs974807Source: Dataquest (June 1997)SSPS-WW-FR-9704 ©1997 Dataquest August 4,1997
Prices per PCB Layer 23Figure 6-3Buyers' Average PCB Price for Six-Layer PCBswiAsaaSource: Oataquest (June 1997)Figure 6-4Buyers' Average PCB Price for Eight-Layer PCBs974S09Source: Oataquest (June 1997)SSPS-WW-FR-9704 ©1997 Oataquest August 4,1997
24 Semiconductor Suppiyand Pricing WorldwideBuyers' Mean Price per PCB LayerFigure 6-5Buyers' Mean Price per LayerFigure 6-1 shows the average price per layer for each respondent in thebuyers group for two-layer PCBs. The average cost per square inch rangedfrom $0.10 to $0.80. This range is extremely large and would indicate that asizable number use very highly integrated and complex two-layer boards.Figure 6-2 shows the range of average prices per square inch for four-layerboards among the participating buyers. It can be seen that this price rangeis from $0.14 to $0.60 per square inch.The range of average prices among the buyers who responded was froni$0.18 to $0.80 per square inch (see Figvire 6-3). At six layers, this range isaccounted for largely by the volume and complexity differences within thesample.The range of average prices shown in Figure 6-4 was from $0.21 to $0.81per square inch. This is a very large price range and reflects the variedcomplexities and volumes procured at eight-layer board densities. Eightlayerboards were not bought in large quantities by the majority of siirveyparticipants.The mean of the results for the buyer group was calculated. Figure 6-5shows the mean prices by PCB layer number for the buyers.Source: Dataquest (June 1997)SSPS-WW-FR-9704 ©1997 Dataquest August 4,1997
Prices per PCB Layer 25Suppliers' Average PCB PricesThe sample size was insufficient to calculate a mean value for boards ofgreater than eight layers among the buyers' sample. From Figure 6-5, it can,be seen that the average cost per square inch increases as the number ofPCB layers increases. This is to be expected.The two- and four-layer boards have mean costs in the same ballpark. Fortwo-layer boards, the mean cost for buyers is $0,311 per square inch, whilefor four-layer PCBs, the mean came out as $0,375 per square inch. Themean costs were $0,565 and $0,611 for the six- and eight-layer boards,respectively, from the buyer sample.The supplier or manufacturing category also gave their average cost. Here,the average cost or price refers to average sales price of the board to thesupplier's customers in cents per square inch. It does not refer to the costto manufacture the PCBs.Figures 6-6 through 6-11 have classified the actual price given by the participantsinto ranges. Please note that participants gave tiieir own numericvalue for their average price per layer. The range is used only to show howthese average prices are clustered. These ranges were then graphed. However,to calculate the overall mean price per layer, Dataquest used theactual average price given by each supplier.Figure 6-6Suppliers' Average PCB Price for Two-Layer PCBs974811Source: Dataquest (June 1997)SSPS-WW-FR-9704 ©1997 Dataquest August 4,1997
26 Semiconductor Supply and Pricing WorldwideFigure 6-7Suppliers' Average PCB Price for Four-Layer PCBsSource: Dataquest (June 1997)Figure 6-8Suppliers' Average PCB Price for Six-Layer PCBs1 $0.60-$1.151 per Square Inch$0.36-$0.38 \per Square Inch %(28.6%) 1t
Prices per PCB Layer 27Figure 6-9Suppliers' Average PCB Price for Eight-Layer PCBs/ $0.76-$1.00/ per Square Inch/ ^ (20%)$0.47-$0.50 \per Square Inch 1(40%) 1\ $0.51-$0.75\ per Square Inch \ fV (40%)97481.»Source: Dataquest (June 1997)Figure 6-10Suppliers' Average PCB Price for 10-Layer PCBs/ $0.63-$0.921 per Square Inch1 (50%)$0.60-$0.62 1per Square Inch 1(50%) 1s?
28 Semiconductor Supply and Pricing WorldwideFigure 6-11Suppliers' Mean Price per LayerMean Price per Layer (Cents per Square Inch)80-rt60402-Layer 4-Layer 6-Layer 8-Layer 10-Layer 12-Layer974816Source: Dataquest (June 1997)From Figure 6-6, it can be seen that the average sales price in cents persquare inch for two-layer PCBs ranges from $0.12 to $0.50 per square inch.This is based on the data received by Dataquest from the suppliers.Figure 6-7 shows the range of average sales price from suppliers to customersfor four-layer PCBs. The average price ranged from $0.20 to $0.85per square inch, based on the suppliers' inputs.Figure 6-8 shows that there was quite a range of average prices reportedby the suppliers sampled. These average prices ranged from $0.36 to $1.15per square inch for six-layer boards.The average prices for eight-layer boards as reported by the supplierssampled is shown in Figure 6-9. The average sales prices ranged from$0.47 to $1.00 per square inch.Figure 6-10 shows the range of average prices for 10-layer boeirds. Fromthe data it can be seen that the range of averages was $0.60 to $0.92 persquare inch.The highest density reported by survey participants was 12-layer PCBs.Here, 100 percent of the respondents reported an average sales price of$0.80 per square inch.SSPS-WW-FR-9704 ©1997 Dataquest August 4,1997
Prices per PCB Layer 29Suppliers' Mean Price per LayerDataquest calculated the mean price per layer based on the inputs fromthe supplier sample (see Figure 6-11).There is a significant different between the two- and four-layer meanprices per square inch. This is no doubt a reflection of the customer base orof demand seen by the manufacturers. The mean price for six-layer boardswas $0.57 per square inch. Mean prices for the eight- and 10-layer boardswere both in the same range—$0,674 and $0,698 per square inch, respectively.Twelve-layer boards had a mean price of $0.80 per square inch.Comparison of Buyers' and Suppliers' Mean PricesTable 6-1 compares the mean prices per layer for the buyers and supplierssurveyed. The data in the table is based on the mean price per layer forbuyers and suppliers graphed in Figures 6-5 and 6-11. The table alsoshows the difference between the results of the buyers and suppliers foreach layer's mean price.As the number of layers increases, there is usually greater functionalityincorporated into the overall PCB. The required greater detail and theadditional layers of plastic and metal mean that costs wUl be higher as thenumber of layers increases. Thus it would be expected that the price persquare inch would increase as the number of PCB layers increases. This isdearly the result seen from both buyers' and suppliers' responses.It can be seen that the biggest difference between the mean prices of buyersand suppliers was at two-layer PCBs. The mean cost reported by buyerswas nearly $0.10 per square inch more ihan that reported by suppliers.This is because buyers reported a range of cost per square for two-layerboards inch from $0.10 to $0.80. However, for suppliers, the range was$0.12 to $0.50 per square inch. These responses explain why the buyershad a higher mean price than the suppliers surveyed.For four-layer boards, the mean prices were $0,375 and $0.34 per squareinch for buyers and suppliers, respectively. This gives a difference of$0,035 per square inch, which is very little. The six-layer mean costs werealmost identical—$0,565 and $0.57 per square inch for buyers and suppliers,respectively, giving a difference of 0.5. Also, the results for eight-layerPCBs were quite close ($0,611 per square inch for buyers and $0,674 forsuppliers), with the difference being a mere $0,063.Because there was insufficient data from buyers to calculate the meanprice per square inch for densities above eight layers, it is not possible todirectiy compare the buyer and supplier data. It has to be taken at facevalue. The mean prices per square inch given for 10- and 12-layer PCBswere $0,698 and $0.80 per square inch.SSPS-WW-FR-9704 ©1997 Dataquest August 4,1997
30 Semiconductor Supply and Pricing WorldwideTable 6-1Comparison of Mean Price per Layer for Buyers and Suppliers (Cents per Square Inch)Two-Layer PCBFotir-Layer PCBSix-Layer PCBEight-Layer PCB10-Layer PCB12-Layer PCBNA = Not availableSource: Dataquest (June 1997)Buyers' Mean Price per Layer31.137.556.561.1NANASuppliers' Mean Price per Layer21.334.057.067.469.880.0Difference9.83.50.56.3NANASSPS-WW-FR-9704 ©1997 Dataquest August 4,1997
Chapter 7Lead Time ResultsBuyers' Average Lead TimesThis chapter looks at the average lead times experienced by the surveyparticipants for different PCB layers. The survey participants were classifiedas suppliers or buyers (if both, the respondents were asked both thesupplier and buyer questions), and the lead time questions were asked ofboth categories of respondents.Thus, this chapter is broken into three sections for ease of analysis:• Buyers' average lead times• Suppliers' average lead times• Comparison of buyers' and suppliers' average lead timesPlease note that suppliers were asked to give the average lead time theyquote to their customers at each of the layers they produce. Buyers wereasked to give the average lead time they receive from their internal orexternal PCB suppliers.Figure 7-1 shows the range of average lead times experienced by buyers oftwo-layer boards. Here, tiie lower lead times were reported by nearly70 percent of the sample—one to three weeks and four to five weeks by28.1 percent and 40.2 percent, respectively. Over 7 percent of respondentshad average lead times of six to seven weeks, and just under 4 percent hadeight- to nine-week average lead times for two-layer boards. TTie remainingrespondents eitiier did not know or refused to answer (19.5 percent) orhad other lead times (1.2 percent).The average lead times for four-layer boards given by the buyer sampleare shown in Figure 7-2. Although 12.5 percent had average lead times ofone to three weeks, about 44 percent had average lead times of four to fiveweeks for four-layer boards. Higher lead time ranges of six to seven weeksand eight to nine weeks were reported by 14.6 percent and 6.2 percent ofparticipants, respectively. Lead times outside the ranges shown werereported by 2.1 percent, and just under 21 percent eitiier refused to answeror did not know their lead times at four layers.Figure 7-3 shows the range of average lead times for six-layer boardsreported by the participating buyers. Just under 9 percent had averagelead times in the range of one to three weeks and eight to nine weeks.Nearly 38 percent of respondents had four-to-five-week average lead time* ranges, while one-fifth had six-to-seven-week average lead times. Justunder a quarter of respondents either refused or did not know the averagelead time for six-layer boards.Figure 7-4 shows that over 37.5 percent of the sample either refused or didnot know the lead time for eight-layer boards. For 22.5 percent of respondents,average lead time were four to five weeks, while a quarter of allparticipants reported six to seven weeks. The remaining respondents feUinto two categories—10 percent had average lead times of eight to nineweeks and 5 percent had one-to-three-week average lead times.SSPS-WW-FR-9704 ©1997 Dataquest 31
32 Semiconductor Supply and Pricing WorldwideFigure 7-1Buyers' Average Lead Times for Two-Layer PCBsothers (1.2%)8-9 Weeks (3.7%)874817Source: Dataquest (June 1997)Figtu-e 7-2Buyers' Average Lead Times for Four-Layer PCBsOthers (2.1%)-8-9 Weeks (6.2%)-974818Source: Dataquest (June 1997)SSPS-WW-FR-9704 ©1997 Dataquest August 4,1997
Lead Time Results 33Figure 7-3Buyers' Average Lead Times for Six-Layer PCBsSource: Dataquest (June 1997)Figure 7-4Buyers' Average Lead Times for Eight-Layer PCBs1-3 Weeks (5.0%)9748S0Source: Dataquest (June 1997)SSPS-WW-FR-9704 ©1997 Dataquest August 4,1997
34 Semiconductor Supply and Pricing WorldwideBuyers' Mean Lead Times per PCB LayerSuppliers' Average Lead TimesFigure 7-5 shows the mean lead times per layer for the buyer sample surveyed.In calculating the mean lead times, only participants who gave alead time range were used; those who "did not know/refused" were notincluded.The buyers' mean lead time increased as the number of PCB layersincreased. The mean lead time for two-layer boards was just imder fourweeks, while that of four-layer boards was 4.8 weeks. For six-layer boards,the mean lead time was 5.21 weeks, and for eight-layer boards, it came to5.74 weeks.For two-layer PCBs, the average lead time ranges given by the sample ofsurveyed suppliers is shown in Figure 7-6. Just imder 5 percent reportedan average lead time of less than a week. However, the vast majority gavea higher lead time range: 47.6 percent reported average lead times ofbetween one and three weeks, just over 38 percent said that average leadtimes were four to five weeks for two-layer boards, and 9.6 percent of participantseither refused to answer or did not know the average lead time.Figure 7-7 shows the results of suppliers' average lead times for four-layerboards. Nearly 48 percent reported average lead times of four to fiveweeks, with 38.1 percent saying that average lead times were one to threeweeks. Just under 5 percent reported six-to-seven-week lead times, and9.5 percent either did not know or refused to give lead time information.The average lead time information for six-layer boards from suppliers isshown in Figure 7-8. About 43 percent reported average lead times of oneto three weeks, another third reported four to five weeks, 9.5 percent gavesix to seven weeks as the average lead time, and the remainder did notcomment.For eight-layer boards, over 38 percent of participants reported averagelead times between one and three weeks, while about 24 percent claimedaverage lead times of four to five weeks. Average lead time was six toseven weeks for 4.8 percent. A third of all respondents either did not knowor refused to give average lead times for their eight-layer boards (seeFigure 7-9).Figure 7-10 shows that most respondents reported average lead times ofone to three weeks (over 38 percent of those sampled). Next came the fourto-five-weekaverage lead times, chosen by just under 24 percent of participcmts.About 5 percent reported six to seven weeks, and a third of respondentseither refused to give or did not know their average lead time for10-layer boards.Figure 7-11 shows the average lead times for 12-Iayer boards from the supplierssampled. Nearly half refused t(j give or did not know their averagelead time for 12-layer PCBs. Howevei:, about 24 percent reported one tothree weeks as the average lead time, and just under 29 percent reportedfour-to-five-week average lead times.SSPS-WW-FR-9704 ©1997 Dataquest August 4,1997
Lead Time Results 35Figure 7-5Buyers' Mean Lead Time per PCB LayerSource: Dataquest (June 1997)Figure 7-6Suppliers' Average Lead Times for Two-Layer PCBsDo Not Know/Refused (9.5%) v i
36 Semiconductor Supply and Pricing WorldwideFigure l-lSuppliers' Average Lead Times for Four-Layer PCBsDo Not Know/Refused (9.5%)^6-7 Weeks (4.8%) ^^ /""'^1-3 Weeks \(38.1%) 1V 4-5 Weeks\ (47.6%)974823Source: Dataquest (June 1997)Figiu-e 7-8Suppliers' Average Lead Times for Six-Layer PCBs/ Do Not Know// V Refused/ \n4.3%)/ 6-7Weel«\/ (9.5%) >v1-3 Weeks 1(42.9%) 1\ 4-5 Weeks\ (33.3%)974824Source: Dataquest (June 1997)SSPS-WW-FR-9704 ©1997 Dataquest August 4,1997
Lead Time Results 37Figure 7-9Suppliers' Average Lead Times for Eight-Layer PCBs6-7 Weete (4.8%^974825Source: Dataquest (June 1997)Figure 7-10Suppliers' Average Lead Times for 10-Layer PCBs6-7 Weeks (4.3%;974826Source: Dataquesf (June 1997)SSPS-WW-FR-9704 ©1997 Dataquest August 4,1997
38 Semiconductor Supply and Pricing WorldwideFigure 7-11Suppliers' Average Lead Times for 12-Layer PCBs1-3 Weeks \(23.8%) \1 Do Not Know/Refused1 (47.6%) / 1\ / 4-5 Weeks #\ / (28.6%) m97
Lead Time Results 39Figure 7-12Suppliers' Mean Lead Times per PCB LayerSupplier's Mean Lead Times (Weelcs)3.6-
Chapter 8Premiums for Faster Lead Times and Effect on IMean Priceper Layer ^^^^—^^^^^^^-^^^^^.Dataquest wanted to determine whether a premium would be charged forfaster turnaround of board orders and, if charged, whether buyers wouldpay it. Buyers in this survey were asked if they would be willing to payextra for a faster than usual order tumaroimd.This chapter examines the effect on the mean price per layer for both buyersand suppliers and is split into three sections:• Buyers• Suppliers• ConclusionsBuyersDataquest asked buyers whether they would willingly pay a premium forfaster turnaround from their suppliers. Figure 8-1 shows ttie results.Figure 8-1 clearly shows that the vast majority of buyers surveyed wouldwillingly pay a premium for the faster-than-normal order turnaround—that is to say, most buyers will pay more money to get the PCBs morequickly—nearly 70 percent expressed a willingness to pay extra.To see how much extra the buyers would spend for faster order turnaround,Dataquest asked the buyer sample what extra percentage (or premiiun)they would wiUingly pay for turnaround times of three days, oneweek, and two weeks. Figure 8-2 shows the results.Figure 8-2 shows clearly that buyers will pay the most for the fastest tumarovmd.Among those surveyed, the mean extra percentage that buyerswould pay for three-day turnaround is nearly 105 percent on top of theusual board price.For one-week lead times, buyers would spend about 85 percent extra, andfor a two-week lead time, the mean extra that buyers would wUlinglyspend is 50.6 percent.What effect does the data in Figure 8-2 have on the mean price per layerdetermined in Chapter 6? This outcome is shown in Table 8-1.Table 8-1 shows the mean lead time (from Chapter 7) and mean buyingprice (from Chapter 6) per layer for buyers. Based on the data inFigure 8-2, Table 8-1 also shows the mean price per layer for the threefaster-than-usual order turnaround times. Thus, it is clear that buyers wiUsacrifice lower purchasing price for emergency orders.SSPS-WW-FR-9704 ©1997 Dataquest 41
42 Semiconductor Supply and Pricing WorldwideFigure 8-1Willingness of Buyers to Pay Extra for a Quicker Order TurnaroundSource: Dataquest (June 1997)Figure 8-2Average Premiums for Faster Turnaround Buyers Would PayPremium Buyers Would Pay (%)120111006080-40-20-3-Day Turnaround 1 -Week Turnaround 2-Week Turnaround974830Source: Dataquest (June 1997)SSPS-WW-FR-9704 ©1997 Dataquest August 4,1997
Premiums for Faster Lead Times and Effect on Mean Price per L^er 43Table 8-1Buyers' Mean Price per Layer for Mean Lead Times and Premium Required for QuickTurnaround Orders (Cents per Square Inch)Two-Layer PCBFour-Layer PCBSix-Layer PCBEight-Layer PCBSource: Dataquest (June 1997)Buyers' MeanLead lime (Weeks)3.984.805.215.74Buyers' MeanPrice per Layer31.137.556.561.1Three-DayTurnaroundMean Price63.576.6115.4124.8One-WeekTurnaroundMean Price57.467.2104.2112.7Two-WeekTurnaroundMean Price46.856.585.192.0SuppliersDataquest also asked suppliers whether they charge their customers a premiumfor faster order tumarovmd that their customers wiUing pay.Figure 8-3 shows the results.The vast majority of suppliers surveyed stated that they do charge theircustomers extra for faster-than-normal order turnaround and their customerswill pay more than usual to get the PCBs more quickly. Over95 percent said that they charge extra and that their customers pay it.Dataquest also wanted to know how much extra suppliers charge, andreceive, for faster order turnaround. Dataquest asked the supplier sampleto specify the extra percentage (or premium) they would charge for leadtimes or turnaround times of three days, one week, and two weeks (seeFigure 8-4).Once again, the results show that suppliers charge more for the fastestturnaround, three days. Among those surveyed, the mean extra percentagesuppliers charge is a staggering 142 percent for three-day tumarotmd,60 percent extra for a week, and 53 percent extra for two weeks.Dataquest sought to discover the effect of the faster order tumaroiind premiumson the suppliers' mean price per layer (see Table 8-2).The effect of the price premiiun on the new mean prices per layer is quiteincredible. For three-day turnaround, the mean price per layer increasedby nearly one and a half times, pushing prices way up.ComparisonTables 8-1 and 8-2 show that the overall effect of price premiiuns on meanprices is staggering. However, buyers are willing to pay extra for emergencies—clearlyaffirmed by the restdts in Figures 8-1 and 8-3. Although buyersdo pay extra for certain orders, it probably is not something they likedoing. However, desperate situations often call for desperate measures.And suppliers seem only too willing to charge!SSPS-WW-FR-9704 ©1997 Dataquest August 4,1997
44 Semiconductor Supply and Pricing WorldwideFigure 8-3Suppliers Whose Customers Willingly Pay Extra for a Quicker TurnaroundNo {4.8%) —-,\ Yes m\ (95.2%) #974S31Source: Dataquest (June 1997)Figure 8-4Average Premiums for Faster Turnaround That Suppliers' Customers (Buyers) PayPremium Buyers Would Pay (%)16011140120H10080 H6040200miO.3-Day Turnaround 1 -Week Turnaround 2-Week Turnaround974332Source: Oataquest (June 1997)SSPS-WW-FR-9704 ©1997 Dataquest August 4,1997
Premiums for Faster Lead Times and Effect on Mean Price per Layer 45Table 8-2Suppliers' Mean Price per Layer for Mean Lead Times and Premium Required forQuick-Turnaround Orders (Cents per Square Inch)Suppliers'Mean LeadTime (Weeks)Suppliers'Mean Priceper LayerThree-DayTurnaroundMean PriceOne-WeekTurnaroundMean PriceTwo-WeekTurnaroundMean PriceTwo-Layer PCB2.9721.351.534.132.6Four-Layer PCB3.5234.082.354.452.0Six-Layer PCB3.4557.0137.991.287.2Eight-Layer PCB3.1967.4163.1107.8103.1lO-Layer PCB3.1969.8168.9111.7106.812-Layer PCB3.3680.0193.6128.0122.4Source: Dataquest (June 1997)Both groups also had a sliding scale of charges for faster-than-usual leadtimes. The faster the goods were required, the higher the premiumcharged. However, there was a difference in the percentage reported bythe two groups for the different lead times.It is worth remembering that the mean lead times per PCB layer are differentfor the buyers and tihe suppliers. The suppliers report consistentlylower lead times than the buyers surveyed. ITus has an impact on the flexibilitysuppliers offer. Suppliers probably feel that they are "piilling out thestops" to give their customers low standard lead times, so the suppliersfelt justified in charging extra for faster turnaround.Both groups reported the highest charges for three-day turnaround, andboth groups reported that the extra premium was over 100 percent. However,the suppliers said they charged 142 percent, while the buyers saidthat they would pay 104.2 percent, on average. Thus there was deviationbetween the two groups, but the expectations of both were in similarranges.For one-week turnaround, the buyers stated a willingness to pay84.5 percent extra. However, the suppliers stated that they charge60 percent extra for this turnaround. This seems like a big difference, butbotii results are close when compared to their three-day turnaround premiums:84.5 divided by 142 equals 0.59, and 60 divided by 104.2 equals0.58. Thus, both state the same relative price premium for one week versusthree days.For two-week turnaround, the buyers and suppliers reported very similarraw percentage results. The buyers were willing to pay about 50.6 percentextra for 14-day tumaroimd, while the suppliers claimed to charge about53 percent extra.Thus, the one-week lead time is nearly the same from both groups relativeto both groups' premiums for three-day lead times. However, the expectationsfor the premiiun for two-week lead times from both groups fell intothe same real percentage terms.SSPS-WW-FR-9704 ©1997 Dataquest August 4,1997
Chapter 9Summary and ConclusionsThe PCB market continues to change in response to economic forces in theelectronics market. As the overall supply base of PCB manufacturers continuesto consolidate, custom.ers of these companies are also refining theirlevel of sophistication regarding forecast frequency, critical issue andproblem^ resolution, and supplier choice criteria. Ttds study polled theoverall North American market and received responses that mirrored thesize of companies in the market, if not the exact application match. Theuser issues noted as critical cut across application boundaries and shouldbe used by suppliers as guidelines for improvement and to enable survivalin the continuing competitive arena.The satisfaction gap analysis highlighted that, although respondents weremostly satisfied with the current supply base, improvements still need tobe made in quality and in the overall cost situation of PCBs. Total costs donot have to equate to pricing alone, but involve the entire spectrum^ oflogistical support, engineering support and communications, and deliveryflexibility and inventory handling, among other issues. Suppliers that canimprove in these areas will stand out even if pricing is left alone.When it comes to lead times, both buyers and manufacturers reported thatthe mean price per layer increased as the number of board layersincreased. The participating buyers reported higher mean costs across theboard, compared with the sellers. This difference ranged from as low as0.5 percent for six-layer boards to as high as 9.8 percent for two-layerboards. However, that said, both groups did report similar trends. Thedifferences in the data resvilts is to be expected.By contrast, lead times did not increase or decrease in a linear fashion asthe number of layers increased or decreased. For price per layer, anincrease is to be expected because more work is involved as tiie number oflayers increases. However, for lead times, this is not a given. Factors suchas supply base for buyers and customer base for sellers are the biggestinfluences on board lead times and determine who buyers use and whosuppliers target. Clearly, both groups negotiate lead times for the boardsbased on bu5dng volumes, manufacturer's production capacity, and so on.The results of whether buyers would pay a premium for faster-than-usualorder turnaround are interesting. Over 70 percent of buyers said that theywould pay extra for accelerated tumaroimd, while about 95 percent ofsuppliers said that they charge extra (and customers pay extra) for acceleratedorder turnaround. The actual percentage extra was also noted, andthen an analysis was done to determine the ramifications to the meanprice per layer for both groups. The bottom line: Getting product fast ismore important than price, in some cases.SSPS-WW-FR-9704 ©1997 Dataquest 47
Appendix APCB Suppliers Noted by User SampleThe PCB suppliers listed in this appendix were noted by Dataquest's usersample for tiieir excellence in quality, total cost of ownership, flexibility,price, lead time, and engineering support.• ABC• Advanced Electronics• Allphase• Altron• Amatron• American Circuits• ASAP Circuit• Automata• Bay State Circuits• Brand Express• Calyer Circuits• Central Florida Circuits• Champion Circuits• Circuit Automation• Circuits Brand• Circuit Graphics• Circuit Partners• Circuit Plus• Circuit Services• Circuit Technology• Circuit Wise• Circuit World• Computer Circuitry• Concepts• Connect• CORE• Cuplex Inc.• Custom Design• Davilla• Delta Precision• D&R ServicesSSPS-WW-FR-9704 ©1997 Dataquest 49
50 Semiconductor Supply and Pricing Worldwide• DCI• ECD• EE International• Electro Pac• Electro Plate Circuitry• ElectroStar• Electronic Interconnect• Electrotech• Elexas• Etma• Excell Circuit Concepts• Express• Futura Circuit• Gammon• Grande• Graphic Production• Hadco• Herco• H&L• HR Industries• Imagineering• rro• Janco• Kalmus• Laser Technology• Masse Circuit• Merix• Multilayer• Multiplex• MultiTec• NTDU Electronics• Nassau Circuit• Network Circuit• North Texas Circuits• Pacific• PC Design and DraftingSSPS-WW-FR-9704 ©1997 DataquBSt August 4,1997
PCB Suppliers Noted byUser Sample 51_• Photo Circuit• PNE• Pope• Praegitzer• Printed Circuits• Prototron• QFAB• QMS• Quality Printed Circuits• Radicon• SAE Circuits• Strategic Alliance Services Circuits• Senstitive Electronics• Speedy Circuit• South Bay Circuits• Strategic Alliance Services• Surface Mount Depot• Sytek• Technet• Tektronix NTI• Texas Circuit• TriStar• Tyco• United Electronics• Universal Circuits• Waytech• Westech• Win-Onyx• Wizards ParksSSPS-WW-FR-9704 ©1997 Dataquest August 4,1997
^^lyOTO/'YI I^CT^'^*^**^*'*ir^^*A Gartner Group CompanyFor More Information...Mark Giudici, Director and Principal Analyst (408) 468-8258Internet addressmark.giudici@dataquest.coniVia fax (408) 954-1780Dataquest Interactivehttp://www.dataquest.comThe content of this report represents our interpretation and analysis of information generally available to the publicor released by responsible individuals in the subject companies, but is not guaranteed as to accuracy or completeness.It does not contain material provided to us in confidence by our clients. Reproduction or disclosure in whole or inP^^ *° other parties shall be made upon the written and express consent of Dataquest.©1997 Dataquest—Reproduction ProhibitedDataquest is a registered trademark of A.C. Nielsen Company
DATAQUEST WORLDWIDE OFFICESNORTH AMERICAWoridwide Headquarters251 River Oaks ParkwaySan Jose, California 95134-1913United StatesPhone; 1^08-468-8000Facsimile: 1-108-954-1780East Coast HeadquartersNine Technology DrivePO. Box 5093Westborough, Massachusetts 01581-5093United StatesPhone: 1-508-871-5555Facsimile: 1-508-871-6262Dataquest Global Events3990 Westerly Place, Suite 100Newport Beach, California 92660United StatesPhone: 1-714-476-9117Facsimile: 1-714-476-9969Sales Offices:Washington, DC (Federal)New York, NY (Financial)Dallas, TXLATIN AMERICAResearch Affiliates and Sales Offices:Buenos Aires, ArgentinaSao Paulo, BrazilSantiago, ChileMexico City, MexicoEUROPEEuropean HeadquartersTamesis, The GlantyEgham, Surrey TW20 9AWUnited KingdomPhone: +44 1784 431 611Facsimile: +441784 488 980Dataquest FranceImmeuble Defense Bergeres345, avenue Georges ClemenceauTSA 4000292882 - Nanterre CTC Cedex 9FrancePhone: +33 1 41 35 13 00Facsimile: +33 1 41 35 13 13Dataquest GermanyKronstadter Strasse 981677 MiinchenGermanyPhone: +49 89 93 09 09 0Facsimile: +49 89 93 03 27 7Sales Offices:Brussels, BelgiumKfar Saba, IsraelMilan, ItalyRandburg, South AfricaMadrid, SpainJAPANJapan HeadquartersAobadai Hills 4-7-7AobadaiMeguro-ku, Tokyo 153JapeinPhone: 81-3-3481-3670Facsimile: 81-3-3481-3644ASIA/PACIFICAsia/Pacifrc HeadquartersSuite 5904-7, Central Plaza18 Harbour Road, WanchaiHong KongPhone: 852-2824-6168Facsimile: 852-2824-6138Dataquest KoreaSuite 2407, Trade Tower159 Samsung-dong, Kangnam-guSeoul 135-729KoreaPhone: 822-551-1331Facsimile: 822-551-1330Dataquest TaiwanllF-2, No. 188, Section 5Nan King East RoadTaipeiTaiwan, R.O.C.Phone: 8862-756-0389Facsimile: 8862-756-2663Dataquest Singapore105 Cecil Street#06-01/02 The OctagonSingapore 069534Phone: 65-227-1213FacsimUe: 65-227-4607Dataquest Thailand12/F, Vanissa Building29 Soi ChidlomPloenchit RoadPatumwan, Bangkok 10330ThailandPhone: 662-655-0577Facsimile: 662-655-0576Research Affiliates and Sales Offices:Melbourne, AustraliaBeijing, ChinaDataquestA Gartner Group Company©1997 Dataquest
FILE COPY:MARIA VALENZUELA<strong>DataQuest</strong>Tlie Semiconductor ApplicationsMarket—An OverviewFocus ReportProgram: Semiconductor Supply and Pricing WorldwideProduct Code: SSPS-WW-FR-9703Publication Date: April 14,1997Filing: Reports
ITlie Semiconductor ApplicationsMarket—^An Overview^Focus ReportIProgram: Semiconductor Supply and Pricing WorldwideProduct Code: SSPS-WW-FR-9703Publication Date: April 14,1997Filing: Reports
The Semiconductor Applications IVIarket—An Overview>•Table of ContentsPage1. Executive Summary 12. Introduction 33. Top Level Semiconductor Forecast 54. Personal Computer Application Markets 7Summary 7Market and Production Trends 7Personal Computers 7Midrange to Supercomputer Markets 10Summary 10Market Trends 10Data Storage Markets 11Summary 11Storage Market Trends 11Printer Markets 15Summary 15Printer Market Trends 16Selected Input/Output and Dedicated Systems 17Summary 17Key Trends 175. Communications Applications 21Local Area Networks: Market Drivers and TechnologyDirections 21Market Drivers 21Technology Directions 21Modems: Recent Market Developments 25Market and Technology Directions 25Fax Machines: Market and Technology Directions 28Digital Wide Area Network Applications: Recent MarketDevelopments 28Market and Technology Directions 29Videoconferencing Applications: Market and TechnologyDirections 30Premise Switching and Call Processing Applications: Marketand Technology Directions 31Public Switching and Transmission Applications 32Background Trends 32Market and Technology Directions 33Fiber Optics-Based Local Loop Technology 33Digital Modem Local Loop Technology 35Wireless Local Loop and Distribution 35ATM 36ISSPS-WW-FR-9703 ©1997 Dataquest April14,1997
Semiconductor Supply and Pricing WorldwideTable of Contents (Continued)Page6. The Consumer AppUcations Market 37Digital Satellite and Cable Set-Top Boxes 37DVD Video Players 37Video CD Players 38Next-Generation Video Game Consoles 38HDTV/ATV/SDTV 39Digital Still Cameras 39Other Next-Generation Coiisumer Electronics Products 397. Automotive Applications Market 41Navigation, Communication, and Smart Highways 428. Summary and Conclusions 45Conclusions 45SSPS-WW-FR-9703 ©1997 Dataquest April 14,1997
The Semiconductor Applications Market—An OverviewIList of FiguresFigurePage5-1 LAN Technology Trends 225-2 Alternative Network Technologies 225-3 Worldwide NIC and Hub/Switch Node Shipments by Standard.. 235-4 Fast Packet Switching 297-1 Electronic Module and System Content 42»ISSPS-WW-FR-9703 ©1997 Dataqu est April 14,1997
]v Semiconductor Supply and Pricing WorldwideList of Tables^.^^..^.^^.^^..^.^^..^.^^TablePage3-1 Revenue from Total Semiconductors Shipped Worldwide for Usein Each Electronic Equipment Group, 1995-2000 54-1 The Evolving PC 95-1 Broadband Local Loop Alternatives 34«SSPS-WW-FR-9703 ©1997 Dataquest April 14,1997
I Chapter 1Executive SummaryThe aim of this Focus Report is to look briefly at future trends in the varioussemiconductor application segments that Dataquest tracks. It wiUoffer top-level opinions from Dataquest on what the principal directionsin the tracked application will be in the near term^. This report will alsolook at the top-level semiconductor applications forecast from Dataquest.For more in-depth analysis of semiconductor applications, Dataquest hasa number of programs that cover the various segments in more detail.Semiconductor Application Markets programs exist both on a worldwideand regional basis. There are also separate worldwide services focusingspecifically on one application segment. These segments are:• Consumer• Automotive• Communications• PCs and multimedia»^SSPS-WW-FR-9703©1997 Dataquest
Chapter 2IntroductionMan as a species is constantly evolving. It is our inquiring minds and hungerfor knowledge that has helped differentiate us from other life forms onplanet earth. Our quest for redefinition and reinvention has translateditself into almost every facet of our lives, from the way we obtain food andprepare it to what we do in our spare time for entertainment and how wego about our daily business.Most homes buy frozen food for convenience that can be microwavedbefore eating. Likewise, many families spend time together either relaxingin front of the TV, listening to music from a stereo, or playing against eachother on computer games. Last year, more mail was sent via the Internetthan via the U.S. Postal Service. Medical breakthroughs have made it possiblefor premature babies weighing less than a bag of sugar to survive.During the terrible weather in the midwest United States this winter, therewere numerous stories of people being saved from almost sure death inblizzard conditions through use of their cellular phones. These things wetake for granted would have been unimaginable less than fifty years ago.Nowadays it seems that the difference between madcap inventors withharebrained ideas and technology messiahs with lifestyle-enabling brainwaves are the commercial applications for their work. Although few peopleknow the names of the inventors of most process technologies ordesigns, most will at least testify to how the quality of their lives hasimproved through the use of technology. True, many talk of the lost art ofstorytelling and the hectic, stressed pace of life most live in the developedworld, but the benefits for most have been enormous. Few would be willingto give up the technology we take for granted to return to the lifestyleof yesteryear.When adults marvel at the changes that have taken place during their lifetimes,most children conclude that their parents grew up in the dark ages."Get with the program. Mom—this is the 1990s, not the 1890s" is the children'scommon response to parental awestruck moments of pondering.Semiconductor applications have really taken off. However, what wiU ourchildren and our grandchildren take for granted in a number of years thatat present seems like a flight of fancy or a "hot new app," in Silicon Valleysmall talk?SSPS-WW-FR-9703©1997Dataquest
Chapter 3Top Level Semiconductor ForecastThis chapter is based on the Worldwide Semiconductor Consumption byApplication Market forecast (SAMM-WW-MS-9603) published byDataquest in June 1996. This data is produced by the SemiconductorApplication Markets Worldwide progran\.Table 3-1 shows the revenue from total semiconductors shipped worldwidefor use by each electronic equipnient group or appUcation area. Alldata is expressed in millions of U.S. dollars. The data for 1995 is based onactual revenue, while data for 1996 to the year 2000 is based on forecastrevenue.Table 3-1Revenue from Total Semiconductors Shipped Worldwide for Use in Each ElectronicEquipment Group, 1995-2000 (Millions of U.S. Dollars)Total SemiconductorData ProcessingComputersData StorageInput/OutputDedicated SystemsOther Data Processing1995151,27274,13249,0958,16910,0204,0642,7841996136,97762,07441,1167,6477,9963,1982,1161997154,60568,88045,7638,2248,9993,5042,3901998188,92285,54156,81410,36211,0364,4232,9061999234,916110,70775,05812,96713,5935,6443,4442000290,219142,966100,12815,53016,1617,1454,001CommunicationsPremise TelecomPublic TelecomMobile CommunicationsBroadcast and StudioOther Communications25,93410,1834,5868,0739182,17426,9829,5404,4089,9808502,20432,39510,7604,74413,3491,0282,51439,75212,9315,45316,9621,2793,12747,56515,2736,50720,3461,5433,89755,80018,0247,16823,9301,8534,825IndustrialSecurity and Energy ManagementManufacturing Systems/InstrumentsMedical EquipmentOther Industrial15,0871,4759,3891,7282,49514,0061,3998,6951,6972,21415,6931,6209,6441,9382,49119,4841,99812,0582,4193,00924,3692,49315,0433,0643,76929,6803,06618,3243,7864,504ConsumerAudioVideoPersonal ElectronicsAppliancesOther Consumer26,0714,79011,1564,7683,7501,60724,1854,26910,2814,6403,5971,39927,0154,71011,6235,1073,9801,59531,8815,55113,4966,4844,4721,87938,1856,42016,1298,0555,4242,15745,7467,67619,39810,0965,9912,584Military/Civil Aerospace2,8742,7062,7792,9833,2733,529Transportation7,1747,0247,8429,28110,81812,498Source Dataquest (April 1997)SSPS-WW-FR-9703©1997 Dataquest
Semiconductor Supply and Pricing WorldwideClearly, 1996's declines represent a contraction experienced worldwidethat year. This resulted in an overall revenue decline from 1995 to 1996.However, within the communications application segment, there was anet increase in revenue shipped to this segment.Based on the semiconductor revenue forecast, Dataquest is showing acompound annual growth rate (CAGR) of 13.9 percent from 1995 to theyear 2000. This translates into a forecast revenue increase from $151.3 billionin 1995 to $290.2 billion in the year 2000.Semiconductors shipped into each individual application segment aregrowing at positive rates. However, the shipment rates to each applicationsegment vary greatly. The CAGRs of semiconductors shipped into theapplication segments from 1995 to 2000 are:• Data processing: 14.0 percent• Communications: 16.6 percent• Industrial: 14.5 percent• Consumer: 11.9 percent• Military/civil aerospace: 4.2 percent• Transportation: 11.7 percentLooking at the forecast CAGR of semiconductors shipped into each segmentand comparing it to overall semiconductor growth rates, it can beseen that three segments have CAGRs above the overall and three below.Clearly, these do not reflect the actual growth rates of each application—these figures show only the semiconductor content revenue growth in thesegments.Within the semiconductor applica tion categories, there are some specificapplications that are growing at faster rates. These are the "hot" applicationsfrom a semiconductor shipment perspective. These areas includemobile communications, medical equipment, other communications(including intercom equipment and electrical amplifiers, among others),personal electronics, and security and energy management.SSPS-WW-FR-9703 ©1997 Dataquest April 14,1997
^Chapter 4Personal Computer Application MarketsSummaryThe PC market and semiconductor markets are inherently linked by thesimple fact that PCs consume more semiconductors than any other singleapplication. The growth of the semiconductor market depends on a robustPC market just as the PC market depends on new semiconductor devicesto differentiate the latest models from older designs. This relationship issymbiotic—profits from the semiconductor industry are fimneled backinto product and process development, driving more features and moreperformance into microprocessors, graphics chips, memory devices, andall the other semiconductor devices in PCs.The PC market, including motherboards and handheld PCs, is forecast togrow at a cumulative annual growth rate of 16.3 percent on a revenuebasis from 1995 to the year 2000, with Japan and Asia/Pacific exhibitinghigher growth than other regions. The semiconductor content of that totalPC market, including motherboards and handheld PCs, is forecast to growat a 16.1 percent cumulative annual growth rate for the same period. Sothe semiconductor content of the tjrpical PC will remain steady as a percentageof factory selling price.^Market and Production TrendsPersonal ComputersMarket and production trends in PCs and workstations are as follows:• Although notebook and subnotebook computers have enjoyed stronggrowth, desktop systems will continue to dominate the computing platformbecause of their lower manufacturing costs, their ability to handlerobust configurations with large amounts of storage, and their role inoffering the fastest and latest computing technologies.• Notebooks have enjoyed soUd unit growth and even higher revenuegrowth because of their ability to replicate desktop environments.Larger LCDs, bigger hard disks, and integrated CD-ROM drives continueto narrow the performance gap between desktop and notebookPCs.• Ultraportable and notepad shipments continue to grow but may be surpassedby handheld PCs as the second-largest mobile category, behindnotebooks.• Shipments of laptops and transportable units declined again for 1995but are forecast to remain steady in terms of unit volume through theforecast period.ISSPS-WW-FR-9703©1997 Dataqu est
Semiconductor Supply and Pricing Worldwide• In the world of mobile computing, handheld devices continue topromise function and mobility but face size, weight, and cost issues.Dataquest has defined two categories for these handheld devices, butonly tihe handheld computer category is covered in this document.• Expandable orgaruzers: These are computers that typically measure3.0 X 6.0 X 0.75 inches and weigh less than a pound. They are distinguishedby their ability to allow the user to add applications andmemory and by the fact that expansion is proprietary to a particulardevice or family. The operating systems typically are proprietary.The market for these devices is expected to peak at more than 0.5 millionunit shipments in 1995 and then slowly shrink to fewer than0.4 million by 1999.• Handheld computers: These devices typically measure 4.0 x 7.0 x 1.0inches and weigh about one pound. They are distinguished fromexpandable organizers by their adherence to hardware and softwarecompatibility standards. The operating systems are open andlicensed, and application development and memory expansion areopen to third-party developers and may be distributed in a standardformat (such as PCMCIA). Personal digital assistants (PDAs) fall intothis category.• Strong growth in the worldwide home PC market will continue acrossall regions of the world except for the U.S. home market, which showsearly signs of saturation. Price elasticity is a key issue in reaching lowerincomehomes in all regions of the world.• Microsoft's Windows 95 operating system was launched in the secondhalf of 1995 with actual product sales beginning on August 24. Its mostsignificant impact on hardware is the need to upgrade to 16MB of mainmemory.• Emerging markets and regions will account for a sharply increased proportionof shipments by 1998.• The multimedia PC market continued its torrid growth in 1995. Shipmentsof complete multimedia systems doubled from 1994 to 1995,reaching 20.9 million shipments.m Major PC manufacturers wiU continue to place a strong emphasis on thebranding of PCs.• Manufacturing strategies are dictated by economies of scale, withstrong influence from free trade zones, the availability of components,and tile quality and price of labor. For desktop PCs, the trend is towardassembling units close to the end market or at least having the final configuration(including CPU and main memory installation) executed ondemand close to the end market. For mobile PCs, production is largelyfocused in Japan and other Asian countries. A rising tide of OEM notebooksfrom Taiwanese vendors will maintain Asia/Pacific's growinginfluence on the mobile PC market.• Motherboard production will depend more heavily on the Asia/Pacificregion as suppliers regain some of the market share they lost because ofIntel's rapid growth in the motherboard business in 1994 and 1995.Table 4-1 shows the evolving PC.SSPS-WW-FR-9703 ©1997 Dataquest April 14,1997
COCO-a00Table 4-1The Evolving PC199419961998TrendCO~jC3COMain MemoryCPU8MB to 10MBFPM DRAM486 DX2/DX414MB to 16MBEDO DRAMPentium 100 MHz to133 MHz32MB to 40MB SDRAMPentium 180 MHz/Pentium Pro 150 MHz to200 MHz; all with MMXTov^^ard syRapid adoPentiumCache(Factory-CfflG^gured)128KB0KB/256KB256KB/512KBCachelessare unlik256KBPeripheral BxiSesVL/ISAPCI/ISAPCI/AGPRise of AGhave somperipher@COCO~Jo(UGraphics and Video32-bit, 2-D acceleration,1MB buffer64-bit, 2-D andvideo acceleraticn:^::2MB buffer64-bit, 2-D, 3-D andvideo acceleration,2.5MB dedicated,sharing of main memoryvia AGPRapid grovendorsvalueStorageEIDE (5MB/sec)/SCSIEIDE (13MB/sec)/SCSI-2EIDE (20MB/sec)/SCSI-2/3/1394EIDE likelrise of 13Local I/ORS-232/422RS-232/422, beginningof shift to USBUSB, RS-232/422USB will bRS-232/4Source: Dalaquest (April 1997)>•oCOCO
10 Semiconductor Supply and Pricing WorldwideMidrange to Supercomputer MarketsSummarySupercomputers and mainframes are expected to decline in growth as networkedmidrange-based systems and LAN-based clusters of PCs andworkstations continue to displace the large machines in certain applications.Likewise, midrange system growth is being clipped by PC LANclusters. As Microsoft's Windows NT Advanced <strong>Server</strong> grows in popularityin the low-end commercial and PC server markets, UNIX vendors aremoving upscale, using S5Tnmetrical multiprocessing (SMP) and clusteringtechniques for midrange computers and the massive parallel processing(MPP) approach for supercomputers.Across aU performance categories, server versions oriented toward providingresources to LAN clusters (storage, computing, and printing,among others) are growing rapidly.Market TrendsTTie principal market trends in this high-power arena are as follows:• There is a continuing trend toward the decentralized client/servermodel of computing using distributed machines optimized for networking,efficient mass storage, and on-demand number crunching.Mainframes and supercomputers are reinventing themselves ashigh-I/O-capadty, high-performance servers.• Intel's Pentiimi Pro-based motherboards are growing in popularity.Among others, Tiva Microcomputer Corporation (TMC) announced itsMercury-IQ, the industry's first dual-Pentixmi Pro processor-basedserver motherboard to incorporate PO (Intelligent I/O) subsystemsusing the Intel i960 RP and redundant arrays of independent disks(RAID) hardware. The on-board RAID provides higher performanceand reliability, and compatibility with tiie PO specifications enablesfuture technology expandability by providing a standard interface fordrivers and a message-passing protocol between multiple independentI/O subsystems.• With Microsoft's Windows NT Advanced <strong>Server</strong> growing in popularityin the low-end commercial, PC server, and workstation markets, UNIXvendors are moving upscale. Vendors introducing systems that runWindows NT on Pentium Pro processors are confident that they can, inthe long term, win over technical users who have traditionally usedlow-end UNIX workstations for CAD or 3-D applications. Alternatively,UNIX-RISC system supporters are introducing CMOS/BiCMOS,microprocessor-based, scalable multiprocessor architectures that cantake an OEM's line from workstation to supercomputer. Dataquestbelieves that UNIX will keep the high-end server market to itself at leastthrough 1998. Midrange systems are turning to symmetrical multiprocessingarchitectures, and supercomputer systems are using a massiveparallel processing approach.• From the reseller perspective, vendors seem to be a bit too productbasedand seem to have some problems in ease of doing business. AUvendors could benefit from re-evaluation of the business relationshipwith server resellers. This may be attributable in part to the significantSSPS-WW-FR-9703 ©1997 Dataquest April 14,1997
Personal Computer Application Markets 11IIData Storage Marketsamount of two-tier business that takes place in the server market.Although this is necessary, the vendor must redouble its efforts tomaintain strong conununications Unks with its resellers. Technical supportis another problem area for most vendors, and, given the missioncriticalnature of servers, this area is well worth any attention paid to it.There is a trend toward increased use of the Internet over pricey privatelines (for example, Tl leased lines) for electronic communications andcommerce (that is, allowing remote offices, traveling staffers, businesspartners, and customers to reach company networks). Companies cansignificantly reduce costs and simplify communications by eliminating800 lines, modem pools, and long distance charges as well as transferringthe maintenance of the WAN-to-WAN connection to an Internetservice provider (ISP). These so-called Virtual Private Networks (VPNs)are using tunneling technology. Microsoft has promised to incorporatethe Point-to-Point Tunneling Protocol (PPTP) in its version 4.0 of WindowsNT for access of the company's Windows NT servers from remoteindividual PCs. Digital Equipment Corporation has already released itsInternet Tunnel software. Unlike PPTP, Digital's setup does not requireISPs to use special gear. Also unlike PPTP, Digital's software uses LANto-LANtunneling as weU as individual-to-LAN approaches. The currentversion runs on Alpha-based systems running Digital UNIX. IBMis upgrading its Internet Connecting Secured Network Gateway. Thisproduct is for customers that want to create VPNs between offices usingRS/6000 servers. Hewlett-Packard formed a new division called theInternet Solutions Operation to develop Internet and intranet systemsthat allow users of corporate computer networks to perform commontasks from a standard World Wide Web browser.SummaryAs rigid disk drive single-platter capacities grow and their cost declines, afloor is imposed on the available capacity that can be marketed at a profit.The 540MB single-platter disk drive is the lowest-cost, lowest-priced productavailable. Soon the smallest will be 850MB, and then 1GB. The point isthat below that imaginary floor, there is a vast black hole in w^hich thereare no rotating magnetic storage products available. What can a PC userdo to satisfy the requirement for storage capacities between the 1.44MBdiskette and the mass of gigabit products available at the other end of thespectrum? These opportunities have been recognized by emerging newremovable media, and the outcome can only but spur the success of theremovable storage segment.The future looks good for the industry. Captive manufacture of componentswill continue to be an advantage enjoyed by a few companies.Storage Market TrendsFixed Rigid Disk DrivesThe new Dataquest rigid disk drive forecasts have been revised upwardbecause of the strong upgrade market requirements. Sales of disk drives in2000 should exceed 214 million units. Upgrades will continue to keep thedistribution market healthy, and the eventual office upgrade to MicrosoftSSPS-WW-FR-9703 ©1997 Dataquest Aprii14,1997
12 Semiconductor Supply and Pricing WorldwideWindows 9x will cause explosive buying of computers and disk drives. Areplacement market for the home will drive demand in late 1998 and 1999to these high levels.The year 1996 saw the introduction of two new rigid disk drive form factorsthat are disrupting the normal competitive environment—the JTS3-inch drive and the Quantum 5.25-inch Bigfoot. Each product is positionedin the market to take advantage of its larger recording area andits potentially lower cost per megabyte. However, it is likely that the5.25-inch drives will find technological barriers as the demand for highercapacityproducts forces them into magneto-resistive (MR) heads andhigher data rates. The 5.25-inch disk drives will likely lose their advantageby 1998.RDD market trends are as follows:• Helped by personal computer industry growth of 25.6 percent in 1995,the rigid disk drive industry exploded with a 30 percent increase in uiutsales. This strong showing was enabled by the unending thirst forlow-cost storage in the installed base of PC users. As a result, disk driveupgrade sales to consumers were 23 percent higher than shipments tocomputer makers, VARs, and integrators, thus reducing inventories.• 5.25-inch disk drives may have limited success. The increased capacityavailable on a single platter meets today's demand for 1GB disks usinglow-cost inductive head technology. But this economical advantage wiUerode in 1998 when the transition to MR heads is required, and thecapacity-limiting read charmel data rate is likely to erase this advantagein 1999.• 3.5-inch RDDs will continue to dominate the PC market, reinforcingtheir credibility in large and medium-scale RAID storage subsystems.In 1995, total sales were 79.5 miUion units, including 51.5 million unitsto computer makers, 11.8 million to the upgrade market, and 16.1 millionunits to the workstation and server market, with Seagate and IBMholding the majority market shares in the latter segment. <strong>Server</strong> storageproducts continue to be on allocation, and prices seem to be falling attolerable rates.• Smaller disks (2.5-inch and below) found a home in the mobile computermarket because they help minimize power consiunption andweight. However, they offer less capacity at a higher price than the3.5-inch or the newly introduced 3-inch drives. Manufacturers of2.5-inch disk drive may want to drop their prices to meet the newcompetition coming from 3-inch disks.• JTS Corporation's 3-inch disk drives offer the promise of 70 percentgreater capacity on a single platter at a substantial savings in cost whencompared with 2.5-inch products. The drive is manufactured fromwidely available parts and will not reach data rate limitations. The3-inch products wiU continue to have an advantage at higher capacitiesbecause they will not be forced into using expensive MR heads asquickly as the 2.5-inch drives. They can also be expected to be offeredas removable modules for the home user, further increasing theirpotential market size.SSPS-WW-FR-9703 ©1997 Dataquest April 14,1997
Personal Computer Application Markets 13• More than half the RDDs shipped in 1996 will have densities exceeding1GB. In 1997, these drives will represent 80 percent of the RDDs. Themove to more memory-intensive software based on Windows 95 is raisinguser storage needs considerably in PC applications. The need forlarger storage space for multimedia (audio and video) data and rasterizedimages is also a significant factor contributing to growth.• RDD product life cycles are running about one year.Removable Storage Product DrivesThe year 1996 has proved to be an interesting time to observe the removabledisk drive market, and today the future looks much better than it didlast summer. The black hole of capacity between 100MB and 1GB is nourishinginnovation, and manufacturers are hurrying to find a way to offer aproduct that can be purchased easily from discretionary funds by as manyconsumers as possible. The success of the flexible diskette is undeniable,primarily because it has exceeded the PC criteria for removable storagedevices. However, these criteria have evolved, and the end users are nowdemanding high-capacity, fast-backup capabilities as well as removablestorage that can provide high-performance multimedia output.As cost and reliability are still key, 3.5-inch, 1.44MB floppies are still agood deal, but their performance and capacity are far behind the times.The battle to find a replacement is just commencing. It is too early to predictwhich device(s) will be the long-term winner in this search to replacethe 3.5-inch, 1.44MB diskette.Dataquest wiU now examine the main market trends in removable drivers,breaking them into three principal categories, namely, optical disc drives(ODD), flexible drives, and tape drives.Optical disc drive market trends are as follows:• ODDs, especially CD-ROM drives, continue surging in sales. The standardizedsoftware distribution data format used on all platforms todayis the CD-ROM because the size of software has far exceeded the capabilityand convenience of a 1.44MB diskette. The CD-ROM drive (a possiblecandidate to replace 3.5-inch floppies) is starting to come down inprice but is still closer to $800 than the $200 price point.• CD-ROM demand comes from a burgeoning multimedia market wheredrives are being incorporated into the system or added via upgrades(by kit or as standalone devices). Home and corporate users are usingCD-ROM drives for reference (for example, encyclopedias, publications,and manuals), education, and games. CD-ROM drives are findingtheir home on many servers and workstations as a software distributionmedium. The use of DVDs will obviate the need for CD productstoward the end of the decade.• Rewritable optical drives, comprising principally magneto-optical (MO)technology, are showing signs of getting competitive and meeting mostPC criteria, but the costs related to rewritable optical disc products continueto exceed those of magnetic products. Higher capacities in theRDD market are also hurting this market's development. The mostpopular versions will be 3.5 inches.SSPS-WW-FR-9703 ©1997 Dataquest April 14,1997
14 Semiconductor Supply and Pricing Worldwide• DVDs are poised to boost opportunities for many semiconductor components.With higher storage capacity, faster data transfer rates, interactivecapabilities, and, most important, applications across computer andconsumer electronics markets, DVD has moved the capabilities of opticalstorage forward by an order of magnitude. Recent agreement on aconmion format standard should enable the launch of DVD-ROM andDVD-Video products by end of 1996. DVD-WORM and DVD-RAMstandards will be established over the next one or two years. The combinedmarket shipments of aU DVD reading/playing products woulddrive factory revenue over $10 billion by the year 2000. The DVD opticaldrive market itself should generate $4.3 billion by the end of the decade.• An in-depth report on DVD, DVD: The Hot New Digital Video Destinationfor Semiconductors (MSAM-WW-FR-9602, July 8,1996), has been publishedby Dataquest's Consumer Multimedia Semiconductor ApplicationMarkets program. This report provides detailed analysis andforecasts of the semiconductor opportunity in DVD products.Flexible drive market trends are as follows:• Last year's forecast showed a decline in both FDD unit shipments andfactory revenue. To the dismay of many, the latest data displays arevival of a 4.3 percent CAGR for 1995 through 2000. Total worldwideflexible drive sales in 1995 were 81.2 million units, while total computersales were about 62 million units, and FDD sales are expected to grow13.5 percent in 1996.• For the lack of a widely industry-supported alternative, the 3.5-inch,1.44MB FDD technology is expected to remain the predominant standard,whereas 5.25-inch versions are in rapid decline (down 39 percentfrom 1994, to 6 milUon units in 1995, with a projected 67 percent declinein 1996 over 1995). Those 2.88-inch versions are expected to disappearsoon from shelves because of the OEM price that turned out to doublethe price of the disk as well as the capacity.• Iomega's Zip drive is offered at 100MB for $199 and meets the previouslymentioned end-user needs. Several OEM contracts have beenannounced, including Unisys, Bandai Digital Equipment, Power Computing,Micron Electronics, Hewlett-Packard, Acer, Packard BeU, IBM,NEC, and Escom. Dataquest believes that the OEM configuration of theZip drive can be cost-reduced and supplied at less than $100 in largequantities. Although it is still an inexact science to estimate where thisproduct and its market may be headed, the success of the Zip drive isprobably limited by production capacity.• SyQuest has attempted to compete with the Zip drive with its EZ-135product and has suffered severe losses. SyQuest appears to be movingback to its solid installed base of 2 miUion users to market a new 230MBrigid drive called the EZ Flyer. SyQuest is also competing againstIomega's 1GB Jaz drive witii its 1.2GB Sylet.• The latest permutation of floptical technology is the LS-120 productfrom Matsushita Kotobuki Electionics (MKE), Panasonic, Compaq, andImation (3M's spin-off). OR and Mitsubishi have also announced ti\atthey wiU manufacture their own version, and Maxell wiU produce flopticalmedia at the market price of $19.95 per diskette. Although thisoptical tracking technology is solid and weU-proven, the additional costSSPS-WW-FR-9703 ©1997 Dataquest April 14,1997
Personal Computer Application Markets 15IIof this servo mechanism brings the product to between $115 and $120 inlarge OEM quantities. The high cost and the lack of a single point ofcontrol over the sales strategy make the LS-120 an unlikely candidatefor standard use as an OEM product.• Another 120MB, 3.5-inch pretender has been announced by Mitsumi.This multigap read-write head technology product provides high-densityrecording as well as backward compatibility. Although this productis still more experisive than the LS-120, it has the chance of having itscost reduced quickly if the volunies warrant. Legal battling over thelicense to the technology (with Swan Instruments and Antek as otherparticipants in the ownership discussions) has clouded its immediateprospects.Tape drive market trends are as follows:• Tape has always had the lowest cost per megabyte for the storageindustry, but its sequential performance characteristics and price haverelegated tape to the backup and archive business.• Emerging applications are focused on new functionality such as hierarchicalstorage management, near-line storage, large file transport, anddirect recording and playback of audio, video, and multimedia files.• With heavy use as PC server and workstation backup devices, 1 /4-inchcartridge tape wUl remain the dominant tape drive device throughoutthe forecast period (about 70 percent of the total tape drive market). TheDC-2000 1/4-inch version, which fits into 3.5-inch bays, wiU grow to bethe dominant version.• Helical scan technology based on either digital audio tape (DAT) at4mm, camcorder technology at 8mm, or VHS-type technology wiUshow average growth.Printer MarketsSummaryPrinters are definitely not getting dumber. Host-based printing solutionscan be applied successfully to certain environments (mainframes and networkswith orily one printer).Because the price curve of RAM has slowed dramatically, data compressionis becoming increasingly important. This is especially true given theincreasing demand for higher resolutions and color, both of which requiremore data to move around. Even with compression, high-end printers arestill memory hogs, which is good news for RAM suppliers.Color also demands more advanced logic components for matching, alignment,and halftone generation. PostScript Level 2 code is big, which isgood news for ROM suppliers. Color laser printers use up to 8MB ofROM. Color and PostScript Level 2 will be growing applications for ROM.IRISC is aUve and well in laser and thermal transfer printers. Lots of opportunitiesstill exist for differentiating logic products based on performance,features, and level of integration.SSPS-WW-FR-9703 ©1997 Dataquest April 14,1997
16 Semiconductor Supply and Pricing WorldwidePrinter Market TrendsIn the following overview, the terms "serial printer" and "page printer" arehistorical and are quickly losing their relevance. A serial printer is definedas printing one character at a time. A page printer stores the entire pageimage in a buffer before printing it out in one uninterruptable pass. Historically,serial printers meant ink jet and some dot matrix printers andpage printers meant laser and thermal transfer printers. However, therehas been significant crossover between these two historical categories.Printer market trends are as follows:• The small office/home office market continues to drive much ofthe low-end printer market growth for economical ink jet and laserversions.• Dot matrix technology is quickly being replaced by ink jet. However,there is still a large market for dot matrix and thermal printers embeddedinto cash registers, calculators, automatic teller machines, and gaspumps.• The logic functions of printers are now being integrated or even eliminatedaltogether, with the rasterization being done in the host computer'sprocessor. Host rasterization, or host-based printing, is veryattractive because it eliminates redundancies between the printerand the computer. In particular, it dramatically reduces memoryrequirements.• The 300-dots-per-inch (dpi) laser/LED technology page printers arebeing replaced by true 600-dpi laser/LED and higher-quality 300-dpiink jet technology; 1,200-dpi technology is deployed into the high endof laser printer market.• Following is a list of the new features that printer n\anufacturers areimplementing:• Higher quality: Printers are moving to 600 dpi from 300 dpi.• Enhanced image: Variable dot sizes and advanced halftone generatorsare two techniques that can boost the image quality beyond theprinter engine's rated maximum.• Color: Colored ink, ribbons, or toner• New form factors: Portable with multiple paper trays and handlingoptions• Multifunction: Systems combining fax, copier, scanner, and phoneare beginning to see market ramp-up. Multifunction machines nowhave their own industry association, the Multifunction PeripheralAssociation (MFPA).a Faster speed: Usually a trade-off for quality• Power conservation: Low power consumption during idle and sleepmode is a feature. Page printers using less than SOW to 45W whenidle can qualify for the coveted U.S.-based Energy Star label. About90 percent of laser printers and 60 percent of thermal transfer printersare now compliant w^ith this specification.SSPS-WW-FR-9703 ©1997 Dataquest April 14,1997
Personal Computer Application Markets 17I• Multiple connections: Supporting different netw^ork interfaces, builtinEthernet, and automatic emulation switching• Most ink jet and laser printers support HP's Printer Contiol Language(PCL). However, Adobe's PostScript is the de facto standard languagefor complex graphics. PostScript Level 1 is for black and white; PostScript Level 2 supports color. PostScript is primarily impleniented inlaser and thermal tiansfer printers. Both PostScript Level 2 and HP'sPCL 5 font technology are becoming more prevalent in midrange andlow-end page printers.Color page printers remain expensive (about three times more than serialprinters). It should be some time before they become economical andmainstieam. Color-capable and full-color ink jets rapidly are becoming themajority in that market.Selected Input/Output and Dedicated SystemsSummaryWith the advent of multimedia and digital video/audio features, the needfor a universal and faster I/O bus is growing. The Uruversal Serial Buswas designed as a low-cost connection for multiple, simultaneous use ofI/O devices and provides a new opportunity for semiconductor manufacturersin terms of digital/analog converter ftmctions, in particular.Key TrendsDataquest has split this group into a number of categories that are examinedindividually. These areas are sound boards, graphics boards, digitalvideo boards, monitors, copiers, scanners, and keyboards.Sound BoardsKey trends in sound boards are as follows:• The sound board market faces increasing competition from integrateddesigns with sound chips on the motherboard or on custom daughtercardmodules. Integrated sound chips are primarily used for mobileand consumer PCs, although a few business desktops have integratedsound capability.• Microsoft has adopted DSP Group's TrueSpeech technology as a compressionstandard. Several vendors already support adaptive differentialpulse code modulation (ADPCM) for compression.• Movement to 16-bit technology is nearly complete. Wave-table sjmthesisis gaining market share.• Key chip functions include FM and wave-table synthesis (512KB to 4MBROM-based), ASSPs/ASICs (mixed-signal and digital CMOS), audioamplifiers, and mixers. SCSI host adapters have declined in popularitycompared with EIDE or proprietary variants of EIDE.»SSPS-WW-FR-9703 ©1997 Dataquest April 14,1997
Semiconductor Supply and Pricing WorldwideGraphics BoardsKey trends in graphics boards are as foUows:• These may receive a boost from the 3-D graphics market until mid-1997,when several new graphics controllers make 3-D hardware more attractivefor motherboard implementations.• Boards are moving to greater than 1000 x 1000-pixel resolutions, acceleratedBitBLT-based, 64-bit data paths, and RAMDAC technology movingfrom 85 MHz to 135 MHz. Also, digital video, 3-D, and soundcapability are appearing in the high-end boards.• Extended data out (EDO) DRAM will be the dominant memory for 1996but will be replaced with SDRAM/SGRAM in 1997. Minimal buffersstart at 1MB and move to 4MB with optional single in-line memorymodules (SIMMs). Most high-end add-in boards have separate RAMDAC, and digital video functions are being integrated into virtuallyevery design.Digital Video BoardsKey trends in digital video boards are as foUows:• There will be continued penetration into the multimedia content creatormarket (software title development, market communications, and training).Playback board growth will be limited to full-screen 15-fps-to-30-fps acceleration. Other opportvmities exist for TV tuner, capturepassthrough, and integrated audio and graphics boards.• MPEG-1 hardware shifted partly to the motherboard in 1995 but hasalready reverted to add-in cards, creating greater opportunities forvideo board OEMs.• Key semiconductor opportunities include compression decoders forMPEG-1 and JPEG, among others (and encoders for real-time algorithms),decoders and encoders among various video standards such asPAL, NTSC and CCIR, ASICs (CMOS), digital video processors (scaling,among other functions), and DRAM/VRAM pixels buffers.Leading digital video board OEMs worldwide are ATI, Creative Technologies,Diamond Multimedia, FutureTel, IBM, Intel, Matrox, Media Vision,C^tibase, Optivision, Orchid, Sigma Designs, SuperMac, and Video Logic.IVIonitorsKey trends in monitors are as foUows:• Color wiU grow to 98 percent of the market in 1999.• The predominant tube size in 1996 will be 15 inches; 17-inch tubes willpredominate in 1997.• Chip content will be about $5 for primarily video amplifier controls(moving to 135 MHz) and CRT controls.SSPS-WW-FR-9703 ©1997 Dataquest April 14,1997
Personal Computer Application Markets ' 19CopiersKey trends in copiers are as follows:• Dataquest believes that the worldwide total copier market will declineby the year 2000, largely because of a decline in placements of low-volumepersonal copiers (up to 30 copies per minute). However, the highendcopier market wiU continue to grow, and digital and color copierare emerging quickly.Digital and color copiers (combining printing and scanning, among otherfunctions) are emerging. In 1995, a mere fraction (1 percent) were digital innature, including standalone and connected units. Even by the year 2000,less than 10 percent will be digital. However, it is clear that digital will bemore important in the high-end segment of this market. Digital will represent3 percent of low-volume copiers, 13 percent of midvolume copiers,and 29 percent of high-volume copiers.• The low-volume copier market will continue to grow for one more yearbut wiU decline each year thereafter. Although personal copiers arevmdeniably inexpensive, reliable, and easy to use, their popularity willdecline as users start to respond more heavily on alternate reproductionmethods: printer/faxes, fax/printers, scaivners, and multifunctionaldevices that, at last, are hitting the right price/performance points toattract buyers. When Dataquest refers to the low end (tabletop; up to30 cpm) of the copier market, we are talking about the Personal Copier(PC) Segments 1 and 2. Obviously, these economically priced units representthe lion's share of the copier market: 17 percent of the total marketin 1995. However, in terms of revenue, they only represent27 percent of the total. All vendors, besides Kodak and Oce, are representedin this market.• The midvolume part of the market (31 cpm to 69 cpm, tabletop or console)refers to Segments 3 and 4. This has been referred to as the heartlandof the market, in particular as it pertains to Xerox, which is still amarket leader in this area. However, the midvolume segment is also thepart of the market that Japanese vendors have aspired to and w^herethey now excel. In terms of units. Segments 3 and 4 represent 20 percentof the market, but in terms of revenue, they represent 44 percent of themarket, hence their attraction. Depending on the size of tiie end-usercompany, a midvolume unit may be the production copier or a walk-upcopier. In either case, they are speedy, rucely featured, and productive.The midvolume has also been targeted by liie Japanese vendors formultifunctional units. Introduction of digital and color copiers mayenable the "copier company" to win the battle against multifunctionprinters.The high-volume part of the market refers to Segments 5 and 6 (console;over 70 cpm). Traditionally, this part of the market has belonged to U.S.high-end players Xerox and Kodak. Although this is still largely true inSegment 6, Segment 5, like the midvolume segment, is home to all Japanesevendors as well. Although in terms of units the high end is a smallpart of the market (3 percent), in terms of revenue it represents 30 percent.Clearly, the attraction for the Japanese vendors has been this revenuepotential. The continuing growth of high-volume products is fueled byend users' desire for speedy units and the increased popularity of digitalunits. This part of the market should not be threatened by multifunctionSSPS-WW-FR-9703 ©1997 Dataquest April 14,1997
20 Semiconductor Supply and Pricing Worldwidemachines. It is much less convenient to print out multiple sets on a slowprinter or use a scanner/printer combination. Also, copiers have finishing,a feature still lacking on printers. This also makes them very productive.When a printer is used for a job, the sets would neither be sorted nor stapled,which means that the printer user would have to separate and staplethe sets. In the meantime, the copier user would be walking away from thecopier with finished sets. Copiers still have many advantages that peoplewould be loath to give up.Leading copier OEM players are Canon, Kodak, Konica, Lanier, Minolta,Mita, Oce, Panasonic, Pitney Bowes, Ricoh, Sharp, Toshiba, and Xerox.ScannersKey trends in scanners are as follows:• Scanners are an expanding desktop/digital document tool.• The bulk of the market is at 300 dpi today, moving to 600 dpi; color willmove from 35 percent to 60 percent of the market by 1999.• Handheld scarmers are projected to be 35 percent of the market by 1999.• The semiconductor content includes linear CCD arrays, 8-bit MCUs,ASICs, and DRAM.Leading scanner OEMs worldwide are HP, Apple, Canon, Mustek,Fujitsu, Microtech, and Logitech.KeyboardsThe trend in keyboards is commodity items moving toward ergonomicand wireless versions.Leading keyboard OEMs worldwide are Keytronic, Silitek, and Maxi-Switch.SSPS-WW-FR-9703 ©1997 Dataquest April 14,1997
Chapter 5Communications ApplicationsLocal Area Networks: Market Drivers and Technology DirectionsMarket Drivers• Large-size and medium-size office LAN desktop connectivity will continueto rise, reaching nearly 100 percent saturation in the United Statesand Europe by the end of the decade. The majority of new connectivitygrowth will come from businesses in Japan and the rest of world andsmall office/home office (SOHO) hookups everywhere.• LAN bandwidth demands will be driven by a variety of trends, includingincreased use of application servers, networking, faxing, groupware(such as Lotus Notes), and, ultimately, multimedia-rich file transfermessaging (store and forward or conferencing).IS managers are under pressure to upgrade as they consider a variety ofspeed-enhancing technologies for desktop connectivity and the backbone.TTiese include:• Full duplex Ethernet (20 Mbps)• Iso-Ethemet (16 Mbps)• Switched Ethernet (10 Mbps)• Switched token ring (16 Mbps)a Fast Ethernet (100 Mbps; shared media and switched)• lOOVG-AnyLAN (100 Mbps; shared media and switched)a Fiber-distributed data interface/copper-distributed data interface(FDDI/CDDI; 100 Mbps)• ATM (25 Mbps to 622 Mbps)• Gigabit Ethernet (1,000 Mbps)Figure 5-1 illustrates the various LAN technology tiends by segment.Figure 5-2 shows alternative network technologies, and Figure 5-3 showsnetwork interface card and hub/switch node shipments.Technology DirectionsThe LAN area is one with many different technologies at the moment.Dataquest has included some strategically significant new direcitonsbelow:• High speed• New high-speed technologies like 100-Mbps Fast Ethernet, lOOVG-AnyLAN, and asynchronous transfer mode (ATM) are beingemployed in desktop NICs and network backbones. Increasingly, 10-Mbps Ethernet and token ring will be displaced by these faster technologiesfor desktop connections. The market is moving rapidly totechnology known as 10/100, which uses networking systems capableof both 10 Mbps and 100 Mbps.SSPS-WW-FR-9703 ©1997 Dataquest 21
22 Semiconductor Supply and Pricing WorldwideFigure 5-1LAN Technology Trends{ Desktop Jf WorkgroLjp ^\^ Backbone Jf Enterprise \\^ Backbone JEvolvingToward• 10Base-T Ethernet• Tol^^ ISDN(:;-/;>:>} ISDN\oksnHm}//////////////A^-^l///////^///////, A-ri*;DionM W////'//J/////A—Wy>9i9fW/y. ATM/BISDN V/Z^07ZW/9T^LANlOBase-T ^ ^Token Rina ^//^'AV////A 100Base-TA/G-AnyLANISO-Ethernet V////////, '^ V////A FDDI V////A Giqabit EthernetSub-LANI/OFiber Ct lannel V/////////////////^^^^^^V^-m^/My/zZ/A^/A Hippi64 Kbps 1 Mbps 10 Mbps 100 MbpsData RateIK Mbps10K MbpsSource: Dataquest (April 1997)SSPS-WW-FR-9703 ©1997 Dataquest April 14,1997
Communications Applications 23Figure 5-3Worldwide NIC and Hub/Switch Node Shipments by StandardThousands of Units200,000^nATM (All Speeds)FDDIr-^ 10/100 Mbps (Fast"^ Ethernet/AnyLAN)• Token Ring^Ethernet1 I I I I I r1993 1994 1995 1996 1997 1998 1999 2000STEMSSource: Dataquest (April 1997)Network Interface Cards• NICs capable of 10-Mbps and 100-Mbps speeds are penetrating themarket rapidly. The price premium for these dual-capable boards hasdropped to under 50 percent, and MIS managers interested in investmentprotection are buying them in lieu of slower-speed-only boards.In three years, the majority of boards sold wiU be dual speed.• Fast Ethernet is becoming the dominant next-generation desktop andworkgroup backbone technology, and VG-AnyLAN and 25-MbpsATM will play niche roles.• PCI bus NICs are entering the mainstream, displacing the ISA busversions.• The trend is toward installing category 5 twisted pair or fiber in mostupgrades and new installations. Category 3 twisted-pair wire is themost common currently.a PCMCIA card (or PC Card) versions are enabUng notebook computerconnectivity and are expected to continue to grow rapidly.a Key value-add features include remote monitoring (RMON), whichallows remote management of campuswide LANs and wide area networks(WANs), and power-up/down modes such as AdvancedMicro Devices' Magic Packet technology.a PCs targeted at large businesses, like most workstations today, willhave embedded LAN controllers designed onto the motherboard atan increasing rate.SSPS-WW-FR-9703 ©1997 Dataquest April 14,1997
24 Semiconductor Supply and Pricing WorldwideHubs, switches, and routers• Intelligent shared media (also known as repeater) hubs are beingreplaced by LAN switches capable of dedicating full bandwidth(such as 10,16, or 100 Mbps) to the desktop. Most hubs/switchestoday have as minimum eight to 16 ports with one or more highspeeduplinks to a server or other hub/switch. Modular and stackablehubs are gaining strong market acceptance because of their flexibility.Key value-added directions for hubs and switches are towardbetter manageability and robustness in the form of reliability anduptime. Support of full duplex transmission is increasing as well.• Routers are used to direct network traffic from one LAN segment toanother and come in local and remote forms. For the most part, routershave displaced bridges as a more flexible alternative. Many routerscan now be added as modules to hub bays. Some have speculatedthat switch-based networks that implement virtual LAN (VLAN)techniques would make routers obsolete. It will take a few yearsbefore full-featured switches that support VLANs and a full suite ofmanagement functions hit the market.a The remote LAN access server (with built-in routers, modems, integratedservices digital network, or ISDN, adapters, and so on) is alsoproving to be very popular. Access to fUes at work, e-mail, andremote offices are the drivers. Remote LAN access servers typicallyincorporate a LAN interface, a number of modem ports (now V.34 orISDN or T/E carrier), and some sort of CPU-based protocol mappingengine.ATM• ATM technology employs 53-byte, fixed-length cells that can operatefrom speeds as low as 25 Mbps to 155 Mbps and up to 2.4 Gbps inbackbone and public transmission applications. Adopted initially bythe hub/switch vendors, adapter cards for workstations and serversare also hitting the market. The main standards body is the ATMForum, which works with interested players to ensure that LAN,WAN, and public equipment will work with each other. ATM isviewed as tiie overarching technology that can link LAN and WAN.ATM's adoption in LANs has been slowed somewhat by Fast Ethernet'ssuccess, but key pockets of opportunity exist in enterprise anddepartmental backbone switches, "power user" 155-Mbps NICs, and25 Mbps for upgrading token-ring desktops.Wireless LAN• Radio-frequency (RF) versions employing spread spectrum technologyoperating in the ISM bands are expected to be the most popular,although infrared (IR) will find many point-to-point uses. Worldwide,the 2.4-GHz band should become the most popular, with 900MHz being the most popular band in existing vertical applications inthe United States.• Early market build will come from the rollover of users from proprietarysolutions in the handheld data terminal market. Work on theIEEE 802.11 standard, which would govern wireless LAN interoperability,would have a flexible media access control (MAC) layer (up to20 Mbps) and three physical (PHY) layers, two spread spectrumSSPS-WW-FR-9703 ©1997 Dataquest April 14,1997
Communications Applications 25Modems: Recent Market Developments(frequency hopping and direct sequence), and IR. Ratification of IEEE802.11 is expected ti\is year.Key market acceptance issues revolve around costs (currently $500 to$600 for adapters and $1,000 to $2,000 for bridges) for data throughput(typically 0.5 Mbps to 2 Mbps currently). To appeal to more thana certain set of vertical markets, the prices must drop in half and performancemust at least double, approaching seamless Ethernet connectivityat 10 Mbps.In 1995,1996, and beyond, some basic modem market trends wiU affectthe nature of the opportunity for vendors selling to that industry:• Near-term shipment growth is being driven heavily by the ongoingramp-up in home modem use. The modem market (add-in cards, PCCard, standalone, and rack mount) grew over 50 percent in 1995 on aunit basis. The market is expected to grow another 30 percent in 1996.• V.34 modem^s capable of speeds up to 33.6 Kbps are projected to be60 percent of the market in 1996. Digital modem shipments, comprisingISDN adapters, as5mimetrical digital subscriber line (ADSL), and cablemodems are expected to exceed 1.5 million units in 1996.• Nearly 100 percent of the PCs sold through the retail charuiel come bundledwith modem cards or some built-in modem functionality. Usage isbeing stimulated by the rise of the home office, remote access for workat-homeuse, and the rapid rise in popularity of onUne services such asthe Internet, America Online, and CompuServe. In particular, access tothe Internet's World Wide Web is the big attraction for home modemusers.• The Japanese and western European modem markets have experiencedstrong growth over the past year as the home multimedia PC n\arkettakes off in those countries as well. High growth rates are expected tocontinue for at least another year. Internet access is also a big driver ofdemand in these countries. Evolving privatization of the European PTTis helping expand modem ownership.• Robotics/Megahertz was the largest modem supplier in the world in1995, nearly doubling its business with effective retail and bundlingstrategies. GVC Corporation became the second-largest company bybeing a strong behind-the-scenes provider.• U.S. Robotics was acquired by 3Com.Market and Technology DirectionsAnalog• V.22bis (2,400-bps, two-wire, and fuU duplex) was the most popularanalog standard worldwide in 1993. In 1994, it was surpassed byV.32bis modems (14.4-Kbps and lower, two-wire, and fiall duplex) asprices come down. V.32bis should remain the dominant standard until1997, when V.34 (28.8-Kbps/33.36-Kbps) becomes dominant. V.34 wasratified as a standard and has become an Intemational TelecommunicationsUnion (ITU) standard.SSPS-WW-FR-9703 ©1997 Dataqu est April 14,1997
26 Semiconductor Supply and Pricing Worldwide• Most PC modems are now capable of data and fax transmission andreception and various degrees of "telephony" functionaUty, includinganswering machines, plain old telephone service (POTS), andspeakerphone.• PC Card (PCMCIA) versions continue gaining in popularity for notebookcomputer users desiring to gain access to e-mail while not in theoffice. Of the PC Card versions, a growing percentage are dual LANNICs and modems.• Most modems now support error correction (MNP 2-4 and V.42) as wellas data compression (MNP 5 and V.42bis). There is also a strong trend toadd plug-and-play functionality to PC modem cards so they can beinstalled without concern for the system configuration. Other evolvingfeatures include call discrimination, which can distinguish the types onincoming calls, caller ID support, answering machine emulation, businessaudio I/O, MNP 10 for more robust cellular conununication, anduniversal "worldwide" standards support for call progress and handshaking,among others.• A committee of the ITU has approved the V.70 digital simultaneousvoice data (DSVD) standard. This standard allows collaborative computingto take place such that data can be shared while a voice conversationtakes place. In this scheme, 8 Kbps of bandwidth is allocated todigitized voice, which uses the G.729 Armex A coder specification. Thenext generation of modems are expected to be equipped with DSVDcapabUity.• Many modems are now being combined with sound card functions(Sound Blaster compatibility, for example). These are generally the twoadd-in cards found in multimedia PCs, and some PC OEMS have seenbenefit in combining them and saving costs.• Another feature that companies are working on is to allow power-downmodem reception. This capability would power parts of the PC when anincoming transmission is detected.• Some computers, most notably IBM with its Mwave technology, havemoved to using a general-purpose, digital signal processor-based (DSPbased)processor for handling modem, telephony, and sound I/O.• The trend is toward most modems supporting V.17 faxing (14.4-Kbps)in addition to V.29 (9.6-Kbps) and other fax speeds. There also is a trendtoward supporting the EIA/TIA-578 Class 1 standard, which extendsthe "AT" command set, allowing the PC application software controlover advanced fax functions.• Telephony (data and fax modem) functions are becoming more standardizedas the Microsoft Windows Telephony Application ProgramInterface (TAPI) feature becomes standard in Windows 95. This is notonly supporting the plug-and-play rollout but is also simplifying applicationdevelopers' jobs by creating a standard software interface capableof using a multitude of modem features.• The traditional modem market is being threatened with displacementon two fronts: high-speed digital alternatives and host-based "softmodems." With soft modems, an increasing amount of the functionalityis rtm on the host CPU (x86 or PowerPC). Ultimately, only an analogfront end interface would be required as separate hardware. Theapproach salutes the increasing amotmt of mips available with the latestSSPS-WW-FR-9703 ©1997 Dataquest April 14,1997
Communications Applications 27MPUs. Intel's Multimedia Extensions (MMX) MPU instruction extensions,which accelerate DSP-type functions, are expected to enhance thePentium and Pentium Pro processors, making them suitable for "voiceband" processing for audio and modem I/O. The rate of conversion tothis approach is being accelerated as chip vendors start to provide controUerlessversions of modem chipsets, allowing the host software totake over that function.• 56 Kbps is staving off digital competition for PC applications in theshort term. However, the prestandard 56 Kbps is split into two camps:• Rockwell/Lucent (No. 1 and No. 2 in modem chipsets)• U.S. Robotics (No. 1 in finished modems)/TI/CirrusAs mentioned earlier, U.S. Robotics has been acquired by 3Com. U.S.Robotics, according to Dataquest, is both a technology and modemsupplier. Its success is bolstering TI's market position.DigitalSeveral digital technologies can offer a speed advantage over V.34(33.6 Kbps). As access requirements spiral upward, these digital alternativesare becoming more available and are dropping in price. Key digitalalternatives include ISDN, as5anmetric digital subscriber loop (ADSL),and cable modem. By the year 2000, digital modems are expected toaccount for about 20 percent of the market.• ISDN basic rate interface (BRI), capable of 128-Kbps transfer rates, continuesto roU out with over 4 million lines in service worldwide. ISDN isbeing aggressively rolled out in many areas around the world. Thehighest penetration is in Germany spurred on by historically low servicecharges. After a slow start, several U.S. regional carriers now havelow^ residential tariffs and are improving installation services. Averagemonthly charges have dropped below $50, with ISDN PC terminaladapters with a U interface (also known as NTl) costing $300 or less.The number of ISDN lines installed is expected to grow to over 10 millionworldwide by 1999.• Cable modems are emerging as a viable high-speed digital modem technologythat can push data to speeds exceeding 10 Mbps. Cable modemtechnology works over cable TV (CATV) coaxial lines via service providedby the cable TV company. Expect small scale trails and deploymentto continue for 1996 and most of 1997. Once infrastructure systemsare in place to manage traffic routing and customer service, the cablemultiservice operators (MSOs) are expected to accelerate deployment asthey try to capture the Internet access business. Key hardware providersinclude General Instrument, Hewlett-Packard, LANCity, Motorola, andScientific-Atlanta.• Asymmetrical digital subscriber loop (ADSL) employs a DSP-basedline-conditioning technology to make standard twisted-pair phone linescapable of more than 6-Mbps data transfer, fast enough to carry MPEG-2 compressed videos. As the telephone companies do battle with thecable companies and others, they are expected to place more emphasison ADSL. The United Kingdom, United States, Australia, and Israellead a group of countries with ADSL trials. Current estimates place thenumber of ADSL lines to be installed by the year 2000 at 10 million. Anextended version of ADSL known as VDSL (very high-speed DSL)capable of 52 Mbps over 3,000-feet local loops is also being considered.SSPS-WW-FR-9703 ©1997 Dataquest April 14,1997
28 Semiconductor Supply and Pricing WorldwideKey ADSL equipment vendors include Westell, Amati, Aware, Alcatel,ECI Telecom, and AT&T Paradyne. Of the two primary algorithms usedin ADSL, one known as discrete multitone (DMT) is expected to becomethe most widely implemented.Fax Machines: Market and Technology DirectionsKey trends with the fax machine market and technology include:• Unit growth is slowing in the professional segment as market saturationnears in most of the developed countries. Developing countries andhome use in countries such as the United States are the main growthopportunities for fax machines.• The trend toward plain paper machines continues as they decrease inprice relative to direct thermal transfer. Plain paper machines areexpected to be the majority of shipments by the end of 1996.• Laser/LED marking engines for plain paper machines are rampingquickly as a percentage of the market. The combination of good printingperformance and cost-effectiveness will propel the ink jet technologypromoted by Hewlett-Packard, and Canon should become the volumeleader by 1998.• Network faxing is becoming a reality, with client/server fax softwarethat allows users to send and receive documents directly from their PCsas an adjunct to e-mail or perhaps in its absence. The same is true withhome PCs. These latter trends are serving to Umit the growth ofstandalone machines capable of scanning.• Numerous efforts are under way to push integrated faxing, printing,scanning, and copying technology. Several integrated systems are onthe market, targeted at small office/home office users.• Group 4-based or ISDN-based faxing continues to be relegated to asmall fraction of the market as line availability, cost, and lack of userinterest limit demand. Color fax remains a very small consideration.Digital Wide Area Network Applications: Recent Market DevelopmentsBefore looking at market and technology directions for digital WANs, letus first look at some basic WAN market trends that wiU affect the nature ofthe opportunity for vendors seUing to that industry.• Digital WAN systems market revenue grew nearly 25 percent in 1996and at an average growth rate of 17 percent through the end of thedecade. Like other areas of the IT industry, the Internet and Web arestimulants of demand. Frame relay, for example, has become one themost popular ways for corporations to hook tiieir Web servers up to thenetwork.• The WAN systems market is also benefiting from the consolidation ofthe concept of corporate intranets. Although there is technically nothingnew about an intranet, the use of groupware (such as Lotus Notes),distributed data bases, and remote access (from home or small branchoffices) is clearly on the rise, stimulating demand for more and fasterWAN equipment.• The availability of cost-effective WAN services from the public carriersis crucial for the expansion of the market. The liberalization efforts inSSPS-WW-FR-9703 ©1997 Dataquest April 14,1997
Communications Applications 29Europe and passage of the telecommunications reform act in the UnitedStates should help set the stage for healthy competition with new servicesand dropping prices on existing services.Market and Technology DirectionsThe following highlights some of the market and technology trends inWAN equipment:• Digital WAN equipment is increasingly being used to extend campusLANs across wide geographic areas. Newer WAN technology can supportserver and real-time video traffic in addition to voice and data.New technologies include a group of fast packet switching approachesincluding frame relay, switched multimega digital services (SMDS),and ATM. Figure 5-4 details some of the differences among thesetechnologies.IFigure 5-4Fast Packet Switching• Key digital WAN equipment includes T/E-1 and 3 carrier multiplexers,fractional and sub-Tl multiplexers, inverse multiplexers, ceU switches(ATM and proprietary), ATM concentrators, frame relay switches andaccess devices (the later known as FRADs), and X.25 packet assembler/disassemblers (PADs) and switches.• Frame relay is rapidly becoming a dominant WAN service in the UnitedStates and Europe as prices drop and it becomes more available.Europe, however, remains a large user of X.25 services. Frame relay is alayer 2 protocol technique and therefore can employ various physicallayer approaches, from 56/64 Kbps to T/E 1 and 3. An estimated 80 percentof frame relay links are 128 Kbps or less today. This is predicted todrop to less than 70 percent by 2000. The two key pieces of equipmentused in frame relay include a frame relay assembler/disassembler(FRAD), which converts LAN packets to and from frame relay frames.The other system is a switch that is capable of directing frame relay frafficto different destinations. The switches can be located either on thecustomer premises or with the carrier. Many of these switches are capableof multiple services, including frame relay, SMDS (IEEE 802.6MAN), and ATM.Packet Switching(Variable-Length Pacltets)Paclcet Switching(Short, Fixed-Length Cells)Frame Relay(64 Kbps to T3speeds;no store andfonward)X.25(uptoTI;store andforward)SMDS(53-byte cells andvariable-lengthpackets;data only, T1 andabove)ATM(53-byte cells;voice, video,and data,T1 and above)1111•Connection-OrientedConnectionlessc ^onnection-Orientec i^Sour ce: Data Communicat ons)723*7SSP S-WW-FR-9703©1997Dataque StApril 14,1997
30 Semiconductor Supply and Pricing Worldwide• ATM is gaining momentum as the WAN service and technology forultimate migration. Its flexibility at providing a variety of services,including voice, data, and multimedia, puts it high in consideration bycorporate MIS departments. ATM-capable, multiservice switches arealready being shipped into carrier points of presence (POPs) and customerpremises alike in the form of so-called edge and enterpriseswitches, respectively. Initially, most ATM traffic is being mapped overT/E carrier WAN lines, but 155 Mbps (OC-3) is available as well. Thefaster OC-12 (622 Mbps) and OC-48 (2.4 Gbps) rates are used in carriercore switches or enterprise (premise) backbones.• Inverse multiplexers are becoming very popular because they are usedto map LAN traffic onto multiple Tl/El Unes, thus avoiding the tariffsof the higher-speed T3/E3.• In general, data service units (DSUs) and charmel service units (CSUs)are being incorporated into multiplexers, remote routers, and otheraccess equipment.Videoconferencing Appiications: iVIaricet and Teclinoiogy DirectionsUnder videoconferencing, Dataquest includes systems that facilitate realtimeaudio/video and data communications. These systems can be fixedin place, roU about on movable carts, or be desktop-based as a PC or workstationenhancement with add-in cards and a camera/microphone input.Video telephones are primarily consumer-targeted items in standaloneform with a buUt-in LCD screen, and they can use the family camcorderfor input and the TV for display. The following comprise some of the principalmarket and product feature trends:• In general, this market continues to gain notoriety as efficient, downsizedcompanies turn to videoconferencing as a means of improvinginternal productivity and customer communications. This technology isfinding great use in vertical markets such as telemedicine, teletraining,and tele-education, where limited professional personnel can be usedmore effectively.• Room systems have served much of the need until recentiy, whenroUabout systems became popular. In general, these systems are integratedwith these main elements: video/audio compression/decompression(codec), displays, cameras, speakers, microphones, computerinterfaces (for presentation, graphics, and scanned images), remote controlunits, and multipoint control units for three-way or more conferences.Perhaps the clearest defining element is the software, whichmanages the user interface, the computer interface, and the telephonenetwork.• Room/roUabout systenis are feature-rich and typically allow 640 x480-pixel resolutions at 30 frames per second (depending upon the typeof line leased). Most of the recent entries from the established videoconferencingplayers support the International Telecommunications Union(ITU) H.320 standard, which is an open standard specifying variousprotocol, formatting, and compression features. The established videoconferencingvendors continue to sell proprietary approaches whilealso supporting the interoperable H.320 standard. H.320 uses the H.261SSPS-WW-FR-9703 ©1997 Dataquest April 14,1997
Communications Applications 31real-time compression standard. A new standard known as H.324enables the use of regular analog phone lines.• Most high-performance videoconferencing setups use a Tl/El(1.5-Mbps to 2-Mbps) or fractional Tl (384-Kbps) link to transfer thevideo, audio, and support data and control signals. Because these Unesare expensive to lease, lower-performance conferencing systems operateover switched 56-Kbps or ISDN basic rate lines (128-Kbps).• The latest incarnation of videoconferencing is the enhancement of thePC or workstation into a personal conferencing system. This systemtoday generally requires one or two add-in boards (including an ISDNor modem connection), a camera, a speaker, and a microphone. Systemscapable of 320 x 240-pixel video at 15 frames per second can cost $2,500.Prices should drop to less than $1,000 per seat as volumes develop (orvice versa).• Desktop videoconferencing should be aided by an initiative establishedby Intel and Microsoft that brings a standard telecommunications applicationsinterface to Windows 95/NT, known as TAPI. This, along withthe display control interface (DCI) capability that supports multiplesoftware and hardware codecs, should aid in software developmentand interoperability. H.320, which typically uses ISDN lines, is nowbeing joined by H.324, which uses traditional analog lines and analogmodems (now^ V.34), as a lower-cost/performance alternative. AnotherITU standard known as T.120 has been devised to support the sharingof data between conferencing desktops. As MPU power increases withPentium Pro and accompanying MMX technology, expect the desktopvideoconferencing solution to improve in quality and for the price perseat to drop. The latter has to do with an increasing number of featuresbeing accomplished as software running on the host.• Video telephones continue to offer the consumer marginal frame rateperformance relative to the price. This market has also suffered from alack of interoperable, multivendor solutions until recently, when H.320and H.324 have been appearing. Newer versions that employ the TV asan output device and the camcorder (or low-cost bundled camera) as aninput device are now hitting the market at under $1,000. The H.324versions that use 33.6-Kbps transfer rate will continue to struggle withperformance levels acceptable to most. The spread of availability ISDN,cable modem, and other types of digital home connectivity is the ultimatestimulant to this market.Premise Switcliing and Gail Processing Applications: IViarlcet andTechnology DirectionsThere are numerous market and technology drivers in the areas ofpremise switching and call processing. Principal trends with voice communicationsequipment such as PBXs, key telephone systems (KTS), voicemessaging (VM) systems, interactive voice response (IVR), and automaticcall distribution (ACD) systems include:• PBXs and KTS wUl remain the central premise equipment in nonresidentialvoice communications. The other voice systems are typicallyused as adjuncts to PBXs. The main market attraction of these systems isfor productivity, and thus they are very sensitive to capital spendingcycles. They are enjoying a general upswing in the developed countriesSSPS-WW-FR-9703 ©1997 Dataquest April 14,1997
32 Semiconductor Supply and Pricing Worldwideand new penetration in places such as eastern Europe, Latin America,and Asia.• KTS phone systems are principally used by smaller companies with twoor more lines. They typically do not require an access code, as PBXs do,but do provide various features such as holding (plus music) and intercom.In general, KTS users are turning to digital processing as newmodels emerge. There are about as many KTS lines shipped as PBXlines. This market is very mature and is expected to remain flat over theforecast period.• PBXs continue to add value by incorporating many new features,including:a Wireless options, with offerings emerging from many, includingEricsson (CT-3), Spectralink, and Northern Telecom. Digital EuropeanCordless Telecommunications (DECT) wireless technology ismentioned often as a solution for wireless offices.• Computer telephony integration (CTI) describes a general trendtoward PBXs being modified to support LAN and WAN environments.Today many PBXs can connect to servers or intelligent hubs,with Novell's NetWare being the most popular network operatingsystem. Microsoft and Intel are evangelizing the TAPI technology asa means of standardizing the software interface to telecom premiseequipment.• Most PBXs can now offer Tl /El and ISDN primary and basic ratetrunk line interfaces. In the future, other WAN features such asATM, T3, routers, and modems are not out of the question as the PBXvendors attempt to do battle with the networking vendors.• PBXs will also tend to offer support for fax and audio/video storeand-forwardas well as real-time support for videoconferencing.• Robust unit growth in voice message systems will continue into smallbusinesses that do not yet have these systems but can afford them.These systems continue to offer more features, including larger messagecapacity, thanks to lower disk drive prices. Some of the market continuesto be absorbed by PBX systems integrating this functionality.• rVR, as a newer technology, continues to emerge as it moves away fromthe United States into other markets. These systems continue to findgood interest from almost any organization (such as banks and perisionfunds) with customer or public support requirements for informationthat can easily be accessed with key telephone button strokes. Improvementsplanned include speech recognition.•, ACDs distribute phone calls to waiting agents (such as airlines agents).They wiU continue to push into smaller operations willing to stay competitive.This function is also being absorbed by PBXs equipped withACD software, but separate functionality remains a robust market.Public Switching and Transmission AppiicationsBackground TrendsKey equipment involved in the public switching and transmission marketsare central office switches and fiber-optic and nonfiber-optic transmissionsystems consisting of primarily digital cross-connects, digitalSSPS-WW-FR-9703 ©1997 Dataquest April 14,1997
Communications Applications 33access transceivers, multiplexers, repeaters, optical, wireless transceivers,power systems, and optical network units. Transmission systemscomprise the local telephone line (local loop), the trunk lines (conduitsbetween switches), and the long distance Unes. In the United States, thereare separate, privately owned local (regional Bell operating companies—RBOCs—or Baby Bells) and long distance telephone service companies(AT&T and MCI, among others) that invest in this equipment. In most ofthe rest of the world, there is generally a single state-controlled PTT oftelephone and data transmission services. There is a trend toward privatizingmany of these, however, and Japan (NTT), the United Kingdom(British Telecom), Germany, (Deutsche Telekom), and Mexico (Telephonosde Mexico) have sold majority stakes of their PTTs to investorinterests.The following describes key trends in the public switching and transmissionmarkets:• Principal new access line shipments wiU occur in eastern Europe, Chinaand the rest of Asia, and Latin America. Line shipments in the UnitedStates, western Europe, and Japan are flat to slightly down during theforecast period because the conversion to digital is nearly completedand replacement economics is taking over.• With liberalization in Europe, Japan, and Latin America and the passageof telecom deregulation legislation in the United States, many newservice providers will be getting into the market. These new competitorsare primarily other phone companies and cable TV companies. Theother phone companies are, for the most part, initially, reselling capacityprovided by the incumbent phone company. These companies areexpected to invest in equipment eventually as they endeavor to differentiatethemselves. The cable MSOs have been investing in someregions by updating trunks with SONET/SDH rings and two-wayvoice- and data-capable transmission and switching.• Internet access has swept in as the major market driver for broadbandlocal loop upgrade, augmenting video-on-demand (VOD) and videodial tone. Internet and World Wide Web access are becoming increasinglymultimedia-intensive as Web pages are loaded with bit-mappedpictures, 3-D animation, video clips, and sounds. Voice communicationsand videocoriferencing via tiie Internet are also being developed.Market and Technology DirectionsAside from deploying and upgrading basic POTS, the most important systemmarket to discuss from a growth standpoint is the installation ofbroadband local loops. Broadband local loop systems wiU be provided totelephone companies and their new competitors (cable MSOs, among others).They will need upgraded capability to provide multimedia-intensiveInternet access and seamless home or remote access to office LANs andserver systems. Table 5-1 presents a comparison of the local loop alternativesand their current status and backers.Fiber Optics-Based Local Loop TechnologyThis includes a whole host of technologies including hybrid fiber coax(HFC), switched digital video (SDV), fiber-in the-loop (FITL), and fiber-tothe-curb(FTTC). These techniques all involve a mixture of fiberSSPS-WW-FR-9703 ©1997 Dataqu est April 14,1997
CO00TJcr>Table 5-1Broadband Local Loop Alternatives33do•vloCOTechnologiesISDN (BRI/PRI)Speed128 Kbps/1.5 MbpsMajor PatronsTelcosStatusFull rollout in Europe/Japan; gettinguntracked in UnitedStatesAdvantagesInfrastructure prosioningCable Modem>10 MbpsCable MSOsTrails/limiteddeploymentBandwidthADSL/VDSL>6 Mbps oneiwayBritish Telecom, BellAtlanticTrailsLeverage installedlinesHDSL384 KbpsTo be determined(possibly telcos)Just introduced3x ISDN performaat same price@HFC/SDV/FTTC/FITL155 Mbps to 2.4 GbpsTelcosTrail/earlydeploymentBest bandwidthCOCO•vlatuI—fCO.ozzCDSource: Dataquest (July 1996)>-aCOCO
Communications Applications 35optics-based transport out to a last few homes or up to the home directly.A solution like HFC, for example, involves taking fiber to an optical networkunit (ONU) and then splitting copper-coaxial cables to pass the fewtens or hundreds of homes that individually tap into the line. The fiberbasedtechnologies provide the ultimate bandwidth option for the telephonecompanies as they compete with the cable TV companies for theright to provide high-speed services. The principal issue slowing deploymentin the meantime remains the cost of tiiese systems, which runs $1,000per residence or more.Digital Modem Local Loop TechnologyThis technology involves extending the life of the existing copper twistedpairwiring through the use of digital transmission techniques.ISDNThe telephone companies around the world are rolling out ISDN basicrate service (up to 128 Kbps). Over 4 million ISDN lines are in operationglobally, and that number should rise to 14 million by the end of thedecade. Germany's Deutsche Telekom is the leader in deployment, havingdropped tariffs dramatically to appeal to a mass market. The same is happeningin the United States and Japan. U.S. telephone companies stillremain somewhat unfocused with regard to ISDN as they consider morepermanent or higher-performance local alternatives.Cable ModemsThis is under heavy trial in the United States and United Kingdom. CableMSO-backed service providers are conducting trials in several sites. Keyissues regarding infrastructure development and end-to-end connectivitywill keep large-scale deployment at bay for at least a year.ADSL/HDSLThis technology, undergoing trial in the United Kingdom, United States,Australia and other areas, can be both a video distribution technology aswell as an Internet access technology. It should be adapted by some carriersas a near-term combatant to cable modems. ADSL will cost at least$1,000 per line initially with a modem at each end. This technology cantake advantage of existing switching and billing systems, among others.VDSL capable of over 50 Mbps over shorter distances is being discussed asa complement to ADSL in certain situations or loops.HDSL as a Tl upgrade technology is being proposed as way of obtaining384-Kbps performance at ISDN prices. This technology holds promise formoving the price/performance in the right direction but seems to lackmarket clout at this point.Wireless Local Loop and DistributionMMDS/LMDS (Multipoint/Local Multichannel Distribution System)Multipoint/local multichannel distribution system (MMDS/LMDS) is awireless cable TV distiibution system that uses distributed transmissionpoints for wireless delivery of TV signals to house-mounted dishes andaccompanying set-top decoder box boxes. The video signals can be fed tothe transmitter sites by land line or satellite downlink. MMDS systemsemploy analog transmission techniques and operate primarily in theSSPS-WW-FR-9703 ©1997 Dataquest April14,1997
36 Semiconductor Supply and Pricing Worldwidefrequencies around 2.5 GHz. The main difference between MMDS andLMDS is that LMDS operates the microwave range at 25 GHz to 28 GHzand is generally being positioned as a two-way technology capable of supportinginteractivity and Internet access. Cellular Vision is one companymaking a system that works in the microwave band. Current subscribershipfor wireless cable is estimated at 1 million homes in the United Statesand 2 million total worldwide.Once the province of smaller cable companies trying hard to reach ruralareas, MMDS is being targeted by at least one group of telephone companiesas a way of deploying TV services quickly and relatively cheaply. Perhapsthe most visible force in MMDS is the TeleTV group, comprising theU.S. telcos Pacific Telesis, Bell Atlantic, and NYNEX. This group hasplaced orders with Thomson Consumer Electronics for 3 million set-topboxes. The set-top box is essentially the same as the company's Digital SatelliteSystem version but sports a radio frequency front end tuned for adifferent broadcast type. TeleTV's platform would employ digital transmissiontechniques with MPEG-2 compression.Wireless Local LoopThis technology entails the use of telco-owned wireless base station transceiversto communicate with transceivers mounted on btiildings andhomes. The attraction of this approach to deploying new phone lines isfast deployment. The disadvantage is cost; wireless can cost over $2,000per subscriber to deploy, which is about double the cost of wireline.There are two leading competing technologies for addressing wirelesssolution: Digital European Cordless Telephone (DECT) and code divisionmultiple access (CDMA). DECT would employ a time division multipleaccess (TDMA) technique with a picocell architecture. CDMA wouldemploy spectrum CDMA access with a technology developed initially forfuU-capabiUty cellular services. The great potential for these technologiesis to provide quick irifrastructure for regions of the world that are receivingtheir first phone service. Preliminary estimates are for 5 million wirelesslocal loop lines to be in service by 2000, up from 1 million today.ATMNearly every telco in the world has some form of ATM service in trial orearly deplojrment. Positioned as both a WAN service and a transport technology,ATM appears ready for a slow but steadily increasing takeoff. Inthe meantime, frame relay and, to some degree, switched multimegabitdata service (SMDS) is where the opportunity is for telephone services andthe equipment they buy. ATM services are ramping up an end-of-thedecadereplacement. ATMs scalablity and support for various serviceclasses (data, voice, and multimedia) should prove irresistible by then asservice prices come down. In the meantime, edge and core ATM switchesand access multiplexers are being installed, as well as WAN multiserviceswitches that employ ATM backbone technology.SSPS-WW-FR-9703 ©1997 Dataquest April 14,1997
IChapter 6The Consumer Applications MarlcetDigital Satellite and Cable Set-Top BoxesDigital set-top boxes represent a fast-growing market for video and audiocompression and processing devices. They also are significant consumersof memory, mainly DRAM, although SRAM and flash also are used insuch systems. The primary type of video compression used in both cableand satellite systems is MPEG-2. For audio, both the MPEG-1 and MPEG-2standards are used, although some systems are beginning to adoptDolby's AC-3 compression technology. In addition to decompression, digitalset-top boxes perform a variety of different types of video and audioprocessing, including demultiplexing, graphics control and acceleration,and NTSC/PAL encoding.fIDVD Video PlayersIn a quest for cost reduction, the market as a whole is transitioning awayfrom a mix of ASICs and standard parts and toward highly integratedASSPs. Analog, digital, and mixed-signal ASSPs all are playing an increasinglyimportant role in new and future set-top boxes and wiU account foran ever-larger percentage of value in those system^s. The cost of memoryused in digital set-top boxes significantly decreased in 1996 as DRAMprices plunged. DRAM costs will continue to decline as more use is madeof integrated video processing ASSPs that employ unified niemory architectures(UMAs).Because of a price war in the digital satellite set-top box market, makers ofthose systems are aggressively cutting costs through integration. Becauseso far they have not been a large-volume product, digital cable set-topboxes are lagging behind their satellite counterparts on the integrationfront. Digital cable boxes also tend to possess a larger amount of differentiation,more microprocessing horsepower, and a higher level of audio/visual processing than satellite systems. Near the end of the century, somenew cable boxes will include audio and video compression capabilities tosupport two-way communication and data storage applications.After a long delay that has created high anticipation among consumerelectronics retailers, manufacturers, and consumers, DVD video playersbegan shipping to the market in Japan and Korea on November 1,1996.Shipments in the United States and other countries started in early 1997.These video players are based on MPEG-2 and AC-3 compression technologyand use shorter-wavelength diodes to allow playback of fuU-lengthmovies from one CD-ROM-size disc. Although early video players willemploy a variety of ASICs and ASSPs in a low-integration solution, therewill be a shift to second-generation products quickly that eniploy highlyintegrated ASSP and ASIC solutions. Many chip companies are targetingthis opportunity with competitive digital and mixed-signal ASSP solutions.The advanced optical storage technology employed in these productsdrives higher costs for the optical electronics and motor drivers. Thechannel and video processing requirements in these systenis are 2.5MB ofSSPS-WW-FR-9703 ©1997 Dataqu est 37
38 Semiconductor Supply and Pricing WorldwideDRAM. These initial video players are playback devices only and usedecoder technology that combines MPEG-2 and AC-3 as mandatory standardswith other optional compression standards.Although the cost for MPEG-2 con\pression chipsets ranges in the thousandsof dollars currently, Dataquest's forecast for this market anticipatesthe development of low-cost MPEG-2 encoding chipsets that wouldenable a mass market for recordable DVD video players. FuU read/writecapableplayers that employ codecs are expected to reach the market bylate 1998 or early 1999. There are also opportunities to create hybrid settopbox and DVD products because of tiie conunon compression technologiesemployed in these products. This forecast does not attempt to projectthe market for these hybrid products.Video CD PlayersAlthough relatively unknown in the Americas and Europe, video CDplayers have achieved high-volume shipments in Japan and Asia/Pacific,approaching a production rate of 10 million units in 1996. With their applicationin karaoke products and the support of a large number of low-costmovie titles, these players are expected to continue on a strong growthpath over the next three to four years even in the face of the DVD videoplayer introduction. These players are based on MPEG-1 compressiontechnology. C-Cube Microsystems Inc. has been a leader in enabling thismarket with its MPEG-1 chipsets. The combined drop in price of CD-ROMdrives and MPEG-1 chips during the latter part of 1995 and 1996 led to asignificant drop in the price for video CD players, which helped pushmarket demand up significantly. The chips in these players are highlyintegrated, and even with the introduction of a new video CD standard,the technology is maturing and has the potential for further cost reductions.The channel/video processing in these players only requires 4Mb ofmemory, which could eventually be integrated with the other logic in thenext level of integration.Next-Generation Video Game ConsolesWith the introduction of the Nintendo 64, the industry has completed itsshift from 16-bit hardware to an emphasis on shipments of next-generation32- and 64-bit video game consoles by all three major players, Sega,Sony, and Nintendo. AU of these systems employ ASICs extensively.However, the Nintendo 64 has achieved the highest level of integration inits design and the most efficient use of DRAM. The Nintendo 64 uses twoRambus RDRAM chips, while the Sega Saturn and Sony PlayStation use avariety of DRAM and VRAM. The high cost of menxory in these systemswas a major cost driver until the major DRAM price erosion in 1996. Thisdrop in n\emory costs helped offset losses experienced by the manufacturersin selling these systems for $199 when introduced. One of the main differentiatorsbetween the Sony and Sega systems and the Nintendo systemis their use of a CD-ROM instead of cartridges for software delivery. Thereis no compression technology employed in any of these systems today.There has been some discussion of eventual migration to DVD drives, butDataquest does not expect this to happen until late 1998 at the earliest.SSPS-WW-FR-9703 ©1997 Dataquest April 14,1997
The Consumer Applications Market 39HDTV/ATV/SDTVThe market for next-generation television currently consists of analoghigh-definition TV (HDTV) receivers in Japan. However, by 1998,advanced television digital broadcast standards should be finalized in theUnited States and in Europe, paving the way for the sale of digital HDTVsystems. In the intervening years, advanced television systems will usepredominately analog components. After that, both digital HDTV anddigital standard definition television (SDTV) platforms should begin totrickle into the market. Such systems will have a semiconductor contentresembling some digital set-top boxes to a degree, with MPEG-2 videodecompression, AC-3 or MPEG-2 audio decompression, and some DRAMfor decompression buffering.IDigital Still CamerasSales of digital cameras are expected to grow rapidly as prices decline. Theyear 1998 is expected to show the strongest unit growth through the endof the century as mainstream camera prices drop into the range of $200 orless. Although digital cameras can replace conventional film cameras,most consumers through the end of the century wiU use them exclusivelyto import images into PCs. Because of this, the available market for digitalcameras is expected to be limited to PC owners and PC buyers through theend of the century. Graphics processing accounts for the majority of thevalue of the semiconductor content in a digital camera. The chargecoupleddevice (CCD) is the single most expensive component in mostdigital cameras, although learning curve reductions in CCD prices shouldhelp reduce digital camera average selling prices (ASPs) significantiy inthe future. To maximize memory efficiency, digital cameras also includecompression engines that use JPEG or a proprietary algorithm. The conipressedimages are stored in flash memory. Flash memory cost reductionsalso should help to further drive down the price of digital cameras.Current digital cameras, which are in their first or second generation,make heavy use of standard digital products. However, as camerasevolve, they are expected to make increasing use of more cost-effectiveASSPs.Otiier Next-Generation Consumer Electronics ProductsProducts included in the other category of this forecast include digitalcamcorders based on the digital videocassette (DVC) standard, DVDaudio players, and other advanced consumer devices that may be intioducedover the next five years. This forecast does not attempt to measurethe size of the DVC compression chip market in digital camcorders.Because the specification for DVD audio is still under discussion, it is notpossible to present a detailed forecast for this product.ISSPS-WW-FR-9703 ©1997 Dataquest April 14,1997
Chapter 7Automotive Applications Marl(etThere is a continuing penetration of various electronic subsystems andcontrols into cars and trucks. Key factors driving the wave of electronicspenetration continue to be public initiatives such as better fuel economy,lower levels of emissions, air bag safety, and a new one that standardizesthe diagnostics/communications system. Consumer demand and productdifferentiation, as in n\ost markets, contribute to the proliferation ofoptions. Figure 7-1 shows that Dataquest estimates that the average vehicletoday has about $653 of modules, systems, and electromechanical content.By 2000, the figure wiU be $951 per vehicle as more electronicintensivefeatures and controls are mixed into the vehicle's overall value.The average car has a dozen or more modules (circuit boards) today,tjrpically located in the passenger or engine compartment.Key trends are as follows:• About 100 new or redesigned vehicles are introduced worldwide eachyear. An estimated 60 percent of these involve new electronics. Assumingsix modules or subsystems per vehicle, there are 350 to 400 newdesign-win opportunities each year• A new class of controls for integrated engine and transmission managementis emerging in the drive train area. A trend toward 32-bit MPUbasedintegrated modules is being stimulated by efficiencies needed foreven higher corporate fuel economy requirements.• Electronics-intensive antilock brakes and air bag controls continue theirpenetration of vehicle shipments. Antilock braking is emerging from itstraditional use on tiucks (two wheels) to be used on high-end cars (fourwheels). Driver-side air bags are becoming standard equipment onalmost every vehicle. Passenger-side air bag versions now are enteringthe market. Side air bags are emerging as an option.• Electronic suspension and steering are beginning to appear on somemodels as the market and vendors evaluate the future of these systems.• Head-up displays (HUDs) appear to be moving from just indicatingspeed to an entire Kst of dashboard, road information, and communicationsdisplays oriented toward keeping the driver's eyes on the road.• Keyless and remote entry and light timers are proving to be popularoptions in a more security-conscious world.• Personalization features such as memory seats, mirror, and radio settingsare now popular on high-end modules.• Entertainment systems are predominantly cassette-based today, withCD-based systems emerging at a modest rate. Intelligent/distributedspeaker systems are becoming more common.SSPS-WW-FR-9703 ©1997 Dataquest 41
42 Semiconductor Supply and Pricing WorldwideFigure 7-1Electronic Module and System ContentDollars1,2001993 1994 1995 1996 1997 1998 1999 200097234BSource: Dataquest (April 1997)To satisfy the California Air Resources Board (CARB) requirement fora common diagnostics interface, SAE J1850 has been adopted in theUnited States. This interface is heading toward serving as the communicationslink between modules. Europe is rolling out a standard calledISO 9141 and two proprietary standards known as CAN and VAN.Electric vehicles are being developed by global manufacturers to satisfyCalifornia's requirement that 2 percent of all vehicles sold in that stateby 1998 be electric {10 percent by 2003). Several manufacturers havechosen a minivan test platform. The most critical challenge is creatingcost-effective battery technology. Nickel metal hydride seems to be theleader at the moment. Electric vehicles now cost about 50 percent morethan gas engine versions. Battery life averages about three years;replacement costs the consumer $3,000. Hybrid approaches are beingconsidered, including advanced flywheel technology. As of early 1996,CARB is relaxing its near-term zero emission requirement as manufacturersrun behind in development. CARB appears to be sticking to itsrequirement of 10 percent by 2003, however. Several electric models areexpected to be offered this year to buyers as manufacturers begin to testthe market.Navigation, Communication, and Smart HigtiwaysMarket trend highlights in the navigation, communications, and smarthighways areas are as follows:• Navigation systems based on dead reckoning and the Global PositioningSystem (GPS) are becoming very popular in Japan and are appearingin the United States and Europe. General Motors has introduced aSSPS-WW-FR-9703 ©1997 Dataquest April 14,1997
Automotive Applications l\/larl
Chapter 8Summary and ConclusionsConclusionsIt can be seen that the semiconductor application market offers tremendousgrowth opportunities for certain companies as overall semiconductorgrowth rates are set to remain high, with a CAGR forecast of13.9 percent from 1995 through 2000. Chapters 4 through 7 were intendedto provide insight into the future directions of the four segments coveredby Dataquest. As mentioned in Chapter 1, more in-depth analysis of semiconductorapplications areas is available from a number of Dataquestprograms.Suppliers' relationships to specific applications are like the chicken-andeggrelationship. Which comes first? Undoubtedly, some suppliers settheir caps at specific application segments and then come up with a strategyto develop selected chips or technologies. They then need to try to getdesigned in with the "key players" in the segment—not necessarily a donedeal for any supplier. On tiie other hand, other companies with specificdesign strengths often develop products with one segment in mind or as asideline from another project, which can have a major sales impact inanother application.Likewise, key players in the market are not just going to wait for Mohammedto come to their mountain. Companies in many cases actively targetcertain semiconductor suppliers to start a sourcing relationship that theydeem product compatible. It is often purchasing that drives this, either asa supply base diversification or to lay the foundation for future sourcingrequirements.Although the overall semiconductor application segment has a brightfuture, it should not be assumed that the rising tide w^ill lift all boats. Farfrom it. The application segments can be cutthroat, and market share leadersoften lead at a loss. Also, in some segments, a company is only as goodas its current product—mind share is not a birthright, it's got to be earned.The purchasing professionals play a pivotal role in the long-term strategiesand survival of companies. Apart from the obvious ones of total costof ownership reductions, strategic supplier selection and maintenance,and providing a real-time technology availability focus for companies,there are other ways in which procurement is vital.In some applications, companies are often growing at mind-boggUng ratesthrough acquisitions and mergers. These other companies are usuallysnapped up to gain entry to a new growth market or to preempt a competitor'smove. Purchasing can often act as a practical focus to help integratethe different management and corporate cultures. It is also vital to leveragenew bujdng power for the greater good of the expanding companyand provide a solid corporate image by issuing common messages tosuppliers, as appropriate.SSPS-WW-FR-9703 ©1997 Dataquest 45
46 Semiconductor Supply and Pricing WorldwideIn more cost-sensitive applications, it is often purchasing facing crucialmake-or-buy decisions on the manufacturing of existing and future productsor modules. This is difficult work but is vital if companies are toremain economically viable.Purchasing must also remember that, regardless of a company's size (inheadcount and current revenue), if it is a leader in its segment, regardlessof how specialized, it will command respect from suppliers focusing on it.Buyers should use this power to ensure the best deal is obtained for theircompanies. After aU, if buyers can't sell their companies to suppliers, whocan?In short, semiconductor revenue will continue to grow at a CAGR of15.4 percent in the next five years, and it will remain fraught with thriUsand spills as pink elephants are sorted from future must-haves. It remainsan area where a great product released at the right time can have a tremendousimpact on the market. The lives of literally milUons of peoplecan be dramatically changed in a short time as new application areas takeoff.The semiconductor application market—may it live long and prosper!SSPS-WW-FR-9703 ©1997 Dataquest April 14,1997
For More Information...Evelyn Cronin, Senior Industry Analyst (408) 468-8075Internet addressevelyn.cronin@dataquest.comVia fax (408) 954-1780Dataquest Interactivehttp://www.dataquest.coinThe content of this report represents our interpretation and analysis of iivfonnation generally available to the publicor released by responsible individuals in the subject companies, but is not guaranteed as to accuracy or completeness.^^It does not contain material provided to.us in confidence by our clients. Reproduction or disclosure in whole or inIJO TO/^1 l^^CT part to other parties shall be made upon the written and express consent of Dataquest.^"^ **^^%tr ©1997 Dataquest—Reproduction ProhibilEdA Gartner Group Company Dataquest is a registered trademark of A.C. Nielsen Company
DATAQUEST WORLDWIDE OFFICESNORTH AMERICAWorldwide Headquarters251 River Oaks ParkwaySan Jose, California 95134-1913United StatesPhone: 1-408-468-8000Facsimile: 1-408-954-1780East Coast HeadquartersNine Technology DrivePC. Box 5093Westborough, Massachusetts 01581-5093United StatesPhone: 1-508-871-5555Facsimile: 1-508-871-6262Dataquest Global Events3990 Westerly Place, Suite 100Newport Beach, California 92660United StatesPhone: 1-714-476-9117Facsimile: 1-714-476-9969Sales Offices:Washington, DC (Federal)New York, NY (Financial)Dallas, TXLATIN AMERICAResearch Affiliates and Sales Offices:Buenos Aires, ArgentinaSao Paulo, BrazilSantiago, ChileMexico City, MexicoEUROPEEuropean HeadquartersTamesis, The GlantyEgham, Surrey TW20 9AWUnited KingdomPhone: +44 1784 431 611Facsimile: +44 1784 488 980Dataquest FranceImmeuble Defense Bergeres345, avenue Georges ClemenceauTSA 4000292882 - Nanterre CTC Cedex 9FrancePhone: +33 1 41 35 13 00Facsimile: +33 1 41 35 13 13Dataquest GermanyKronstadter Strasse 981677 MiinchenGermanyPhone: +49 89 93 09 09 0Facsimile: +49 89 93 03 27 7Sales Offices:Brussels, BelgiumKfar Saba, IsraelMilan, ItalyRandburg, South AfricaMadrid, SpainJAPANJapan HeadquartersAobadai Hills 4-7-7AobadaiMeguro-ku, Tokyo 153JapanPhone: 81-3-3481-3670Facsimile: 81-3-3481-3644ASIA/PACIFICAsia/Pacific HeadquartersSuite 5904-7, Central Plaza18 Harbour Road, WanchaiHong KongPhone: 852-2824-6168Facsimile: 852-2824-6138Dataquest KoreaSuite 2407, Trade Tower159 Samsung-dong, Kangnam-guSeoul 135-729KoreaPhone: 822-551-1331Facsimile: 822-551-1330Dataquest TaiwanllF-2, No. 188, Section 5Nan King East RoadTaipeiTaiwan, R.O.C.Phone: 8862-756-0389Facsimile: 8862-756-2663Dataquest Singapore105 Cecil Street#06-01/02 The OctagonSingapore 069534Phone: 65-227-1213FacsimUe: 65-227-4607Dataquest Thailand12/F, Vanissa Building29 Soi ChidlomPloenchit RoadPatumwan, Bangkok 10330ThailandPhone: 662-655-0577Facsimile: 662-655-0576Research Affiliates and Sales Offices:Melbourne, AustraliaBeijing, ChinaDataquestA Gartner Group Company©1997 Dataquest
FILE COPY:MARIA VALENZUELA<strong>DataQuest</strong>1997 Semiconductor Industry CapitalSpending OverviewFocus ReportProgram: Semiconductor Supply and Pricing WorldwideProduct Code: SSPS-WW-FR-9702Publication Date: March 3,1997Filing: Reports
I1997 Semiconductor Industry CapitalSpending OverviewIFocus Report»Program: Semiconductor Supply and Pricing WorldwideProduct Code: SSPS-WW-FR-9702Publication Date: March 3,1997Filing: Reports
1997 Semiconductor Industry Capital Spending OverviewIiTable of ContentsPage1. Executive Summary 1Capital Spending Overview 1Checkpoint: Looking Past 1997, Setting Up for Growth in 1998 1What Happened? 1How Are Semiconductor Companies Responding? 2When and How Will the Recovery Occur? 2Highlights on the Wafer Fab Equipment Market 3Dataquest Perspective 32. Semiconductor Capital Spending Forecast 5Chapter Highlights 5Capital Spending Tables 6And the Spending Binge Comes to an End 6How Long Will This Downturn Last? How Will CapacityBe Absorbed? 10Are Spending Levels Forecast Too High Relative toSemiconductors? 12Before 1985: An Immature Manufacturing Industry 121985 through 1992: Becoming Manufacturing-Smart 131993 through 2001 (?): Growth 13Beyond 2001: A Maturing Manufacturing Infrastructure 14The Americas Market Will Exhibit Strategic Strength Long Term 14Japan: DRAM Capacity Additions Stop, Investment inTechnology Under Way 15Europe Sustains Presence as a Growth Market 16Asia/Pacific Investing Focusing on Foundry as DRAM Falls 17Who's Investing Where? 183. Capital Spending Analysis 21SSPS-WW-FR-9702 ©1997 Dataquest March 3,1997
Semiconductor Supply and Pricing WorldwideList of FiguresFigurePage2-1 Capacity Trickle in the Semiconductor Industry Today 11f4SSPS-WW-FR-9702 ©1997 Dataquest March 3,1997
1997 Semiconductor Industry Capital Spending OverviewList of TablesTablePage2-1 Semiconductor Capital Spending—Top 20 Spenders, Comparisonof 1995 and Projected 1996 Worldwide Capital Spending 72-2 Historical Worldwide Capital Spending by Region, IncludesMerchant and Captive Semiconductor Companies 82-3 1995-2001 Forecast of Worldwide Capital Spending by Region,Includes Merchant and Captive Semiconductor Companies 82-4 Regional Investment Patterns of SemiconductorManufacturers in 1995 182-5 Regional Investment Patterns of Semiconductor Manufacturersin 1996 19ISSPS-WW-FR-9702 ©1997 Dataquest March 3,1997
Cliapter 1Executive Summary ^^.^^^^.^^^..^^^.^^^^Capital Spending OverviewCapital spending patterns of semiconductor suppliers (or potential suppliers)is a good gauge of how a company responds to market competitionand what its future plans are. Semiconductor users utilize this informationto compare their strategic plans with their supply base in order to makeadjustments on long-term arrangements if divergent spending levelsoccur.Analysis done by Dataquest's Semiconductor Equipment, Materials, andManufacturing program here highlights the major trends of semiconductorcompany capital spending along with a capital spending forecast.Capital spending on semiconductor equipment directly relates to semiconductorunit supply. Knowledge of the industries' capital spending incomparison with aggregate end market demand trends can help in semiconductorprice negotiations. For example, if a large level of capital spendingis not offset by a like increase in unit demand, the potential for anover-supplied market exists. Early knowledge of the situation can benefitusers during price or delivery negotiations.Clieckpoint: Looking Past 1997, Setting Up for Growtli in 1998Overcapacity in the DRAM market, created by the massive spending from1994 through the first part of 1996 and the normal DRAM product migration,finally took its toll, resulting in a f aster-than-expected contraction inthe wafer fab equipment market. We expect this contraction to be sharpand relatively deep but slightly shorter than historical norms, around 18 to24 months. The key reason for the belief that the slowdown will be shorterthan normal is the continued robust forecast for PC unit shipment growththrough this decade.What Happened?Although Dataquest has been forecasting since 1995 that a DRAM oversupply-drivencapital spending slowdown would occur in 1997, the swiftnature of its arrival still has shock value. We should point out why wewere looking for a slowdown in capital spending.The industry migration from 4Mb to 16Mb DRAMs would cause overcapacityeven in the face of a high bit demand growth. Why? Die size relationshipsmean that the average 16Mb DRAM has two to three times morebits per square inch than the 4Mb generation. Because capacity in theindustiy is built in wafers, this event causes a step-function increase in bitcapacity of the industry. This usually happens in a hurry and is triggeredby the new generation hitting a critical yield level of about 65 percent, estimatedto have been hit by the end of 1995.SSPS-WW-FR-9702©1997 Dataquest
Semiconductor Supply and Pricing WorldwideThe complicating factor, and the reason for the severity of the dow^nturntoday, was the artificial demand created in 1995 by the anticipation ofWindows 95, which, taken with the tight supply of memory last year,caused inventories to inflate to enormous levels. This corrected in the finalquarter of last year, slightly in advance, but essentially on top, of the conversiontiming, and now we have a double-barreled driver (demand andsupply) for the DRAM price slide and capital spending downturn. Theseevents together have increased the anticipated severity of the downturn.How Are Semiconductor Companies Responding?It is very normal in this type of a downturn to get a pocket of companiesthat will stay and continue to invest in the infrastructure. These companiestoday are IBM, Texas Instruments, and, on a moderate level, the Koreancompanies. Japanese companies, w^hich w^ere the companies that held onin the last cycle for a year or more, have already shut off spending, andthese companies as a group w^ill spend slightly less in dollar terms in 1996than in 1995. Except for Taiwan Semiconductor Manufacturing Co.,Chartered Semiconductor, and Macronix, Asian companies are cuttingback dramatically, starting in the last couple of months. As a group, theDRAM manufacturers are responding more rapidly to the situation, cuttingspending faster than in previous cycles.The industry must now rely on the continued growth in personal computerunit sales, with added growth in telecommunications and networkingproducts to create a unit demand picture that will keep this slowdownshort-lived from a historical perspective. The wafer fab capacity bubblehas burst in all regions and for most semiconductor products, most notablyDRAMs, mixed-signal devices, and analog devices. Whereas the 1995spending growth was almost entirely driven by DRAM and microcomponentcapacity purchases, 1996 was a year of transition, and 1997 will be ayear of investment in technology.Wlien and How Will the Recovery Occur?Based on how capacity is migrating among device types, we believe thefirst areas of spending recovery will be in the advanced logic area, as earlyas mid-1997. Equipment companies positioned for these markets will havea more moderate slowdown and perhaps can grow through this time ifthey have advanced technology. The MCU, analog, mixed-signal, and telecomchip capacity will be next to recover, but probably not until the end of1997 or early 1998. The DRAM segment, the root cause of the problem andthe very last to recover, is not expected to resume robust spending untilmid-to-late 1998. The next major and broad investment cycle will havemomentum by 1999.Dataquest beUeves that capital spending may be influenced in late 1997through 1999 positively with the facility construction and purchase ofequipment toward the world's first 300mm wafer fab. We have built thisinfrastructure investment into our model. However, our outlook for asignificant 300mm equipment market will wait until well after 2000.SSPS-WW-FR-9702 ©1997 Dataquest March 3,1997
Executive SummaryiHighlights on the Wafer Fab Equipment MarketWafer fab equipment spending is expected to grow 14 percent worldwidein 1996. The only reasons that 1996 remains a double-digit growth year arethat there were strong backlogs coming out of 1995 and increased spendingby some companies early in the year.M*.--•jBAfter three and a half strong expansion years from 1993 through 1996,equipment purchases in 1997 should decline markedly, followed by anessentially flat 1998. Investment in DRAM capacity will be curtailed asproducers elect to convert their 4Mb DRAM capacity to 16Mb, which addsbit capacity through the instant increase in bits per square inch. Also,many Japanese DRAM facilities now running 150mm w^afers will convertto 200mm wafers, further delaying the need for new equipment. DRAMsensitiveequipment technologies or capital-intensive segments will beaffected more than logic-sensitive technologies. The next expansionshould kick in by 1999, driven by 0.3-micron to 0.35-micron capacityexpansion.During the coming slowdown, there will be two kinds of purchasingbehavior that equipment companies can take advantage of to buffer salesdeclines. The first behavior is tied to which types of capacity will berequired early in the recovery cycle. If there is a heavier dependence onadvanced logic or supply to the materials industry, these segments willfare better than DRAM or semiconductor capacity dependent segments.Included in this category are the segments of nontube CVD, sputtering,metal etch, silicon epitaxy, maskmaking lithography, process control systemsin the materials business, and rapid thermal processing (RTF).The second purchasing behavior that wiU be prevalent over the next 12 to18 months will be new processes and equipment directed at solving issuesfor 0.35-micron and 0.25-micron manufacturing. These segments will bethose related primarily to deep-ultraviolet (deep-UV) lithography andinspection and 0.25-micron multilevel metallization schemes.Dataquest PerspectiveOur forecast for capital spending and wafer fab equipment sales duringthe next six years assumes the excessive growth in 1995, which carriedover into the first half 1996, will be sharply corrected in 1997. Our outlookfor the future includes moderated growth in equipment spending in 1998,accelerating into the start of another boom in 1999, likely lasting intoearly 2001.Where the PC goes, so go semiconductors. This is true from the perspectiveof the business forecast as well as the production line. Europe andAsia/Pacific, with very large capital spending upticks over the last severalyears—and expected to continue that trend—will continue to gain share inworld production over the next several years.The shifts and currents in semiconductor production trends mean thatequipment and material suppliers wUl absolutely need a global presencein every sense of the word to remain competitive in the market. Productsupply can no longer depend on local trends, as all major semiconductorcompanies have made it clear they are investing on a worldwide basis.SSPS-WW-FR-9702 ©1997 Dataquest March 3,1997
Semiconductor Supply and Pricing WorldwideHowever, local service and support are required to maintain customersatisfaction.Taiwan is clearly the new major production growth area. We wouldexpect Malaysia and Thailand to be the next major growth countries inthree to five years. Evidence of this includes recent joint-venture fabannouncements by Texas Instruments and others. Silicon plants are nowbeing strategically placed, such as Shin-Etsu Handotai's Malaysian plantand recently announced joint venture in Taiwan, Komatsu's joint venturewith Formosa Plastics in Taiwan, and MEMC Electronic Materials' jointventures in Korea (Posco-Hiils), Taiwan (Taisil), and Malaysia (MEMC-Kulim).iFurther, the concept of contract manufacturing in semiconductors isclearly here to stay. Equipment and material suppliers could find themselvesselling their technical products to an international team from severalcompanies, including the manufacturer and the designer. Howeverthe emergence of the dedicated foundry company taking ownership of theprocess and manufacturing flow will tend to centralize this activity.Dataquest has started a research program—Semiconductor ContractManufacturing Seervices Worldwide—to continue exploring the keytrends in contract manufacturing and foundries, including technologytrends and supply/demand balance through the decade.Contributing Analysts: Ron Dornseif, Clark Fuhs, Mark Giudici, andYoshihiro ShimadaSSPS-WW-FR-9702 ©1997 Dataquest IVIarch 3,1997
Chapter 2Semiconductor Capital Spending ForecastThis chapter presents data on worldwide semiconductor capital spendingby region. Capital spending in a region includes spending by all semiconductorproducers with plants in that region. Components of capital spendingare property, plant, and equipment expenditure for front-end andback-end semiconductor operations.Chapter HighlightsThis chapter w^ill discuss the foUow^ing highlights:• On the heels of booming growth of 74 percent in 1995, global semiconductorcapital growth will slow to 18 percent in 1996 to $45.3 billion.With excess capacity clearly present in the industry for the next yearor two, capital spending is expected to contract 10 percent in 1997 andmodestly recover in 1998 before the next capacity cycle starts in late1998 into 1999.• Capital spending in the Americas region grew at an accelerated 69 percentin 1995, with most of the investment growth in 1995 comingfrom U.S. companies connected with ASIC and logic products. Capitalspending is decelerating in 1996 into 1997, but we expect that investmentin advanced technology, coupled with the earlier capacity upturnfrom the advanced logic segment, will stabilize the region's spendinglater in 1997 and will lead the market's recovery in 1998 and 1999 as itdid in 1993. We expect the Americas region to be the second-fastestgrowingmarket as foreign multinationals and foundry company investin capacity in the United States.• Japan's 49 percent increase in capital spending in 1995 is only 37 percenton a yen basis, as Japanese companies look to invest outside Japan tooptimize buying power. Japanese spending has essentially stoppedgrowing and will actually decline about 2 percent in 1996. Because ofthe early cutback in spending, 1997 remains a flat capital spending yearas well, with only modest growth in 1998. Lagging investment patternsin Japan are expected to continue throughout the decade.• Japanese companies, however, grew spending during 1995 about58 percent worldwide, spending a total of $12.0 billion, second only toAmericas company spending of $13.8 billion and well ahead of theAsia/Pacific companies' $9.1 billion level. In 1996, however, with thequick brakes the Japanese have put on spending, Asia/Pacific companieswill surpass Japanese company spending.• Although spending on capacity has essentially stopped in Japan, twoother types of investments are likely to be important in Japan nowthrough 1998. First, Japanese companies will invest in any new technologyand equipment targeted at the 0.25-micron production arena.Second, the Japanese companies will build shells in 1996 and 1997, initiallyat very low run rates, as a preparation to ram.p when the marketturns up.SSPS-WW-FR-9702©1997 Dataquest
Semiconductor Supply and Pricing WorldwideCapital Spending TablesWe are looking for continued growth for Europe of 22 percent in 1996 asproduction continues to ramp from Siemens, SGS-Thomson, and eightnew fabs, most notably by GEC-Plessey and TEMIC. However, in partbecause we do not believe Siemens can sustain its current spending, weare calling for a 12 percent decline in spending in Europe for 1997 and aflat-to-down 1998 as we expect multinationals will ramp domesticmemory fabs before Europe. Longer term, we still see Europe as asignificant growth region for spending through the decade.The often erratic but sustained semiconductor capital spending growthin the Asia/Pacific region continued at the explosive rate of 112 percentin 1995. We expect a "moderated" growth of about 30 percent in 1996 asseveral new fab projects are built and equipped. However, the tidehas turned in the DRAM area, and we are forecasting the Asia/Pacificregion to be hit the hardest in 1997, with a nearly 15 percent decline incapital spending. Longer term, we expect Asia/Pacific to exhibit one ofthe most aggressive growth rates in capital spending of any region.However, several Asia/Pacific companies continue v/ith their plannedprojects in expansion of foundry capacity, and new entries continue tobe announced, with more expected. The reason for the continued interestin spending capital in this area comes from the fact that the corebusiness is dependent on logic and PC unit demand rather than DRAM.The foundry industry is now a strategic industry rather than simply atactical one.A final list of the top 20 semiconductor capital spending conipanies in1996 is presented in Table 2-1. Capital spending details by region are providedin two tables in this chapter. Table 2-2 shows historical semiconductorcapital spending by region for the years 1988 through 1995. Table 2-3shows the capital spending forecast by region for the years 1995 through2001. Yearly exchange rate variations can have a significant effect on theinterpretation of the data for 1988 through 1996.And the Spending Binge Comes to an EndAfter a 24 percent growth in semiconductor capital spending in 1993,accelerated growth of 54 percent followed in 1994, and growth has nowpeaked at 74 percent worldwide during 1995. Based on our most recentcapital spending survey, 1996 will have markedly slower growth of nearly14 percent. Nearly all of this growth has already occurred in the first halfof tiiis year, and we expect the spending contraction to begin in the secondhalf of 1996, spilling into 1997.The industry is now relying on the continued growth in PC unit sales,with added growth in telecommunications and networking products, tocreate a unit demand picture that will keep this slowdown short-Uvedfrom a historical perspective. The wafer fab capacity bubble has burst inaU regions and for most semiconductor products, most notably DRAMs,mixed-signal devices, and analog devices. The 1995 spending growthwas almost entirely driven by DRAM and microcomponent capacitypurchases, 1996 is a year in transition, and 1997 will be a year of investmentin technology.SSPS-WW-FR-9702 ©1997 Dataquest l\^arcli 3,1997
Semiconductor Capital Spending ForecastTable 2-1Semiconductor Capital Spending—Top 20 Spenders, Comparison of 1995 and Projected1996 Worldwide Capital Spending (Millions of Dollars)1995Rank13125941016614872131711221815441996Rank1234567891011121314151617181920CompanyIntelLG SemiconTexas InstrumentsSamsungHyundaiNECIBM MicroelectronicsSiemens AGToshibaMicron TechnologyHitachiFujitsuMotorolaSGS-ThomsonMatsushitaMitsubishiTSMCChartered SemiconductorPhilipsWinbondTotal Top 20 CompaniesTotal Worldwide Capital SpendingTop 20 Companies Percentage of Total19953,550.02,258.11,079.31,946.61,492.02,010.11,150.0850.01,624.1960.01,497.61,592.12,530.01,001.0846.61,118.2583.9786.7959.0117.827,953.038,410.872.819963,400.02,747.52,300.02,247.92,123.81,808.71,550.01,450.01,437.71,400.01,296.71,275.41,150.01,000.0962.8927.6901.8872.3841.0700.030,393.243,707.169.5Change(%)Note: Specific company information not available for Japanese companies. However, Dataquest estimates that as a group, Japanesecompanies will spend 12 to 15 percent less in 1997 versus 1996.Source; Dataquest (March 1997)-4.221.7113.115.542.3-10.034.870.6-11.545.8-13.4-19.9-54.5-0.113.7-17.054.410.9-12.3494.28.713.8SSPS-WW-FR-9702 ©1997 Dataquest Marcti3,1997
Semiconductor Supply and Pricing WorldwideTable 2-2Historical Worldwide Capital Spending by Region, Includes Merchant and CaptiveSemiconductor Companies (Millions of Dollars)1989199019911992199319941995CAGR (%)1989-1995North America3,8334,3203,8954,1354,9437,19412,17018.8Percentage Growth15.512.7-9.86.219.545.569.2Japan5,4155,7325,7023,9584,4136,6679,9109.6Percentage Growth21.65.9-0.5-30.611.551.148.6Japan (Billions of Yen)7488267875004916799312.0Percentage Growth29.210.4-4.7-36.4-2.038.337.1Europe1,1981,5981,2481,1881,7382,5044,13717.2Percentage Growth26.033.4-21.9-4.846.344.065.2Asia/Pacific-ROW1,8841,5802,3002,3183,2385,72012,19440.6Percentage Growth84.1-16.245.60.839.776.6113.2Worldwide12,33113,23013,14511,59914,33322,08538,41123.8Percentage Growth26.57.3-0.6-11.823.654.173.9Source: Dataquest (March 1997)Table 2-31995-2001 Forecast of Worldwide Capital Spending by Region, Includes Merchant andCaptive Semiconductor Companies (Millions of Dollars)1995199619971998199920002001CAGR (%)1995-2001North America12,17014,18513,91015,42718,72923,44227,47014.5Percentage Growth69.216.6-1.910.921.425.217.2Japan9,9109,3628,1609,10211,72315,54117,4249.9Percentage Growth48.6-5.5-12.811.528.832.612.1Japan (Billions of Yen)9311,0099171,0231,3181,7471,95913.2Percentage Growth37.18.5-9.111.528.832.612.1Europe4,1374,7564,2284,2095,5637,1958,30812.3Percentage Growth65.215.0-11.1-0.432.229.315.5Asia/Pacific-ROW12,19415,40511,20511,03514,59923,31231,6270Percentage Growth113.226.3-27.3-1.532.359.735.7Worldwide38,41143,70737,50339,77350,61469,49084,82914.1Percentage Growth73.913.8-14.26.127.337.322.1Source: Dataquest (March 1997)SSPS-WW-FR-9702 ©1997 Dataquest Marcli3,1997
Semiconductor Capital Spending ForecastThe first companies to cut back were the U.S. companies, as they tend tobe more driven by short-term cost issues. The most severe slowdown incapital spending that is occurring today is in Japan, as the overcapacity inDRAM has caused Japanese companies to quickly draw the purse stringsin hope of avoiding a more serious price erosion. The spending plans havealready started to be cut back within DRAM companies in Taiwan, and wewould expect this spending cutback to extend into Korea in late 1996 into1997.But meanwhile, the big three Korean companies are increasing spendinga more modest 27 percent to a combined $7.2 billion in 1996, which is stillabove the industry in terms of growth. This above-industry growth hasn\eant that all three large Korean companies are in the top five for capitalspending in 1996, as was shown in Table 2-1. As noted earlier, Japanesesuppliers of memory cut back investment early in this cycle. Japanesecompanies as a group will actually spend 7 percent less in 1996 in dollarterms (6.5 percent growth in yen tern\s). As a result, only two Japanesecompanies appear in the top 10 capital spenders in 1996—NEC andToshiba. Most of the other Japanese companies do appear in the second10. Intel still heads the Ust for 1996, as the microprocessor giant demandcontinues to be strong on a unit basis. Intel's capital spending growth hasslowed primarily because yield ramps on its new fabs have been betterthan expected, so Intel therefore needs less equipment to produce thesame unit volume. Motorola, the long-time No. 2 spender, has dropped toNo. 13 as the demand for telecom-related chips softened in conjunctionwith the overcapacity in this area.A mostly new crowd of Taiwanese companies that entered the DRAMmanufacturing business, spending over $1 billion collectively in 1995,increased spending feverishly in the first half of 1996 and has likely spentmore than in all of 1995 already. However, the spending planned for thesecond half of the year has been predominantly delayed, mostly into 1997,likely later, and, in some cases, indefinitely (read late 1998 or 1999).TSMC debuts on the top 20 list for 1996 with an estimated $901 millionspent on capacity, as foundry capacity expansion has now evolved into amajor trend. TSMC and Macronix, a company that we understand doessome second-source work for TSMC, are the two major Taiwanese companiesstill maintaining the spending plans set early in the year for 1996. Thisindustry has transformed into a dedicated bona fide business and is nolonger a specialized way to use excess capacity. There are several companiesthat we understand will try to enter the foundry business as a resultof today's overcapacity. Unless these companies commit to the foundrybusiness in the long term, their success at entering the market will belimited. Gone are the days when the "temporary" foundry can exist.Customers of foundry are now requiring long-term relationships andcontracts for winning their capacity business.It is very normal in this type of a downturn to get a pocket of companiesthat will stay and continue to invest in the infrastructure or that haveniches that maintain growth, thus supporting an increase in spending.These companies in 1996 include IBM (advanced 16Mb DRAM to supportsystems), Texas Instruments (primarily digital signal processors, or DSPs,and logic), TSMC (foundry), Siemens (advanced DRAM), and CharteredSSPS-WW-FR-9702 ©1997 Dataquest Marcli3,1997
10 Semiconductor Supply and Pricing WorldwideSemiconductor (foundry). All of these companies have continued toincrease investment during 1996. Micron Technology may be the surpriseof 1996 to some, particularly because it has delayed the Lehi, Utah, fab.However, it has been spending aggressively in Boise, Idaho, upgradingthe facilities for 200mm production and advanced technology for the16Mb generation. We would expect Micron to return to 1995 levels at leastin 1997.With the cutback of the big Japanese players in the industry and withsome smaller companies continuing to be aggressive in spending plans,the concentration of capital spending by the top 20 has decreased in 1996by a few percentage points to 69.5 percent.How Long Will This Downturn Last? How Will Capacity Be Absorbed?Our longer-term forecast projects that this contiaction will be sharp andrelatively deep, but slightly shorter than historical norms, about 18 to24 months. The key reason for the belief that the slowdown will be shorterthan normal is the continued robust forecast for PC unit shipment growthworldwide through this decade, driving the need for silicon. We also donot see a stoppage in advanced technology investment, indicating a beliefin the customer base of a strong end-user market for semiconductors.Overall semiconductor product demand is expected to remain stionglonger term, with sustained growth through 2001 with a compoundarmual growth rate (CAGR) of 15.5 percent.How will the industry recover? What are the anticipated dynamics?Today, the industiy is primarily experiencing a DRAM oversupplycoupled with a product transition. In order to determine how capitalspending may recover, it is important to understand how this excesscapacity may migrate or tiickle to other areas in semiconductor capacity.There are two general blocks of capacity now available from today's conditions(see Figure 2-1). These two blocks are being redirected into othersemiconductor product areas today. The first com^prises old 4Mb DRAMfabs that cannot run 16Mb chips. These are limited to two-level metal andare 0.6-micron to 0.8-micron technology. Microcontrollers, telecommunicationschips, mixed-signal ICs, and analog ICs are quite happy being processedin these fabs. It is likely that most of these fabs in Japan and some inKorea will migrate into this area. The power and discrete chips have specializedprocesses not found in old DRAM fabs, so these segments are relativelyisolated from extraneous supply impacts because significant timeand money is required to convert. We therefore expect capital spendingpatterns to be closely tied to demand in this specialty segment.The second block of capacity comprises idle or underused advanced 16Mbcapacity, w^hich is limited today to two-level metal but at 0.4 micron to0.5 micron. Because these fabs generally lack the process sequences of selfalignedsilicide and three-level metal or more (which requires chemicalmechanical polishing at 0.5 micron), they cannot be effectively redirectedto advanced logic or fast SRAM. Therefore, they are limited to commoditySRAM, flash, other nonvolatile memory, or a limited span of logic products.We expect most of these plants to remain somewhat idle through theovercapacity period.SSPS-WW-FR-9702 ©1997 Dataquest March 3,1997
Semiconductor Capital Spending Forecast 11Figure 2-1Capacity Trickle in the Semiconductor Industry TodayOld 4MbFabs: 0.6-0.8MicronDRAM Overcapacity1Idle 16MbFabs: 0.4-0.5MicronRecovery LastrMCU, Analog, 1Mixed Signal 1Commodity SRAM, 1Flasti Memory 1Recovery SecondPower, Discretes 1 Recovery First^ >rFast SRAMs, 1Advanced Logic 19716W-Source: Dataquest (February 1997)Based on how this capacity is migrating, we believe that the first areas ofspending recovery will be in the advanced logic area, as early as mid-1997.Equipment companies positioned for these markets will have a moremoderate slowdown and perhaps can grow through this time if they haveadvanced technology. The MCU, analog, mixed-signal, and telecom chipcapacity will be next to recover, but probably not until the end of 1997 orearly 1998—Motorola will be a key company to watch. The DRAM segment,the root cause of the problem and the very last to recover, is notexpected to resume robust spending until mid-to-late 1998. The next majorand broad investment cycle will have momentum by 1999.Our model does not include significantly more 16Mb DRAM capacityexpansion until late 1998 into 1999. In the two "pause" years, we believeDRAM manufacturers will concentrate on converting capacity away from4Mb toward 16Mb, which increases bits per square inch processed, thenconcentrate on shrinks to squeeze out value per square inch before a capitalcycle starts again. Further, in Japan, we expect that many 4Mb/16Mbfabs now running 150mm wafers will convert to 200mm wafers, furthergaining efficiency and productivity from the capital investment. Althoughthis will increase the demand for silicon and 200mm wafers, it will likelydelay the capital spending cycle by six to nine months.»Through 2001, we project a six-year worldwide capital spending CAGR of16.7 percent, slightly ahead of the semiconductor consumption growth.We believe that capital spending may be influenced in late 1997 through1999 positively with the facility construction and equipment purchases forthe world's first 300mm wafer fab. We have buUt this infrastructureinvestment in our model.SSPS-WW-FR-9702 ©1997 Dataquest Marcii3,1997
t? Semiconductor Supply and Pricing WorldwideA couple of years ago, Dataquest introduced a model that quantifies theoverinvestment and underinvestment picture for wafer fab equipmentand semiconductor capacity. Although the early 1990s created and sustaineda net underinvestment, this picture was corrected to create abouta 37 percent overinvestment by the end of 1995. Clearly this was in thedanger zone, and we are seeing the results of this overinvestment today.By the end of 1998, should our forecasts for investment and semiconductordemand be on target, we would expect the industry to return to a16 percent net underinvestment, setting the stage for a robust recoverystarting in 1999,Are Spending Levels Forecast Too High Relative to Semiconductors?As capital spending as a percentage of semiconductor revenue exceeds27 percent in 1996, clearly high by historical standards and creatingovercapacity, a question is being asked often. What spending level isdangerous? What spending level is normal?The industry normally cycles through overcapacity and undercapacity,because there is an inherent lag time between capital investment decisionsand productive capacity. This will never go away. But we are experiencinglevels of spending today that we have not seen since 1984; should wereturn to the spending levels of the late 1980s, the current downturn willclearly last longer than we are forecasting.We think the industry is structured differently today, and there is a validreason why higher levels of investment as a percentage of revenue than inthe late 1980s are justified today.We would split the market into four periods: before 1985,1985 to 1992,1993 to 2001(?), and 2002 and after. We will describe the conditions andtrends in the production market and manufacturing infrastructure duringthese periods.Before 1985: An Immature Manufacturing IndustryCharacteristics of the period are:• The semiconductor manufacturing infrastructure was fairly immature,characterized by large integrated systems companies, mostly in theUnited States.• Manufacturing technology was favored over efficient use of capital, anddevice performance was favored over yield.• Capital equipment manufacturers did not assume complete ownershipof processes and system performance.• These factors led to a capital spending ratio between 26 percent and30 percent of revenue.Two things happened to change the structure. First, the semiconductordownturn in 1985 ended up being extremely bloody, and, second, theemergence of the Japanese producer introduced a true manufacturingefficiency element into the infrastructure.SSPS-WW-FR-9702 ©1997 Dataquest March 3,1997
Semiconductor Capital Spending Forecast 131985 through 1992: Becoming Manufacturing-SmartThe Japanese manufacturing ethic and the losses incurred during the 1985downturn introduced the need for the industry to become more efficientin its manufacturing infrastructure. Several things happened:• A focus developed on manufacturing productivity and yield.• SEMATECH was formed, in part as a result of the need to coordinatethis effort in the United States.• Equipment companies were expected to take, and accepted, the ownershipof the process and system performance parameters.• Equipment performance and productivity increased substantially.• Fab factory automation migrated from robotics to computer-controlledsystems, and statistical process control became commonplace.• The emergence of the Korean manufacturing power provided momentumfor this transition.By 1992, manufacturers had increased yields, and fab productivity was updramatically. During this period, it was natural for the industry not to berequired to spend as much on capital equipment, because the return perdollar spent was very high. Capital spending decreased to an artificiallylow 18 percent of revenue, on average.Once yields achieved high levels and system productivity approached thepoint at which it was impractical to continue for most equipment types (todo otherwise would mean decreased equipment utilization), the returnfrom these activities were diminished. The industiy then entered the nextperiod.1993 through 2001 (?): GrowthAs the industry built an efficient manufacturing infrastructure, it was nowready for the emergence of the semiconductor as the enabling technologyin many electronic systems, and the industry entered an era of prosperity.Semiconductors have become the productivity engine for the world's business,implementing communications systems and the power of the PC toimprove worker efficiency. Characteristics we are now experiencing are:• Unit growth in semiconductors has required manufacturers to invest incapacity for growth.• Profitability has attracted new entrants with a concentration onmanufacturing.• Dedicated contiact manufacturing has emerged as a new manufacturingmodel for the industry, enabled because of equipment efficienciesand the need to separate manufacturing from device innovation.When the industiy reached the point at which returns from yield andproductivity from equipment had diminishing returns, the capital spendingratio could no longer be maintained at artificially low levels. WebeUeve the current equilibrium level is about 22 percent of semiconductorrevenue.SSPS-WW-FR-9702 ©1997 Dataquest iVIarch 3,1997
14 Semiconductor Supply and Pricing WorldwideFurther, because of the growth in the device market, this boom has beenunprecedented in the industry in terms of length and levels of growth incapital spending. This has been the result of the industry adjusting to anew, higher spending level and of the increased unit demand.Beyond 2001: A Maturing Manufacturing InfrastructureWith the emergence of dedicated contract manufacturing, Dataquestbelieves that the industry's manufacturing infrastructure will evolve sothat the foundry becomes an integral part of the manufacturing environment,as been the case with electronic equipment in general (Solectron isan example).The foundry business model requires high equipment utilization, and weexpect that sometime in the next five years this will influence the capitalefficiency and decrease the capital spending ratio to perhaps 20 percentof revenue. This will not become evident until contract manufacturingincreases in scope, from the estimated 9 percent of semiconductor productionin 1995 to levels that could approach 35 percent to 45 percent by theyear 2010.The Americas Market Will Exhibit Strategic Strength Long TermCapital spending in the Americas region grew at an accelerated 69 percentin 1995, with most of the investment growth in 1995 coming from U.S.companies connected with ASIC and logic products. Capital spending isdecelerating in 1996 and into 1997, but Dataquest expects that investmentin advanced technology, coupled with the earlier capacity upturn from theadvanced logic segment, will stabilize the region's spending later in 1997and will lead the market's recovery in 1998 to 1999 as it did in 1993.Dataquest is currently forecasting that the Americas region will be the second-fastest-growingregion, at a 14.5 percent CAGR for 1995 through 2001,driven by the recent low cost of capital and the need for foreign multinationaland foundry manufacturers to build fabs in the United States tobe closer to their customers.The relatively strong growth in capital spending had been driven by theongoing growth in PCs, telecommunications, and networking. This keydriver has not disappeared, as these products have seen increasing useas tools to increase workplace productivity. Electroruc products withincreased semiconductor content have created enormous demand formicroprocessors, microcontrollers, SRAM, programmable logic andmemory, standard logic, and peripheral controllers. The U.S. companiesdominate many of these market segments. These segments combined areexpected to maintain fairly stable growth rates over the next few years,with PC growth slowing (however, still maintaining a 17 percent CAGR)and networking and telecommunications expanding. The near-term marketfor PCs has remained robust worldwide, despite the slower growthand penetration into the U.S. home market.New products and services, such as personal communicators, interactivetelevision, and video on demand provide the potential for enormousgrowth in semiconductor sales longer term, especially for highly integratedcomplex logic and signal-processing chips that will be the coreengines of future systems.SSPS-WW-FR-9702 ©1997 Dataquest Marcfi 3,1997
Semiconductor Capital Spending Forecast 15Although the strategic strength of the core logic products enables ahealthy and flourishing semiconductor production environment, it is alsoone that is less volatile in capital spending. In the boom years of 1994 and1995, the Americas region grew at somewhat lower than the market rates.This trait wUl also enable the Americas market to grow in capital spendingat faster than market rates (or remain more stable) in the slower years,such as 1997 and 1998. We believe companies wUl strategically invest intechnologically advanced capacity to preserve competitive advantage.Capital investment trends in the Americas region for 1996 have a definitesplit personality. While Intel is finishing up expansion of Fab 11.2 in NewMexico and ramping Fab 12 in Arizona, it has reduced spending frominitial expectations because of increased yields. Micron Technologystopped investments in Lehi, Utah, but continues aggressive expansionand conversion to 200mm at all three fabs in Boise, Idaho. Memory-sensitiveplant expansions such as Fujitsu's Gresham, Oregon, plant and IntegratedDevice Technology's Oregon fab have been delayed or have slowerramps, yet IBM has been very aggressive in its Burlington, Vermont,expansion of 16Mb DRAM production thus far. Logic investment has seena slowdown as well, with LSI Logic's push out of its Oregon fab, the delayof Motorola's North Carolina PowerPC fab, and the slow ramp-up ofAdvanced Micro Devices' Fab 25 in Austin, Texas. Yet Cirrus Logic andLucent Technologies have increased spending dramatically to ramp fabsin the eastern United States, with Atmel expanding aggressively inColorado and Rockwell's emerging success creating opportunity forequipment companies in California. SGS-Thomson has remained aggressivein spending in the United States, placing finishing touches on its newArizona facility, as well as starting up Fab 4 in CarroUton, Texas. TexasInstruments remains aggressive, spending in capacity expansion for DSPchip capacity. Although it is not likely that either Samsung or TSMC willplace equipment into their new U.S. fabs in 1996, capital spending on theshells is progressing.Japan: DRAIVI Capacity Additions Stop, Investment in Teclinoiogy Under WayJapan's 49 percent increase in capital spending in 1995 is only 37 percenton a yen basis as Japanese companies look to invest outside Japan to optimizebuying power. Japanese spending has essentially stopped growingand actually will decline about 5.5 percent in 1996. Because of the earlycutback in spending, 1997 remains a negative capital spending year, aswell, with only modest growth in 1998.Some of the Japanese electionics giants that experienced good profitgrowth in 1995, driven by semiconductor operations, have seen thoseprofits evaporate with the precipitous fall of DRAM prices. Althoughspending on capacity has essentially stopped, two other types of investmentare likely to be important in Japan now through 1998.First, Japanese companies will invest in any new technology and equipmenttargeted at the 0.25-micron production arena. This technology wUlnot likely be in volume production until 1999, but the Japanese companiesare expected to take advantage of this slowdown to understand andprogress down the learning curve on these new process technologies.Second, the Japanese companies found that the shells built in 1990 andSSPS-WW-FR-9702 ©1997 Dataquest March 3,1997
t| Semiconductor Supply and Pricing Worldwide1991 became an asset during the ramp in 1993 and 1994. By building a fabshell, equipped with a skeleton equipment set, they were positioned tomore quickly ramp up production when the market turned up. We seethat same pattern repeating, so we would expect several new fabs to bestarted in 1996 and 1997, although at very low run rates. Once these fabsare in place, the Japanese companies can continue to review the marketevery six months, making course corrections in April and October, as theyhave been doing through the last cycle ramp.Although new facilities by Japanese companies will come on line outsideJapan throughout the rest of this decade, DRAM investments inside Japanare really the only driving force today, although diversification has cometo the forefront again in Japan. Japanese companies will continue to investbut will grow outside Japan faster than within Japan. We are thereforeforecasting a below-average CAGR of 9.9 percent for the Japan region for1995 through 2001.One bright spot is that a PC boom could emerge in Japan over the nextyear or two, spawned by the networking infrastructure that is being built.This would breathe new life into the Japanese semiconductor market andour forecast would be brightened a bit. We do not think that even a PCboom, however, would create a forecast different from several percentagepoints below the world average. The fundamentals of Japanese productioncapacity are still too heavily concentrated in DRAMs, with no clearfuture direction emerging as yet, which keeps us front being more optimisticabout capital activities in Japan.Europe Sustains Presence as a Growth MarketAfter a growth bubble of 46 percent in 1993, higher than expected, Europeanspending "nioderated" to a slower-than-market growth rate in 1994after multinationals (Intel) substantially completed the majority of theirexpansions in 1993. The growth of 44 percent in 1994 is nonethelessextremely healthy, primarily being fueled by the European companiesthemselves—the ever-present SGS-Thomson, Philips expanding inNijmegen, the Netherlands, and Ericsson equipping its expansion.Europe continued to attract capital in 1995, growing 65 percent. Largemultinationals are still present, with Motorola upgrading the Scotlandfab bought from Digital Equipment Corporation, the new IBM/Philipsventure in Germany, Analog Devices' expansion in Ireland, TexasInstruments' continued expansion in Italy, and the IBM/Siemens fab'scontinued ramp of 16Mb DRAMs in France. The key expansion is Siemens'new fab in Dresden, which was the key driver pulling Siemens into the top10 in capital spending worldwide in 1996. Like the United States, Europeis experiencing slowdowns this year. Although SGS-Thomson andSiemens remain strong. Philips and the Japanese companies have puUedback investment in capacity significantly. We are looking for continuedgrowth in 1996 of 15 percent as production continues to ramp from theseand eight new fabs, most notably by GEC Plessey and TEMIC. However,in part because we do not believe that Siemens can sustain its currentspending, we are calling for an 11 percent decline in spending in Europefor 1997 and a flat-to-down 1998 because we expect multinationals willram^p domestic memory fabs before Europe. Samsung has announced afab to come on line in Europe but as yet is undecided about the exact locationor timing.SSPS-WW-FR-9702 ©1997 Dataquest: IWarch 3,1997
Semiconductor Capital Spending Forecast 17Europe is viewed as a strategic location for production longer term to takebetter advantage of European and 16Mb DRAM growth in the future,driven by the PC production boom, without import tariffs. We thereforeexpect Europe to be a nearly average investment region in the long term,with a six-year CAGR of 12 percent.Asia/Pacific Investing Focusing on Foundry as DRAIVI FailsThe often erratic but sustained semiconductor capital spending growth inthe Asia/Pacific region continued at the explosive rate of 113 percent in1995. We expect a "moderated" growth of about 26 percent in 1996 as severalnew fab projects are built and equipped. However, the tide has turnedin the DRAM area, and we are forecasting the Asia/Pacific region to be hitthe hardest in 1997, with a 27 percent decline in capital spending. Longerterm, we expect Asia/Pacific to exhibit among the most aggressive growthin capital spending of any region. Dataquest forecasts a 1995-through-2001CAGR of 17.2 percent.Spending in 1995 and early 1996 came primarily from two areas, DRAMsand foundry capacity. The Korean conglomerates are continuing theirrelentless DRAM capacity expansion plans, although more moderately in1996. We do expect these companies to succumb to the inevitable reality ofovercapacity, with significant cutbacks for 1997.The real story of interest in 1995 and 1996 is the new Taiwan players.Vanguard International brought on its new DRAM fab late last year, andPowerChip Semiconductor and Nan Ya Plastics, among others, broughtnew DRAM capacity on line late last year and early 1996. All of these aretargeted at 16Mb DRAM running 200mm wafers. Current players such asTI/Acer and Mosel Vitelic were also increasing their spending with newprojects. But the tide has turned quickly, likely accelerated by the fact thatthe Taiwanese stock market is very close to the U.S. stock market in itsreaction to bad news. Many companies in DRAM are now cutting backfeverishly to save near-term profitability.However, Taiwan chip companies TSMC, Macronix, and UnitedMicroelectronics Corporation, along with Chartered Semiconductor inSingapore and Submicron Technology in Thailand, continue with theirplans to expand foundry capacity. Interconnect Technology, with its newfoundry fab in Malaysia, is part of what we believe will be several newentries into this business. The reason for the continued interest in spendingcapital in this area comes from the fact that the core business is dependenton logic and PC unit demand rather than DRAM. Further, Dataquestestimates that only about 32 percent of the contiacted manufacturing ofsemiconductors originates from fabless companies. The remainder is fromintegrated device manufacturers (IDMs) that wish to place the manufacturingof lower value-added products away from their own facilities inorder to maximize resources and cost, that wish to reduce investment risksusing foundries as an extension of their own capacity, or that wish to usethe more advanced technology of foundries (in some cases) as a growthstrategy.SSPS-WW-FR-9702 ©1997 Dataquest March 3,1997
18 Semiconductor Supply and Pricing WorlciwideWho's Investing Where?The last few years have seen the flourishing of the dedicated foundry,mostly in Asia/Pacific. It is still believed that the largest concentration offoundry capacity in the world today, however, is in Japan, with companieslike Rohm, Seiko-Epson, Sharp, and other large integrated companies. Butwith the investment trends in Asia /Pacific, the lead will likely changewithin the next five years.However, the appetite for leading-edge foundries has caused anothertransformation. With the cost of capital increasing and with a higher levelneeded for leading-edge equipment, foundry companies have establishedlonger-term contracts with customer companies, sometimes involvingcapital infusions tow^ard production equipment and sonietimes involvingtechnology. In return, customer companies are looking for dedicatedcapacity allocations. Many joint venture have been announced in the lastyear, and we expect this trend to continue. The foundry industry is now astiategic industry rather than simply a tactical one. With this transformationnearly complete, we are starting to see the dedicated investment tobuild new foundry capacity.In our recently completed capital spending survey, Dataquest gatheredinformation on how money is being spent. Table 2-4 summarizes howcompanies based in different regions are spending their money abroad for1995, and Table 2-5 summarizes this for 1996. About 79 percent of themoney spent went into domestic economies worldwide in 1995, and thatratio increased slightly to 80 percent in 1996 as companies tend to cut backexternally first.Table 2-4Regional Investment Patterns of Semiconductor Manufacturers in 1995(Millions of U.S. Dollars)WorldNorthAmericaJapanEuropeAsia/Pacific-ROWPercentage ofWorldSpendingAmerican Companies13,863.310,135.2655.11,423.31,649.636.1Japanese Companies12,042.31,328.79,247.7738.7727.331.4European Companies3,301.5420.27.21,936.0938.18.6Asia/Pacific Companies9,203.8285.5038.98,879.424.0All Companies38,410.812,169.59,910.04,136.912,194.4100.0Percentage Growthfrom 199473.969.248.665.2113.2Source: Dataquest (March 1997)SSPS-WW-FR-9702 ©1997 Dataquest March 3,1997
Semiconductor Capital Spending Forecast 19Table 2-5Regional Investment Patterns of Semiconductor Manufacturers in 1996(Millions of U.S. Dollars)WorldNorthAmericaJapanEuropeAsia/Pacific-ROWPercentage ofWorldSpendingAmerican Companies15,657.812,289.5445.31,503.41,419.535.8Japanese Companies11,268.81,045.28,916.5751.0556.125.8European Companies3,802.0359.702,446.2996.18.7Asia/Pacific Companies12,978.5490.0054.912,433.529.7All Companies43,707.114,184.59,361.84,755.515,405.3100.0Percentage Growthfrom 199513.816.6-5.515.026.3Source; Dataquest (March 1997)Asia/Pacific companies have historically placed all their investmentsdomestically, but 1994 was the first year of diversification, which continuedin 1995. Asia/Pacific companies spent about 4 percent of their moneyabroad in 1995, increasing to about 6 percent in 1996. We would expectthis ratio to increase significantly over the next two to three years.European companies have been the most aggressive capital exportershistorically, placing only 59 percent of their investment inside Europe.This figure grew slightly to 63 percent in 1996 and should expand in 1997as European companies rein in spending.Japanese companies are very close to the worldwide average, with about77 percent domestic investment in 1995, rising to 80 percent in 1996.Americas region companies are also high domestic spenders, with about73 percent stajdng at home for both years.The Americas and Japanese regions are net investors, while European andAsia/Pacific regions are net beneficiaries of that investment. This parallelsthose regions being net exporters and net importers of semiconductors,respectively.Although all regions are spending in Asia/Pacific and aU multinationalregions are investing in Europe, only North American companies have thestrategic vision to invest in Japan. Japanese companies are also investingon a worldwide basis. We believe this is one of the key elements necessaryin a strategic plan for a semiconductor company to be competitive on aglobal basis.ISSPS-WW-FR-9702 ©1997 Dataquest I\/Iarch3,1997
Chapter 3Capital Spending AnalysisThe capital spending boom experienced in 1993 through the first half of1996 is over, and the industry is now in what we would characterize as an18-to-24-month pause, with investment in capacity initially declining andstabilizing as demand catches up to supply. The marked downturn in theDRAM investment cycle was triggered in part by the 1x16 configuration ofthe 16Mb DRAM achieving yields of about 60 percent to 65 percent, whichoccurred near the end of 1995.In the second half of 1995, a complicating factor entered the picture—thelarger-than-actual anticipated demand for memory created by the introductionof Windows 95, which, taken with the tight supply of memory lastyear, caused inventories to inflate to enormous levels. This situationstarted correcting in the final quarter of last year, slightly in advance, butessentially on top of, the yield trigger for the 16Mb DRAM conversiontiming. Now we have a double-barreled driver (demand and supply) forthe DRAM price slide and capital spending downturn. These events haveincreased the anticipated severity of the downturn.The industry is now relying on the continued growth in personalcomputer unit sales, with added growth in telecommunications and networkingproducts, to create a unit demand picture that will keep thisslowdown short-lived from a historical perspective. The wafer fab capacitybubble has burst in all regions and for most semiconductor products,most notably DRAMs, mixed-signal devices, and analog devices. The 1995spending growth was almost entirely driven by DRAM and microcomponentcapacity purchases, 1996 was a year of transition, and 1997 is a yearof investment in technology.Based on how^ capacity is migrating among device types, Dataquestbelieves that the first area of spending recovery wU be advanced logic, asearly as mid-1997. Equipment companies positioned for these markets willhave a more moderate slowdown and perhaps can grow through this timeif they have advanced technology. The microcontroller (MCU), analog,mixed-signal, and telecom chip capacity will be next to recover, but thiswill probably not occur until the end of 1997 or early 1998. The DRAMsegment, the root cause of the problem and the very last to recover, is notexpected to resume robust spending until mid-to-late 1998. The next majorand broad investment cycle will have momentum by 1999.We believe that capital spending may be influenced in late 1997 through1999 positively with facility construction and equipment purchases for theworld's first 300mm wafer fab. We have built this infrastructure investmentinto our model.Strategic semiconductor procurement organizations analyze the totalmakeup of their supply base starting with research and developmentexpenditure, followed by capital spending plans and then on to quality,delivery, and ultimately, pricing issues. The current slowdown in capitalspending directly correlates with last year's pricing debacle—from a supplier'sperspective. Although supplies of semiconductors are expected toSSPS-WW-FR-9702 ©1997 Dataquest 21
22 Semiconductor Supply and Pricing Worldwideremain good for the next six to eight quarters, strategic capital investmentsstill are needed for many companies. Long-term decisions regarding semiconductorsourcing require suppliers with a solid technology foundationcombined with the financial wherewithal to follow through with productiononce the technology is ready. Regular review^s of supplier capitalspending plans and ratio analysis of spending compared with sales as wellas comparing it with total expenses give a good picture of where a supplierplans to go. Doing a like analysis of R&D spending versus sales andtotal expenses is also helpful as an early indicator of potential problems.Often overlooked, capital spending is an important part of a total costanalysis. Regular reviews will prevent unpleasant surprises that maydisrupt supply lines or cause supplier dislocations.1iiSSPS-WW-FR-9702 ©1997 Dataqu est March 3,1997
iFor More Information...Mark Giudici, Director and Principal Analyst (408) 468-8258Internet addressinark.giudici@dataquest.comVia fax (408) 954-1780DataquestA Gartner Group CompanyThe content of this report represents our interpretation and analysis of information generally available to the publicor released by responsible individuals in the subject companies, but is not guaranteed as to accuracy or completeness.It does not contain material provided to us in cor\fidence by our clients. Reproduction or disclosure in whole or inpart to other parties shall be made upon the written and express consent of Dataquest.©1997 Dataquest—Reproduction ProhibitedDataquest is a registered trademark of A.C. Nielsen Company
DATAQUEST WORLDWIDE OFFICESNORTH AMERICAWorldwide Headquarters251 River Oaks ParkwaySan Jose, California 95134-1913United StatesPhone: 1-408-468-8000Facsimile: 1-408-954-1780EUROPEEuropean HeadquartersTamesis, The GlantyEgham, Surrey TW20 9AWUnited KingdomPhone:+44 1784 431 611Facsimile: +44 1784 488 980ASIA/PACIFICAsia/Pacific HeadquartersSuite 5904-7, Central Plaza18 Harbour Road, WanchaiHong KongPhone: 852-2824-6168FacsimUe: 852-2824-6138East Coast HeadquartersNine Technology DriveP.O. Box 5093Westborough, Massachusetts 01581-5093United StatesPhone: 1-508-871-5555Facsimile: 1-508-871-6262Dataquest Global Events3990 Westerly Place, Suite 100Newport Beach, California 92660United StatesPhone: 1-714-476-9117Facsimile: 1-714-476-9969Sales Offices:Washington, DC (Federal)New York, NY (Financial)Dallas, TXLATIN AMERICAResearch Affiliates and Sales Offices:Buenos Aires, ArgentinaSao Paulo, BrazilSantiago, ChileMexico City, MexicoDataquest FranceImmeuble Defense Bergeres345, avenue Georges ClemenceauTSA 4000292882 - Nanterre CTC Cedex 9FrancePhone: +33 1 41 35 13 00Facsimile: +33 1 41 35 13 13Dataquest GermanyKronstadter Strasse 981677 MiinchenGermanyPhone: +49 89 93 09 09 0Facsimile: +49 89 93 03 27 7Sales Offices:Brussels, BelgiumKfar Saba, IsraelMilan, ItalyRandburg, South AfricaMadrid, SpainJAPANJapan HeadquartersAobadai Hills 4-7-7AobadaiMeguro-ku, Tokyo 153JapanPhone: 81-3-3481-3670Facsimile: 81-3-3481-3644Dataquest KoreaSuite 2407, Trade Tower159 Samsung-dong, Kangnam-guSeoul 135-729KoreaPhone: 822-551-1331Facsimile: 822-551-1330Dataquest TaiwanllF-2, No. 188, Section 5Nan King East RoadTaipeiTaiwan, R.O.C.Phone: 8862-756-0389Facsimile: 8862-756-2663Dataquest Singapore105 Cecil Street#06-01/02 The OctagonSingapore 069534Phone: 65-227-1213FacsimUe: 65-227-4607Dataquest Thailand12/F, Vanissa Building29 Soi ChidlomPloenchit RoadPatumwan, Bangkok 10330ThailandPhone: 662-655-0577Facsimile: 662-655-0576Research Affiliates and Sales Offices:Melbourne, AustraliaBeijing, ChinaI>ataQuestA Gartner Group Company©1997 Dataquest
IRLE COPY-MARIA VALENZUEU<strong>DataQuest</strong>IC Assembly Update, Report 2;PCB and Packaging AspectsIFocus Report^Program: Semiconductor Supply and Pricing WorldwideProduct Code: SSPS-WW-FR-9701Publication Date: March 3,1997Filing: Reports
IC Assembly Update, Report 2:PCB and Packaging AspectsFocus ReportProgram: Semiconductor Supply and Pricing WorldwideProduct Code: SSPS-WW-FR-9701Publication Date: March 3,1997Filing: Reports
IC Assembly Update, Report 2: PCB and Packaging AspectsTable of ContentsPage1. Executive Summary 1Definitions—The Three Groups 1Objective of the Survey 1Management Summary: Chapter Content 12. Survey Respondents Demographics 3Methodology 3Respondent Demographics 3Users versus Buyers of PCBs 5Procured PCB Spending 6Volume of PCBs 73. PCB Packaging 9Overall Findings: Through Hole 9Overall Findings: Surf ace-Mount Technology 10Overall Findings: Advanced Technology 10Overall Findings: Will the Mix Change? 10The Three Groups: Through Hole 12The Three Groups: SMT 13The Three Groups: Advanced Technology 14The Three Groups: Will the Mix Change? 14Analysis of Findings 164. Direct Chip Attachment 19Format 19Overall Findings 20Current Use: Overall 20Kinds of DCA Used: Overall 20Plans to Change to Using DCA: Overall 21The Three Groups 22Use of DCA: The Three Groups 22Kinds of DCA Used: The Three Groups 23Plans to Use DCA by the End of 1997: The Three Groups 24Comparison of the Three Groups with the Overall Results 24Analysis 26Possible Application Implications 275. PCB Layers Used and Lead Times 29Number of Layers 29Changing the Mix 31Lead Time versus Layers 31Data Analysis 326. Quality Issues—PCB Inspection and Defect Rate 33Target PCB Defect Rate 33Comparison of Results 34PCB Inspection 35Data Analysis 367. Analysis and Conclusions 39SSPS-WW-FR-9701 ©1997 Dataquest March 3,1997
Semiconductor Supply and Pricing WorldwideList of FiguresFigurePage1-1 DCA Types Being Used Overall 22-1 Company Revenue Size Range among Survey Respondents 42-2 Number of Employees per Company 42-3 The Three Groups Surveyed 52-4 Procurement Spending on PCBs in 1996 62-5 PCB Volumes Bought in 1996 73-1 Current Through Hole Mix: Overall Findings 103-2 Current SMT Mix: Overall Findings 113-3 Current Advanced Technology Mix: Overall Findings 113-4 Current Through Hole Mix: The Three Groups 123-5 Current SMT Mix: The Three Groups 133-6 Current Advanced Technology Mix: The Three Groups 154-1 Types of DCA Used: Overall 204-2 Plans to Begin Using DCA by the End of 1997: Overall 214-3 Where the Three Groups Fit 234-4 Types of DCA Used: The Three Groups 244-5 Plans to Use DCA by the End of 1997: The Three Groups 254-6 Use of DCA: Comparison 254-7 Plans to Use DCA by the End of 1997: Comparison 265-1 PCB Layers for the Merchant Users 295-2 PCB Layers for the Captive Groups 305-3 Likelihood of Changing the Mix by the End of 1997 316-1 Target Defect Rate for Merchant Users 336-2 The Captive Groups' Target Defect Rate 346-3 Checking All PCBs or Batches 36SSPS-WW-FR-9701 ©1997 Dataquest March 3,1997
IC Assembly Update, Report 2: PCB and Packaging AspectsList of TablesTablePage2-1 Companies That Buy PCBs 63-1 Likelihood of a Different Mix by the End of 1997: OverallFindings 123-2 Likelihood That the Mix Will Change by the End of 1997: TheThree Groups 154-1 Current Use of DCA: Overall 204-2 Use of DCA, by Group 225-1 Are Lead Times Different for Different Numbers of PCB Layers?. 326-1 Physical Checking of PCBs 35SSPS-WW-FR-9701 ©1997 Dataqu est March 3,1997
Chapter 1Executive SummaryDefinitions—Tlie Tliree GroupsDataquest identified three distinct categories within the realm of ICassemblers. These three groups w^ere:m Merchant market IC assemblers—This group is the traditional ICassembly supplier. For the purpose of this survey, this group is knowas the merchant market seller group.• Merchant market buyers—This group buys and uses IC assembliesmade externally by the merchant market sellers. Throughout thissurvey, this category of external buyers is referred to as the merchantmarket users group.• Captive assemblers and users—This group covers companies thatmake and use IC assemblies. The IC assembly can be made and usedwithin the same location or facility or by two divisions. This groupdoes not source IC assemblies externally, nor does it sell IC assembliesexternally.Objective of tlie SurveyThe aim of the survey was to gather 50 percent of the responses from themerchant market and 50 percent from the captive market.For this Focus Report, Dataquest surveyed users and suppliers of ICassembling. The overall survey covered commercial issue trends, importanceand satisfaction ratings, packaging technology, printed circuit board(PCB) trends, and quality issues. For ease of use, the survey was split intotwo separate reports. Report 1 covered commercial importance and satisfactionissues and was published by Dataquest in December 1996 (SPSG-WW-FR-9603). This report. Report 2, deals with packaging technologytrends, PCB trends, and quality issues.Management Summary: Cliapter ContentThis report is broken into seven parts. Chapters 1 and 2 highlight thescope of the report, participant demographics and methodology used, andgroups identified and summarizes the overall findings. Chapter 3 looks atPCB technology mixes and trends, both the overall survey average and foreach group. Chapter 4 explores the findings on direct chip attachment—who uses DCA and what types are used. The mean results are comparedwith the findings for the three groups. In Chapter 5, PCB layer mix on procuredPCBs is examined, along with the associated lead times. The qualityissues are covered in Chapter 6—inspection methods and target defectrates. For both Chapters 5 and 6, the PCB buying subgroups are used. Thereport concludes in Chapter 7 with an analysis of findings.SSPS-WW-FR-9701©1997 Dataquest
Semiconductor Supply and Pricing WorldwideFigure 1-1DCA T5^es Being Used OverallSummaryDataquest has completed a survey of IC assembliers, incorporating theassembler and user groups in boih the merchant and captive arenas. Thissurveyed group had combined IC assembly spending of over $1.6 billionfor 1996 and direct PCB procurement spending of over $554 million for thesame period. All participants were located in North America.A number of interesting findings were made in the area of direct chipattachment (DCA). Despite the fact that the survey was conducted inthe American market, one-third of survey respondents currently useDCA. This is a high percentage when one considers the type of applicationsmanufactured. More significant still is the range of typescurrently used—it demonstrates the sophistication of the survey base(see Figure 1-1).The overall DCA trends were then broken into the three composite groups(merchant assemblers, merchant buyers, and captive community) andindividually examined. Some startling differences in current and forecastuptake were discovered, in addition to the types used.Others areas covered in great detail are PCB layers used and lead timecorrelations, quality controls (encompassing defect rates and inspectiontrends), and packaging types (covering through hole, surface mount, andadvanced).Percentage of Sampleou-bU-40-30-20-10-0-''y/M.Hm•' — 1 — '^ • ^ ^ M _ w,1=1COB COG COF MCM TAB Flip Chip Do Not Know/Refused971002aSource: Dataquest (February 1997)SSPS-WW-FR-9701 ©1997 Dataquest March 3,1997
Chapter 2Survey Respondents DemographicsMethodologyThe survey questionnaire was developed by Dataquest's Sem^iconductorSupply and Pricing Worldwide program and comprised a total of 115questions. Trained interviewers at Dataquest's field interviewing facilityin San Jose, California, conducted the survey in October 1996 over the telephone.The sample Ust was obtained from Corporate Technology InformationServices. Using the CorpTech database, Dataquest targeted themanufacturers of the following types of electronic devices for inclusion inthis survey: voice and data communications, data processing or computers,office electronics, consumer electronics, industrial electronics, medicaldevices, transportation or aerospace equipment, and military/defenseelectronics. To qualify, the respondent company had to do at least one ofthe following activities: assemble boards for use by companies that manufactureelectronic devices, manufacture electronic devices using boardsobtained primarily from external assemblers, or manufacture electronicdevices using boards obtained primarily from internal or in-house assemblers.The respondent had to be knowledgeable about the board assemblypractices within this company.Respondent DemographicsMore than 1,200 calls were made, of which 100 were completed—a hit rateof 8.3 percent.Once Dataquest's field interviewing staff had completed its work, theinformation was passed to the Semiconductor Supply and Pricing Worldwideprogram, where the data was analyzed.Figure 2-1 shows company revenue of the respondents for 1996. Onequarterof aU respondents were from companies with revenue greater than$125 milUon, but 34 percent of respondents either did not know their companies'revenue or refused to answer the question. The captive group, onaverage, had the highest company revenue. Over 35 percent had revenueover $125 million.The group was fairly mixed in company size. Half of the respondents werefrom companies with less than 500 hundred people and half from largerorganizations. Figure 2-2 shows the overall split of respondents by numberof employees at the moment. The merchant assemblers surveyed were,on average, smaller than the other two groups—68 percent were companieswith less than 400 hundred employees. WeU over 50 percent of externalbuyers and 67 percent of the captive group had more than 400employees.SSPS-WW-FR-9701©1997 Dataquest
Semiconductor Supply and Pricing WorldwideFigure 2-1Company Revenue Size Range among Survey Respondents1 „,— Less than $10 Million (9%)/ >^— $10 Million to $24 Million (10%)/ Do Not Know// Refusei (34%)^-'^25 Million 1Y\ to $74 Million 1\ \ . (15%) fV/^ $150 Million \ ^ \ ^\ or More \ ^^V (22%) \ ^ ^X,^^ ^^^r $75 Million to $149 Million (10%)N = :10097i00ESource: Dataquest (February 1997)Figure 2-2Number of Employees per CompanyDo Not Know/Refuse (6%)N = 100Source: Dataquest (February 1997)SSPS-WW-FR-9701 ©1997 Dataquest March 3,1997
Survey Respondents DemographicsUsers versus Buyers of PCBsFigure 2-3The Three Groups SurveyedWe came very close to our original aim for this report, which was to have50 percent of the respondents from the merchant market and 50 percentfrom the captive market. Figure 2-3 shows the actual spHt by market type:49 percent of respondents were from the merchant community, splitbetw^een IC assemblers and buyers/users, and 51 percent were from thecaptive community, companies that make IC assemblies for their ownconsumption.As noted previously in this chapter, the survey results on PCB and packagingissues come from the IC assembly study conducted by Dataquest inOctober 1996. AU participants in the survey itself either were or used ICassemblers, externally or internally. Also, aU respondents needed PCBs todo the IC assembly work.Even though all respondents used or needed PCBs, not all actually procuredPCBs themselves. Thus, there is a distinction made by Dataquest asto PCB users and PCB buyers. As the PCB buyers group forms a subgroupof the larger PCB users group, the number of respondents who qualifiedto answer certain questions is affected.Throughout this report, it is stated at the start of each chapter whichgroups will be answering the questions.Table 2-1 shows the results of the survey question determining whichparticipants companies buy PCBs./ Merchant/ Market/ Users/ ^ (21%)Captive 1Assemblers 1\, Merchantand Users 1(51%) f\\MarketSellers 1 M\ (28%) I MN = 100971004Source: Dataquest (February 1997)SSPS-WW-FR-9701 ©1997 Dataquest I\/Iarcli3,1997
Semiconductor Supply and Pricing WorldwideTable 2-1Companies That Buy PCBsYesNoDo Not Know/RefuseMerchant MarketAsseniblers21.478.60Merchant MarketUsers71.428.60Captive Assemblersand Users90.27.82.0Source: Dalaquest (February 1997)Procured PCB SpendingFigure 2-4Procurement Spending on PCBs in 1996Among the external suppliers group (the merchant market assemblers),well over 78 percent of the surveyed companies didn't buy PCBs. Thus,this group was not used for any PCB-specific questions, as clearly aninsufficient number was qualified.Of the external buyers group (the merchant market users), over 71 percentof respondents' companies procured PCBs. Among the captive group,over 90 percent of respondents said that their companies bought PCBs.Clearly, these two groups qualify to answer the PCB-specific questions,and so the results of these two PCB subgroups were used.As this question relates to the procurement spending on PCBs per company,the merchant assemblers group has not been included. TTiis questionwas asked of the qualifying participants within the merchant usersgroup and the captive group.As can be seen from Figure 2-4, the total spending of the qualifying participantson PCBs for 1996 was estimated at $554.5 million./ Merchant/ Market Users/ (21.8%)Captive MY Assemblers #\ and Users M\ (78.2%) MTotal = $554.5 Million9710O6Source: Dataquest (February 1997)SSPS-WW-FR-9701 ©1997 Dataquest March 3,1997
Survey Respondents DemographicsVolume of PCBsDataquest asked the qualifying participants to estimate how many PCBsthey would buy in 1996.Figure 2-5PCB Volumes Bought in 1996Figure 2-5 shows the number of PCBs procured by the qualifying participantsin 1996:17.22 million units. It is worth remembering that, as thisquestion concerns only the volume of PCBs directly procured in 1996, it isonly a portion of all the PCBs used by the total IC assembly surveyrespondents.Total = 17.2 Million Units971006Source: Dataquest (February 1997)SSPS-WW-FR-9701 ©1997 Dataquest; March 3,1997
Chapter 3PCB PackagingAll IC assembly survey participants used PCBs. The assemblers needPCBs to do the physical IC connections; the buyers of IC assemblies usethem as part of their product food chain. This is true both in the externalmarket and internally. Thus, every IC assembly survey participant has avalid input in this chapter.This chapter is broken into four sections, each analyzing the results of adifferent group. These four groups are:• Overall findings• Merchant market assemblers• Merchant market usersOverall Findings: Through Hole• Captive assemblers and usersAs every respondent who participated in the IC assembly survey qualifiedfor this chapter, the overall findings are a useful representation of what ishappening in the area of package technology. However, as all respondentsfell into one of the three categories, it is also necessary to examine eachgroup separately to determine their similarities and differences.Let us first look at definitions. Although "through hole" is fairly selfexplanatory,the surface-mount technology (SMT) and advanced technology(AT) forms need some clarification:• Surface-moimt technology includes smaU-outline package (SOP), thinsmall-outUne package (TSOP), and chip on board (COB). COB is oftenreferred to as chip on wafer (COW).• Advanced technology includes very small outline package (VSOP), thinshrink small-outline package (TSSOP), very fine-pitch packages, plasticball-grid array (PBGA), enhanced PBGA (EPBGA), tape-automatedbonding (TAB), and flip chip.The overall finding are examined first.As can be seen from Figure 3-1, 65 percent of respondents use less than50 percent through hole. Of this, about one-quarter use less than 10 percentthrough hole, about 40 percent use between 10 and 30 percent, andnearly 30 percent use between 30 and 50 percent through hole. Five percentof this group used no through hole. Twenty-one percent of repliessaid that through hole accounted for between 50 and 80 percent. Over80 percent use of through hole was ticked by one-tenth of respondents.The percentage of respondents who used only through hole was verysmall—4 percent.SSPS-WW-FR-9701©1997 Dataqu est
10 Semiconductor Supply and Pricing WorldwideFigure 3-1Current Through Hole Mix: Overall Findings100% Through Hole (4%)More than 80%Through Hole(10%)0% Through Hole (4%)Less than 10%Through Hole(15%)N = 100971007Source: Dataquest (February 1997)Overall Findings: Surface-Mount TechnologyThe profile for surface-mount technology is quite different from that ofthrough hole for the same groups. As can be seen from Figure 3-2,46 percentof those surveyed use less than 50 percent SMT (or surface-mountdevice—SMD). Seven percent use no SMT at present, while 39 percent useit to various degrees less than 50 percent. Thirty-eight percent of respondentsuse between 50 and 85 percent SMT, while 15 percent of participantsuse between 85 and 95 percent SMT. Only one respondent used all SMT.Overall Findings: Advanced TechnologyOverall Findings: Will the Mix Change?Advanced technology penetration, on the whole, was considerably lessevolved. Figure 3-3 shows that 86 percent of participants use no form ofadvanced technology. Of the remaining 14 percent, half use less than10 percent AT, about one-third use between 10 and 20 percent, 1 percentuse 40 percent, and 1 percent use all AT.Next Dataquest asked if this would be different by the end of 1997.Table 3-1 shows that a resounding 58 percent expected to change theirmix. Only 39 percent said their mix would remain the same, while 3 percenteither did not know or refused to speculate.Let us now look in more detail at the three groups that make up the overallresults (see Figure 3-4).SSPS-WW-FR-9701 ©1997 Dataquest March 3,1997
PCB Packaging 11Figure 3-2Current SMT Mix: Overall Findings100% SMT/SMD (1%) —,/— 0% SMT/SMD (7%)/^5% to 95% 1/ SMT/SMD/ ^\(1S%) 1\ 50% to 85%\ SMT/SMD\ (38%)f Less than 1\ 50% SMT/SMD 1\ (39%) fN = 100971 DOSSource: Dataquest (February 1997)Figure 3-3Current Advanced Technology Mix: Overall Findings0.4% Advanced (1%) —,H no/ * nr.o/ A J j ifzai \inno/ A^WO„^«,^/io/\"100% AdvancGd (1 %)10% to 20% Advanced (5%) —, ' ^ 'Less than 10% Advanced (7%)N = 100Source: Dataquest (February 1997)SSPS-WW-FR-9701 ©1997 Dataquest March 3,1997
12 Semiconductor Supply and Pricing WorldwideTable 3-1Likelihood of a Different Mix by the End of 1997: Overall Findings (Percent)YesNoDo Not Know/RefuseSource: Dataquest (February 1997)Mix Will Change58393The Three Groups: Through HoleFigure 3-4 shows the results of the three different groups based on theirthrough hole mix.Figure 3-4Current Through Hole Mix: The Three Groups908070-60-50-40-1302010Dm100% Through HoleMore than 80%Through Hole50% to 80%Through Hole30% to 50%Through Hole10% to 30%Through HoleLess than 10%Through Hole0% Through Hole0Merchant MarketAssemblersMerchant MarketUsersCaptive Assemblersand UsersSource: Dataquest (February 1997)Over 64 percent of aU respondents in the merchant market assemblersgroup use less than 50 percent through hole. About 21 percent usebetween 30 and 50 percent, nearly 36 percent use between 10 and 30 percentthrough hole, 3.6 percent use less than 10 percent, and 3.6 percent use10 to 30 percent. One-quarter of respondents used 50 to 80 percentthrough hole, and just under 11 percent used over 80 percent throughhole.SSPS-WW-FR-9701 ©1997 Dataquest March 3,1997
PCB Packaging 13The Three Groups: SMTFigure 3-5Current SMT Mix: The Three CroupsFor the merchant market users groups, however, the results are different.Within this group, nearly 86 percent of respondents use less than 50 percentthrough hole technology. Breaking this into the three ranges chosenshows 38 percent using less than 10 percent, nearly 24 percent usingbetween 10 and 30 percent, and nearly 24 percent using between 30 and50 percent through-hole technology. The remaining respondents, who useover 50 percent market comes from the 50 to 80 percent ranges of whichjust over 14 percent of respondents use.Finally, Dataquest examined the results of the captive group. Here, about57 percent use less than 50 percent through-hole technology. This runs thefull range—starting with nearly 6 percent who use no through hole,around 12 percent who use less than 10 percent, 23.5 percent who usebetween 10 and 30 percent, and 15.7 percent who use 30 to 50 percent.Of the 43 percent who use more than 50 percent through hole technology,21.6 percent use between 50 and 80 percent, 13.7 percent use over 80 percent,7.8 percent use all through hole.Next, the same three groups of participants were asked to categorize theirSMT use within certain Dataquest-specified ranges.The results of the question on surface-mount technology use by the threegroups are shown in Figure 3-5.100%SMT/SMD85% to 95%SMT/SMD50% to 85%SMT/SMDDLess than 50%SMT/SMD0% SMT/SMDMerchant MarketAssemblersMerchant MarketUsersCaptive Assemblersand UsersSource: Dataquest (February 1997)SSPS-WW-FR-9701 ©1997 Dataquest March 3,1997
T4Semiconductor Supply and Pricing WorldwideOf the merchant assemblers surveyed, the split was exactly 50/50; that is,50 percent of respondents in this group use less than 50 percent SMT and50 percent use more than 50 percent SMT. A fuU 10.7 percent of respondentsuse no SMT, although with 39.3 percent using more than zero butless than 50 percent SMT. The biggest single grouping is in the 50 to85 percent range, with 46.4 percent of respondents. Between 85 and 95 percent,the response was 3.6 percent.The captive group shows a profile similar to the merchant market assemblersgroup, with 51 percent of respondents using less than 50 percentSMT and 49 percent of users using over 50 percent SMT at the monient.Of the group reporting below 50 percent use, 7.8 percent use no SMT atpresent and just over 43 percent use more than zero but less than 50 percent.A third of all respondents in this group use between 50 and 85 percentSMT, while 13.7 percent use between 85 and 95 percent. Two percentof participants in this group use all SMT at present.The merchant market users, again, show quite a different profile from theother two groups. In this group, slightly more than a quarter of those surveyeduse less than 50 percent SMT. This means that over 70 percent ofrespondents use more than 50 percent SMT—slightly over 38 percent usebetween 50 and 85 percent SMT, with a third of respondents usingbetween 85 and 95 percent.Finally from a technology use stance, the groups were asked whether theynow use advanced technology.The Three Groups: Advanced TechnologyHere, all three groups had something in common—the vast majority of allsurveyed did not use advanced technology. Analysis of the results showsthat it was simply a question of degrees. Figure 3-6 shows that the merchantassemblers group gave a 78.6 percent "no" vote, the merchant users,85.7 percent "no," and the captive group came in screaming with a 90 percent"no" vote. It is easier to look at the limited "yes" vote. The captivegroup's 10 percent is split among three ranges—imder 10 percent (with a4 percent response), 10 to 20 percent (again getting 4 percent), and 40 percent(the rest—2 percent). The merchant users had a 14.3 percent affirmativeresponse, spUt between two ranges—under 10 percent (9.5 percent ofrespondents) and 10 to 20 percent (4.8 percent). The merchant assemblershad the largest affirmative vote—21.4 percent. This was split among threeranges—under 10 percent (10.7 percent), 10 to 20 percent (7.1 percent), and100 percent (3.6 percent).The Three Groups: Will the Mix Change?Dataquest asked all respondents if they planned to change the mix for theend of 1997. Table 3-2 shows the results.From Table 3-2, it can be seen that the majority surveyed from all threegroups plan to change the technology mix by the end of 1997. The merchantassemblers were the most positive—nearly 68 percent of those surveyedplan to change their mix, compared to 28.6 percent who will keep itthe same. Only 3.5 percent refused to speculate or did not know. The captivegroup voted nearly 55 percent that they would change, 43 percentSSPS-WW-FR-9701 ©1997 Dataquest March 3,1997
PCB Packaging 15Figure 3-6Current Advanced Technology Mix: The Three GroupskVxV^^Vk^Nlw^^^^^^^^^^^^^^100% Advanced40% Advanced10% to 20%Advanced[—I Less than 10%I—I Advanced0% AdvancedMerchant MarketAssembl9rsMerchant MarketUsersCaptive Assemblersand UsersSource: Dataquest (February 1997)Table 3-2Likelihood That the Mix Will Change by the End of 1997: The Three Groups (Percent)Merchant MarketAssemblersMerchant MarketUsersCaptive Assemblersand UsersYesNoDo Not Know/Refuse67.928.63.552.442.94.754.943.12.0Source; Dataquest (February 1997)would not change, and a 2 percent refused or did not know. In the merchantusers group, 52.4 percent wiU change by end of 1997, but just shy of43 percent will not, and 4.7 percent refused to answer or did not know.Dataquest asked the groups how they planned to change their mix. Themain ways in which groups planned to change were to decrease use ofthrough hole and increase use of SMT. They had no plans to use moreadvanced technologies by the end of 1997.Also, analyzing those who will change and those who will not made itobvious quickly that those who will not be changing are already usingmore than 50 percent SMT.SSPS-WW-FR-9701 ©1997 Dataquest IVlarctiS, 1997
16 Semiconductor Supply and Pricing WorldwideAnalysis of FindingsThere was a clear move from through-hole technology toward surfacemounttechnology from all three groups. However, one striking point wasthe degree to which the three groups have made this transition, based onDataquest's survey base. The merchant market assemblers group mostclosely resembles the overall findings. These two sets had 64.3 percent and65 percent of respondents, respectively, using less than 50 percentthrough-hole technology at present. Only 58.9 percent of the captivegroup used less than 50 percent through hole. By contrast, nearly 86 percentof merchant buyers (the merchant users group) were using less than50 percent through hole. This would indicate that the merchant buyersgroup was the group that had the strongest momentum going in the movefrom through hole to SMT.This technology shift among the merchant users is given more weight bythe fact that, when asked whether the current mix would change by theend of 1997, this group was the least positive. Only 52.4 percent said thatthey would change their mix, compared to 67.9 percent of merchantassemblers. Clearly, for the merchant sellers, the coming 12 months willbe significant in the technology move.What is surprising is the result from the captive group. Here, both buyersand sellers of the assemblies work for the same company. One wouldimagine that, as they share common goals and corporate directions, theywould find it easier to adopt newer technologies through cost splittingand shared design responsibilities. Not so. This group has the highest percentageof respondents using more than 50 percent through-hole technology,the lowest number using more than 50 percent SMT, and thestrongest antiadvanced technology replies. And yet, only 54.9 percent ofthose surveyed plan to alter their technology mix by the end of 1997. Conservatismappears to rule in the captive environment.Returrung to technology transitions and to emphasize the polarization ofrealities from the three groups, it can be seen that the merchant buyerswere more flexible. They had the highest percentage using more than 50percent SMT. Theirs was also higher than the overall average (71.4 percentversus 54 percent). By contrast, the other two groups would appear lessflexible in their technology mix. Both other groups had less than the overallaverage usage of SMT—currentiy, 50 percent of the merchant assemblersand 49 percent of the captive group use more than 50 percent SMT.According to the sample base of this survey, the volume move toadvanced forms of technology has not yet occurred. Only a minor number(and percentage) of all groups use a form of technology that can be classifiedas advanced. Also, based on feedback received on their KkeUhood ofchange within the next 12 months, none expressed the goal of increasingits share. Yet the hype drones on.For applications where lower height is essential, there is no getting awayfrom SMT. However, for commodity devices, where a price point is key,through hole continues to be the choice. Also, some older technologydevices have been made only in dual in-line package (DIP) designs, whichmakes an SMT move impossible.SSPS-WW-FR-9701 ©1997 Dataquest March 3,1997
PCB Packaging 17Another point to bear in mind is that all survey participants are based inNorth America. This region has been a lot slower to move toward SMTthan other regions in the world, for example, Japan, which embraced itmore wholeheartedly. This is in part because of the fact that the focus hereis more industrial, which requires a more conservative approach to technologymigration than, say, consumer applications (mainly in Japan).For the industrial segment, for example, moving to SMT may necessitateproduct recalls if any issues occur. Recalling a product is both tedious andvery costly. In a different vein, but to illustrate the same goal, automotiveapplications want the best cost solution for their application, which stillcomes from through hole. These two examples help explain the hesitancyto move to SMT.SS PS-WW-FR-9701 ©1997 Dataq u est March 3,1997
Chapter 4Direct Chip AttaclimentDirect chip attachment is a name applied to any of the chip-to-substrateconnections used to eliminate the first level of packaging.It strives to eliminate the expense associated with package assembly byaffixing the chip directly to the board or substrate. For the purposes of thissurvey, Dataquest has included the following DCA methods:• Chip on board: In its most general term, this refers to the direct attachmentof a bare chip to a board using wire bonding. However, it mayalso include TAB or solder interconnections.• Chip on glass (COG): Generally speaking, this means the direct attachmentof the bare chip to a glass substrate.• Chip on flex (COF): Here, the bare chip is attached directly to a flexsubstrate.• Multichip module (MCM): This is a module or package capable of supportingseveral chips on a single package. Most multichip modules areceramic.• Tape automated bonding: Silicon chips are joined to patterned metal onpolymer tape using thermocompression bonding and subsequentlyattached to a substrate or board by outer lead bonding.• Flip chip: Here a bare die is attached to a substrate upside down afterspheres of solder (50vim to 125|im in diameter) are bumped in an arrayon the bottom of the chip before attachment to the substrate. It wasoriginally referred to as the IBM C4 process (controlled collapse chipcoruiection).FormatDataquest wanted to determine whether DCA was being used by thesurvey respondents and, if so, which types of DCA were used. Those notusing the technology were asked about plans to use DCA by the end of1997.Dataquest asked this question of all survey participants in all threegroups—merchant assemblers and users and the captive group. AsDCA is a technology being much talked about and gaining much publicity,Dataquest has presented the findings four ways:• Overall survey findings• Merchant market assemblers• Merchant market users• Captive assemblers and usersThe overall survey findings analysis is useful to get a "big picture" of thetechnology, on a macro level, while the individual analysis of the threegroups surveyed facilitates the study on a more micro level. Thus, it can bedetermined if there is a greater use of DCA among any of the specificgroups of respondents.SSPS-WW-FR-9701 ©1997 Dataquest: 19
20 Semiconductor Supply and Pricing WorldwideOverall FindingsDataquest asked all participants in the IC assembly survey a number ofquestions about DCA.Current Use: OverallDataquest asked the 100 survey participants whether they currently usedDCA. Table 4-1 shows the results.Table 4-1Current Use of DCA: OverallYesNoDo Not Know/RefuseSource: Dataquest (February 1997)Number ofRespondents33661Percentage33661Figure 4-1Types of DCA Used: OverallClearly, the majority of participants do not currently use DCA—a full twothirdssaid no. however, one-third do currently use DCA.Kinds of DCA Used: OverallNext, of the one-third of participants who do use DCA, Dataquest askedwhat types were being used. This was done, obviously, to determine if anyone t3rpe was more popular among the survey participants. Figure 4-1shows the results.Do Not Know/Refuse (10.6%) —\^___coF(2.i%) - y''^Flip Chip (6.4%) _ y / \ \/ MCM'"'"---..^*^(8.5%) ^__j;;::^VCOG y\ (8.5%) /^COB 1(51.1%) 1\/^ TAB 1 MX (12.8%) 1 ^ ^N = 100971013Source: Dataquest (February 1997)SSPS-WW-FR-9701 ©1997 Dataquest IVIarchS, 1997
Direct Chip Attachment 21Of those surveyed who use DCA, clearly the majority use COB—over51 percent. Trailing considerably is TAB, which is used by nearly 13 percentof respondents. Tying for third place on the "most used" Ust are COGand MCMs. Flip chip is fifth, with 6.4 percent using this form of DCA.Only 2.1 percent are currently using COF. Of those who now use DCA,10.4 percent either refused to answer or did not know what form theywere using.Plans to Change to Using DCA: OverallThose who do not use DCA were asked if they planned to adopt it by theend of 1997.As can be seen from Figure 4-2, the majority of those who do not use DCAnow have no plans to change by the end of 1997. The negative option gotover 80 percent of the respondents' votes. A mere 13.6 percent plan toadopt DCA by the end of 1997; 6.1 percent refused or did not know if theyplanned to use DCA by the end of 1997.Figure 4-2Plans to Begin Using DCA by the End of 1997: OverallDo Not Know/Refuse (6.1%)N = 100Source: Dataquest (February 1997)SSPS-WW-FR-9701 ©1997 Dataquest March 3,1997
.:22 Semiconductor Supply and Pricing WorldwideThe Three GroupsTable 4-2Use of DCA, by Group (Percent)The overall results are now broken into their three group categories—merchantmarket assemblers/suppliers, merchant market users/buyers, andthe captive group. The groups' results are conipared to see whether thereare any overall trends or whether each demonstrates niarkedly differentpatterns.Use of DCA: The Three GroupsThe first point to establish is how many respondents from each group nowuse DCA. Table 4-2 shows the results of this question by group, expressedin percentages. The only common thread among all three groups is thatthe majority in each does not now use DCA.The merchant market assemblers have the closest split between those whouse DCA and those who do not. Over 46 percent of this group use DCA atthe moment, while just under 54 percent do not. Of the merchant marketusers group, a resounding 81 percent do not go outside for DCA use atpresent, with just 19 percent using it. This shows a staggering differencebetween the two merchant market groups surveyed.Within the captive assemblers and users group, again the majority did notuse DCA. However, while the nonusers were in the majority (with nearly67 percent of the total vote), the DCA users accounted for over 31 percentof this group. Two percent of the captive group either did not know orrefused to answer the question.Figure 4-3 also shows that these three groups could easUy be classified forDCA used based on a technology or corporate style.In other words, the nierchant assemblers have a high technology focusand are aggressive and quick in their adoption of DCA. This group has tobe on the cutting edge, as its clients will be making the transition overtime. Also, as this is cutting-edge stuff, their present cUent base is internationallybased.The merchant users group, however, has a lower technology focus towardDCA. However, even though the members of this group are not too bullishabout their plarmed transition by the end of 1997, the merchant buyerswill move over with medium speed. This group has a variety of suppliersthat are capable of doing DCA—they merely need designs that includeDCA. Even on this they have help.Merchant MarketAssemblersMerchant MarketUsersCaptive Assemblersand UsersYes46.419.031.3NoDo Not Know/Refuse53.6081.0066.72.0Source: Dataquest (February 1997)SSPS-WW-FR-9701 ©1997 Dataquest IVIarchS, 1997
Direct Chip Attachment 23Figure 4-3Where the Three Groups FitSpeed of AdoptionaRapid —Medium —Siow/ConservativeLowSource: Dataquest (February 1997)IMedium1 ^High-TechnologyUse971015The captive group is hybrid. This group has a moderately high technologyfocus toward DCA but, as it continues to source it only in a proprietarym^anner, it is faced with more conservatism in its overall adoption classification.The only way around this is to source externally to begin with.Kinds of DCA Used: The Three GroupsAfter having established which respondents from each group currentlyuse DCA, Dataquest asked which kinds of DCA they used. Figure 4-3shows the results.Figure 4-4 shows that COB is the most popular type of DCA used by allgroups. Nearly 60 percent of both the captive group and merchant usersgroup use it. This compares with about 42 percent of merchant assemblers.One-fifth of all merchant users sampled use COG, compared withless than 6 percent for the captive group and nearly 8 percent for the merchantassemblers. The captive group also used about 6 percent MCM andTAB, while the only other form used by the merchant users was TAB (at20 percent).The merchant assemblers group has the most depth of the three groups interms of current DCA use. In addition to the COB and COG use mentionedabove, there is also a significant use of MCM and TAB, both at15.4 percent of the total sample. Flip chip was used by 11.5 percent of thesample group, which is extremely positive in light of its complexity, andCOF was lowest, at just below 4 percent.SSPS-WW-FR-9701 ©1997 Dataquest iVIarchS, 1997
24 Semiconductor Supply and Pricing WorldwideFigure 4-4Types of DCA Used: The Three Groupsm•HDUra•Do Not Know/RefuseFlip ChipTABMCMCOFCOGCOBMerchant MarketAssemblersMerchant MarketUsersCaptive Assembiersand UsersSource: Dataquest (February 1997)Plans to Use DCA by the End of 1997: The Three GroupsDataquest asked all three groups whether those not using DCA had plansto use it by the end of 1997.Figure 4-5 shows the results. Again, while there is quite a range of replies,the majority who do not use it at present have no plans to adopt it by theend of 1997. In both the merchant market users and the captive groups,over 88 percent have no plans to start using DCA. The line "Why fix it ifit's not broken?" would spring to mind.The merchant market assemblers group again had a majority of those notusing DCA and having no plans to start using it by the end of 1997. However,within this group, the negatives and affirmatives were less polarized.Although 53.3 percent had no plans to use DCA, over 33 percentwere planning to use it by the end of 1997. The remainder (13.3 percent)either did not know their companies' plans or refused to answer.Comparison of the Three Groups with the Overali ResultsFigure 4-6 clearly shows that the captive group most closely matches theoverall results. Both are split about one-third yes, two-thirds no. The merchantmarket groups vary wildly, both between each other and from theoverall/captive split. In tiie users group, that is, the open market buyersgroup, well over 80 percent do not use DCA and less than 20 percent douse it. The merchant assemblers, however, are nearer the 50/50 mark.Here, over 46 percent do use DCA and less than 54 percent do not atpresent.SSPS-WW-FR-9701 ©1997 Dataquest March 3,1997
Direct Chip Attachment 25Figure 4-5Plans to Use DCA by the End of 1997: The Three GroupsPercent90 tr80706050YesNoDo NotKnow/Refuse40-130-120100Merchant MarketAssemblersMerchant MarketUsersCaptive Assemblersand Users971017Source: Dataquest (February 1997)Figure 4-6Use of DCA: Comparison^Do NotKnow/RefuseW\ YesMerchant MarketAssemblersMerchant Market Captive Assemblers Overall FindingsUsersand Users971D18Source: Dataquest (February 1997)SSPS-WW-FR-9701 ©1997 Dataquest March 3,1997
26 Semiconductor Supply and Pricing WorldwideNext, Dataquest compared the findings of those who do not use DCA nowand their plans by end 1997.Figure 4-7 shows that there is a range of responses. However, it is the merchantusers and the captive group that most closely follow the overalltrend, in this case—over 80 percent with no plans to adopt DCA by theend of 1997. The overall figure is just over 80 percent, while 88 percent ofboth the merchant users and the captive groups gave a negative answer.The merchant assemblers are the exceptions here. Although over 53 percenthave no plans to use DCA by the end of 1997, over 33 percent do planto use it. A little over 13 percent do not know or refused in this group.AnalysisThese findings are of interest. Although it is not surprising that a majoritydoes not use DCA, it is significant that a third of respondents do. This is alot higher than was expected for the North America survey, in light of thetraditional applications in this region. DCA is a lot more widely used inJapan for consumer-type applications.The fact that COB is the most popular form of DCA used, in the overallfindings and among the captive and merchant users groups, is to beexpected. This form of DCA has been around the longest and people feelmost comfortable with designing with it or using it.Figure 4-7Plans to Use DCA by the End of 1997: Comparison^H ^°mDo NotKnow/RefuseYesMerchant MarketAssemblersMerchant MarketUsersCaptive Assemblersand UsersOverall Findings971019Source: Dataquest (February 1997)SSPS-WW-FR-9701 ©1997 Dataquest March 3,1997
Direct Chip Attachment 27Possible Application ImplicationsSignificantly, as the DCA usage is greatest among the merchant assemblers,their sample percentage of COB is a lot lower than the average. Thisis largely a reflection of their use of other forms.The really interesting finding is the percentage of the sample using themore "advanced" forms of DCA, for example, COG and flip chip. This isvery telling and indicates the level of design functionality amongrespondents.MCM use is also very high and extremely important. Over 15 percent ofthe merchant assemblers sampled use it. It is especially significant if oneconsiders that this involves the use of bare die, test die, and known gooddie (KGD), depending on the applications.TAB is also relatively high. This is obviously bigger in Japan than in theUnited States, but nearly 13 percent of the overall group sampled use itnow.Although each form examined falls into the DCA family, the typical andevolving applications of each specific form are different. The following isan outiine of just some of the applications for DCA:• COB: Most applications; often acts as an evolutionary stage beforeMCM• COG: Optical semiconductors, LEDs• COF: Telecom, radio frequency ICs (newer and more advanced)• MCM: Data processing, industrial, telecom• TAB: ASICs, laptops, handheld consumer products• Flip chip: Automotive, data processing, telecomSSPS-WW-FR-9701 ©1997 Dataquest IVIarch 3,1997
Chapter 5PCB Layers Used and Lead TimesDataquest primarily surveyed the IC assembly market. However, allrespondents were asked if they procure or use PCBs. Those who did forma subgroup within the overall survey. As very few from the merchantmarket assemblers group buy or use PCBs directly, this group has beenleft out of this chapter. The two remaining groups, merchant market usersand captive assemblers and users, were surveyed and analyzed.Dataquest wanted to establish what mix of PCB layers was being purchasedby the respondents at present and whether this would change in1997. Also, Dataquest wished to see if lead times differed depending onthe number of PCB layers purchased.Number of LayersFirstly, Dataquest sought to discover the PCB layer mix being used by thegroups. The respondents were asked to state what they were using or buyingat present.Figure 5-1PCB Layers for the Merchant UsersFigure 5-1 shows the sample split for the merchant market users group.For this group, four-layer boards are ranked No. 1—nearly 29 percent ofthe sample. Two-layer PCBs were ranked second, constituting almost24 percent of the sample. Thus, over half the sample uses or buys two- andfour-layer boards.N = 38971aaoSource: Dataquest (February 1997)SSPS-WW-FR-9701 ©1997 Dataquest 29
30 Semiconductor Supply and Pricing WorldwideFigure 5-2PCB Layers for the Captive CroupsSix-layer boards represented over 18 percent of the sample, eight-layerboards were nearly 16 percent of the sample, and the balance (just over13 percent) was made up of PCBs of 10 or more layers.Figure 5-2 shows the sample mix for the captive group. One-quarter of allsampled used or bought two-layer boards, but four-layer boards made upabout 23 percent. Thus, there is very little difference between two-layerand four-layer sample mixes. Combined, these make up over 48 percent ofthe sample.Nearly 20 percent of the sample used six-layer boards, while over 17 percentbought eight-layer boards. PCBs with 10 or more layers constitutedover 13 percent of the sample. In the captive group, just over 1 percenteither did not know the boards bought or refused to answer.Comparing the merchant users with the captive groups, the results aresurprisingly similar. There are slight variations between two- and fourlayerboards—the merchant users sampled buy more four-layer boards,with the captives buying more two-layer boards. That aside, two-layerand four-layer boards combine to make up nearly half the overall samplein both groups. Between six and 10 or more layers, the percentage in bothgroups is remarkably simitar. One observation is that among the captivegroup, a higher percentage of the sample bought six-layer and eight-layerboards than the merchant user group. This could be because of proprietarydesign issues, which may dictate the need for high layer numbers.Do Not Know/Refuse (1.3%)—,/^10-Layer 1X. or More 1/ Xri3.3%) 12-Layer \(25.2%) \/ 8-Layer >v(17.5%) ^\ ^•"-^"'^ 1 4-Layer M\ 6-Layer (23.1%) #\ (19.6%) 1 ^N = 143971021Source: Dataquest (February 1997)SSPS-WW-FR-9701 ©1997 Dataquest March 3,1997
PCB Layers Used and Lead Times 31Changing the MixNext, Dataquest asked all respondents if their PCB layer mix wouldchange by the end of 1997. The majority surveyed had no plans to altertheir mix by then.Lead Time versus LayersFigure 5-3 shows that weU over three-quarters of respondents did not planto change their mix by the end of 1997. Within the merchant users group,80 percent had no plans to change, with only slightly over 13 percent planningto alter the mix by year-end. Nearly 7 percent refused to answer ordid not know. For the captive assemblers and users group, the picture issimilar. Over 76 percent have no plans to change the mix by the end of1997, with just less than 11 percent plarming a change. In this group, a full13 percent either refused to comment or did not know if their companyplanned to alter the mix.Dataquest wanted to see if PCB lead times changed depending on thenumber of layers.As shown in Table 5-1, PCB lead times tend to be the same irrespective ofthe number of layers bought. Over 73 percent of the merchant buyers saythat their lead times are the same, with 20 percent sajdng that lead timedifferences do exist. The picture was similar for the captive group, as well,with over 65 percent saying that lead times tend to be the same.Figure 5-3Likelihood of Changing the Mix by the End of 199760.Percent80-70-50-40-HYes1^ NoDo NotKnow/Refuse30.20-10-0-Merchant MarketUsersmCaptive Assemblersand UsersSource: Dataquest (February 1997)SSPS-WW-FR-9701 ©1997 Dataquest March 3,1997
32 Semiconductor Supply and Pricing WorldwideTable 5-1Are Lead Times Different for Different Numbers of PCB Layers?(Percent)Merchant Market UsersSame73.3Different20.0Do Not Know/Refuse6.7Source: Dataquest (February 1997)Captive Assemblersand Users65.230.44.3However, over 30 percent said that some lead time differences existaccording to number of PCB layers. This is 50 percent higher than wasseen in the merchant users group. Perhaps, as the assemblers are captive,they feel justified in offering different lead times depending on the numberof layers bought. Captive user be warned—the merchant market is different.It is perhaps timely to try to standardize lead times with internalPCB vendors.Data AnalysisBoth groups clearly have a good mix in terms of PCB layers. The spUt forboth merchant users and captives was 50 percent two- and four-layerboards and 50 percent six-layer or more layer boards. What was evenmore positive was that PCBs of 10 or more layers accounted for about13 percent of total PCB volumes for both groups. This was certainly evidencethat the sample group was at the cutting edge for volume applicationsand packs a high degree of design functionality in each board.This has further significance in the area of CAD. For many applications,two-layer and four-layer PCB design can be conducted without the use ofa software package. The six-layer PCB is the break point. For six or morelayers, software support is required.Another point that reinforces the conclusion that the current mix of bothgroups is advanced is that the vast majority had no plans to change thespUt by the end of 1997. These respondents do not need to play catchupjust yet—their mix is well balanced and the penetration level is high.A very high proportion of respondents obtain the same lead time fromtheir PCB suppliers regardless of the number of board layers. This is aremarkable achievement and shows the degree of negotiating skill of themerchant and captive buyers. It is also, no doubt, related to the forecastingability of both parties. It was seen in IC Assembly Update 1996, Report 1(SPSG-WW-FR-9603), that a strong link exists between shorter lead timesand long-term forecasting of demand. It would follow that forecastinglong term to book up capacity or warn suppliers of demand changeswould make it easier for the suppMer to offer common lead times irrespectiveof the type of board to be made.SSPS-WW-FR-9701 ©1997 Dataquest March 3,1997
Chapter 6Quality Issues—PCB Inspection and Defect RateTarget PCB Defect RateFigure 6-1Target Defect Rate for Merchant UsersIC Assembly Update 1996, Report 1 found that quality was the most importantcriterion for PCB and IC assemblers' suppliers. In fact, all threegroups sampled listed quality as their No. 1 criterion of 12, acknowledgingthat quality is king in this business. In this chapter, Dataquest wanted toascertain how the PCB track within the IC assemblers group specificallymanaged quaUty-related issues.Again, as there was insufficient data from the merchant assembler group,Dataquest focused on the qualifying participants from the other twogroups, the captive assemblers and users group and the merchant marketusers group. The qualifying respondents were asked what their targetdefect rates were and whether ttiey physically check the PCBs (and if yes,how).Dataquest asked the qualifying survey participants what their targetnumber of defects was per miUion PCBs shipped, expressed in parts permillion (ppm), within a designated range.The most popular defect rate for PCBs among the merchant market usercommunity was under 5 ppm (see Figure 6-1). Nearly 47 percent ofrespondents chose this selection from the Dataquest ranges. In secondplace, based on merchant user selection, was the range between 5 ppmand 9 ppm. This was picked by over 26 percent of this survey group.About 13 percent of the sample had a targeted range between 10 and15 ppm.N = 15Source: Dataquest (February 1997)SSPS-WW-FR-9701 ©1997 Dataquest 33
34 Semiconductor Supply and Pricing WorldwideComparison of ResultsFigure 6-2The Captive Groups' Target Defect RateThe captive group survey participants were also asked about their targetdefect rate for PCBs. Figure 6-2 shows that, again, nearly half surveyedhad a target rate of under 5 ppni—good news. The second-highest pollingcame on the 20 ppm and above range, with over 11 percent. The range of5 to 9 ppm showed slightly vmder 9 percent. Over 33 percent of thosepolled either refused to answer or did not know.Nearly half of the respondents from both groups had PCB defect rates ofless than 5 ppm. This would indicate how quality conscious they are asPCB consumers. Also, as the ppm defect rate is meant to be a realisticobjective for the PCB suppliers, it would indicate an exceptionally highlevel of PCB yields at present. These suppliers are obviously doing mostthings right. The users, by working with their suppliers, can put the necessarychecks and measures in place to ensure that the PCBs coming out arealmost defect free and thus meet the goal of fewer than five defects permillion boards shipped.One must always remember that the ultimate measure of quality is zerodefects—a buyer needs to be fully confident that all parts received meetspecifications and will work. No respondent surveyed had this as a currentgoal. Whether it will become a goal remains to be seen.N=46971D24Source: Dataquest (February 1997)SSPS-WW-FR-9701 ©1997 Dataquest March 3,1997
Quality Issues—PCB Inspection and Defect Rate 35PCB InspectionOn the whole, however, the merchant users had higher defects standards.All participants who responded had targets below 15 ppm. The captivegroup appeared to be more lenient. Over 11 percent had a rate in excess of20 ppm. Although this rate is not criminally high, it is certainly pushingthe envelope of acceptable quality. Would this goal be acceptable if thesupplier was external? Is it a case of one standard for an internal division,another for an external company?Another concern is that one-third of all captive respondents either refusedto answer or did not know what their target rate was, compared to about13 percent in the merchant users group. The hope is that most of that numberrefused to answer, because the possibility that they did not know theirdefects rate is quite a worrying scenario.One factor that should not be ignored is price and suitability. A PCB supplierhas to be the correct fit for a company, and the cost per board shouldcover the quality checks necessary to minimize defect rates on finishedPCBs. It is a futile exercise to select the supplier with the cheapest priceand greatest defect rate and try to improve quality. The buyers may findout the hard way that the purchase price of the PCB is a fraction of thetotal cost of ownership. It is far more beneficial to work with a vendor todrive down individual board costs through layout changes, processrefinements, and batch size optimization when the defect rate is low. Reliabilityis higher, and time and hard cash are saved.It is worth noting, though, that in certain circumstances a higher thanaverage defect rate is tolerable. This may be the case when a PCB layout isextremely complex (high line density) or a board is being prototyped. Itmay also be acceptable in high-volume, low-cost application where thefault can easily be detected with Uttie or no impact to the buyer and endcustomer.Dataquest asked all qualifying respondents whether they physicallyinspected the PCBs. This check would be conducted at the supplier's premises,at the buyer's location, or at a third-party hub.Table 6-1 shows the spUt of those who do and do not physically inspectPCBs bought. Well over 80 percent of both groups perform some form ofcheck on PCBs.Table 6-1Physical Checking of PCBs (Percent)Merchant Market UsersYes86.7No13.3Do Not Know/Refuse0Source: Dataquest (February 1997)Captive Assemblersand Users82.615.22.2SSPS-WW-FR-9701 ©1997 Dataquest March 3,1997
36 Semiconductor Supply and Pricing WorldwideIn the case of the merchant users group, over 86 percent do check thePCBs; about 13 percent do not check. In the captive group, well over82 percent of those surveyed do check the PCBs procured, with slightlyover 15 percent not checking and about 2 percent who did not know orrefused to answer.Those who do perform a physical inspection on the PCBs were askedwhether they check aU or batches of PCBs bought.Figure 6-3 shows that the majority of both groups do perform batchinspections on PCBs. However, a significant percentage from both groupscheck all received PCBs. For the merchant users group, the split betweeninspecting batches and all PCBs is nearly 60/40. The captive group is morepolarized—about one-quarter examine all received PCBs, with three-quartersperforming batch inspections.Data AnalysisAs Table 6-1 showed, a very significant portion of respondents from bothgroups do perform some form of quality inspection on incoming PCBs.From both groups, this was well over 80 percent.Figure 6-3Checking All PCBs or BatchesOf those that perform some physical inspection, Dataquest asked whetherbatch or total inspection was done. It was imagined that nearly aU respondentswould conduct batch inspection. Interestingly, this was not the case.Although a majority did perform batch inspection, a significant portion ofthose surveyed do conduct a physical inspection of all PCBs—this portionwas 38.5 percent for merchant users and 23.7 percent for the captivegroup.Percent100-| —90-80-70-60-50-40-30-20-10-0-!=Merchant UsersCaptive GroupISDo Not Know/RefuseBatchesAllSource: Dataquest (February 1997)SSPS-WW-FR-9701 ©1997 Dataquest March 3,1997
Quality Issues—PCB Inspection and Defect Rate 37This has some interesting dimensions. As the percentage is higher amongthe external buyers, perhaps it is a reflection of their inherent distrust oftheir suppliers. Or, the reason could be that the quality history of theirPCB suppliers is very poor, and thus a thorough inspection by the buyer'scompany or agents is the only way to guarantee quality. If this is the case,then clearly these buyers are using the wrong suppliers. It would be farmore beneficial to work with suppliers that had a realistic chance of attaininga good quality record and meeting their target defect rate.There is, of course, another possible explanation. It could well be that thePCB design the buyers' company is using is too difficult to manufacturesuccessfully. If this is indeed the case, then it would reduce costs considerablyif the design were re-engineered.There is a flip side of this, however. There are cases where the trace widthson the PCB are extremely critical. As the designer is pushing the envelopefurther and further, a certain critical point is reached, and the manufacturerstarts running into difficulties producing the boards using currentdesign methods. In this case, there is no solution but to examine all PCBs.Finally, in some solutions, design of the board is critical and a full inspectionis needed. In these cases, this is a far cheaper solution than scrappingeverything once a problem has been detected after assembly.SSPS-WW-FR-9701 ©1997 Dataquest March 3,1997
Chapter 7Analysis and ConclusionsReviewing the findings of the PCB technology chapter reveals a polarizationin technology transition types among the three groups. Although overhalf of all surveyed groups used less than 50 percent through-hole technology,the degree of use is quite varied among the captive group (under60 percent), the merchant assemblers (just over 60 percent), and the merchantusers (nearly 86 percent). Likewise, about half of the merchantassemblers and the captive group used more than 50 percent SMT, whileover 70 percent of the merchant buyers are using more than half SMT.There was a clear tie-in between a group's current percentage mix ofthrough hole and SMT and any changes the respondents planned to makeby the end of 1997. The merchant users group has made the biggest moveaway from through hole to SMT; they also gave the least positive responsewhen asked if their mix would change. By contrast, over two-thirds of allmerchant assemblers planned to change their mix.What was of most surprise to Dataquest was the responses of the captivegroup. It was imagined that as assembly work was done internally andgoals and company name were shared, a bigger shift toward newer technologyforms would be evident. This was not the case—this group was themost conservative of all three surveyed. Also, when asked if they plannedto alter their mix by end of 1997, only about 55 percent said they would.One conclusion to be drawn from the above PCB technology analysisrelates to the cost of capital equipment. The merchant users have made noinvestment in equipment and so can afford to be the most bullish in theirmigration to newer forms of technology. However, the merchant assemblersand the captive group both had to make investments in equipmentthat they are writing off over time. That said, though, the merchant assemblersare making a faster transition to SMT—they need to be flexible, ortheir customers will move business away. The captive group is far lessflexible in its technology shift. The captive assembler group knows its customerbase cannot go anywhere else and so is change resistant. A word ofwarning, however: times are changing. There are few guarantees in life—apart from the sun always rising in the east and setting in the west. Captivecustomers today may be merchant customers in the future as manycompanies restructure.Interestingly, advanced forms of technology get a lot of talk time, butData quest's sample showed that only a very minor number use a technologythat can be classified as advanced. This was true of merchant users, asweU, indicating that IC assembler buyers are not requiring more advancedtechnology forms yet for volume production. Perhaps in a year, as the prototypedesigns that may now be using advanced forms increase to reasonablevolumes, this mix wUl change.The results of the direct chip attachment section are also very interesting.Overall, over two-thirds do not use DCA and a resounding niajority (over80 percent) have no plans to do so by the end of 1997, but, again, a considerableuptake variation was seen in the three individual groups. Here, itSSPS-WW-FR-9701 ©1997 Dataquest 39
40 Semiconductor Supply and Pricing Worldwidewas the merchant assemblers who were the most high tech and aggressivein their DCA adoption. Over 46 percent currently use it, and a third ofthose who do not now use it plan to do so by the end of 1997. The merchantbuyers group was the least high tech (under 20 percent of the groupuse DCA at the moment), while the captive group followed the middlecourse more often (less than a third use it). These two group are also conservativein their adoption plans—88 percent of those not using it nowhave no plans to use DCA by the end of 1997.Not surprisingly, the most popular form of DCA overall was COB. This isa familiar form and one a lot of designers feel comfortable with. Far moresignificant was the high use of TAB, flip chip, COG, and MCM among themerchant assemblers group. This group is really at the bleeding edge oftechnology in the North American context. It is clearly seen that this businessremains specialized on a global basis. Even though DCA uptake waslow among the merchant buyers, the merchant assemblers will continue tofind customers internationally, and a large number not currently using itare planning to start to by the end of 1997.In the mix of PCB boards bought by the groups (by volume), there is quitea wide range. For the captive group, under 50 percent of its total procuredvolume comprises two-layer and four-layer boards, with the rest at six,eight, and 10 layers and above. The merchant users bought slightly overhalf at two or four layers, and, again, the rest was at six layers and above.It can be concluded that designs produced by the groups require a largenumber of layers and as such have a high functionality.Interestingly, when asked if lead times were the same irrespective of thenumber of layers bought, most said yes. However, the affirmativeresponse among merchant users (73 percent) was a lot stronger thanamong the captive group (65 percent). The merchant buyers are trained toreduce total cost of ownership, of which lead time is a significant part. Ifthey carmot get a good lead time from one supplier, they will move elsewhere. Thus, on the whole, their lead times are the same for all. The captivegroup seemed considerably more limited in its sphere of vision. Thisgroup's buying world ends at its sister division. The captive group needsto be more aggressive and demand lead time parity, regardless of thenumber of board layers. This can significantiy reduce ownership costs andwill bring this group into line with the outside world.The findings of the PCB procurement quality section are quite interesting.About half of respondents from both the merchant buyers and the captivegroups had a target defect rate for PCBs of less than 5 ppm. This is goodnews all around, as it demonstrates the high focus procured quality getswithin their organizations. It also has echoes of Dataquest's IC AssemblyUpdate 1996, Report 1, which showed that quality was the most importantcriterion for all groups. In order for a target defect rate of less than 5 ppmto be valid, however, it has to be a realistic and attainable goal for the PCBsuppliers. The PCB buyers must work with their suppliers to improvequality and acknowledge that "you get what you pay for." A high-qualitysupplier will usually not have the cheapest sales price per boeird but wiUreduce total cost of ownership. Similarly, as half of the PCBs bought byboth groups surveyed are six or more layers, complexity increases and theneed for a low defect rate increases.SSPS-WW-FR-9701 ©1997 Dataquest March 3,1997
Analysis and Conclusions 41Dataquest asked if the respondents physically inspected PCBs and, surprise,most did—well over 80 percent of both groups. However, a veryhigh percentage inspected all PCBs bought. Either this means that thegroups are paranoid about quality or their suppliers have a quality problem.Inspecting all PCBs is a very time- and labor-intensive process andwould not be undertaken unless there was a pressing reason. Perhaps,these participants need to:• Examine who they buy from—is it the correct fix to minimize total costof ownership?• Determine a realistic defect rate target and work with suppliers toachieve it• Simplify board design, where possible, if a board is proving difficult tomanufacture• Regularly audit PCB suppliers to vet quality levels independently• Do a critical cost analysis and continue to inspect all only as long as itremains cheaper to do this than to scrap finished assembliesBuyers, however, must acknowledge that some designs are just too difficultto make with low defect rates, as they are at the leading edge of manufacturability.In these cases, only inspection of all will determine thequality level.Reassuringly, though, the overall majority do inspect PCBs in batches, nodoubt having predetermined pass and fail criteria. One interesting point,however: no buyer had a target defect rate of zero. The true measure ofquality is zero, meaning the product delivered meets specifications 100percent of the time. Although this measure of quality is a great idea, thereal world would make it very difficult to achieve. Another interestingobservation is that none of the buyers, be they captive or merchant,trusted the suppliers' quality inspection and performed no quality check.This shows that it does not matter in what organization buyers sit, theystill never fully tiust their suppliers. Although this would seem to be areflection of human nature, it is also an older-fashioned way of purchasing—itwould be considerably simpler for the supplier to own the productsand be responsible for the goods made until they are used and theend product finally tested. This is a method used in many car factories. Ifthese buyers can achieve this with their suppliers, it may be worth exploringby nonautomotive buyers. If it won't fly, Wilbur, then a way of gettingthe supplier to pay for the test cost and lost productivity should be instigated.When a buyer hits a supplier where it hurts most (that is, in the bottomline), the supplier has an added incentive to strive to meet qualitygoals.A resounding echo from all the data is that the processes of chip design,chip packaging, and PCB production are at vastly different evolutionpoints. It is fair to say that chip design is aeons ahead of volume PCB manufacturingcapability. As long as this remains the case, there wiU be a hostof new, advanced PCB design and manufacturing houses springing uplike mushrooms. These outfits can meet the challenges of working at tinedesign coal face.SSPS-WW-FR-9701 ©1997 Dataquest March 3,1997
41 Semiconductor Supply and Pricing WorldwideAlso, as the volume manufacturers get more and more requests from theirclients for newer forms of product, the acquisition of small PCB designhouses by larger manufacturers wiU continue. The hope is to offer a threepunchsolution to current problems under the same umbrella—boarddesign, prototype production, and volume production.Pulling the threads from all the chapter together leads to the conclusionthat the coat being woven may be complex, but so far, the pattern is pleasingto the eye.SSPS-WW-FR-9701 ©1997 Dataquest March 3,1997
For More Information...Evelyn Cronin, Senior Industry Analyst (408) 468-8075Internet addressevelyn.cronin@dataquest.comVia fax (408) 954-1780<strong>DataQuest</strong>A Gartner Group CompanyThe content of this report represents our interpretation and analysis of information generally available to the publicor released by responsible individuals in the subject companies, but is not guaranteed as to accuracy or completeness.It does not contain material provided to us in confidence by our clients. Reproduction or disclosure in whole or inpart to other parties shall be made upon the written and express consent of Dataquest.©1997 Dataquest—Reproduction ProhibitedDataquest is a registered trademark of A.C. Nielsen Company
DATAQUEST WORLDWIDE OFFICESNORTH AMERICAWorldwide Headquarters251 River Oaks ParkwaySan Jose, California 95134-1913United StatesPhone: 1-408-468-8000Facsimile: 1-408-954-1780EUROPEEuropean HeadquartersTamesis, The GlantyEgham, Surrey TW20 9AWUnited KingdomPhone:+44 1784 431 611Facsimile: +44 1784 488 980ASIA/PACIFICAsia/Pacific HeadquartersSuite 5904-7, Central Plaza18 Harbour Road, WanchaiHong KongPhone: 852-2824-6168Facsimile: 852-2824-6138East Coast HeadquartersNine Technology DriveP.O. Box 5093Westborough, Massachusetts 01581-5093United StatesPhone: 1-508-871-5555Facsimile: 1-508-871-6262Dataquest Global Events3990 Westerly Place, Suite 100Newport Beach, California 92660United StatesPhone: 1-714-476-9117Facsimile: 1-714-476-9969Sales Offices:Washington, DC (Federal)New York, NY (Financial)Dallas, TXLATIN AMERICAResearch Affiliates and Sales Offices:Buenos Aires, ArgentinaSao Paulo, BrazilSantiago, ChileMexico City, MexicoDataquest FranceImmeuble Defense Bergeres345, avenue Georges ClemenceauTSA 4000292882 - Nanterre CTC Cedex 9FrancePhone: +33 1 41 35 13 00Facsimile: +33 1 41 35 13 13Dataquest GermanyKronstadter Strasse 981677 MiinchenGermanyPhone: +49 89 93 09 09 0Facsimile: +49 89 93 03 27 7Sales Offices:Brussels, BelgiumKfar Saba, IsraelMilan, ItalyRandburg, South AfricaMadrid, SpainJAPANJapan HeadquartersAobadai Hills 4-7-7AobadaiMeguro-ku, Tokyo 153JapanPhone: 81-3-3481-3670Facsimile: 81-3-3481-3644Dataquest KoreaSuite 2407, Trade Tower159 Samsung-dong, Kangnam-guSeoul 135-729KoreaPhone: 822-551-1331Facsimile: 822-551-1330Dataquest TaiwanllF-2, No. 188, Section 5Nan King East RoadTaipeiTaiwan, R.O.C.Phone: 8862-756-0389Facsimile: 8862-756-2663Dataquest Singapore105 Cecil Street#06-01/02 The OctagonSingapore 069534Phone: 65-227-1213Facsimile: 65-227-4607Dataquest Thailand12/F, Vanissa Building29 Soi ChidlomPloenchit RoadPatumwan, Bangkok 10330ThailandPhone: 662-655-0577Facsimile: 662-655-0576iResearch Affiliates and Sales Offices:Melbourne, AustraliaBeijing, ChinaDataquestA Gartner Group Companyi©1997 Dataquest