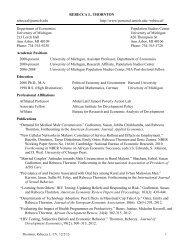
Figure 4. Number of Metro Areas by <strong>Population</strong> Size, 2000,(and Share of <strong>Population</strong> by Metro Size)400350300250200150100500Figure 5. New Hierarchy Options for Local AreasMETROPOLITAN331149 (8.0%)121 (20.2%)61 (52.2%)Old PMSAs/MSAsUnder 250KMetropolitanStatisticalAreasMetropolitanDivisions250K to 1 millionSource: Authors’ calculations of Census 2000 data and OMBCombinedStatisticalAreas(two or more metrosand/or micros)New MetroSAsMicropolitanStatisticalAreasOver 1 millionNOT METROPOLITANNote: These options are not available for all 361 <strong>metropolitan</strong> areas and 573 micropolitan areas.There are 120 combined statistical areas that encompass 163 <strong>metropolitan</strong> and 153 micropolitanareas. Twenty-nine <strong>metropolitan</strong> divisions exist within 11 metroplitan areas.Source: OMB361194 (9.9%)118 (19.7%)49 (53.0%)ing MetroSAs or MicroSAs. Theyrange in size from <strong>the</strong> two-county Clovis-Portales,NM CSA (population63,000), which consists of <strong>the</strong> ClovisMicroSA and <strong>the</strong> Portales MicroSA, to<strong>the</strong> 30-county New York-Newark-Bridgeport, NY-NJ-CT-PA CombinedStatistical Area (population21,361,797), made up of six MetroSAsand one MicroSA. OMB designatesCSAs where certain cross-area commutinglevels are met, and in specifiedcircumstances where local input favors<strong>the</strong> designation. There are currently123 CSAs (those associated with <strong>the</strong>greater Atlanta area, Dallas–Ft. Wortharea, and New York area are illustratedbelow). Just over half (198) of all MetroSAsare located in a CSA.These areas are primarily useful forlocal analyses, as <strong>the</strong>y give users amore expansive way to define <strong>the</strong>irparticular region. CSAs are ill-suitedfor cross-<strong>metropolitan</strong> analyses, since<strong>the</strong>y are very different analytic unitsthan MetroSAs.The o<strong>the</strong>r <strong>metropolitan</strong> innovationin <strong>the</strong> new standards that may assistlocal area analyses is <strong>the</strong> MetropolitanDivision. OMB designated MetropolitanDivisions within each of 11MetroSAs with populations of over2,500,000, and <strong>the</strong>y reflect single ormulti-county areas with close commutingties. Examples include <strong>the</strong>Washington-Arlington-Alexandria,DC-VA-MD-WV Metropolitan Divisionand Be<strong>the</strong>sda-Frederick-Gai<strong>the</strong>rsburg,MD Metropolitan Divisionwithin <strong>the</strong> Washington-Arlington-Alexandria, DC-VA-MD-WV MetropolitanStatistical Area, and <strong>the</strong>Dallas-Plano-Irving, TX MetropolitanDivision and Fort Worth-Arlington, TXMetropolitan Division within <strong>the</strong> Dallas-FortWorth-Arlington, TX MetropolitanStatistical Area.These Metropolitan Divisions, ascomponents of MetroSAs, somewhatresemble PMSAs under <strong>the</strong> old system.However, because only a few verylarge MetroSAs contain MetropolitanDivisions, while PMSAs were much6November 2004 • The Brookings InstitutionThe Living Cities Census Series
Table 1. Geographic and Demographic Coverage, Old and New StandardsNumber Share of National <strong>Population</strong> Share ofOLD STANDARDS of Counties Land Area in 2000 National <strong>Population</strong>Metropolitan 848 20% 226,207,070 80.4%Non-<strong>metropolitan</strong> 2293 80% 55,214,836 19.6%NEW STANDARDSMetropolitan 1089 25.3% 232,579,940 82.6%Micropolitan 690 20.3% 29,412,298 10.5%Non-core-based 1362 54.4% 19,429,668 6.9%Source: Census 2000 and OMBmore common, Metropolitan Divisionsare less practical geographic units fornationwide analyses. The highermetro-wide population threshold toestablish Metropolitan Divisions (atleast 2.5 million) versus that to establishPMSAs (at least 1 million) meansthat <strong>the</strong> new system contains 29 MetropolitanDivisions within 11 MetroSAs,compared to 73 PMSAs within18 CMSAs under <strong>the</strong> old system. Still,Metropolitan Divisions provideincreased flexibility for local analyses.In some <strong>metropolitan</strong> areas, <strong>the</strong>n,users are able to choose among a <strong>metropolitan</strong>hierarchy that includes allthree types of areas: CSAs, MetroSAs,and Metropolitan Divisions.B. New micropolitan areas, toge<strong>the</strong>rwith <strong>the</strong>ir <strong>metropolitan</strong> area counterparts,increase <strong>the</strong> reach of OMB’sstatistical areas to encompass 93percent of U.S. population and 46percent of its land area.The micropolitan statistical area(designated in this paper as MicroSA)is perhaps <strong>the</strong> most innovative conceptcreated with <strong>the</strong> new standards. OMBdeveloped MicroSAs in response toarguments that smaller communitieslocated outside of metro areasdeserved recognition as self-containedsettlements. They are defined in a parallelmanner to MetroSAs in that <strong>the</strong>yare core-based, meaning <strong>the</strong>y consistof one or more counties centered on acontiguous urban area. MicroSAs andMetroSAs differ primarily in <strong>the</strong> populationof <strong>the</strong>ir core areas: between10,000 and 50,000 for MicroSAs, andat least 50,000 for MetroSAs. SomeMicroSAs have larger populationsthan <strong>the</strong> smallest MetroSAs, but areclassified as <strong>the</strong> former because <strong>the</strong>ircore urban areas have less than50,000 people. MicroSAs range in sizefrom about 13,000 (Andrews, TX) toover 180,000 (Torrington, CT), andMetroSAs range in size from just over50,000 (Carson City, NV) to 18.3 million(New York-Nor<strong>the</strong>rn New Jersey-Long Island, NY-NJ-PA).The new standards define 573MicroSAs in addition to <strong>the</strong> 361 MetroSAs.The 573 MicroSAs incorporate690 counties, indicating that <strong>the</strong>majority of <strong>the</strong>se areas include justone county. Because of <strong>the</strong> way <strong>the</strong>ywere defined, OMB refers to bothtypes of areas as core-based statisticalareas (CBSAs). Toge<strong>the</strong>r, <strong>the</strong>secore-based areas cover a much largershare of <strong>the</strong> nation’s population andlandmass than <strong>metropolitan</strong> areasalone under <strong>the</strong> old standards. Thecombined MetroSAs and MicroSAsnow comprise 93 percent of U.S. populationand 46 percent of its land area.In comparison, <strong>the</strong> old <strong>metropolitan</strong>areas comprised 80 percent of <strong>the</strong>nation’s population and just 20 percentof its land area (Table 1).For analysts used to distinguishingbetween <strong>metropolitan</strong> and non<strong>metropolitan</strong>populations, MicroSAs belongto <strong>the</strong> latter category. However, <strong>the</strong>yrepresent only part of <strong>the</strong> nation’snon<strong>metropolitan</strong> territory. The remainingportion of non<strong>metropolitan</strong> landassumes <strong>the</strong> somewhat cumbersometerm, “non-core-based areas.” BecauseMicroSAs comprise 60 percent of <strong>the</strong>total non-<strong>metropolitan</strong> population, it isnow less appropriate to think of <strong>the</strong>nonmetropolian population as wholly“rural.”Researchers from <strong>the</strong> CensusBureau and o<strong>the</strong>r federal agencies willincorporate <strong>the</strong> new micropolitan areaconcept <strong>into</strong> a range of national statistics,opening up a whole new field ofstudy for demographers, planners, andpolicy makers. The location and profileof MicroSAs is quite varied. Table2 shows that states housing <strong>the</strong> largestnumber of MicroSAs are not <strong>the</strong>nation’s largest states, but are heavilyconcentrated in <strong>the</strong> Midwest andSouth, and comprise a larger share ofoverall population <strong>the</strong>re. Texas, Ohio,North Carolina, Indiana, and Georgialead all o<strong>the</strong>r states in <strong>the</strong> number ofmicropolitan areas, whereas <strong>the</strong> highlyurbanized states of Massachusetts,Rhode Island and New Jersey do nothave any. Small states with numerouscounties like Iowa, Nebraska, andSouth Dakota each have moreMicroSAs than California.Recent analyses by Lang (2004) andNovember 2004 • The Brookings InstitutionThe Living Cities Census Series7