

Zambia Demographic and Health Survey 2001-2002 - Measure DHS
Zambia Demographic and Health Survey 2001-2002 - Measure DHS
Zambia Demographic and Health Survey 2001-2002 - Measure DHS

Create successful ePaper yourself
Turn your PDF publications into a flip-book with our unique Google optimized e-Paper software.
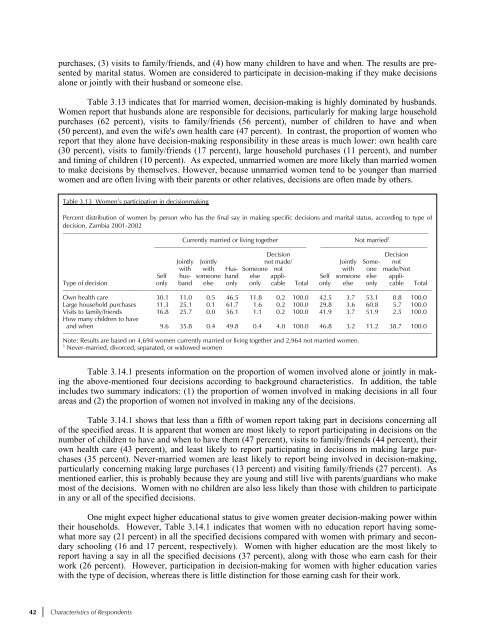
purchases, (3) visits to family/friends, <strong>and</strong> (4) how many children to have <strong>and</strong> when. The results are presentedby marital status. Women are considered to participate in decision-making if they make decisionsalone or jointly with their husb<strong>and</strong> or someone else.Table 3.13 indicates that for married women, decision-making is highly dominated by husb<strong>and</strong>s.Women report that husb<strong>and</strong>s alone are responsible for decisions, particularly for making large householdpurchases (62 percent), visits to family/friends (56 percent), number of children to have <strong>and</strong> when(50 percent), <strong>and</strong> even the wife's own health care (47 percent). In contrast, the proportion of women whoreport that they alone have decision-making responsibility in these areas is much lower: own health care(30 percent), visits to family/friends (17 percent), large household purchases (11 percent), <strong>and</strong> number<strong>and</strong> timing of children (10 percent). As expected, unmarried women are more likely than married womento make decisions by themselves. However, because unmarried women tend to be younger than marriedwomen <strong>and</strong> are often living with their parents or other relatives, decisions are often made by others.Table 3.13 Women’s participation in decisionmakingPercent distribution of women by person who has the final say in making specific decisions <strong>and</strong> marital status, according to type ofdecision, <strong>Zambia</strong> <strong>2001</strong>-<strong>2002</strong>–––––––––––––––––––––––––––––––––––––––––––––––––––––––––––––––––––––––––––––––––––––––––––––––––––––––––––––––––Currently married or living together Not married 1––––––––––––––––––––––––––––––––––––––––––––––– –––––––––––––––––––––––––––––––––DecisionDecisionJointly Jointly not made/ Jointly Some- notwith with Hus- Someone not with one made/NotSelf hus- someone b<strong>and</strong> else appli- Self someone else appli-Type of decision only b<strong>and</strong> else only only cable Total only else only cable Total––––––––––––––––––––––––––––––––––––––––––––––––––––––––––––––––––––––––––––––––––––––––––––––––––––––––––––––––––Own health care 30.1 11.0 0.5 46.5 11.8 0.2 100.0 42.5 3.7 53.1 0.8 100.0Large household purchases 11.3 25.1 0.1 61.7 1.6 0.2 100.0 29.8 3.6 60.8 5.7 100.0Visits to family/friends 16.8 25.7 0.0 56.1 1.1 0.2 100.0 41.9 3.7 51.9 2.5 100.0How many children to have<strong>and</strong> when 9.6 35.8 0.4 49.8 0.4 4.0 100.0 46.8 3.2 11.2 38.7 100.0––––––––––––––––––––––––––––––––––––––––––––––––––––––––––––––––––––––––––––––––––––––––––––––––––––––––––––––––––Note: Results are based on 4,694 women currently married or living together <strong>and</strong> 2,964 not married women.1Never-married, divorced, separated, or widowed womenTable 3.14.1 presents information on the proportion of women involved alone or jointly in makingthe above-mentioned four decisions according to background characteristics. In addition, the tableincludes two summary indicators: (1) the proportion of women involved in making decisions in all fourareas <strong>and</strong> (2) the proportion of women not involved in making any of the decisions.Table 3.14.1 shows that less than a fifth of women report taking part in decisions concerning allof the specified areas. It is apparent that women are most likely to report participating in decisions on thenumber of children to have <strong>and</strong> when to have them (47 percent), visits to family/friends (44 percent), theirown health care (43 percent), <strong>and</strong> least likely to report participating in decisions in making large purchases(35 percent). Never-married women are least likely to report being involved in decision-making,particularly concerning making large purchases (13 percent) <strong>and</strong> visiting family/friends (27 percent). Asmentioned earlier, this is probably because they are young <strong>and</strong> still live with parents/guardians who makemost of the decisions. Women with no children are also less likely than those with children to participatein any or all of the specified decisions.One might expect higher educational status to give women greater decision-making power withintheir households. However, Table 3.14.1 indicates that women with no education report having somewhatmore say (21 percent) in all the specified decisions compared with women with primary <strong>and</strong> secondaryschooling (16 <strong>and</strong> 17 percent, respectively). Women with higher education are the most likely toreport having a say in all the specified decisions (37 percent), along with those who earn cash for theirwork (26 percent). However, participation in decision-making for women with higher education varieswith the type of decision, whereas there is little distinction for those earning cash for their work.42 │ Characteristics of Respondents


![Obtaining Informed Consent for HIV Testing [QRS4] - Measure DHS](https://img.yumpu.com/49850117/1/190x245/obtaining-informed-consent-for-hiv-testing-qrs4-measure-dhs.jpg?quality=85)


