Financial summaryProfit and loss statement(| Crore)(Year-end March) FY12 FY13 FY14E FY15ETotal operating Income 571.1 653.9 756.9 846.7Growth (%) 8.6 14.5 15.8 11.9Raw Material Expenses 43.0 51.1 59.0 66.0Employee Expenses 173.1 186.6 211.9 237.1Other Exp 336.4 303.5 303.5 339.5Total Operating Expenditure 552.5 541.2 574.5 642.6EBITDA 18.6 112.6 182.4 204.1Growth (%) -88.1 505.2 62.0 11.9Depreciation 102.2 138.7 140.4 142.1Interest 321.3 405.4 366.5 341.6Other Income 16.6 6.7 8.0 10.0PBT -388.2 -424.7 -316.5 -269.7Exceptionals -417.7 -3.3 0.0 0.0Total Tax 10.8 12.09 0.0 0.0PAT 18.6 -433.5 -316.5 -269.7Growth (%) -50.8 -2,428.5 PL NAEPS (|) 0.5 -10.4 -7.6 -6.4Source: Company, <strong>ICICI</strong>direct.com ResearchCash flow statement(| Crore)(Year-end March) FY12 FY13 FY14E FY15EProfit after Tax 18.6 -433.5 -316.5 -269.7Add: Depreciation 102.2 138.7 140.4 142.1(Inc)/dec in Current Assets 32.7 40.6 88.9 -88.1Inc/(dec) in CL and Provisions -126.9 -77.4 62.6 37.0Others 23.1 5.4 35.8 40.9CF from operating activities 49.7 -326.3 11.2 -137.7(Inc)/dec in Investments 0.0 0.0 0.0 0.0(Inc)/dec in Fixed Assets 110.0 -327.0 0.0 0.0Others 14.0 21.7 89.5 23.7CF from investing activities 124.0 -305.3 89.5 23.7Issue/(Buy back) of Equity 0.0 6.2 0.0 0.0Inc/(dec) in loan funds 569.2 563.9 119.0 200.0Dividend paid & dividend tax -9.7 -9.7 -9.7 -9.7Inc/(dec) in Sec. premium 0.0 9.2 0.0 0.0Others -777.8 89.9 -194.6 -72.4CF from financing activities -218.2 659.6 -85.3 117.9Net Cash flow -41.6 18.8 15.4 3.9Opening Cash 58.2 16.6 35.4 50.9Closing Cash 16.6 35.4 50.9 54.7Source: Company, <strong>ICICI</strong>direct.com ResearchBalance sheet(| Crore)(Year-end March) FY12 FY13 FY14E FY15ELiabilitiesEquity Capital 77.6 83.7 83.7 83.7Reserve and Surplus 1,512.7 1,138.2 762.7 493.1Total Shareholders funds 1,590.3 1,221.9 846.4 576.8Total Debt 4,372.3 4,936.3 5,055.3 5,255.3Deferred Tax Liability 146.2 123.1 123.1 123.1Total Liabilities 6,108.9 6,281.3 6,024.8 5,955.2AssetsGross Block 5,696.6 6,023.6 6,173.6 6,173.6Less: Acc Depreciation 618.3 756.9 897.3 1,039.5Net Block 5,078.3 5,266.6 5,276.2 5,134.1Capital WIP 498.8 498.8 348.8 348.8Total Fixed Assets 5,577.0 5,765.4 5,625.0 5,482.8Inventory 59.6 71.3 53.1 62.9Debtors 53.7 58.8 51.8 58.0Loans and Advances 339.1 281.6 218.0 290.1Cash 16.6 35.4 50.9 54.7Total Current Assets 468.9 447.2 373.7 465.7Creditors 29.5 44.9 72.6 92.8Provisions 118.1 25.3 60.2 77.0Total Current Liabilities 147.6 70.2 132.8 169.8Net Current Assets 321.3 377.0 240.9 295.9Application of Funds 6,108.9 6,281.3 6,024.8 5,955.2Source: Company, <strong>ICICI</strong>direct.com ResearchKey ratios(Year-end March) FY12 FY13 FY14E FY15EPer share data (|)EPS 0.5 -10.4 -7.6 -6.4Cash EPS 3.2 -7.0 -4.2 -3.0BV 42.1 29.2 20.2 13.8DPS 0.0 0.0 0.0 0.0Cash Per Share 0.4 0.8 1.2 1.3Operating Ratios (%)EBITDA Margin 3.3 17.2 24.1 24.1PBT / Total Operating income -68.0 -65.0 -41.8 -31.8PAT Margin 3.3 -66.3 -41.8 -31.8Inventory days 93.2 127.8 110.1 145.9Debtor days 84.0 105.4 107.5 134.5Creditor days 46.2 80.4 150.5 215.2Return Ratios (%)RoE 1.2 -35.5 -37.4 -46.8RoCE -1.4 -0.4 0.7 1.1RoIC -0.9 -0.4 0.7 1.1Valuation Ratios (x)P/E 43.7 -2.0 -2.8 -3.3EV / EBITDA 281.3 51.3 32.3 29.8EV / Net Sales 9.2 8.8 7.8 7.2Market Cap / Sales 1.5 1.3 1.2 1.0Price to Book Value 0.5 0.7 1.0 1.5Source: Company, <strong>ICICI</strong>direct.com Research<strong>ICICI</strong> Securities Ltd | Retail Equity Research Page 4
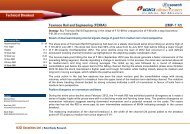
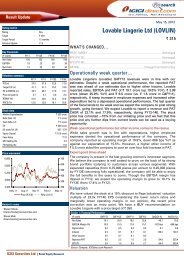
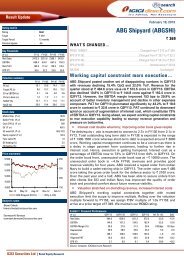
Company Description<strong>Hotel</strong> <strong>Leela</strong>venture, engaged in the business of hotels and resorts, ownsand operates five hotels in New Delhi, Mumbai, Bangalore, Goa andUdaipur. Besides this, the company operates two hotels in Gurgaon andKovalam under management contract. During FY12, it added 20 guestrooms at its Goa hotel property. The company operates seven hotels with1,890 guest rooms. As of March 31, 2012, its owned hotels include The<strong>Leela</strong> Palace New Delhi, Chanakyapuri, The <strong>Leela</strong> Mumbai, Sahar, The<strong>Leela</strong> Palace Bangalore, The <strong>Leela</strong> Goa, Mobor, Cavelossim, The <strong>Leela</strong>Palace Udaipur, Lake Pichola and The <strong>Leela</strong> Palace Chennai, SatyadevAvenue Extension. <strong>Leela</strong>’s managed hotels include The <strong>Leela</strong> KempinskiGurgaon, Delhi NCR and The <strong>Leela</strong> Kovalam Beach, Trivandrum. As ofMarch 31, 2012, its subsidiaries include <strong>Leela</strong> Palaces and Resorts Ltd and<strong>Leela</strong> Realty Ltd. During FY12, it purchased about 4.21 acres of land inPune and 3.85 acres of land in Hyderabad.Exhibit 8: Recommendation History35302520May-12Jul-12Aug-12Oct-12Nov-12Jan-13Feb-13Apr-13May-13PriceTarget PriceSource: Company, <strong>ICICI</strong>direct.com ResearchExhibit 9: Recent ReleasesDate Event CMP Target Price Rating16-Aug-11 Q1FY12 Result Update 34 36 HOLD3-Aug-12 Q1FY13 Result Update 31 28 SELL5-Nov-12 Q2FY13 Result Update 30 28 SELL11-Feb-13 Q3FY13 Result Update 25 23 SELLSource: Company, <strong>ICICI</strong>direct.com Research<strong>ICICI</strong> Securities Ltd | Retail Equity Research Page 5