algebra01_notes/Chapter 07/C07 S08.pdf
algebra01_notes/Chapter 07/C07 S08.pdf
algebra01_notes/Chapter 07/C07 S08.pdf

You also want an ePaper? Increase the reach of your titles
YUMPU automatically turns print PDFs into web optimized ePapers that Google loves.
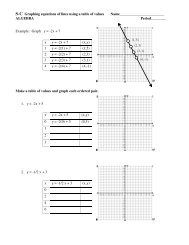
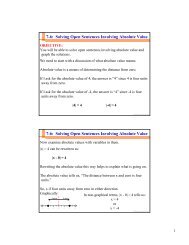
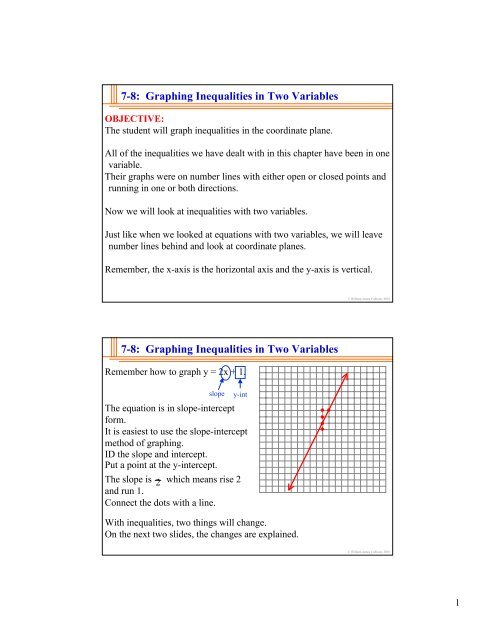
7-8: Graphing Inequalities in Two VariablesOBJECTIVE:The student will graph inequalities in the coordinate plane.All of the inequalities we have dealt with in this chapter have been in onevariable.Their graphs were on number lines with either open or closed points andrunning in one or both directions.Now we will look at inequalities with two variables.Just like when we looked at equations with two variables, we will leavenumber lines behind and look at coordinate planes.Remember, the x-axis is the horizontal axis and the y-axis is vertical.© William James Calhoun, 20017-8: Graphing Inequalities in Two VariablesRemember how to graph y = 2x + 1.slopey-intThe equation is in slope-interceptform.It is easiest to use the slope-interceptmethod of graphing.ID the slope and intercept.Put a point at the y-intercept.The slope is 2 which means rise 2and run 1.Connect the dots with a line.With inequalities, two things will change.On the next two slides, the changes are explained.© William James Calhoun, 20011
7-8: Graphing Inequalities in Two VariablesNow look at the inequality:y > 2x + 1.Pick points from the coordinate plane.If the point makes the inequality true, put ared dot at that point.If the point makes the inequality false, put ablue dot at that point.Point Check: ?(0, (1, (2, (-1, (-2, 0) 2) 3) 0) -3) -4) -1) -2) 3 -3 -4 -1 -2 20 1 > 0 2 4 -1 -4 + 1 FalseTrueFrom this, you can see the pattern that isemerging.If we graphed all the points in-between these points, we would see the following.Would it surprise you that this is the graph of y = 2x + 1?But what is the deal with the dotted line? All of the red area is true.Notice only blue areas are on the line. All of the blue area is false.The next slide explains the new rules of graphing inequalities.© William James Calhoun, 20017-8: Graphing Inequalities in Two VariablesAll of the points that make y > 2x + 1true are in the red-shaded area.The solution set of an inequality in twovariables is a half-plane.The line which separates the coordinateplane into two half-planes is the line createdwhen the inequality is turned into anequation and graphed.If the inequality has > or < in it, the line isnot included in the solution set.This is where the dotted line comes from.If the inequality has “or equal to” in it, the line will be solid.Once you know one point on either side of the line is true, you know all the points onthat side are true.© William James Calhoun, 20012
7-8: Graphing Inequalities in Two VariablesThe steps to graphing inequalities in two variables is:(1) Pretend the inequality symbol is an equal symbol and get the twopoints to make the line.Either by double-intercept (if in standard form) or by slope-intercept (if in other forms.)(2) If the inequality is , or ≠ draw a dotted line - otherwise a solidline.(3) Pick a point that is not on the line. The best point is (0, 0).(4) Plug that point into the original inequality.(5A) If the point you plug in gives you a true answer, shade in all otherpoints in the coordinate plane that are on the same side of the graphedline.(5B) If the point you plug in gives you a false answer, shade in all pointsin the coordinate plane that are on the opposite side of the graphed line.© William James Calhoun, 20017-8: Graphing Inequalities in Two VariablesEXAMPLE 1: Graph y + 2x ≤ 3.Pretend the inequality is an equation and solve for y.y + 2x = 3-2x -2xy = -2x + 3slopey-intGet the two points from the slopeand y-intercept.Pause.Look at the original problem.It has “less than or equal to” in it.This means there should be asolid line drawn through the twopoints.Pick a point.(0, 0) is not on the line, so use it.Draw an “X” on the chosen point.Now determine if the chosen point makes the originalinequality true.Plug in zero for x and zero for y.y + 2x ≤ 3(0) + 2(0) ≤ 30 + 0 ≤ 30 ≤ 3The chosen point makes the original problem true.That means all the points on the same side of the line are true.That whole side of the line must be colored in.Only two new steps: (1) Determining whether to use a solid or dotted line, and(2) Shading in one side of the line after testing a point.© William James Calhoun, 20013
7-8: Graphing Inequalities in Two VariablesEXAMPLE 2: Graph 3x + y < 45.Pretend the inequality is an equation and find theintercepts.3x + y = 453(0) + y = 45y = 453x + y = 453x + (0) = 453x = 45x = 15Plot the intercepts.(Each line will be five units.)Pause.Look at the original problem.It has plain “less than” in it.This means there should be adotted line drawn through the twopoints.Pick a point.(0, 0) is not on the line, so use it.Draw an “X” on the chosen point.Now determine if the chosen point makes the originalinequality true.Plug in zero for x and zero for y.3x + y < 453(0) + (0) < 450 + 0 < 450 < 45The chosen point makes the original problem true.That means all the points on the same side of the line are true.That whole side of the line must be colored in.© William James Calhoun, 20017-8: Graphing Inequalities in Two VariablesHOMEWORKPage 439#15 - 33 odd© William James Calhoun, 20014