Biodegradation and delignification of sugar cane bagasse of pulp ...
Biodegradation and delignification of sugar cane bagasse of pulp ...
Biodegradation and delignification of sugar cane bagasse of pulp ...

Create successful ePaper yourself
Turn your PDF publications into a flip-book with our unique Google optimized e-Paper software.
387<strong>Biodegradation</strong> <strong>and</strong> <strong>delignification</strong> <strong>of</strong> <strong>sugar</strong> <strong>cane</strong> <strong>bagasse</strong> <strong>of</strong><strong>pulp</strong> <strong>and</strong> paper mill effluent by Cryptococcus albidus forproduction <strong>of</strong> bioethanolAshwini Kumar Ray, Anjali singhal, Umesh C. Naik, Indu Shekhar ThakurSchool <strong>of</strong> Environmental Sciences, Jawaharlal Nehru University, New Delhi, 110067, India;E-mail: isthakur@hotmail.com, isthakur@mail.jnu.ac.inABSTRACTThe study aims to extend the range <strong>of</strong> resources from which ethanol may be made from <strong>sugar</strong> <strong>cane</strong> <strong>bagasse</strong>which is used primarily for preparation <strong>of</strong> <strong>pulp</strong> <strong>and</strong> paper. Seven fungal strains isolated from sediment <strong>and</strong>degraded wood <strong>of</strong> <strong>pulp</strong> <strong>and</strong> paper mill effluent in which one strain identified by 18S rDNA internal transcribedspacer (ITS) as Cryptococcus albidus had higher decolourization <strong>and</strong> <strong>delignification</strong> potency. The production<strong>of</strong> <strong>sugar</strong> by Cryptococcus albidus was increased (1.5 fold) in presence <strong>of</strong> <strong>sugar</strong><strong>cane</strong> <strong>bagasse</strong> after optimization<strong>of</strong> process parameters by Taguchi approach. The <strong>sugar</strong> <strong>cane</strong> <strong>bagasse</strong> treated initially by fungus(saccharification) subsequently treated by Saccharomyces cerevisiae indicated production <strong>of</strong> ethanol(38.4g/L). However, an increase in 1.82 fold (70.0g/L) ethanol was measured after optimization <strong>of</strong>fermentation process by Taguchi approach where carbon (2%), nitrogen (0.24%), phosphate (0.24%)temperature (35°C), stirring (150) <strong>and</strong> pH (5.5) were used, indicated use <strong>of</strong> <strong>sugar</strong><strong>cane</strong> <strong>bagasse</strong> <strong>of</strong> <strong>pulp</strong> <strong>and</strong>paper mill effluent for production <strong>of</strong> ethanol.Keywords: bioethanol, Cryptococcus albidus, Saccharomyces cerevisiae, <strong>sugar</strong> <strong>cane</strong> <strong>bagasse</strong>, TaguchiapproachINTRODUCTIONProduction <strong>of</strong> ethanol has been initiated by natural <strong>and</strong> potentially cheap <strong>and</strong> abundant polymer <strong>of</strong>agricultural waste (wheat straw, corn stalks, soybean residues <strong>and</strong> <strong>sugar</strong> <strong>cane</strong> <strong>bagasse</strong>), Bermudagrass, reed, rapeseed, industrial waste (<strong>pulp</strong> <strong>and</strong> paper industry), forestry residues <strong>and</strong> municipalsolid waste [1]. Current ethanol production processes using lignocellulose are well established,however, utilization <strong>of</strong> a cheaper substrate such as <strong>sugar</strong><strong>cane</strong> <strong>bagasse</strong> could make bioethanol morecompetitive with fossil fuel <strong>and</strong> also in mitigation <strong>of</strong> green house gases. The processing <strong>and</strong>utilization <strong>of</strong> lignocellulosic substrate is complex, differing in many aspects from crop-basedethanol production.Cellulosic feedstock consists <strong>of</strong> lignocelluloses which are mainly comprised <strong>of</strong> cellulose, apolymer <strong>of</strong> six-carbon <strong>sugar</strong>, glucose; hemicellulose, a branched polymer comprised <strong>of</strong> xylose <strong>and</strong>other five-carbon <strong>sugar</strong>s, <strong>and</strong> lignin consisting <strong>of</strong> phenyl propane units [2]. Lignocellulose such as<strong>sugar</strong> <strong>cane</strong> <strong>bagasse</strong> is difficult to hydrolyze using only cellulolytic enzymes due to its recalcitrant<strong>and</strong> heterogeneous nature. The chemistry <strong>and</strong> biotechnology <strong>of</strong> <strong>sugar</strong><strong>cane</strong> <strong>bagasse</strong> has beenreviewed [3]. Sugar<strong>cane</strong> <strong>bagasse</strong> has a complex structure, <strong>and</strong> is primarily composed <strong>of</strong> lignin(25%), hemicellulose (25%) <strong>and</strong> cellulose (40–50%) [3,4]. Conversion <strong>of</strong> <strong>sugar</strong><strong>cane</strong> <strong>bagasse</strong> int<strong>of</strong>ermentable <strong>sugar</strong>s is possible through thermal, chemical or enzymatic hydrolysis [5]. Dilutesulfuric acid hydrolysis is thought to be one <strong>of</strong> the promising pretreatment methods <strong>and</strong> wasextensively employed in industry. Pretreatment technology is important steps for improving theconversion <strong>of</strong> cellulose to glucose in following enzymatic hydrolysis [6]. Prior to ethanolResearch Article, Biotechnol. Bioinf. Bioeng. 2011, 1(3):387-399© 2011 Society for Applied Biotechnology. Printed in India; ISSN 2249-9075
388fermentation by a microorganism, the feedstock needs to be processed by saccharificationtechnology in order to release fermentable <strong>sugar</strong>s. There are three classes <strong>of</strong> enzymes actingsynergistically in cellulose hydrolysis: endoglucanases, exoglucanases <strong>and</strong> β-glucosidases.Lignocellulose as a feedstock presents two major challenges for ethanol production due torecalcitrant to biodegradation <strong>and</strong> presence <strong>of</strong> pentose <strong>and</strong> hexose <strong>sugar</strong>s [1,7].Industrial biocatalysts, such as the common yeast, Saccharomyces cerevisiae, rarely possessnative pathways able to efficiently ferment both hexoses (such as glucose) <strong>and</strong> pentoses (such asxylose). Metabolic engineering through genetic modification may be an effective means <strong>of</strong>manipulating the capabilities <strong>of</strong> the microorganisms reported in Escherichia coli, Klebsiellaoxytoca, Zymomonas mobilis <strong>and</strong> S. cerevisiae [7]. Enzymatic hydrolysis can be used for obtainingfermentable <strong>sugar</strong>s from the polysaccharides contained in lignocellulosic biomass. However, sincethe access <strong>of</strong> native cellulose to the enzymes is poor, a pretreatment step is required to improve theenzymatic convertibility <strong>and</strong> to lower the cost <strong>of</strong> the process [8-15]. Enzymatic hydrolysis <strong>of</strong> suchcellulosic material by cellulase enzymes is the most promising approach to get high product yieldsvital to economic success. The presence <strong>of</strong> lignin limits the usage <strong>of</strong> cellulose <strong>and</strong> hemicellulosewhich act as an inhibitor in formation <strong>of</strong> fermentable product. In order to convert these energy richmolecules into simpler forms, it is necessary to remove the lignin from lignocellulosic materials.Kaya et al. [16] reported that during enzymatic hydrolysis <strong>of</strong> lignocelluloses biomass, cellulasecomponents, β-glucosidase <strong>and</strong> endoglucanase had more binding affinity towards lignin than to thecarbohydrates, resulting in lower efficiency <strong>of</strong> saccharification. Hence, to achieve maximumhydrolysis <strong>of</strong> cellulosics, which is a prerequisite for ethanol fermentation, an appropriate<strong>delignification</strong> treatment <strong>of</strong> biomass is required. The cellulosic <strong>and</strong> hemicelluloses <strong>sugar</strong>s obtainedthrough acid <strong>and</strong> enzymatic hydrolysis can efficiently be used for ethanol fermentation either byseparate fermentation <strong>of</strong> individual hydrolysate or fermentation <strong>of</strong> mixed hydrolysate using coculture.However, in co-culture cultivation, optimum growth conditions <strong>of</strong> the yeasts would bedifferent <strong>and</strong> might result in lower efficiency <strong>and</strong> lower product yield. Therefore, properoptimization <strong>of</strong> fermentation processes is significant for ethanol preparation.Tian et al. [17] reported Saccharomyces cerevisiae efficiently converts both glucose <strong>and</strong>mannose into ethanol, but is unable to convert xylose into ethanol. Other yeast species, e.g. Pichiastipitis, C<strong>and</strong>ida shehatae <strong>and</strong> Pachysolen tannophilus, have been found to be highly efficientxylose-fermenting strains that can be used in ethanol production [18]. However, these yeasts have arelatively low ethanol yield <strong>and</strong> inhibitor tolerance. For enhanced production <strong>of</strong> <strong>sugar</strong> <strong>and</strong> ethanol, itis essential to optimize the composition <strong>of</strong> culture media <strong>and</strong> process conditions. There are severalfactors that affect enzymatic hydrolysis <strong>of</strong> cellulose including substrates, cellulase activity, <strong>and</strong>reaction conditions (temperature <strong>and</strong> pH). To improve yield <strong>and</strong> rate <strong>of</strong> the enzymatic hydrolysis,research has focused on the optimization <strong>of</strong> the hydrolysis process <strong>and</strong> enhancement <strong>of</strong> cellulaseactivity. In conventional methods, numerous experiments have to be carried out to optimize all theparameters (factors) to establish best possible culture conditions by interrelation <strong>of</strong> all theparameters. In these methods, studying one variable at a time is cumbersome <strong>and</strong> uneconomical.Another approach is to use statistical tools <strong>and</strong> experimental designs. Taguchi methods have beenwidely used to optimize the reaction variable by devising minimum number <strong>of</strong> experiments. Thisapproach also facilitates to identify the impact <strong>of</strong> individual factor <strong>and</strong> find out the link betweenvariables <strong>and</strong> operational conditions. Analysis <strong>of</strong> the experimental data using the ANOVA (analysis<strong>of</strong> variance) <strong>and</strong> factors effect, gives the output that is statistically significant [19,20]. In the presentwork, a lignin degrading fungus, Cryptococcus albidus, isolated from soil, sediment <strong>and</strong> degradingwood <strong>of</strong> <strong>pulp</strong> <strong>and</strong> paper mill effluent was applied for preparation <strong>of</strong> cellulolytic hydrolysate from<strong>sugar</strong><strong>cane</strong> <strong>bagasse</strong> initially treated in alkaline condition. Saccharomyces cerevisiae optimized forproduction <strong>of</strong> ethanol by Taguchi method was subsequently applied for enhanced fermentation fromcellulolytic hydrolysate <strong>of</strong> <strong>sugar</strong><strong>cane</strong> <strong>bagasse</strong>.
389MATERIALS AND METHODSSites for sample collectionFor isolation <strong>of</strong> fungal strains, sediment <strong>and</strong> degraded wood in effluent was collected from twodifferent places: Kaccha nala outside the Century Pulp <strong>and</strong> Paper Mill, Ghanshyam Dham, Lalkuan,Nainital, Uttaranchal, India, <strong>and</strong> a drain near An<strong>and</strong> Tissue Paper Mill, Meerut, Uttar Pradesh,India. The samples were collected in clean plastic containers, immediately brought to the laboratory<strong>and</strong> stored at 4°C until further use. The effluent <strong>of</strong> <strong>pulp</strong> <strong>and</strong> paper mill collected was <strong>of</strong> <strong>pulp</strong>ingstage used for decolourization <strong>and</strong> <strong>delignification</strong> studies.Sources <strong>of</strong> lignocelluloseSugar<strong>cane</strong> <strong>bagasse</strong> suspended in industrial effluent were kindly provided by a medium scale <strong>pulp</strong><strong>and</strong> paper mill, An<strong>and</strong> Tissue Mill, Merrut, Uttar Pradesh, India, uses kraft <strong>pulp</strong>ing only (nobleaching). The <strong>sugar</strong><strong>cane</strong> <strong>bagasse</strong> was recovered after filtration through cheese cloth, thoroughlywashed with distilled water, dried in an oven at 70°C for 72h, <strong>and</strong> finally grinded in a small discmill.Isolation <strong>of</strong> fungi from the sediments <strong>and</strong> degraded woodFungi were isolated from soil <strong>and</strong> sediments <strong>and</strong> degraded wood; mixed with sterilized water in theratio 1:10 w/v. It was kept st<strong>and</strong>ing at room temperature for 2 hrs. The supernatant was seriallydiluted with autoclaved double distilled water to 10 -1 , 10 -3 , 10 -5 dilutions. Diluted sample (100µl)was spread on the potato dextrose agar plate <strong>and</strong> incubated at 30°C for 4 days. The microbialcolonies (fungal) appeared on the PDA plates were then isolated <strong>and</strong> purified [21]. The fungalstrains were observed under a microscope, Olympus <strong>and</strong> Magnus MLX-TR, at 40X <strong>and</strong> 100Xhaving camera attached with it. Fugal mycelium, spores <strong>and</strong> the spore attachment was observed.Identification <strong>of</strong> fungus <strong>and</strong> culture conditionGenomic DNA was extracted <strong>and</strong> internal transcribed spacer (ITS) regions were amplified usingprimers ITS1 having sequence 5' TCCGTAGGTGAACCTGCGG 3' <strong>and</strong> ITS4 having sequence 5'TCCTCCGCTTATTGATATGC 3'’ as described earlier for identification <strong>of</strong> fungi [21].Saccharomyces cerevisiae was obtained from Institute <strong>of</strong> Microbial Technology, Ch<strong>and</strong>igarh, India,was maintained on agar slants containing (g/L): glucose, 10.0; yeast extract, 3.0; peptone, 5.0; agar,20.0 at pH 5.0 ± 0.2 <strong>and</strong> temperature 30°C. Saccharomyces cerevisiae inoculum was grown for 48hat 30°C in a culture medium as described above for fermentation processes.Screening <strong>of</strong> potential fungal strains for decolorization <strong>and</strong> <strong>delignification</strong> <strong>of</strong>effluentThe fungal strains isolated were screened for their decolourization <strong>and</strong> lignin reduction potential.MSM-effluent i.e. MSM (in g/l: Na 2 HPO 4 .2H 2 O, 7.8; KH 2 PO 4, 6.8; MgSO 4 , 0.2; Fe (CH 3 COO) 3NH 4, 0.01; Ca(NO 3 ) 2 4H 2 O, 0.05) having 10% <strong>pulp</strong> <strong>and</strong> paper mill effluent, inoculated withindividual fungal isolates, were incubated at 30°C, pH 7 in a rotary shaker, rpm 125 for 10 days.The parameter colour <strong>and</strong> lignin were estimated at an interval <strong>of</strong> 0, 1, 3, 5, <strong>and</strong> 10 day. The colourcontent was measured after centrifugation <strong>of</strong> samples at 10,000 rpm for 10 min. pH was adjusted to
3907.6 <strong>and</strong> absorbance was determined at 465 nm [22]. Lignin in the effluent was estimated by reaction<strong>of</strong> effluent with acetic acid, sodium nitrite <strong>and</strong> ammonium hydroxide, <strong>and</strong> measuring the absorbanceat 430 nm [22].Preparation <strong>of</strong> <strong>sugar</strong><strong>cane</strong> <strong>bagasse</strong> for degradationThe <strong>sugar</strong><strong>cane</strong> <strong>bagasse</strong> was recovered after filtration through cheese cloth, thoroughly washed withdistilled water, dried in an oven at 70°C for 72h, <strong>and</strong> finally grinded in a small disc mill. Steamtreatment was applied to <strong>sugar</strong><strong>cane</strong> <strong>bagasse</strong>. Sugar<strong>cane</strong> <strong>bagasse</strong> was mixed with distilled water(1:10 w/v). The mixtures were autoclaved at 121°C <strong>and</strong> 1.1kgcm 2 for 4 h. The processed materialswere dried in an oven at 80°C overnight. Sugar<strong>cane</strong> <strong>bagasse</strong> was initially inoculated with fungalinoculum (10%). Potato dextrose broth (PDB) was added to help fungus to establish on substrate.Fungus was mixed with <strong>sugar</strong><strong>cane</strong> <strong>bagasse</strong>, incubated at 30°C <strong>and</strong> moisture content (40%) wasmaintained. After one month, <strong>bagasse</strong> was again washed with distilled water <strong>and</strong> mixed with whiteliquor (Na 2 S 1.5%+NaOH 6.5%) in the ratio <strong>of</strong> 1:10 w/v, <strong>and</strong> autoclaved for 3 hrs. It was againwashed with distilled water till maximum removal <strong>of</strong> lignin was achieved. Finally <strong>sugar</strong><strong>cane</strong><strong>bagasse</strong> was dried in an oven at 80°C for overnight.Production <strong>and</strong> analysis <strong>of</strong> <strong>sugar</strong>For <strong>sugar</strong> analysis, <strong>bagasse</strong> (1% w/v) was suspended in MSM (in g/l: Na 2 HPO 4 .2H 2 O, 7.8; KH 2 PO 4 ,6.8; MgSO 4 , 0.2; Fe (CH 3 COO) 3 NH 4 , 0.01; Ca(NO 3 ) 2 4H 2 O, 0.05) <strong>and</strong> inoculated with fungus, <strong>and</strong>it was incubated in rotary shaker at 150 rpm, temperature 30°C <strong>and</strong> pH 5 as described earlier [21].Fungus was also grown in presence <strong>of</strong> above culture medium with conditions: temperature (30–35°C); shaking condition (125 rpm); dextrose (1.0% w/v); tryptone (0.1% w/v); inoculum size(7.5% w/v); pH (5) <strong>and</strong> duration (48 h) optimized by Taguchi methods for decolourization <strong>of</strong> <strong>pulp</strong><strong>and</strong> paper mill effluent as described by Singhal <strong>and</strong> Thakur [21]. The total <strong>sugar</strong> moiety in cultureextract removed after 6, 12, 24, 48 <strong>and</strong> 72 hrs aseptically estimated by the anthrone method byformation <strong>of</strong> coloured product by measuring the absorbance <strong>of</strong> the resulting solution against aglucose st<strong>and</strong>ard curve [23]. GC-MS analysis was performed for identification <strong>of</strong> <strong>sugar</strong>s. In thiscase the cell suspension (50 ml) was clarified by centrifugation at 7,000 rpm for 8 min. The cell freesupernatant fractions were extracted thrice with an equal volume <strong>of</strong> ethyl acetate by shaking for 45min. The organic layer was dried with anhydrous sodium sulphate. The ethyl acetate extractsresidues were analyzed after derivatization by trimethylsilyl (TMS) after modification <strong>of</strong> methods[24]. In this method, 100 µl dioxane <strong>and</strong> 10 µl pyridine were added to the residues <strong>and</strong> silylatedwith 50 µl trimethyl silyl [BSTFA (N,O-bis(trimethylsilyl) trifluoroacetamide, <strong>and</strong> analyzedimmediately on a GC–MS. The GC–MS analyses were performed in electron ionization (EI) mode(70 eV). The samples were analyzed in split mode (1:10) at anode. The analytic column connectedto the system was a Restech capillary column (5% diphenyl 95% dimethylpolysiloxane; (30 m long0.25 mm i.d., 0.25mm film thickness). Column was used at a temperature programme <strong>of</strong> 50°C for 0min, increased to 180°C at 10°C/min for 5 min, <strong>and</strong> finally increased to 300°C at 15°C/min for30min Helium with flow rate <strong>of</strong> 1 ml /min was used as the carrier gas.Optimization <strong>of</strong> process parameters for enhanced production <strong>of</strong> bioethanolFor the Taguchi design <strong>and</strong> analysis <strong>of</strong> results the Qualitek-4 version (7.6.0.3) s<strong>of</strong>tware was used[25]. In this study we have used Taguchi approach <strong>of</strong> orthogonal array <strong>and</strong> experimental designsthat help to gain more information about the optimum conditions (Table 2). Both orthogonal arrays<strong>and</strong> ANOVA were used for this purpose. Orthogonal arrays are well-defined method that is used to
391reduce the number <strong>of</strong> experiments to be conducted. Taguchi’s L-8 orthogonal array method wasused to carry out fermentation experiments by choosing seven parameters at two levels (Table 2 <strong>and</strong>3) [25]. In the orthogonal array <strong>of</strong> L-8 type, L <strong>and</strong> subscript 8 means Latin square <strong>and</strong> the number <strong>of</strong>experiments respectively. Full factorial approach will require 128 experiments to be conducted foroptimizing a process while in fractional factorial using L-8 orthogonal array the number <strong>of</strong>experiments reduces to eight [19]. After designing, experimental data was analyzed using ANOVA.Taguchi approach used ANOVA to statistically significant parameters in finding the optimum levels[20].Screening <strong>and</strong> optimization <strong>of</strong> growth factors for fermentation by TaguchiapproachScreening experiments were performed to select most suitable carbon <strong>and</strong> nitrogen sources. Variouscarbon sources were used at an initial concentration <strong>of</strong> 1% (w/v). Culture extract <strong>of</strong> <strong>sugar</strong> was takenas control. Batch study was conducted in Erlenmeyer flasks containing culture extract for <strong>sugar</strong>along with inoculum supplemented with different carbon sources Increase in fermentation wasanalyzed after 48 hrs. After selecting the most suitable carbon source, various nitrogen sources werescreened at different concentration. After selecting various nitrogen sources, various phosphatesources were also screened at different concentration. Once carbon, nitrogen <strong>and</strong> phosphate sourceswere selected, the growth media was optimized for the optimum concentration <strong>of</strong> selected carbon<strong>and</strong> nitrogen sources i.e. carbon (%) <strong>and</strong> nitrogen (%) <strong>and</strong> phosphate (%). Other process parameterssuch as pH, inoculum size, temperature, revolution per minutes were also optimized. Table 2 showsthe parameters <strong>and</strong> levels used in this experiment. All the experiments were done in triplicate toavoid experimental errors.Analysis <strong>of</strong> the dataThe optimum level for each factor (parameter) was derived by analyzing the data <strong>of</strong> the abovementioned eight experiments using Qualitek-4 s<strong>of</strong>tware <strong>and</strong> the performance at optimum conditionwas predicted (http://Nutekus.com/wp-q4w.html). The contribution <strong>of</strong> each individual factor infermentation <strong>and</strong> the interactions among various factors was also studied. The analysis wasperformed with ‘bigger is better’ quality characteristics. The bioethanol production was carried outat the optimum levels <strong>of</strong> process parameters <strong>and</strong> result was compared with the value predicted bythe Taguchi model. This confirmatory experiment was repeated three times. Qualitek-4 s<strong>of</strong>tware(Nutek Inc., USA) for automatic design <strong>of</strong> experiments using the Taguchi approach was used in thisstudy [25]. This s<strong>of</strong>tware is equipped to use L-4 to L-64 orthogonal arrays along with selection <strong>of</strong> 2to 63 factors (parameters) with two, three or four levels. This is user-friendly Windows-baseds<strong>of</strong>tware that allows selecting the array used <strong>and</strong> assigning factors to the appropriate columns. Inthis study L-8 orthogonal array was used with seven parameters at two levels [26].Production <strong>and</strong> analysis <strong>of</strong> ethanolThe fermentation was carried out by Sacharomyces cereviceae under optimized conditions <strong>and</strong>samples were removed after 6, 12, 24, 48 <strong>and</strong> 72 h for estimation <strong>of</strong> ethanol. Production <strong>of</strong> ethanolwas determined by spectroscopic <strong>and</strong> gas chromatography methods after samples were centrifugedat 13,000 rpm for 2 min. <strong>and</strong> the supernatant filtered through a 0.45 lm filter to remove solids. Theethanol produced was determined by spectroscopic method against different concentration <strong>of</strong>ethanol st<strong>and</strong>ard curve [27]. The ethanol was also determined by gas chromatography using a
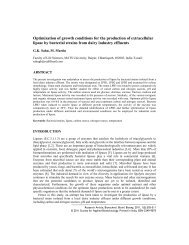
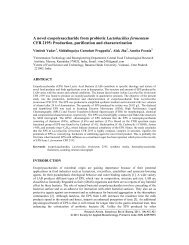
392chromatograph (Shimdzu GC-2010) with an FID detector. The inlet temperature was 250°C, themode was split flow <strong>and</strong> the carrier gas was helium. The column was 30.0 m long with a diameter <strong>of</strong>0.25mm, with film thickness <strong>of</strong> 0.25µm. The oven was warmed to an initial temperature <strong>of</strong> 40°C,held for 3 min. <strong>and</strong> then raised to 70°C at a rate <strong>of</strong> 3°C/min for 5 min. The oven temperature wasthen raised to 250°C at a rate <strong>of</strong> 10°C/min for 30 min.RESULTS AND DISCUSSIONFour fungal strains PF1, PF2, PF3 <strong>and</strong> PF4 isolated from An<strong>and</strong> Tissue Paper Mill, Meerut UttarPradesh, India, <strong>and</strong> three fungal strains PF5, PF6 <strong>and</strong> PF7 were isolated from Century Pulp <strong>and</strong>Paper Mill, Lalkuan, Uttarakhan, India (Table 1). The fungi (PF1 to PF7) were tested for theirability to remove colour <strong>and</strong> lignin from the <strong>pulp</strong> <strong>and</strong> paper mill effluent. Initial colour was 6521CU <strong>and</strong> lignin was 16161 ppm. Among seven fungi tested most efficient strain was PF4 followed byPF7>PF1>PF6>PF2>PF3 <strong>and</strong> finally PF5. Maximum efficiency was shown by PF4 30% (4565.6CU) colour <strong>and</strong> 24% lignin (12282 ppm) reduction on 3rd day. Second best strain was PF7 showing27% colour reduction (4757.6 CU) <strong>and</strong> 24% (12347 ppm) lignin reduction on 5th day. The fungus(PF4) showed higher decolourization <strong>and</strong> <strong>delignification</strong> was subjected to amplification <strong>of</strong> ITS1 <strong>and</strong>ITS2 region <strong>of</strong> genomic DNA showed 99% homology with Cryptococcus albidus (GenBankdatabase accession no. EU839451) was applied for preparation <strong>of</strong> lignocellulose hydrolysate.Table 1. Isolation <strong>and</strong> characteristics <strong>of</strong> fungal strains isolated from An<strong>and</strong> paper mill sediments <strong>and</strong>Century <strong>pulp</strong> <strong>and</strong> paper mill sediments.Fungal isolates Source Growth CharacteristicsPF1 An<strong>and</strong> paper mill Slow White mycelia, light green sporesPF2 An<strong>and</strong> paper mill Slow White mycelium with dark colour spores,mycelia becomes dark from behindPF3 An<strong>and</strong> paper mill Fast White cottony mycelia with green sporesPF4 An<strong>and</strong> paper mill Slow Dirty white mycelia with green spores. Givespurple colour on maturationPF5 Century paper mill Fast White mycelia with excess spores production<strong>of</strong> green colourPF6 Century paper mill Fast White mycelia with light brown sporesproduced in excessPF7 Century paper mill Medium White snowy cottony mycelia with yellowbrownpigmentationThe total <strong>sugar</strong> moiety in culture extract prepared in presence <strong>of</strong> MSM <strong>and</strong> <strong>bagasse</strong> (1%) wasdetermined after removal <strong>of</strong> culture medium after 6, 12, 24, 48 <strong>and</strong> 72 hrs aseptically. Results <strong>of</strong> thestudy indicated maximum production <strong>of</strong> <strong>sugar</strong> at 48 h by Cryptococcus albidus (Figure 1a).However, after optimization <strong>of</strong> process parameters by Taguchi approach for decolourization <strong>of</strong> <strong>pulp</strong><strong>and</strong> paper mill effluent indicated increase in <strong>sugar</strong> formation (1.5 times) in this studies (Figure 1b).GC-MS was performed to analyze the type <strong>and</strong> nature for <strong>sugar</strong> after saccharification <strong>of</strong>lignocellulose present in <strong>sugar</strong><strong>cane</strong> <strong>bagasse</strong>. Our result indicated formation <strong>of</strong> pentose (RT 9.52)<strong>and</strong> hexose (12.62) in culture medium (Figure 2).In present work, cellulosic hydrolysate <strong>of</strong> <strong>sugar</strong><strong>cane</strong> <strong>bagasse</strong> subsequently fermented withSacharomyces cereviseae. The result <strong>of</strong> the study indicated production <strong>of</strong> 38.4 g/L ethanol with ayield <strong>of</strong> 3.9 g/g after 48h. The Taguchi method was used to identify the optimum culture conditions<strong>and</strong> to achieve maximum fermentation for bioethanol production by Saccharomyces cereviceae.
393p ercen t red u ctio n in co lo u r302520151050PF1 PF2 PF3 PF4 PF5 PF6 PF71day 3 dy 5day 7day 10daya300250bSugar in mg/L2001501005006hr 12hr 24hr 48hr 72hrTime in HourFigure 1. Formation <strong>of</strong> <strong>sugar</strong> in cellulolytic hydrolysate <strong>of</strong> <strong>sugar</strong><strong>cane</strong> <strong>bagasse</strong> <strong>of</strong> <strong>pulp</strong> <strong>and</strong> paper milleffluent by Cryptococcus albidus in minimal salt medium (a), <strong>and</strong> <strong>sugar</strong> recovered after optimization <strong>of</strong>process parameters by Taguchi approach (b).The process parameters such as temperature, RPM, pH, inoculums size, quantity <strong>of</strong> carbon <strong>and</strong>nitrogen ammonium hydrogen orthophosphate sources were assigned two levels: minimum <strong>and</strong>maximum values (Table 2 <strong>and</strong> 3). The relative differential influences <strong>of</strong> each factor on fermentationlevel two <strong>and</strong> level one against average value is shown in table 3. The inoculum size <strong>of</strong> theexperiment was found to have the highest impact on the process <strong>of</strong> fermentation by the organism,
394whereas pH <strong>of</strong> the medium had the least impact among all the selected optimization parameters.Various parameters, apart from having an individual effect on the process, also interacted amongthem. These interactions may be independent <strong>of</strong> individual effect.Table 2. Overall eight experiments (run) designed on the basis <strong>of</strong> L-8 orthogonal array.Run Temperature Rpm Sucrose YeastextractPhosphate pH Inoculumsize1 1 1 1 1 1 1 12 1 1 1 2 2 2 23 1 2 2 1 1 2 24 1 2 2 2 2 1 15 2 1 2 1 2 1 26 2 1 2 2 1 2 17 2 2 1 1 2 2 18 2 2 1 2 1 1 2Table 3. Parameters <strong>and</strong> levels used for optimization <strong>of</strong> the experiment.Parameters Level 1 Level 2Temperature 30 35RPM 130 150pH 4.5 5.5Carbon (%) 0.5 2Nitrogen (%) 0.08 0.24Ammonium hydrogen orthophosphate (%) 0.24 0.30Inoculum size (%) 1 2Table 4 gives the interactions among various factors. It was observed that the most significantinteraction was between pH <strong>and</strong> ammonium hydrogen orthophosphate (Significance Index, S.I.87.71), though these two parameters were not significant contributors, in terms <strong>of</strong> individual effectin fermentation. The least significant interaction was between rpm <strong>and</strong> inoculum size with SI <strong>of</strong>37.54 whereas per individual effect they were the two most influential parameters. The data <strong>of</strong> thisstudy implied that though inoculums size had the highest impact at the individual level, it did notshow much effect at the interaction level. Thus the interactive effect <strong>of</strong> various parameters wasentirely different from their individual effect. Analysis <strong>of</strong> variance was calculated to find out thesignificance <strong>of</strong> individual factors on fermentation.The data revealed that inoculum size <strong>of</strong> the experiment had maximum effect, contributing53.905% in fermentation, followed by nitrogen which contributed about 19.317% Parameter pH inthe analysis, as the percent contribution by the factor was deemed insignificant. On the basis <strong>of</strong> thepresent results revealed by the Taguchi s<strong>of</strong>tware, the total contribution <strong>of</strong> all the selected parameterswas 25.23% <strong>and</strong> the current gr<strong>and</strong> average <strong>of</strong> performance was 18.25%. The optimum conditionsalong with the level description for maximum fermentation is shown in table 3 <strong>and</strong> figure 3, whichshows that when these conditions were selected then total fermentation was achieved 9% v/v inculture. Before optimizing the process parameters the average fermentation was about 5% v/v inculture. After optimization by the Taguchi approach the total fermentation was increased up to 9%v/v. Thus the data in this study indicated an effective influence <strong>of</strong> Taguchi L-8 orthogonal array forfermentation <strong>and</strong> the imperative role <strong>of</strong> optimization <strong>of</strong> all parameters in achieving the best possible
395results with increased in fermentation from <strong>sugar</strong><strong>cane</strong> <strong>bagasse</strong>. Fermentation <strong>of</strong> cellulosic using S.cerevisiae, gave maximum ethanol after optimization was (70.00g.l) with yield (7.0 g/g).Table 4. Interactions between different parameters along with Severity Index (SI).Interacting factor pair Columns SI (%) Col. Optimum.PH × ammonium hydrogen orthophosphate 3×7 87.71 4 2,1Temperature × ammonium hydrogen orthophosphate 1×7 69.14 6 2,2Temperature × Carbon 1×5 67.24 4 1,2RPM × Nitrogen 2×6 62.55 4 2,1Temperature × PH 1×3 60.45 2 2,2PH × Carbon 3×5 55.13 6 2,2RPM × ammonium hydrogen orthophosphate 2×7 54.39 5 1,2Carbon × ammonium hydrogen orthophosphate 5×7 45.6 2 2,2PH × Nitrogen 3×6 44.86 5 2,1RPM × PH 23 39.54 1 1,2RPM × Innoculum size 24 37.54 6 2,2The fermentative product <strong>of</strong> cellulolytic hydrolysate was subjected to determination <strong>of</strong> ethanolby spectrophotometer <strong>and</strong> gas chromatography against a st<strong>and</strong>ard curve prepared by differentconcentration <strong>of</strong> ethanol. Result <strong>of</strong> the study indicated maximum production <strong>of</strong> ethanol at 48 h(Figure 4). Data <strong>of</strong> GC indicated production <strong>of</strong> ethanol. Results from chromatographic studiesindicated that one sharp peak in the figure 5. The sharp peak implies the presence <strong>of</strong> alcoholdetected using a st<strong>and</strong>ard at RT 4.5. A sharp peak is present at RT 3.8 which implies the presence <strong>of</strong>ethyl acetate used as the solvent. Other peaks which are present in figure 5 showed the presence <strong>of</strong>other impurities besides the peak <strong>of</strong> alcohol at RT 4.5. This was confirmed by the chromatograms <strong>of</strong>st<strong>and</strong>ard for ethanol <strong>and</strong> solvent ethyl acetate used in this study.The <strong>pulp</strong> <strong>and</strong> paper mill uses <strong>sugar</strong><strong>cane</strong> <strong>bagasse</strong> for preparation <strong>of</strong> <strong>pulp</strong> contains debris <strong>of</strong><strong>bagasse</strong> which is waste product which can be used for bioethanol production after saccharification<strong>and</strong> fermentation. The major problem in production <strong>of</strong> ethanol is end product inhibition <strong>and</strong>formation <strong>of</strong> inhibitory products due to presence <strong>of</strong> lignin in the raw material. Fungus,Cryptococcus albidus, isolated from degraded wood <strong>and</strong> sediment <strong>of</strong> <strong>pulp</strong> <strong>and</strong> paper mill effluenthas decolourization <strong>and</strong> <strong>delignification</strong> efficiencies [21]. The process parameters optimization byTaguchi approach had significantly increased removal <strong>of</strong> colour <strong>and</strong> lignin from <strong>pulp</strong> <strong>and</strong> paper milleffluent [21]. Therefore, in this study, Cryptococcus albidus was used for saccharification <strong>of</strong><strong>sugar</strong><strong>cane</strong> <strong>bagasse</strong>. However pretreatment <strong>of</strong> <strong>bagasse</strong> is necessary for maximum saccahrification.Alkaline treatment <strong>of</strong> <strong>sugar</strong><strong>cane</strong> <strong>bagasse</strong> digests lignin matrix <strong>and</strong> makes cellulose <strong>and</strong>hemicellulose available to enzyme degradation [3]. Similar treatment <strong>of</strong> <strong>sugar</strong><strong>cane</strong> leaves enhancedsubsequent hydrolysis by a cellulolytic enzyme complex [3]. Alternatively, biological<strong>delignification</strong> <strong>of</strong> <strong>bagasse</strong> is possible using selected strains <strong>of</strong> white rot fungus.In this study the optimum conditions for growth <strong>of</strong> fungus for preparation <strong>of</strong> cellulolytichydrolysate was performed in minimal salt medium supplemented by <strong>bagasse</strong> (1.0%) <strong>and</strong> pH (5.0).Taguchi approach was used to optimize the growth media for five factors i.e., pH, copper sulphate,carbon, nitrogen <strong>and</strong> inducer at four levels using M-16 orthogonal array was used for production <strong>of</strong><strong>sugar</strong> as described earlier [21,28]. In earlier studies after optimization <strong>of</strong> process parameters therewas seven fold increases in laccase production from 32U/mg to 219±8U/mg. Inducer (<strong>bagasse</strong>) hadthe maximum effect, contributing 52% while pH had the minimum effect (7%) [21]. Therefore, inthis study experiment was set up for production <strong>of</strong> <strong>sugar</strong> in similar condition for degradation <strong>of</strong>lignin molecules <strong>and</strong> production <strong>of</strong> <strong>sugar</strong> <strong>and</strong> ethanol. Commercial enzyme preparations have been
396used to convert <strong>sugar</strong><strong>cane</strong> <strong>bagasse</strong> to fermentable <strong>sugar</strong>s. Krishna et al. [29] used Trichodermareesei cellulase <strong>and</strong> cellobiase to hydrolyze <strong>sugar</strong><strong>cane</strong> leaves after alkaline <strong>delignification</strong>. Martin etal. [30] used a mixture <strong>of</strong> endo-glucanases <strong>and</strong> cellobiases to saccharify steam pretreated <strong>sugar</strong><strong>cane</strong><strong>bagasse</strong>. Adsul et al. [31] treated <strong>sugar</strong><strong>cane</strong> <strong>bagasse</strong> chemically with varying quantities <strong>of</strong> lignin <strong>and</strong>hemicelluoses for the production <strong>of</strong> cellulase <strong>and</strong> xylanase enzymes by Penicillium janthinellumNCIM 1171 <strong>and</strong> Trichoderma viride NCIM 1051 in the production medium <strong>and</strong> recovered higherxylanase <strong>and</strong> β-glucosidase activities.Figure 2. GC-MS pr<strong>of</strong>ile for <strong>sugar</strong> analysis in cellulolytic hydrolysate <strong>of</strong> <strong>sugar</strong><strong>cane</strong> <strong>bagasse</strong> <strong>of</strong> <strong>pulp</strong> <strong>and</strong>paper mill effluent after optimization <strong>of</strong> process parameters by Taguchi approach.Fermentation <strong>of</strong> cellulolytic hydrolysate from lignocellulosic residues is to produce alcohol.Both pentose-utilizing yeast strains (P. stipitis), <strong>and</strong> non-pentose-utilizing yeast strains(Saccharomyces cerevisiae) have been used in earlier studies [29]. Recombinant strains <strong>of</strong>Escherichia coli, Zymomonas mobilis <strong>and</strong> S. cerevisiae capable <strong>of</strong> hexose <strong>and</strong> pentose catabolism<strong>and</strong> high ethanol production have also been constructed. The production <strong>of</strong> ethanol is higher than
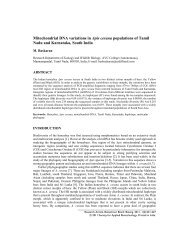
397earlier report <strong>of</strong> <strong>sugar</strong><strong>cane</strong> leaves <strong>and</strong> from the hydrolyzate <strong>of</strong> <strong>sugar</strong><strong>cane</strong> depithed (32.6%) <strong>bagasse</strong>[29]. Huang et al. [32] reported ethanol production by fermentation <strong>of</strong> NaOH-neutralizedhydrolysate without detoxification using the adapted P. stipitis <strong>and</strong> compared to fermentation <strong>of</strong>detoxified hydrolysate. The bioethanol yield using the adapted P. stipitis with both types <strong>of</strong>hydrolysate at pH 5.0 achieved 87% <strong>of</strong> the maximum possible ethanol conversion.Figure 3. Significant factor <strong>and</strong> interaction influences for production <strong>of</strong> ethanol from cellulolytichyrolysate <strong>of</strong> <strong>sugar</strong><strong>cane</strong> <strong>bagasse</strong> <strong>of</strong> <strong>pulp</strong> <strong>and</strong> paper mill effluent prepared by Cryptococcus albidussubsequently fermented by Saccharomyces cereviceae.108percentage <strong>of</strong> bioethanol64206hr 12hr 24hr 48hr 72hrTime in hrsFigure 4. Production <strong>of</strong> ethanol from cellulolytic hydrolysate <strong>of</strong> <strong>sugar</strong><strong>cane</strong> <strong>bagasse</strong> <strong>of</strong> <strong>pulp</strong> <strong>and</strong> paper milleffluent subsequently fermented by Saccharomyces cereviceae. Ethanol was estimated byspectrophotometer method against known concentration <strong>of</strong> ethanol.
398.Figure 5. Gas chromatography pr<strong>of</strong>ile for ethanol production in cellulolytic hydrolysate <strong>of</strong> <strong>pulp</strong> <strong>and</strong>paper mill effluent <strong>sugar</strong><strong>cane</strong> <strong>bagasse</strong> after optimization <strong>of</strong> process parameters by Taguchi approach.Mielenz et al. [33] used soybean hulls for production <strong>of</strong> ethanol by the simultaneoussaccharification <strong>and</strong> fermentation (SSF) process with Saccharomyces cerevisiae D5A <strong>and</strong> recovered31.2±0.3 (flask B) g/L ethanol after thirteen days. Even insertion <strong>and</strong> expression <strong>of</strong> Z. mobilis genesencoding essential enzymes involved in the fermentation pathway, alcohol dehydrogenase II (adh II)<strong>and</strong> pyruvate decarboxylase (pdc), into E. coli, resulting in increased cell growth <strong>and</strong> ethanolproduction <strong>of</strong> 30 g/L [7]. Oleskowicz-Popiel et al. [34] pretreatment anaerobically digested (AD)manure for the simultaneous saccharification <strong>and</strong> fermentation (SSF) recovered 30.8 kg ethanol per100 kg dry mass <strong>of</strong> maize silage. Gupta et al. [35] used Prosopis juliflora as raw material for acidpretreatment, <strong>delignification</strong> <strong>and</strong> enzymatic hydrolysis <strong>and</strong> recovered 18.24 g/L <strong>and</strong> 37.47 g/L<strong>sugar</strong>s <strong>and</strong> 7.13 g/L <strong>and</strong> 18.52 g/L <strong>of</strong> ethanol with Pichia stipitis <strong>and</strong> Saccharomyces cerevisiaerespectively. Martín et al. [30] used clover (Trifolium repens) <strong>and</strong> ryegrass (Lolium perenne)mixtures as raw materials for ethanol production. The simultaneous saccharification <strong>and</strong>fermentation <strong>of</strong> the pretreated material yielded cellulose conversions <strong>of</strong> 87.5 <strong>and</strong> 86.6%,respectively, with Saccharomyces cerevisiae <strong>and</strong> the filamentous fungus Mucor indicus. Li et al.[36] used Bermuda grass, reed <strong>and</strong> rapeseed for ethanol production by means <strong>of</strong> simultaneoussaccharification <strong>and</strong> fermentation (SSF) with a batch <strong>and</strong> fed-batch mode. When the batch SSFexperiments were conducted in 3% low effective cellulose, about 16 g/L <strong>of</strong> ethanol were obtainedafter 96 h <strong>of</strong> fermentation. However, after optimization <strong>of</strong> process parameters by Taguchi approachit is possible to produce more ethanol as reported in this study. Statistical methods like Plankett-
399Burman design or central composite design/response surface methodology as well as the Taguchiapproach are available for optimizing fermentation conditions. However, in this study we have usedthe Taguchi approach <strong>and</strong> the results indicated that the application <strong>of</strong> these statistical methods notonly helped us in establishing the optimum levels <strong>of</strong> the most important factors considered withminimum amount <strong>of</strong> manpower <strong>and</strong> time, but also proved to be useful <strong>and</strong> satisfactory in optimizingthe fermentation medium for the production <strong>of</strong> bioethanol.Acknowledgements. We thank Department <strong>of</strong> Biotechnology, Government <strong>of</strong> India, New Delhi,for providing financial assistance for carrying out this research work, Mr. R.K. Roy for providingQualitek-4 s<strong>of</strong>tware, Mr. Ajay, Advance Instrument Facility, Jawaharlal Nehru University, NewDelhi, for GC-MS analysis <strong>and</strong> An<strong>and</strong> Tissue Mill, Meerut, Uttar Pradesh, India, for <strong>pulp</strong> <strong>and</strong> papermill effluent.REFERENCES[1] Lynd LR, Cushman JH, Nicols RJ, et al. Science 1991, 51:1318-1323.[2] Duff SJB, Murray WD. Bioresour. Technol. 1996, 55:1-33.[3] P<strong>and</strong>ey A, Soccol CR, Nigam P, et al. Bioresour. Technol. 2000, 74:69-80.[4] Neureiter M, Danner H, Thomasser C, et al. Appl. Biochem. Biotechnol. 2002, 98:49-58.[5] Laser M, Schulman D, Allen SG, et al. Bioresour. Technol. 2002, 81:33-44.[6] Eggeman T, El<strong>and</strong>er RT. Bioresour. Technol. 2005, 96:2019-2025.[7] Chen J, Zhang W, Tan L, et al. Biotechnol. Adv. 2009, 27:593-598.[8] Liao W, Liu Y, Liu C, et al. Bioresour. Technol. 2006, 97:1687-1695.[9] Cara C, Ruiz et al. Bioresour. Technol. 2008, 99:1869-1876.[10] Carrillo F, Lis MJ, Colom X, et al. Proc. Biochem. 2005, 40:3360-3364.[11] Kuhad RC, Manch<strong>and</strong>a, M, Singh A. Bioproc. Eng. 1999, 20:47-125.[12] Kapoor M. Biochem. Eng. J. 2008, 38:88-97.[13] Sun JX. Polym. Degrad. Stabil. 2004, 84:331-339.[14] Ohgren K. Appl. Biochem. Biotechnol. 2005, 124:1055-1067.[15] Xu F, Sun JX, Liu CF, et al. Carbohyd. Res. 2006, 341:253-261.[16] Kaya F, Heitmann JA, Thomas J. J. Biotechnol. 2000, 80:241-247.[17] Tian S, Zhou G, Yan F, et al. Biotechnol. Adv. 2009, 27:656-660.[18] Agbogbo FK, Coward-Kelly G, Torry-Smith M, et al. Proc. Biochem. 2006, 41:2333-2336.[19] Kackar R. J. Qual. Technol. 1985, 17:176-188.[20] Phadke MS, Dehnad K. Qual. Reliab. Eng. In. 1988, 4:159-169.[21] Singhal A, Thakur IS. Biochem. Eng. J. 2009, 46:21-27.[22] Thakur IS. Proc. Biochem. 2004, 39:1693-1699.[23] Ahmed AE, Labavitch JM. Plant Physiol. 1980, 65:1009-1013.[24] Sharma A, Thakur IS, Dureja P, et al. <strong>Biodegradation</strong> 2009, 20:643-650.[25] Roy RK. Qualitek-4, S<strong>of</strong>tware for automatic design <strong>and</strong> analysis <strong>of</strong> Taguchi experiments. Nutek Inc.,Bloomfield Hills, Michigan, USA, 2007.[26] Dasu VV, P<strong>and</strong>a T, Chidambaram M. Proc. Biochem. 2003, 38:877-880.[27] Caputi A, Wright D. J. Assoc. Offic. Anal. Chem. 1969, 52:85-88.[28] Singhal A, Choudhary G, Thakur IS, Can. J. Civ. Eng. 2009, 36:1253-1264.[29] Krishna S, Prasanthi SK, Chowdary GV, et al. Proc. Biochem. 1998, 33:825-830.[30] Martín C, Thomsen MH, Hauggaard-Nielsen H, et al. Bioresour. Technol. 2009, 99:8777-8782.[31] Adsul MG, Ghule JE, Singh, R et al. Carbohy. Polymers 2004, 57:67-72.[32] Huang CF, Lin TH, Guo GL, et al. Bioresour. Technol. 2009, 100:3914-3920.[33] Mielenz JR, Mielenz JR, Bardsley JS, Wyman CE. Bioresour. Technol. 2009, 100:3532-3539.[34] Oleskowicz-Popie P, Lisiecki P, Holm-Nielsen JB, et al. Bioresour. Technol. 2008, 99:5327-5334.[35] Gupta R, Sharma KK, Kuhad RC. Bioresour. Technol. 2009, 100:1214-1220.[36] Li H, Kim NJ, Jiang M, et al. Bioresour. Technol. 2009, 100:3245-3251.