

water sources, infrastructure, space and the dynamics of ...
water sources, infrastructure, space and the dynamics of ...
water sources, infrastructure, space and the dynamics of ...

You also want an ePaper? Increase the reach of your titles
YUMPU automatically turns print PDFs into web optimized ePapers that Google loves.
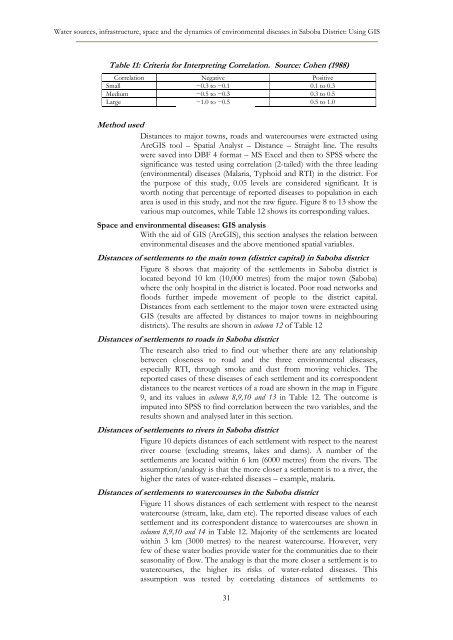
Water <strong>sources</strong>, <strong>infrastructure</strong>, <strong>space</strong> <strong>and</strong> <strong>the</strong> <strong>dynamics</strong> <strong>of</strong> environmental diseases in Saboba District: Using GISTable 11: Criteria for Interpreting Correlation. Source: Cohen (1988)Correlation Negative PositiveSmall −0.3 to −0.1 0.1 to 0.3Medium −0.5 to −0.3 0.3 to 0.5Large −1.0 to −0.5 0.5 to 1.0Method usedDistances to major towns, roads <strong>and</strong> <strong>water</strong>courses were extracted usingArcGIS tool – Spatial Analyst – Distance – Straight line. The resultswere saved into DBF 4 format – MS Excel <strong>and</strong> <strong>the</strong>n to SPSS where <strong>the</strong>significance was tested using correlation (2-tailed) with <strong>the</strong> three leading(environmental) diseases (Malaria, Typhoid <strong>and</strong> RTI) in <strong>the</strong> district. For<strong>the</strong> purpose <strong>of</strong> this study, 0.05 levels are considered significant. It isworth noting that percentage <strong>of</strong> reported diseases to population in eacharea is used in this study, <strong>and</strong> not <strong>the</strong> raw figure. Figure 8 to 13 show <strong>the</strong>various map outcomes, while Table 12 shows its corresponding values.Space <strong>and</strong> environmental diseases: GIS analysisWith <strong>the</strong> aid <strong>of</strong> GIS (ArcGIS), this section analyses <strong>the</strong> relation betweenenvironmental diseases <strong>and</strong> <strong>the</strong> above mentioned spatial variables.Distances <strong>of</strong> settlements to <strong>the</strong> main town (district capital) in Saboba districtFigure 8 shows that majority <strong>of</strong> <strong>the</strong> settlements in Saboba district islocated beyond 10 km (10,000 metres) from <strong>the</strong> major town (Saboba)where <strong>the</strong> only hospital in <strong>the</strong> district is located. Poor road networks <strong>and</strong>floods fur<strong>the</strong>r impede movement <strong>of</strong> people to <strong>the</strong> district capital.Distances from each settlement to <strong>the</strong> major town were extracted usingGIS (results are affected by distances to major towns in neighbouringdistricts). The results are shown in column 12 <strong>of</strong> Table 12Distances <strong>of</strong> settlements to roads in Saboba districtThe research also tried to find out whe<strong>the</strong>r <strong>the</strong>re are any relationshipbetween closeness to road <strong>and</strong> <strong>the</strong> three environmental diseases,especially RTI, through smoke <strong>and</strong> dust from moving vehicles. Thereported cases <strong>of</strong> <strong>the</strong>se diseases <strong>of</strong> each settlement <strong>and</strong> its correspondentdistances to <strong>the</strong> nearest vertices <strong>of</strong> a road are shown in <strong>the</strong> map in Figure9, <strong>and</strong> its values in column 8,9,10 <strong>and</strong> 13 in Table 12. The outcome isimputed into SPSS to find correlation between <strong>the</strong> two variables, <strong>and</strong> <strong>the</strong>results shown <strong>and</strong> analysed later in this section.Distances <strong>of</strong> settlements to rivers in Saboba districtFigure 10 depicts distances <strong>of</strong> each settlement with respect to <strong>the</strong> nearestriver course (excluding streams, lakes <strong>and</strong> dams). A number <strong>of</strong> <strong>the</strong>settlements are located within 6 km (6000 metres) from <strong>the</strong> rivers. Theassumption/analogy is that <strong>the</strong> more closer a settlement is to a river, <strong>the</strong>higher <strong>the</strong> rates <strong>of</strong> <strong>water</strong>-related diseases – example, malaria.Distances <strong>of</strong> settlements to <strong>water</strong>courses in <strong>the</strong> Saboba districtFigure 11 shows distances <strong>of</strong> each settlement with respect to <strong>the</strong> nearest<strong>water</strong>course (stream, lake, dam etc). The reported disease values <strong>of</strong> eachsettlement <strong>and</strong> its correspondent distance to <strong>water</strong>courses are shown incolumn 8,9,10 <strong>and</strong> 14 in Table 12. Majority <strong>of</strong> <strong>the</strong> settlements are locatedwithin 3 km (3000 metres) to <strong>the</strong> nearest <strong>water</strong>course. However, veryfew <strong>of</strong> <strong>the</strong>se <strong>water</strong> bodies provide <strong>water</strong> for <strong>the</strong> communities due to <strong>the</strong>irseasonality <strong>of</strong> flow. The analogy is that <strong>the</strong> more closer a settlement is to<strong>water</strong>courses, <strong>the</strong> higher its risks <strong>of</strong> <strong>water</strong>-related diseases. Thisassumption was tested by correlating distances <strong>of</strong> settlements to31


