CLEAN DEVELOPMENT MECHANISM PROJECT ... - MyClimate
CLEAN DEVELOPMENT MECHANISM PROJECT ... - MyClimate
CLEAN DEVELOPMENT MECHANISM PROJECT ... - MyClimate

Create successful ePaper yourself
Turn your PDF publications into a flip-book with our unique Google optimized e-Paper software.
CDM – Executive Board<br />
<strong>PROJECT</strong> DESIGN DOCUMENT FORM (CDM PDD) - Version 03.1.<br />
<strong>CLEAN</strong> <strong>DEVELOPMENT</strong> <strong>MECHANISM</strong><br />
<strong>PROJECT</strong> DESIGN DOCUMENT FORM (CDM-PDD)<br />
Version 03 - in effect as of: 28 July 2006<br />
CONTENTS<br />
A. General description of project activity<br />
B. Application of a baseline and monitoring methodology<br />
C. Duration of the project activity / crediting period<br />
D. Environmental impacts<br />
E. Stakeholders’ comments<br />
Annexes<br />
Annex 1: Contact information on participants in the project activity<br />
Annex 2: Information regarding public funding<br />
Annex 3: Baseline information<br />
Annex 4: Monitoring plan<br />
page 1
CDM – Executive Board<br />
<strong>PROJECT</strong> DESIGN DOCUMENT FORM (CDM PDD) - Version 03.1.<br />
SECTION A. General description of project activity<br />
A.1 Title of the project activity:<br />
Title: 18.86 MW Bundled Wind Power Project, India<br />
Version: 01<br />
Date: 10/04/2007<br />
A.2 Description of the project activity:<br />
page 2<br />
With oil and gas prices soaring amid deepening instability in the Middle East, renewable energy<br />
particularly wind energy is emerging as a bright spot in the global energy economy and is poised for<br />
worldwide take off. Over last one decade, wind energy generation has increased five times which is a<br />
very remarkable development.<br />
Green energy sources such as geothermal, wind, small-scale hydropower, solar, biomass, tidal and wave<br />
power offer an attractive option for India, which imports 70 percent of its crude oil needs at a cost of<br />
more than $40 billion a year. Wind energy is rapidly developing as an environmentally sound and costeffective<br />
option for power generation. The prime movers of expansion are increasing environmental<br />
awareness and political commitments to reduce greenhouse gas emissions made under the Kyoto Protocol<br />
of 1997. Wind is free and supplies of it are inexhaustible, and when it produces energy it doesn’t release<br />
heat or greenhouse gases. The Ministry of Non-Conventional Energy Sources 1 , Govt. of India estimates<br />
that a 200-kilowatt wind turbine replacing a thermal power plant would save 120 to 200 tons of coal.<br />
Burning this amount of coal would add 2 to 3 tons of sulphur dioxide, 1.2 to 2.4 tons of nitrogen oxide<br />
and 300-500 tons of carbon dioxide to the atmosphere. India has a potential capacity of over 45,195 MW<br />
that can be extracted from the free and eco friendly energy source of wind but so far only 3595 MW has<br />
been tapped which is just about 8 percent of the current identified potential.<br />
The bundled project activity deals with generation of electricity using wind energy. The capacity of the<br />
project and other details has been furnished in the table below. This is a bundled project activity bringing<br />
together various small-scale CDM projects to form a single project where the distinctive characteristics of<br />
each project activity have been retained. The bundle consists of the following sub-bundles:<br />
Ref. No. Name of the<br />
Sponsor<br />
Mit/bp/01 M/s Vivek<br />
Pharmachem<br />
(India) Ltd,<br />
Jaipur<br />
No. of<br />
WTGs<br />
Capacity<br />
perWTG<br />
(KW)<br />
Installed<br />
Capacity<br />
(MW)<br />
Technology<br />
Used<br />
1 800 0.80 ENERCON,<br />
E-48<br />
Wind Turbine<br />
Location<br />
Chitradurga,<br />
Karnataka<br />
Ref. No. Name of the No. of Capacity Installed Technology Wind Turbine<br />
1 file://localhost/F:/wind/INTERVIEW%20-<br />
%20India%20hopes%20to%20double%20wind%20power%20generation%20by%202007 Reuters_com.htm
CDM – Executive Board<br />
<strong>PROJECT</strong> DESIGN DOCUMENT FORM (CDM PDD) - Version 03.1.<br />
Sponsor WTGs per<br />
WTG<br />
Mit/bp/02 M/s Gem Crafts<br />
Enterprises Pvt.<br />
Ltd., Jaipur<br />
Mit/bp/03 M/s ERCON<br />
Composites,<br />
Jodhpur<br />
Mit/bp/04 M/s S G<br />
Associates,<br />
Pune.<br />
Mit/bp/05 Sanjay D<br />
Ghodawat,<br />
Ichalkaranji<br />
Mit/bp/06 Sanjay D<br />
Ghodawat<br />
(HUF),<br />
Ichalkaranji<br />
Mit/bp/07 M/s Star Flexi-<br />
Pack Industries,<br />
Ichalkaranji<br />
Mit/bp/08 M/s James<br />
Andrew Newton<br />
Art Exports Pvt.<br />
Ltd., Jodhpur<br />
Mit/bp/09 M/s Chemical<br />
and Mineral<br />
Industries Pvt.<br />
Ltd., Jodhpur<br />
Mit/bp/10 M/s Shree Ram<br />
Industries,<br />
Jodhpur<br />
Mit/bp/11 M/s Shree Ram<br />
Gum and<br />
Chemicals,<br />
Jodhpur<br />
Mit/bp/12 M/s Vanaz<br />
Engineers Ltd.,<br />
Pune<br />
Mit/bp/13 M/s B.S.C.<br />
Textiles,<br />
Davangere<br />
(kW)<br />
Capacity<br />
(MW)<br />
2 800 1.60 ENERCON,<br />
E-48<br />
Used Location<br />
1 500 0.50 VESTAS, V-<br />
39<br />
1 600 0.60 SUZLON, S-<br />
52<br />
1 600 0.60 ENERCON,<br />
E-40<br />
1 600 0.60 ENERCON,<br />
E-40<br />
1 600 0.60 ENERCON,<br />
E-40<br />
1 500 0.50 VESTAS, V-<br />
39<br />
1 800 0.80 ENERCON,<br />
E-48<br />
1 800 0.80 ENERCON,<br />
E-48<br />
1 800 0.80 ENERCON,<br />
E-48<br />
1 1250 1.25 SUZLON, S-<br />
66<br />
1 350 0.35 SUZLON, S<br />
- 004<br />
2 350<br />
0.70<br />
SUZLON N<br />
3335<br />
page 3<br />
Chitradurga,<br />
Karnataka<br />
Valliour, Nagarcoil,<br />
Tamilnadu<br />
Sangli, Maharashtra<br />
Vani Vilas Sagar,<br />
Chitradurga,<br />
Karnataka<br />
Vanivilas Sagar,<br />
Chitradurga,<br />
Karnataka<br />
Vanivilas Sagar,<br />
Chitradurga,<br />
Karnataka<br />
Valliour, Nagarcoil,<br />
Tamilnadu<br />
Jaisalmer, Rajasthan<br />
Jaisalmer, Rajasthan<br />
Jaisalmer, Rajasthan<br />
Dhulia, Maharashtra<br />
Satara, Maharashtra<br />
Satara, Maharashtra
CDM – Executive Board<br />
Ref. No. Name of the<br />
Sponsor<br />
Mit/bp/14 M/s B.S.<br />
Channabasappa<br />
& Sons,<br />
<strong>PROJECT</strong> DESIGN DOCUMENT FORM (CDM PDD) - Version 03.1.<br />
Davangere<br />
Mit/bp/15 M/s Hindustan<br />
Distilleries,<br />
Ahmednagar<br />
Mit/bp/16 M/s S. K.<br />
Parik,<br />
Ichalkaranji<br />
Mit/bp/17 M/s Universal<br />
Starch Chem<br />
Allied Ltd.,<br />
Dondaicha<br />
Mit/bp/18 M/s Jaychandra<br />
Agro Industries<br />
Pvt. Ltd.,<br />
Dondaicha<br />
Mit/bp/19 M/s Unique<br />
Sugars<br />
Limited,<br />
Dondaicha<br />
Mit/bp/20 M/s Shri<br />
Charbhuja<br />
Sales<br />
Corporation,<br />
Ichalkaranji<br />
Mit/bp/21 M/s Vishnu<br />
Textiles<br />
Corporation,<br />
Ichalkaranji<br />
Mit/bp/22 M/s Vandana<br />
Textiles,<br />
Ichalkaranji<br />
Mit/bp/23 M/s Umang<br />
Textiles,<br />
Ichalkaranji<br />
Mit/bp/24 M/s Awade<br />
Industries<br />
Private<br />
Limited,<br />
Ichalkaranji<br />
No. of<br />
WTGs<br />
2<br />
Capacity<br />
per WTG<br />
(kW)<br />
Installed<br />
Capacity<br />
(MW)<br />
Technology<br />
Used<br />
350 0.70 SUZLON N<br />
3335<br />
3 350 1.05 SUZLON N<br />
3335<br />
1 350 0.35 SUZLON N<br />
3335<br />
1 600 0.60 ENERCON<br />
TACHE<br />
1 600 0.60 ENERCON<br />
TACHE<br />
1 600 0.60 ENERCON<br />
TACHE<br />
1 350 0.35 SUZLON N<br />
3335<br />
1 350 0.35 SUZLON<br />
N3335<br />
1 350 0.35 SUZLON<br />
N3335<br />
1 350 0.35 SUZLON<br />
N3335<br />
2 350 0.70 SUZLON<br />
N3335<br />
page 4<br />
Wind Turbine<br />
Location<br />
Satara,<br />
Maharashtra<br />
Satara,<br />
Maharashtra<br />
Satara,<br />
Maharashtra<br />
Dhule,<br />
Maharashtra<br />
Dhule,<br />
Maharashtra<br />
Dhule,<br />
Maharashtra<br />
Satara,<br />
Maharashtra<br />
Satara,<br />
Maharashtra<br />
Satara,<br />
Maharashtra<br />
Satara,<br />
Maharashtra<br />
Satara,<br />
Maharashtra
CDM – Executive Board<br />
Ref. No. Name of the<br />
Sponsor<br />
<strong>PROJECT</strong> DESIGN DOCUMENT FORM (CDM PDD) - Version 03.1.<br />
No. of<br />
WTG<br />
Capacity<br />
per<br />
WTG<br />
(kW)<br />
Installed<br />
Capacity<br />
(MW)<br />
Technology<br />
Used<br />
page 5<br />
Wind Turbine<br />
Location<br />
Mit/bp/25 M/s Suttatti 2 350 0.70 SUZLON Satara, Maharashtra<br />
Enterprises Pvt.<br />
N3335<br />
Ltd., Pune 2 600 1.20 ENERCON Chitradurga,<br />
E-40 Karnataka<br />
Mit/bp/26 M/s Mayura<br />
Steel Pvt. Ltd.,<br />
1 230 0.23 ENERCON Satara, Maharashtra<br />
Kolhapur<br />
1 230 0.23 ENERCON Chitradurga,<br />
Karnataka<br />
Total 37 18.86<br />
Purpose of the project activity<br />
The main purpose of the project activity is to generate electrical energy through sustainable means using<br />
wind power resources, to utilize the generated output for selling it to the state electricity utility as well as<br />
for captive consumption and to contribute to climate change mitigation efforts. Apart from generation of<br />
renewable electricity, the project has also been conceived for the following:<br />
• To enhance the propagation of commercialisation of wind turbines in the region<br />
• To contribute to the sustainable development of the region, socially, environmentally and<br />
economically<br />
• To reduce the prevalent regulatory risks for this project through revenues from emission trade.<br />
Contribution of project activity to sustainable development<br />
Government of India has stipulated following indicators for sustainable development in the interim<br />
approval guidelines 2 for CDM projects.<br />
1. Social well being:<br />
� The project has resulted in the development of the region.<br />
� During civil works, a lot of construction work took place, which generated employment for local<br />
people around the plant site.<br />
� Other than these, there are various kinds of mechanical work, which has generated and will continue<br />
to generate employment opportunities on regular and permanent basis.<br />
2 Ministry of Environment and Forest web site: http://envfor.nic.in:80/divisions/ccd/cdm_iac.html
CDM – Executive Board<br />
2. Economic well being:<br />
<strong>PROJECT</strong> DESIGN DOCUMENT FORM (CDM PDD) - Version 03.1.<br />
page 6<br />
� The project activity has generated employment in the local area.<br />
� The project activity has lead to good investment in a developing region which otherwise would not<br />
have happened in the absence of project activity.<br />
� The generated electricity is fed into the regional grid through local grid, thereby improving the grid<br />
frequency and availability of electricity to the local consumers (villagers & sub-urban habitants)<br />
which will provide new opportunities for industries and economic activities to be setup in the area<br />
thereby resulting in greater local employment, ultimately leading to overall development.<br />
� The project activity has also led to diversification of the national energy supply, which is dominated<br />
by conventional fuel based generating units.<br />
� Use of renewable energy source (wind energy) also helps in conservation of natural resources (like<br />
coal) in the country.<br />
3. Environmental well being:<br />
� The project utilizes wind energy for generating electricity which otherwise would have been<br />
generated through alternate fuels (fossil fuel) based power plants, contributing to reduction in specific<br />
emissions (emissions of pollutant/unit of energy generated) including GHG emissions.<br />
� As wind power project produce no end products in the form of solid waste (ash etc.). They address<br />
the problem of solid waste disposal encountered by most other sources of power.<br />
� Being a renewable resource, using wind energy to generate electricity contributes to resource<br />
conservation.<br />
� The project contributes to the economic sustainability around the plant site, which is promotion of<br />
decentralization of economic power.<br />
� Thus the project causes no negative impact on the surrounding environment contributing to<br />
environmental well being.<br />
4. Technological well being:<br />
� The project activity leads to the promotion of variety of technologies of Wind Turbine Generators<br />
(WTGs) in the subcontinent, demonstrating the success of various types of wind turbines, which feed<br />
the generated power into the nearest sub-station. Thus increasing energy availability and improving<br />
quality of power under the service area of the substation.<br />
In view of the above, the project participants consider that the project activity profoundly contributes to<br />
the sustainable development.
CDM – Executive Board<br />
A.3 Project participants:<br />
<strong>PROJECT</strong> DESIGN DOCUMENT FORM (CDM PDD) - Version 03.1.<br />
Name of the party<br />
involved<br />
((host) indicates a<br />
host party)<br />
� India, Ministry of<br />
Environment &<br />
Forest (MoEF)<br />
Private and/or public entity (ies)<br />
project participants<br />
(as applicable)<br />
M/s Vivek Pharmachem (India) Ltd.<br />
(VPIL)<br />
M/s Gem Crafts Enterprises Pvt. Ltd.<br />
(GCEPL)<br />
M/s ERCON Composites (EC)<br />
M/s S G Associates (SGA)<br />
Sanjay D Ghodawat (SDG)<br />
Sanjay D Ghodawat (HUF) (SDG –<br />
HUF)<br />
M/s Star Flexi-Pack Industries (SFPI)<br />
M/s James Andrew Newton Art Exports<br />
Pvt. Ltd. (JANAEPL)<br />
M/s Chemical and Mineral Industries<br />
Pvt. Ltd. (CMIPL)<br />
M/s Shree Ram Industries (SRI)<br />
M/s Shree Ram Gum and Chemicals<br />
(SRGC)<br />
M/s Vanaz Engineers Ltd. (VEL)<br />
M/s B.S.C. Textiles (BSCT)<br />
M/s B.S. Channabasappa & Sons<br />
(BSCS)<br />
M/s Hindustan Distilleries (HD)<br />
S. K. Parik (SKP)<br />
M/s Universal Starch Chem Allied Ltd.<br />
(USCAL)<br />
M/s Jaychandra Agro Industries Pvt. Ltd.<br />
(JAIPL)<br />
M/s Unique Sugars Limited (USL)<br />
M/s Shri Charbhuja Sales Corporation<br />
(SCSC)<br />
M/s Vishnu Textiles Corporation (VTC)<br />
M/s Vandana Textiles (VT)<br />
M/s Umang Textiles (UT)<br />
M/s Awade Industries Private Limited<br />
(AIPL)<br />
M/s Suttatti Enterprises Pvt. Ltd. (SEPL)<br />
M/s Mayura Steel Pvt. Ltd. (MSPL)<br />
page 7<br />
Kindly indicate if the<br />
party involved wishes to<br />
be considered as project<br />
participant (Yes/No)<br />
No.
CDM – Executive Board<br />
<strong>PROJECT</strong> DESIGN DOCUMENT FORM (CDM PDD) - Version 03.1.<br />
A.4 Technical description of the project activity:<br />
A.4.1 Location of the project activity:<br />
A.4.1.1 Host Party(ies):<br />
India<br />
A.4.1.2 Region/State/Province etc.:<br />
Details provided in the table in section A.4.1.4<br />
A.4.1.3 City/Town/Community etc:<br />
Details provided in the table in section A.4.1.4<br />
page 8<br />
A.4.1.4 Detail of physical location, including information allowing the<br />
unique identification of this project activity (maximum one page):<br />
Table No. 1: Geographical Location of Each District Where WTGs are Installed<br />
District Latitude Longitude<br />
Chitradurga (Karnataka) 14º 14´ N 76º 24´ E<br />
Nagarcoil (Tamil Nadu) 08º 10´ N 77º 26´ E<br />
Sangli (Maharashtra) 16º 52´ N 74º 34´ E<br />
Satara (Maharashtra) 16º 59´ N 74º 08´ E<br />
Dhulia (Maharashtra) 20º 54´ N 74º 47´ E<br />
Jaisalmer (Rajasthan) 26º 55´ N 70º 54´ E<br />
Table No. 2: Location of Each Project
CDM – Executive Board<br />
<strong>PROJECT</strong> DESIGN DOCUMENT FORM (CDM PDD) - Version 03.1.<br />
Location Village/<br />
Taluka<br />
District Color<br />
Code<br />
*<br />
page 9<br />
State<br />
M/s Vivek Pharmachem (India) Ltd. Elladakere Chitradurga Karnataka<br />
M/s Gem Crafts Enterprises Pvt. Ltd. Elladakere Chitradurga Karnataka<br />
M/s ERCON Composites Valliour, Nagarcoil Nagarcoil Tamilnadu<br />
M/s S G Associates Kundlapur, Kavthe Sangli Maharashtra<br />
Mahakal<br />
Sanjay D Ghodawat Van Vilas Sagar Chitradurga Karnataka<br />
Sanjay D Ghodawat (HUF) Van Vilas Sagar Chitradurga Karnataka<br />
M/s Star Flexi-Pack Industries Van Vilas Sagar Chitradurga Karnataka<br />
M/s James Andrew Newton Art Valliour, Nagarcoil Nagarcoil Tamilnadu<br />
Exports Pvt. Ltd.<br />
M/s Chemical and Mineral Industries<br />
Pvt. Ltd.<br />
Village Bhu, Kita,<br />
Pithado ki Dhani,<br />
Jaisalmer Rajasthan<br />
M/s Shree Ram Industries Village Bhu, Kita Jaisalmer Rajasthan<br />
M/s Shree Ram Gum and Chemicals Village Bhu, Kita Jaisalmer Rajasthan<br />
M/s Vanaz Engineers Ltd.<br />
Khori, Sakri Dhulia Maharashtra<br />
Vankusavade, Patan Satara Maharashtra<br />
M/s B.S.C. Textiles<br />
Gawadewadi, Patan<br />
Vankusavde, Patan<br />
Satara Maharashtra<br />
M/s B.S. Channabasappa & Sons Gawadewadi, Patan<br />
Vankusavde, Patan<br />
Satara Maharashtra<br />
M/s Hindustan Distilleries Vankusavde, Patan Satara Maharashtra<br />
S. K. Parik Aral, Patan Satara Maharashtra<br />
M/s Universal Starch Chem Allied<br />
Ltd<br />
Bramhanwel, Sakri Dhule Maharashtra<br />
M/s Jaychandra Agro Industries Pvt.<br />
Ltd.<br />
Bramhanwel, Sakri Dhule Maharashtra<br />
M/s Unique Sugars Limited Bramhanwel, Sakri Dhule Maharashtra<br />
M/s Shri Charbhuja Sales<br />
Corporation<br />
Gojegaon, Patan Satara Maharashtra<br />
M/s Vishnu Textiles Corporation Devshi, Patan Satara Maharashtra<br />
M/s Vandana Textiles Devshi, Patan Satara Maharashtra<br />
M/s Umang Textiles Devshi, Patan Satara Maharashtra<br />
M/s Awade Industries Private<br />
Limited<br />
M/s Suttatti Enterprises Pvt. Ltd.<br />
M/s Mayura Steel Pvt. Ltd.<br />
Devshi, Patan Satara Maharashtra<br />
Kati, Patan Satara Maharashtra<br />
Kumminaghatta,<br />
Holallkere<br />
Chitradurga Karnataka<br />
Matrewadi Satara Maharashtra<br />
Madakaripura Chitradurga Karnataka
CDM – Executive Board<br />
<strong>PROJECT</strong> DESIGN DOCUMENT FORM (CDM PDD) - Version 03.1.<br />
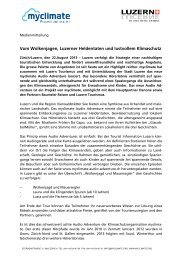
Figure 1, Location of Wind Turbines<br />
* Refer color codes in above table 2 & map for identification of each project location.<br />
A.4.2 Category(ies) of project activity:<br />
page 10<br />
The project activity falls under Sectoral Scope 1: Energy industries (renewable - / non-renewable sources)<br />
Technology:<br />
A.4.3 Technology to be employed by the project activity:<br />
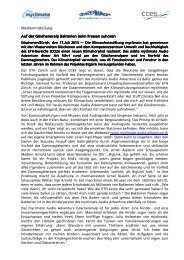
The basic machinery that converts wind power to electricity is called a wind turbine, although it has many<br />
more parts than other kinds of turbines. The wind spins blades that are attached to a hub that turns as the<br />
blades turn. Together, the blades and hub are called the rotor. The turning rotor spins a generator,<br />
producing electricity. There is also a controller that starts and stops the turbine blades. The generator,
CDM – Executive Board<br />
<strong>PROJECT</strong> DESIGN DOCUMENT FORM (CDM PDD) - Version 03.1.<br />
page 11<br />
controller, and other equipment are found inside a covered housing (nacelle) directly behind the turbine<br />
blades. Outside, an anemometer measures wind speed and feeds this information to the controller.<br />
Figure 2, Simplified Diagram of Wind Turbine System<br />
(Source: Real-Time Wind Turbine Emulator Suitable for Power Quality and Dynamic Control Studies; Dale S. L. Dolan, P. W.<br />
Lehn )<br />
The proposed project activity consists of 37 WTGs spread across various locations in Karnataka,<br />
Tamilnadu, Maharashtra and.Rajasthan.
CDM – Executive Board<br />
<strong>PROJECT</strong> DESIGN DOCUMENT FORM (CDM PDD) - Version 03.1.<br />
page 12<br />
A.4.4 Estimated amount of emission reductions over the chosen crediting period:<br />
Year<br />
2001<br />
2002<br />
2003<br />
2004<br />
VPIL GCEPL ERCON SGA SDG SDG(HUF) SFPI JANAEPL CMIPL<br />
2005 974.36 782.83<br />
2006 1674.00 2827.20 1325.25 1415.97 1382.52 1382.52 1382.52 1158.88 1160.65<br />
2007 1674.00 2827.20 1325.25 1619.25 1581.00 1581.00 1581.00 1325.25 1327.28<br />
Total Estimated Reduction 4322.36 6437.23 2650.50 3035.22 2963.52 2963.52 2963.52 2484.13 2487.93<br />
Crediting Period 7 Years<br />
Annual average over the crediting<br />
period of estimated red. ( t CO2 eqv)<br />
617.480 919.604 378.643 433.603 423.361 423.361 423.361 354.876 355.418<br />
2008 1674 2827.2 1325.25 1619.25 1581 1581 1581 1327.275 1327.275<br />
2009 1674 2827.2 1325.25 1619.25 1581 1581 1581 1327.275 1327.275<br />
2010 1674 2827.2 1325.25 1619.25 1581 1581 1581 1327.275 1327.275<br />
2011 1674 2827.2 1325.25 1619.25 1581 1581 1581 1327.275 1327.275<br />
2012 1674 2827.2 1325.25 1619.25 1581 1581 1581 1327.275 1327.275<br />
2013 1674 2827.2 1325.25 1619.25 1581 1581 1581 1327.275 1327.275<br />
2014 1674 2827.2 1325.25 1619.25 1581 1581 1581 1327.275 1327.275<br />
Total Estimated Reduction 11718 19790.4 9276.75 11334.75 11067 11067 11067 9290.925 9290.925<br />
Crediting Period 7 Years<br />
Annual average over the crediting<br />
period of estimated red. ( t CO2 eqv)<br />
1674 2827.2 1325.25 1619.25 1581 1581 1581 1327.275 1327.275<br />
2015 1674 2827.2 1325.25 1619.25 1581 1581 1581 1327.275 1327.275<br />
2016 1674 2827.2 1325.25 1619.25 1581 1581 1581 1327.275 1327.275<br />
2017 1674 2827.2 1325.25 1619.25 1581 1581 1581 1327.275 1327.275<br />
2018 1674 2827.2 1325.25 1619.25 1581 1581 1581 1327.275 1327.275<br />
2019 1674 2827.2 1325.25 1619.25 1581 1581 1581 1327.275 1327.275<br />
2020 1674 2827.2 1325.25 1619.25 1581 1581 1581 1327.275 1327.275<br />
2021 1674 2827.2 1325.25 1619.25 1581 1581 1581 1327.275 1327.275<br />
Total Estimated Reduction 11718 19790.4 9276.75 11334.75 11067 11067 11067 9290.925 9290.925<br />
Crediting Period 7 Years<br />
Annual average over the crediting<br />
period of estimated red. ( t CO2 eqv)<br />
1674 2827.2 1325.25 1619.25 1581 1581 1581 1327.275 1327.275
CDM – Executive Board<br />
<strong>PROJECT</strong> DESIGN DOCUMENT FORM (CDM PDD) - Version 03.1.<br />
page 13<br />
Year SRI SRGC VEL BSCT BSCS HD SKP USCAL JAIPL<br />
2001 244.77 244.77 239.88<br />
2002 539.94 1143 1143 1619.83 560.07 999.51 999.51<br />
2003 571.5 1143 1143 1714.5 560.07 1143 1143<br />
2004 1749.1 571.5 1143 1143 1714.5 560.07 1143 1143<br />
2005 2000.25 571.5 1143 1143 1714.5 560.07 1143 1143<br />
2006 1160.65 1160.65 2000.25 571.5 1143 1143 1714.5 560.07 1143 1143<br />
2007 1327.28 1327.28 2000.25 571.5 1143 1143 1714.5 560.07 1143 1143<br />
Total Estimated Reduction 2487.93 2487.93 7749.89 3397.44 7102.77 7102.77 10192.33 3600.30 6714.51 6714.51<br />
Crediting Period 7 Years<br />
Annual average over the crediting period<br />
of estimated red. ( t CO2 eqv)<br />
355.42 355.42 1107.13 485.35 1014.68 1014.68 1456.05 514.33 959.22 959.22<br />
2008 1327.28 1327.28 2000.25 571.50 1143.00 1143.00 1714.50 560.07 1143.00 1143.00<br />
2009 1327.28 1327.28 2000.25 571.50 1143.00 1143.00 1714.50 560.07 1143.00 1143.00<br />
2010 1327.28 1327.28 2000.25 571.50 1143.00 1143.00 1714.50 560.07 1143.00 1143.00<br />
2011 1327.28 1327.28 2000.25 571.50 1143.00 1143.00 1714.50 560.07 1143.00 1143.00<br />
2012 1327.28 1327.28 2000.25 571.50 1143.00 1143.00 1714.50 560.07 1143.00 1143.00<br />
2013 1327.28 1327.28 2000.25 571.50 1143.00 1143.00 1714.50 560.07 1143.00 1143.00<br />
2014 1327.28 1327.28 2000.25 571.50 1143.00 1143.00 1714.50 560.07 1143.00 1143.00<br />
Total Estimated Reduction 9290.93 9290.93 14001.75 4000.50 8001.00 8001.00 12001.50 3920.49 8001.00 8001.00<br />
Crediting Period 7 Years<br />
Annual average over the crediting period<br />
of estimated red. ( t CO2 eqv)<br />
1327.28 1327.275 2000.25 571.5 1143 1143 1714.5 560.07 1143 1143<br />
2015 1327.28 1327.28 2000.25 571.50 1143.00 1143.00 1714.50 560.07 1143.00 1143.00<br />
2016 1327.28 1327.28 2000.25 571.50 1143.00 1143.00 1714.50 560.07 1143.00 1143.00<br />
2017 1327.28 1327.28 2000.25 571.50 1143.00 1143.00 1714.50 560.07 1143.00 1143.00<br />
2018 1327.28 1327.28 2000.25 571.50 1143.00 1143.00 1714.50 560.07 1143.00 1143.00<br />
2019 1327.28 1327.28 2000.25 571.50 1143.00 1143.00 1714.50 560.07 1143.00 1143.00<br />
2020 1327.28 1327.28 2000.25 571.50 1143.00 1143.00 1714.50 560.07 1143.00 1143.00<br />
2021 1327.28 1327.28 2000.25 571.50 1143.00 1143.00 1714.50 560.07 1143.00 1143.00<br />
Total Estimated Reduction 9290.93 9290.93 14001.75 4000.50 8001.00 8001.00 12001.50 3920.49 8001.00 8001.00<br />
Crediting Period 7 Years<br />
Annual average over the crediting period<br />
of estimated red. ( t CO2 eqv)<br />
1327.28 1327.28 2000.25 571.50 1143.00 1143.00 1714.50 560.07 1143.00 1143.00
CDM – Executive Board<br />
<strong>PROJECT</strong> DESIGN DOCUMENT FORM (CDM PDD) - Version 03.1.<br />
page 14<br />
Year USL SCSC VTC VT UT AIPL SEPL SEPL MSPL MSPL Total (All 26<br />
Projects)<br />
2001 88.381 88.381 88.381 88.381 180.369 67.64 1330.948<br />
2002 999.51 560.07 560.07 560.07 560.07 1143 634.37 428.63 12450.64<br />
2003 1143 560.07 560.07 560.07 560.07 1143 634.37 2439.75 428.63 406.62 15853.71<br />
2004 1143 560.07 560.07 560.07 560.07 1143 634.37 2790 428.63 465 18011.48<br />
2005 1143 560.07 560.07 560.07 560.07 1143 634.37 2790 428.63 465 20019.78<br />
2006 1143 560.07 560.07 560.07 560.07 1143 634.37 2790 428.63 465 34293.42<br />
2007 1143 560.07 560.07 560.07 560.07 1143 634.37 2790 428.63 465 35758.37<br />
Total Estimated Reduction 6714.51 3448.80 3448.80 3448.80 3448.80 7038.37 3806.19 13599.75 2639.39 2266.62 137718.3<br />
Crediting Period 7 Years<br />
Annual average over the crediting period 959.22 492.69 492.69 492.69 492.69 1005.48 543.74 1942.82 377.06 323.80 19674.05<br />
of estimated red. ( t CO2 eqv)<br />
2008 1143 560.07 560.07 560.07 560.07 1143 634.37 2790 428.63 465 35760.39<br />
2009 1143 560.07 560.07 560.07 560.07 1143 634.37 2790 428.63 465 35760.39<br />
2010 1143 560.07 560.07 560.07 560.07 1143 634.37 2790 428.63 465 35760.39<br />
2011 1143 560.07 560.07 560.07 560.07 1143 634.37 2790 428.63 465 35760.39<br />
2012 1143 560.07 560.07 560.07 560.07 1143 634.37 2790 428.63 465 35760.39<br />
2013 1143 560.07 560.07 560.07 560.07 1143 634.37 2790 428.63 465 35760.39<br />
2014 1143 560.07 560.07 560.07 560.07 1143 634.37 2790 428.63 465 35760.39<br />
Total Estimated Reduction 8001 3920.49 3920.49 3920.49 3920.49 8001 4440.56 19530 3000.38 3255 250322.7<br />
Crediting Period 7 Years<br />
Annual average over the crediting period 1143 560.07 560.07 560.07 560.07 1143 634.37 2790 428.6 465 35760.39<br />
of estimated red. ( t CO2 eqv)<br />
2015 1143 560.07 560.07 560.07 560.07 1143 634.37 2790 428.63 465 35760.39<br />
2016 1143 560.07 560.07 560.07 560.07 1143 634.37 2790 428.63 465 35760.39<br />
2017 1143 560.07 560.07 560.07 560.07 1143 634.37 2790 428.63 465 35760.39<br />
2018 1143 560.07 560.07 560.07 560.07 1143 634.37 2790 428.63 465 35760.39<br />
2019 1143 560.07 560.07 560.07 560.07 1143 634.37 2790 428.63 465 35760.39<br />
2020 1143 560.07 560.07 560.07 560.07 1143 634.37 2790 428.63 465 35760.39<br />
2021 1143 560.07 560.07 560.07 560.07 1143 634.37 2790 428.63 465 35760.39<br />
Total Estimated Reduction 8001 3920.49 3920.49 3920.49 3920.49 8001 4440.56 19530 3000.38 3255 250322.7<br />
Crediting Period 7 Years<br />
Annual average over the crediting period<br />
of estimated red. ( t CO2 eqv)<br />
1143 560.07 560.07 560.07 560.07 1143 634.37 2790 428.63 465 35760.39
CDM – Executive Board<br />
<strong>PROJECT</strong> DESIGN DOCUMENT FORM (CDM PDD) - Version 03.1.<br />
A.4.5. Public funding of the project activity:<br />
The project has not received any public funding and Official Development Assistance (ODA).<br />
SECTION B. Application of a baseline and monitoring methodology<br />
page 15<br />
B.1 Title and reference of the approved baseline and monitoring methodology applied to the<br />
project activity:<br />
Title: “Consolidated baseline methodology for grid-connected electricity generation from renewable<br />
sources”<br />
Reference: Revision to the approved consolidated baseline methodology ACM0002<br />
(Version 06: 19 May 2006)<br />
This baseline methodology is used in conjunction with the approved monitoring methodology ACM0002<br />
("Consolidated monitoring methodology for grid-connected electricity generation from renewable<br />
sources").<br />
The methodology also refers to the “Tool for demonstration and assessment of additionality” (Version 02,<br />
28 th November 2005)<br />
B.2 Justification of the choice of the methodology and why it is applicable to the project<br />
activity:<br />
The project activity is a bundled wind power project of total installed capacity of 18.86 MW hence<br />
“Consolidated baseline methodology for grid-connected electricity generation from renewable sources”<br />
ACM0002 is applicable for this project. This methodology includes electricity capacity additions from<br />
renewable sources such as:<br />
• Run-of-river hydro power plants; hydro power projects with existing reservoirs where the volume of<br />
the reservoir is not increased.<br />
• New hydro electric power projects with reservoirs having power densities (installed power generation<br />
capacity divided by the surface area at full reservoir level) greater than 4 W/m2.<br />
• Wind sources; (present project falls under this category)<br />
• Geothermal sources;<br />
• Solar sources;<br />
• Wave and tidal sources.<br />
� Geographic and system boundaries for the relevant electricity grid can be clearly identified and<br />
information on the characteristics of the grid is available.
CDM – Executive Board<br />
<strong>PROJECT</strong> DESIGN DOCUMENT FORM (CDM PDD) - Version 03.1.<br />
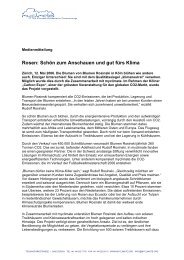
B.3 Description of the sources and gases included in the project boundary<br />
Legend:<br />
Sources of Gases<br />
Baseline<br />
Sub Station<br />
End User<br />
Regional Grid<br />
Figure 3, Project Boundary<br />
Source Gas Status Justification/Explanation<br />
Grid electricity<br />
generation<br />
Emission from grid<br />
CO2 Included Main Emission Source<br />
CH4 Excluded Excluded for simplification. This is<br />
conservative.<br />
N2O Excluded Excluded for simplification. This is<br />
conservative.<br />
page 16
CDM – Executive Board<br />
Ba<br />
seli<br />
ne<br />
Project<br />
Activity<br />
<strong>PROJECT</strong> DESIGN DOCUMENT FORM (CDM PDD) - Version 03.1.<br />
Source Gas Status Justification/Explanation<br />
On site fuel CO2 Excluded Not required for the project.<br />
combustion due to<br />
implementation of CH4 Excluded Not required for the project.<br />
project activity N2O Excluded Not required for the project.<br />
page 17<br />
B.4 Description of how the baseline scenario is identified and description of the identified<br />
baseline scenario:<br />
Consolidated baseline methodology for grid-connected electricity generation from renewable sources<br />
(Version 06) classifies project activities under two heads<br />
� Project activities that do not modify or retrofit an existing electricity generation facility<br />
And<br />
� Project activities that modify or retrofit an existing electricity generation facility<br />
The present project activity falls under the former class since all the WTGs included in this project have<br />
been commissioned as new 3 units and no modification or retrofitting of existing WTGs is involved.<br />
Hence the baseline scenario in this case is identified as:<br />
“Electricity delivered to the grid by the project would have otherwise been generated by the operation of<br />
grid-connected power plants and by the addition of new generation sources, as reflected in the combined<br />
margin (CM)”<br />
The baseline emission factor (EFy) is calculated as a combined margin (CM), consisting of the combination of<br />
operating margin (OM) and build margin (BM) factors.<br />
B.5. Description of how the anthropogenic emissions of GHG by sources are reduced below<br />
those that would have occurred in the absence of the registered CDM project activity (assessment<br />
and demonstration of additionality):<br />
Justification for additionality of the project<br />
Although subsidies and financial incentives were given liberally to wind energy, this technology<br />
remained marginalized in the overall energy scenario. Wind energy contributes about 1% of the total<br />
power available in India 4 . While working out cost-benefit analysis and calculating internal rate of return<br />
for any power project, hidden or indirect subsidies on pricing a resource and infrastructure were never<br />
taken into account in conventional energy sources. On the other hand, economic analysis of wind energy<br />
projects rarely supported their economic justification. Most projects were supported for their renewable<br />
nature, social and environmental benefits.<br />
3 Power Purchase Agreements & Commissioning Certificates are available as documentary proof.<br />
4 CEA general review 2006 (table no. 3.2)
CDM – Executive Board<br />
<strong>PROJECT</strong> DESIGN DOCUMENT FORM (CDM PDD) - Version 03.1.<br />
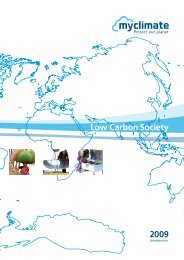
Figure 4, All India Gross Electricity Generation (Utilities) During 2004-05 (GWh)<br />
Diese<br />
0%<br />
Ga<br />
10%<br />
Nuclear<br />
3%<br />
Steam<br />
72%<br />
page 18<br />
Source: CEA General Review 2006 (Table No 3.2)<br />
Step 0. Preliminary screening based on the starting date of the project activity<br />
Not applicable as this is a Verified Emission Reduction Project.<br />
Step 1. Identification of alternatives to the project activity consistent with current laws and<br />
regulations<br />
Sub-step 1a. Define alternatives to the project activity:<br />
� The proposed project activity not undertaken as CDM project<br />
The project faces barriers as discussed below hence this option is not available with the project promoters.<br />
� All other plausible and credible alternatives to the project activity that deliver outputs and on services<br />
(e.g. electricity, heat or cement) with comparable quality, properties and application areas<br />
Since most of the individual projects under this bundle supply electricity to the grid, other alternatives<br />
like setting up of fossil fuel power plants could be possible. Projects (Mit/bp/09-M/s Chemical and<br />
Mineral Industries Pvt. Ltd; Mit/bp/10- M/s Shree Ram Industries; Mit/bp/11- M/s Shree Ram Gum and<br />
Chemicals) that use part of the electricity generated for captive consumption, alternatives may include<br />
use of fossil fuels for electricity generation without supply to grid. Possible fuel based electricity<br />
generation would cause more GHG emissions.<br />
� Continuation of the current situation (no project activity or other alternatives undertaken).<br />
Wind<br />
1%<br />
BP<br />
0%<br />
Hydr<br />
14%
CDM – Executive Board<br />
<strong>PROJECT</strong> DESIGN DOCUMENT FORM (CDM PDD) - Version 03.1.<br />
page 19<br />
This is the most plausible baseline scenario as in the absence of the project activity - the respective state<br />
grids would continue to be supplied by conventional power plants. Even for Mit/bp/09, Mit/bp/10,<br />
Mit/bp/11 projects where the electricity produced is used partly for captive use, this would be the apt<br />
baseline as all other scenarios would cause more GHG emissions as compared to this option.<br />
Table No. 3 - Gross Electrical Energy Generation from Steam and Wind Resources 5<br />
State Energy generated from Steam (%) Energy generated from Wind (%)<br />
Rajasthan 84 1.6<br />
Maharashtra 83 0.007<br />
Karnataka 54 2.08<br />
Tamil Nadu 66 7.5<br />
The table above depicts all India electricity generation statistics. As can be clearly seen from the table,<br />
maximum percentage of electricity is generated by thermal power plants and marginal portion comes<br />
from wind energy. Thus clearly thermal power plants would have supplied electricity to the grid in the<br />
absence of the project activity.<br />
Sub-step 1b. Enforcement of applicable laws and regulations:<br />
The alternative is in compliance with all applicable legal and regulatory requirements.<br />
Step 2. Investment analysis<br />
This step has not been carried out for this project.<br />
Step 3. Barrier analysis<br />
Sub-step 3a. Identify barriers that would prevent the implementation of type of the proposed project<br />
activity:<br />
Financial Barriers:<br />
The main problem area which is hindering the development of wind power in India is the dire lack of<br />
financing institutions to back the huge capital cost investment required by wind farms. The wind power<br />
plant sector is still predominantly debt-based for 60-70 6 percent of the project cost. IREDA and a handful<br />
of other banks are not enough to meet the installation needs, due to which wind energy hasn’t even taken<br />
off in many states.<br />
Regulatory Barriers;<br />
5 Table No. 3.4 All India Electricity Statistics General Review 2006<br />
6 Page No. 19 TERI Report :Wind Energy Information 2005/2006<br />
ENVIS Centre on Renewable Energy and Environment
CDM – Executive Board<br />
<strong>PROJECT</strong> DESIGN DOCUMENT FORM (CDM PDD) - Version 03.1.<br />
page 20<br />
As the projects in this bundle are spread across four different states, the regulatory barriers have been<br />
identified for each of these states.<br />
Karnataka ( 9 WTGs)<br />
Ref. No. Promoter Name No. of WTGs Capacity<br />
Mit/bp/01 M/s Vivek Pharmachem (India) Ltd. 1 0.80 MW<br />
Mit/bp/02 M/s Gem Crafts Enterprises Pvt. Ltd. 2 1.60 MW<br />
Mit/bp/05 Sanjay D Ghodawat 1 0.60 MW<br />
Mit/bp/06 Sanjay D Ghodawat (HUF) 1 0.60 MW<br />
Mit/bp/07 M/s Star Flexi-Pack Industries 1 0.60 MW<br />
Mit/bp/25 M/s Suttatti Enterprises Pvt. Ltd. 2 1.20 MW<br />
Mit/bp/26 M/s Mayura Steel Pvt. Ltd. 1 0.23 MW<br />
KERC came out with a policy consultation paper in December 2002 where, inter alia, it calculated the<br />
cost of generation from wind power projects. On a full cost of generation basis, it estimated that the first<br />
year tariff would be in the range of Rs. 4.44 per kWh to Rs. 6.55 per kWh. It also estimated that based on<br />
the MNES tariff, the wind projects would earn a return on equity ranging from -5% to 10% in the first<br />
year, which would increase to 12% to 29% by the 10th year.<br />
The projects that were implemented later had lower tariffs for first 10 years (Rs. 3.25 per kWh for<br />
projects already commissioned and to be commissioned on or before 31st August 2003 and Rs. 3.10 per<br />
kWh for projects to be commissioned after 31st August 2003 with annual escalation of 2% without<br />
compounding on the base tariff). (Source: KERC Order Case No.S/08/2003 (Batch-B) dated 17<br />
September 2003). For PPAs filed on or after 10 June 2004 (Source: KERC Order dated 18 January 2005),<br />
the tariff for wind energy projects is set at Rs. 3.40 per kWh without any escalation for the 10-year period<br />
from the date of commercial operation of the plant. While determining this tariff, KERC estimated that<br />
the first year cost of generation from a wind power project in Karnataka is Rs. 3.95 per kWh, which drops<br />
to Rs. 2.80 per kWh in the 10th year. First five year cost of generation is above Rs. 3.40 per kWh. Thus,<br />
the projects will earn less than their cost of generation for the first five years of generation, which with<br />
the exception of mini-hydel tariffs set by KERC, is not the case for any other non-conventional energy<br />
sources.<br />
The economics of wind power project, as they are based on single part tariff structure without any<br />
deemed generation benefits, depend on their ability to be able to generate at estimated levels without<br />
being backed down. This is unlike other utility scale fossil fired or hydro power projects where two part<br />
tariff structure is available which mitigates the investment risks from dispatch (actual generation).<br />
During the monsoon period when the water level (and therefore hydro generation) in the state is<br />
comfortable, KPTCL has backed down the wind power projects resulting in a significant loss to project<br />
companies. This issue is compounded by the fact that during the monsoon season, the wind speed is very<br />
high and backing down of wind turbines during this period has a major impact on the revenue of the wind<br />
farm.<br />
Maharashtra (23 WTGs):
CDM – Executive Board<br />
<strong>PROJECT</strong> DESIGN DOCUMENT FORM (CDM PDD) - Version 03.1.<br />
page 21<br />
Ref. No. Promoter Name No. of WTGs Capacity<br />
Mit/bp/04 M/s S G Associates 1 0.6 MW<br />
Mit/bp/12 M/s Vanaz Engineers Ltd.<br />
1 1.25 MW<br />
1 0.35 MW<br />
Mit/bp/13 M/s B.S.C. Textiles 2 0.70 MW<br />
Mit/bp/14 M/s B.S. Channabasappa & Sons 2 0.70 MW<br />
Mit/bp/15 M/s Hindustan Distilleries 3 1.05 MW<br />
Mit/bp/16 S. K. Parik 1 0.35 MW<br />
Mit/bp/17 M/s Universal Starch Chem Allied Ltd. 1 0.60 MW<br />
Mit/bp/18 M/s Jaychandra Agro Industries Pvt.Ltd. 1 0.60 MW<br />
Mit/bp/19 M/s Unique Sugars Limited 1 0.60 MW<br />
Mit/bp/20 M/s Shri Charbhuja Sales Corporation 1 0.35 MW<br />
Mit/bp/21 M/s Vishnu textiles Corporation 1 0.35 MW<br />
Mit/bp/22 M/s Vandana Textiles 1 0.35 MW<br />
Mit/bp/23 M/s Umang Textiles 1 0.35 MW<br />
Mit/bp/24 M/s Awade Industries Private Limited 2 0.70 MW<br />
Mit/bp/25 M/s Suttatti Enterprises Pvt. Ltd. 2 0.70 MW<br />
Mit/bp/26 M/s Mayura Steel Pvt. Ltd. 1 0.23 MW<br />
One of the bigger risks investors face are those due to policy changes that take place in the wake of a<br />
change in political party post-elections. Recent history has shown that a change of Government means a<br />
clean slate in regard to certain socially sensitive issues such as power distribution and tariffs. Even if, the<br />
investors themselves are not the target of policy changes, the indirect impact wrought by potentially<br />
negative effects on utility’s and State Government’s fiscal well being are very real. Renewable energy<br />
projects are highly dependent on a Stable policy environment in order to protect and sustain the tariff<br />
structures, subsidies and/or incentive programmes that make such projects financially viable. Given that<br />
such programmes represent added cost to Government budgets, negative fiscal development can put<br />
pressure on the Government to alter or curtail these policies.<br />
While the Regulatory Commissions are in the process of evolution, one may encounter conflicting<br />
situations and undue interferences from the political class. Regulatory functions are expected to be fair<br />
and unbiased to all stakeholders. The box 7 below presents an interesting case.<br />
Conflict of interests - Power utilities and prospective wind power producers<br />
Subsidies, in the form of huge tax concessions and preferential tariff given to wind<br />
power projects in Maharashtra have been a highly controversial issue. A capacity<br />
addition of about 750 MW of wind power in Maharashtra was envisaged in the 10<br />
7<br />
Policy Paper on Collaboration between European and Indian Wind Energy Sector & Opportunities and Threats for<br />
Wind Energy in a Privatised Sector in India (http://www.euindiawind.net/pdf/eiwen_documents.pdf<br />
th<br />
Plan by MERC through its order dated November 24, 2003. For projects<br />
commissioned after April 1, 2003, MERC had fixed a tariff Rs. 3.5 / unit with an<br />
annual escalation of 15 paise for the next 13 years. Once this period of 13 years was<br />
over, the firms were free to sell power directly to a consumer of their choice with<br />
MSEB having no right. This participation was on first come- first-served basis and<br />
MSEB would have to enter into EPAs with all the private wind power projects, which<br />
wish to do so. In light of the high tariff being given to private wind developers,<br />
MSEB found it cost-effective to undertake development of wind projects on its own.<br />
To this effect, MSEB came up with a plan of erecting wind power projects of 600<br />
MW through a competitive bidding route. MSEB claimed that it would be possible to<br />
buy power through such competitive bidding route at a rate much less than MERC<br />
determined rate.
CDM – Executive Board<br />
<strong>PROJECT</strong> DESIGN DOCUMENT FORM (CDM PDD) - Version 03.1.<br />
page 22<br />
The rate at which power is bought from wind power projects by the state utility is fixed by Maharashtra<br />
Electricity Regulatory Commission under Section 22(i) c and 29 of the erstwhile ERC Act 1998, and also<br />
under Section 62 and 86 (i) e of the EA 2003. This tariff rate is binding on the promoter who has no say<br />
in the matter.<br />
The setting up of the grid to evacuate the electricity generated and maintenance is the sole responsibility<br />
of Maharashtra State and the project promoter has no control over this activity. Hence, any delay or
CDM – Executive Board<br />
<strong>PROJECT</strong> DESIGN DOCUMENT FORM (CDM PDD) - Version 03.1.<br />
page 23<br />
failure in setting up the grid by the State utility forms a major risk to the project promoter as, though the<br />
turbines may have been commissioned and are in a position to generate electricity, they cannot do so as<br />
the grid is not in place.<br />
Rajasthan: (3 WTGs)<br />
Ref. No. Promoter Name No. of WTGs Capacity<br />
Mit/bp/09 M/s Chemical and Mineral Industries Pvt. Ltd. 1 0.80 MW<br />
Mit/bp/10 M/s Shree Ram Industries 1 0.80 MW<br />
Mit/bp/11 M/s Shree Ram Gum and Chemicals 1 0.80 MW<br />
The policy of the state of Rajasthan has not been investment friendly (inconsistent) for sale of power from<br />
wind installations, leading to additional risks for the investors. The policy status in Rajasthan is briefly<br />
indicated below:<br />
� March 1999 – February 2000:<br />
Purchase of electricity at Rs 2.75 (US$ 0.061/kWh) with just 2% wheeling charges along with sales tax<br />
incentives. The developer was allowed to bank electricity for one year.<br />
� February 2000 – April 2003:<br />
Purchase of electricity at Rs 3.03 (US$ 0.067/kWh) while the wheeling charges were kept same at 2%.<br />
The provision for banking for 12 months has been limited to end of financial year only (March 31). If the<br />
banking period is exhausted and the electricity was not sold out by then, the state power utility will buy<br />
balance amount of electricity at 60% of the agreed purchase price.<br />
� April 2003 – October 2004:<br />
Purchase of electricity at Rs 3.32 (US$ 0.073 /kWh). The wheeling charges have been drastically<br />
increased from 2% to 10% for the volume of electricity supplied to the grid. The banking period has been<br />
reduced from 12 months to the end of calendar year (December 31).<br />
� October 2004 – Onwards:<br />
The present policy regime is not conducive for business investment in WEG as the purchase price has<br />
been reduced from Rs 3.32 / kWh (US$ 0.073 /kWh) to Rs 2.91 / kWh (US$ 0.064 / kWh) which is 13%<br />
lower then the previous power policy.<br />
Indian electricity sector is gearing up for the Availability Based Tariff (ABT) in which the generators<br />
with firm delivery of power against commitment will start getting more price for the generated power,<br />
whereas investor in WEG will have to bear this setback as the generator cannot play in the market for<br />
committed supply of electricity and will be left out for lower rates.<br />
Tamil Nadu (2 WTGs)<br />
Ref. No. Promoter Name No. of WTGs Capacity<br />
Mit/bp/03 M/s ERCON Composites 1 0.5 MW<br />
Mit/bp/08 M/s James Andrew Newton Art Exports Pvt. Ltd. 1 0.5 MW
CDM – Executive Board<br />
<strong>PROJECT</strong> DESIGN DOCUMENT FORM (CDM PDD) - Version 03.1.<br />
page 24<br />
Ministry of Non-conventional Energy Sources, Government of India had issued guidelines for power<br />
purchase tariff to be Rs.2.25 per kWh with 5 % escalation every year for all renewable energy to promote<br />
generation of renewable clean energy. TNEB was following the same. In 2001, TNEB changed its policy<br />
and frozen the power purchase tariff for wind energy at Rs. 2.70 per kWh with no escalation till 2006 and<br />
had informed that this power purchase tariff will be reviewed at 2006 and a new tariff will be fixed then.<br />
This had been a major barrier for establishing new wind farms as other renewable energy plants continued<br />
to get a higher tariff. For instance, the power purchase tariff for electricity from an industrial waste /<br />
municipal waste based generation is Rs. 3.49 for the year 2005 as against Rs. 2.70 for wind energy. This<br />
policy encourages investors to invest in other renewable energy plants. Reduction in power purchase<br />
tariff was a major investment barrier.<br />
Connection to the grid is a base requirement for wind projects, but often can be one of the most<br />
contentious. As an example of how important grid issues are, for two years running so far, the Tamil<br />
Nadu Electricity Board 8 has asked wind generators to shut down in the midst of peak wind season due to<br />
high system frequency stemming from an inability to transmit the power. This stems directly from<br />
inadequacies in grid infrastructure. In substantial parts of India – often in the places best suited for wind,<br />
the same portions of the grid where wind projects are being developed are also some of the most<br />
neglected. Investment in grid strengthening has been put off for many years in many rural areas and grid<br />
stability in these areas is often poor.<br />
While to date there have been no outright defaults on payments to wind generators, there have been<br />
delays in payment. If a utility has demonstrated chronic late payments, no matter how consistently they<br />
have paid eventually, this will be viewed as a significant credit risk by lenders, potentially one that is<br />
insurmountable short of extraordinary credit support measures. One can fathom the seriousness of this<br />
problem from the fact that the Tamil Nadu Electricity Board (TNEB) 9 owes wind power producers in the<br />
State over Rs 108 crore for the power they have supplied to the State grid since April 2006.<br />
Technical Barriers:<br />
In the conventional power sector, fossil fuel resources are limited, but the technology to harness them is<br />
well established. By contrast, wind energy resources are unlimited, but the technology to harness it is still<br />
in the development stage. Thus, non-availability of cost-effective, commercially viable technology for<br />
utilization of wind energy constitutes one of the barriers. Lack of standardization 10 in system components<br />
leads to wide ranges in design features and technical standards. Absence of long-term policy instruments<br />
has resulted in difficulties in manufacturing, service and maintenance of wind turbines. The mismatch<br />
between locally manufactured components and imported parts has resulted in weakening the reliability of<br />
the overall system in some cases. The absence of effective service and maintenance networks, combined<br />
with inadequate user training, leads to a loss of confidence among entrepreneurs and customers. Another<br />
barrier is lack of co-ordination among research groups, academic institutions, and the private wind<br />
industry.<br />
8 http://www.thehindubusinessline.com/2006/05/31/stories/2006053103621900.htm<br />
9 http://www.blonnet.com/2006/10/11/stories/2006101100921900.htm<br />
10 CICERO Working Paper 1999:4; Institutional dynamics and barriers in wind energy development (A case study<br />
of Tamil Nadu & Andhra Pradesh, India; (page no 18)
CDM – Executive Board<br />
<strong>PROJECT</strong> DESIGN DOCUMENT FORM (CDM PDD) - Version 03.1.<br />
page 25<br />
Table No. 4: List of Other More Commercially Viable Technologies With Cost of Generation 11<br />
Other Barriers:<br />
Options Cost (US cents/KWh)<br />
Coal Thermal 6.433<br />
Gas Combined Cycle 6.475<br />
Gas Open Cycle 11.815<br />
Hydel 9.334<br />
Fuel Oil 8.823<br />
Biogas Diesel 9.268<br />
Wind 14.013<br />
A good barometer for just how risky wind is viewed is the insurance industry. Wind, in comparison to<br />
other renewable technologies, has probably made the greatest advances in risk perception in the insurance<br />
arena such that a wide variety of ‘common’ insurance products are now available similar to what can be<br />
found in the conventional energy sector. The one major cover that is not available for wind is mechanical<br />
breakdown due to parts failure. Insurers are not willing to cover the materials science part of the neither<br />
wind turbine nor critical components such as gears and yaw control. They believe these components to be<br />
proprietary to specific manufacturers and subject to unpredictable stresses/cycling to cover at this point.<br />
Given the rapid pace of wind turbine design, components have not logged sufficient hours to build a<br />
meaningful actuarial database. Thus this is a major category of risk that must be absorbed by the project<br />
owner, as lenders will seek guarantees on replacement of such critical parts if not insured. It should be<br />
noted that this is an industry-wide phenomenon and not limited to India. However, Indian turbine<br />
manufacturers must work extra hard to build up its installed fleets and log field operation time to<br />
overcome risk perceptions.<br />
Sub-step 3 b. Show that the identified barriers would not prevent the implementation of at least one of<br />
the alternatives (except the proposed project activity):<br />
All these barriers relate to venturing into a relatively new technology of electricity generation by WTGS<br />
and do not apply to other alternatives such as continuation of supply of electricity from conventional<br />
fossil fuel plants in the absence of project activity.<br />
Step 4. Common practice analysis<br />
In the Indian Power Sector, common practice involves investing mostly in medium or large-scale fossil<br />
fuel fired power projects. This is mainly due to the assured return on investment, economies of scale and<br />
easy availability of finances.<br />
11 http://www.worldenergy.org/wec-geis/publications/default/tech_papers/17th_congress/1_1_27.asp#Heading16
CDM – Executive Board<br />
<strong>PROJECT</strong> DESIGN DOCUMENT FORM (CDM PDD) - Version 03.1.<br />
1%<br />
All India Installed Capacity (MW)<br />
10%<br />
55%<br />
1%<br />
0%<br />
3% 1% 3%<br />
0%<br />
26%<br />
page 26<br />
Hydro coal diesel gas nuclear SHP wind BG BP U&I<br />
Source: Ministry of Power, India (2005)<br />
Figure 5, Installed Capacity of Power Utilities in India<br />
Wind farms are located only in following 8 states of India out of 29 states and 6 union territories:<br />
Gujarat, Karnataka, Kerala, Maharashtra, Tamil Nadu, Andhra Pradesh, Rajasthan and West Bengal, last<br />
two states being latest entries. The total installed capacity of wind energy 1870 MW 12 out of total installed<br />
capacity of 123,014.81MW 13 in India. The share of installed capacity of wind is just 1.5%. The total<br />
generation all over India from wind sources for the year 2004-2005 was 4295.22 GWh 14 out of total<br />
generation of 594456.20 GWh for the year 2003-2004. The contribution from wind energy for total<br />
generation was just 0.7 %. From the above, it is evident that wind energy is not a prevailing practice in<br />
India.<br />
Step 5. Impact of CDM registration<br />
The attendant benefits and incentives derived from the project activity will help alleviate these barriers<br />
and thus enable the project to be successful. The financial benefit from the revenue obtained by selling<br />
the CO2 emissions reductions is one of the key issues that has encouraged the developers to invest in the<br />
proposed project activity.<br />
The above tests and analysis suggests that the project activity is additional and the anthropogenic<br />
emissions of GHG by sources will be reduced below those that would have occurred in the absence of the<br />
CDM project activity. It can therefore be clearly demonstrated that the proposed CDM project activity is<br />
not the baseline scenario.<br />
B.6 Emission reductions:<br />
12 Source : www.mnes.nic.in<br />
13 Source : Ministry of Power, Government of India www.powermin.nic.in/generation/generation_state_wise.htm<br />
14 Table 3.2: All India Electricity Statistics General Review 2006
CDM – Executive Board<br />
<strong>PROJECT</strong> DESIGN DOCUMENT FORM (CDM PDD) - Version 03.1.<br />
B.6.1 Explanation of methodological choices:<br />
page 27<br />
The baseline emission (BEy in tCO2) is the product of the baseline emission factor (EFy in tCO2/MWh)<br />
times the electricity supplied by the project activity to the grid (EGy in MWh) minus the baseline<br />
electricity supplied to the grid in the case of modified or retrofit facilities (EG baseline in MWh), as<br />
follows:<br />
BEy = (EGy – EGbaseline ) x EFgrid,y<br />
Since the following project does not involve any modification or retrofit of the existing generation facility<br />
hence EGbaseline = 0<br />
EFgrid,y is determined as follows:<br />
The weighted average of the Operating Margin emission factor (EFOM,y) and the Build Margin emission factor<br />
(EFBM,y):<br />
EFgrid,y = w OM * EF OM,y + w BM *EFBM, y<br />
where the weights wOM and wBM, by default, are 50% (i.e., wOM = wBM = 0.5), and EFOM,y and EFBM,y are<br />
calculated as described in Steps 1 and 2 below and are expressed in tCO2/MWh.<br />
For wind and solar projects, the default weights are as follows: wOM = 0.75 and wBM = 0.25 (owing to their<br />
intermittent and non-dispatchable nature).<br />
Where<br />
EF OM,y = Operating Margin Emission Factor<br />
EFBM, y = Build Margin Emission Factor<br />
EF GRID,Y = 0.75 x EF OM,y + 0.25 x EFBM, y<br />
1. Calculation of operating margin emission factor for the region based on simple OM<br />
For calculation of operating margin four options are available:<br />
(a) Simple operating margin;<br />
(b) Simple adjusted operating margin;<br />
(c) Dispatch data analysis operating margin;<br />
(d) Average operating margin.<br />
According to ACM0002 / version 06 dispatch data analysis should be the first choice but for the current<br />
project, dispatch data analysis cannot be used because of unavailability of data.<br />
The simple OM method was used as the low-cost/must run resources constitute less than 50% of the total<br />
grid generation of Western, Northern and Southern Grid in average of the five most recent years.<br />
The simple OM emission factor (EFOM, simple, y) is calculated as the generation-weighted average<br />
emissions per electricity unit (tCO2/MWh or MU) of all generating sources serving the system, not<br />
including low-operating cost and must-run power plants.
CDM – Executive Board<br />
Where:<br />
Fi, j, y<br />
EF OM, y =<br />
<strong>PROJECT</strong> DESIGN DOCUMENT FORM (CDM PDD) - Version 03.1.<br />
∑ F i, j , y * COEF i,j y<br />
∑ GENj, y<br />
page 28<br />
is the amount of fuel i (in a mass or volume unit) consumed by relevant power sources j in<br />
year(s) y, j refers to the power sources delivering electricity to the grid, not including lowoperating<br />
cost and must run power plants, and including imports to the grid,<br />
COEFi,j y is the CO2 emission coefficient of fuel i (tCO2 / mass or volume unit of the fuel), taking<br />
into account the carbon content of the fuels used by relevant power sources j and the<br />
percent oxidation of the fuel in year(s) y, and<br />
GENj,y is the electricity (MWh or MU) delivered to the grid by source j.<br />
The CO2 emission coefficient COEFi is obtained as<br />
Where:<br />
COEFi = NCVi * EFCO2,i * OXIDi<br />
NCVi - is the net calorific value (energy content) per mass or volume unit of a fuel i,<br />
OXIDi - is the oxidation factor of the fuel.<br />
EFCO2 , I - is the CO2 emission factor per unit of energy of the fuel i.<br />
2. Calculation of build margin factor for the region (ex ante):<br />
Build margin can be calculated as the generation weighted average emission factor (tCO2/MWh or<br />
MU) of a sample of power plant m, as follows:<br />
Where,<br />
EF BM, y = Σ Fi,m, y * COEFi, m<br />
∑ GENm, y<br />
Fi,m,,y, COEFi,m are analogous to the variables described for the simple OM method for plants m.<br />
3. Baseline emission factor (EF y)
CDM – Executive Board<br />
<strong>PROJECT</strong> DESIGN DOCUMENT FORM (CDM PDD) - Version 03.1.<br />
page 29<br />
The baseline emission factor EFy is calculated as the weighted average of the operating margin emission<br />
factor (EFOM, simple, y) and the build margin emission factor (EFBM, y), where the weights wOM and wBM, by<br />
default, are 75% wOM & 25% wBM, and EFOM,y and EFBM,y are calculated as described in Steps 1 and 2<br />
above and are expressed in tCO2/MWh or MU.<br />
Data used for arriving at the EF GRID,Y<br />
EF GRID,Y = 0.75 x EF OM,y + 0.25 x EFBM, y<br />
Values for all regional grids for FY 2000-2001 until FY 2004-2005, including inter-regional and cross-border<br />
electricity transfers. (CEA, User Guide: Version 1.1)<br />
B.6.2 Data and parameters that are available at validation:<br />
(Copy this table for each data and parameter)
CDM – Executive Board<br />
<strong>PROJECT</strong> DESIGN DOCUMENT FORM (CDM PDD) - Version 03.1.<br />
page 30<br />
Data / Parameter: EFy<br />
Data unit: t CO2/MWh<br />
Description: Grid emission factor of the Northern, Western and Southern Grid<br />
Source of data used: calculated<br />
Value applied: 0.8675, 0.9525, 0.93<br />
Justification of the choice of<br />
data or description of<br />
measurement methods and<br />
procedures actually applied :<br />
The values for OM and BM have been calculated by Ministry of Power,<br />
Central Electricity Authority hence are authentic and reliable. The EF<br />
calculation is based on the guidelines in ACM0002 (Version 06)<br />
Any comment: The values are for the year 2004-05<br />
Data / Parameter: EFOM y<br />
Data unit: t CO2/MWh<br />
Description: CO2 operating margin emission factor of the Northern, Western and<br />
Southern Grid<br />
Source of data used: CO2 Baseline Database for the Indian Power Sector, User Guide, Version<br />
1.1. CEA<br />
Value applied: 0.98, 1.01, 1.00<br />
Justification of the choice of<br />
data or description of<br />
measurement methods and<br />
procedures actually applied :<br />
The values have been calculated by Ministry of Power, Central Electricity<br />
Authority hence are authentic and reliable.<br />
Any comment: The values are for the year 2004-05<br />
Data / Parameter: EFBM y<br />
Data unit: t CO2/MWh<br />
Description: CO2 build margin emission factor of the Northern, Western and Southern<br />
Grid<br />
Source of data used: CO2 Baseline Database for the Indian Power Sector, User Guide, Version<br />
1.1. CEA<br />
Value applied: 0.53, 0.78, 0.72<br />
Justification of the choice of<br />
data or description of<br />
measurement methods and<br />
procedures actually applied :<br />
The values have been calculated by Ministry of Power, Central Electricity<br />
Authority hence are authentic and reliable.<br />
Any comment: The values are for the year 2004-05<br />
B.6.3 Ex-ante calculation of emission reductions:<br />
Grid Emission Factor<br />
Western Regional Grid- 952.5 T CO2/GWh<br />
Southern Regional Grid- 930 T CO2/GWh<br />
Northern Regional Grid- 867.5 T CO2/GWh
CDM – Executive Board<br />
<strong>PROJECT</strong> DESIGN DOCUMENT FORM (CDM PDD) - Version 03.1.<br />
Baseline emissions or CERs generated by the project are estimated to be:<br />
page 31<br />
Baseline Emissions (project) = Grid Emission Factor * Power Generated from the Project<br />
(tons of CO2) (tons of CO2/GWh) (GWh/year)<br />
Reference No. Applicable<br />
Regional<br />
Grid<br />
Grid<br />
Emission<br />
Factor<br />
(tCO2e/<br />
GWh) (EF)<br />
Installed<br />
Capacity<br />
(MW)<br />
Guaranteed<br />
Annual<br />
Generation 15<br />
(GWh) (EG)<br />
Mit/bp/01 Southern 930 0.80 1.8 1674<br />
Mit/bp/02 Southern 930 1.60 3.04 2827.2<br />
Mit/bp/03 Southern 930 0.50 1.425 1325.25<br />
Mit/bp/04 Western 952.5 0.60 1.7 1619.25<br />
Mit/bp/05 Southern 930 0.60 1.7 1581<br />
Mit/bp/06 Southern 930 0.60 1.7 1581<br />
Mit/bp/07 Southern 930 0.60 1.7 1581<br />
Mit/bp/08 Southern 930 0.50 1.425 1325.25<br />
Mit/bp/09 Northern 867.5 0.80 1.53 1327.275<br />
Mit/bp/10 Northern 867.5 0.80 1.53 1327.275<br />
Mit/bp/11 Northern 867.5 0.80 1.53 1327.275<br />
Mit/bp/12 Western 952.5 1.25 2.1 2000.25<br />
0.35 0.6 571.5<br />
Mit/bp/13 Western 952.5 0.70 1.2 1143<br />
Mit/bp/14 Western 952.5 0.70 1.2 1143<br />
Mit/bp/15 Western 952.5 1.05 1.8 1714.5<br />
Mit/bp/16 Western 952.5 0.35 0.588 560.07<br />
Mit/bp/17 Western 952.5 0.60 1.2 1143<br />
Mit/bp/18 Western 952.5 0.60 1.2 1143<br />
Mit/bp/19 Western 952.5 0.60 1.2 1143<br />
15 Values provided by Suppliers of WTGs<br />
Emission<br />
Reductions (tCO2e<br />
/ year) (ER= EW x<br />
EF)
CDM – Executive Board<br />
<strong>PROJECT</strong> DESIGN DOCUMENT FORM (CDM PDD) - Version 03.1.<br />
Reference No. Applicable<br />
Regional Grid<br />
Grid<br />
Emission<br />
Factor<br />
(tCO2e/<br />
GWh) (EF)<br />
Installed<br />
Capacity<br />
(MW)<br />
Guaranteed Annual<br />
Generation16<br />
(GWh) (EG)<br />
Mit/bp/20 Western 952.5 0.35 0.588 560.07<br />
Mit/bp/21 Western 952.5 0.35 0.588 560.07<br />
Mit/bp/22 Western 952.5 0.35 0.588 560.07<br />
Mit/bp/23 Western 952.5 0.35 0.588 560.07<br />
Mit/bp/24 Western 952.5 0.70 1.2 1143<br />
Mit/bp/25<br />
Mit/bp/26<br />
Western 952.5 0.70 0.666 634.365<br />
Southern 930 1.20 3.00 2790<br />
Western 952.5 0.23 0.45 428.625<br />
Southern 930 0.23 0.50 465<br />
B.6.4 Summary of the ex-ante estimation of emission reductions:<br />
Year Project<br />
Emission<br />
(tons CO2e /yr.)<br />
Baseline Emissions<br />
(tons CO2e /yr.)<br />
Leakage<br />
(tons CO2e /<br />
2001 0 1330.948 0 1330.948<br />
2002 0 12450.64 0 12450.64<br />
2003 0 15853.71 0 15853.71<br />
2004 0 18011.48 0 18011.48<br />
2005 0 20019.78 0 20019.78<br />
2006 0 34293.42 0 34293.42<br />
2007 0 35758.37 0 35758.37<br />
Sub Total 0 137718.3 0 137718.3<br />
(tons CO2e )<br />
2008 0 35760.39 0 35760.39<br />
2009 0 35760.39 0 35760.39<br />
2010 0 35760.39 0 35760.39<br />
2011 0 35760.39 0 35760.39<br />
2012 0 35760.39 0 35760.39<br />
2013 0 35760.39 0 35760.39<br />
2014 0 35760.39 0 35760.39<br />
Sub Total<br />
(tons CO2e )<br />
0 250322.7 0 250322.7<br />
16 Values provided by Suppliers of WTGs<br />
yr.)<br />
page 32<br />
Emission Reductions<br />
(tCO2e / year) (ER=<br />
EW x EF)<br />
Emission Reductions<br />
(tons CO2e /yr.)
CDM – Executive Board<br />
<strong>PROJECT</strong> DESIGN DOCUMENT FORM (CDM PDD) - Version 03.1.<br />
page 33<br />
Year Project Emission Baseline Emissions Leakage Emission Reductions<br />
(tons CO2e /yr.) (tons CO2e /yr.) (tons CO2e / yr.) (tons CO2e /yr.)<br />
2015 0 35760.39 0 35760.39<br />
2016 0 35760.39 0 35760.39<br />
2017 0 35760.39 0 35760.39<br />
2018 0 35760.39 0 35760.39<br />
2019 0 35760.39 0 35760.39<br />
2020 0 35760.39 0 35760.39<br />
2021 0 35760.39 0 35760.39<br />
Sub Total 0 250322.7 0 250322.7<br />
(tons CO2e )<br />
Grand Total<br />
(tons CO2e )<br />
- 638363.81<br />
- 638363.81<br />
B.7 Application of the monitoring methodology and description of the monitoring plan:<br />
B.7.1 Data and parameters monitored:<br />
(Copy this table for each data and parameter)<br />
Data / Parameter: EGy<br />
Data unit: MWh<br />
Description: Electricity supplied by the project activity annually<br />
Source of data to be Individual regional grid bills and company records<br />
used:<br />
Value of data applied<br />
for the purpose of<br />
calculating expected<br />
emission reductions in<br />
section B.5<br />
Description of<br />
measurement methods<br />
and procedures to be<br />
applied:<br />
QA/QC procedures to<br />
be applied:<br />
38336 (from the year when all the machines are commissioned)<br />
Instrument used is Trivector Energy Meter. Joint meter reading by Regional<br />
electricity board and project promoter.<br />
Sales record of the grid and other records will be used to ensure consistency.<br />
Invoices raised by individual companies to SEBs will be reviewed. Frequency<br />
of monitoring will be monthly. The instruments will be calibrated on every<br />
year.<br />
Any comment: Data will be archived for the entire crediting period plus two years.<br />
B.7.2 Description of the monitoring plan:<br />
“Consolidated monitoring methodology for zero-emissions grid-connected electricity generation<br />
from renewable sources” (Version 6) is applicable for the following project activity. The methodology<br />
requires monitoring of the following:
CDM – Executive Board<br />
<strong>PROJECT</strong> DESIGN DOCUMENT FORM (CDM PDD) - Version 03.1.<br />
• Electricity generation from the proposed project activity;<br />
Applicable for the project.<br />
page 34<br />
• Data needed to recalculate the operating margin emission factor, if needed, based on the choice of the<br />
method to determine the operating margin (OM), consistent with “Consolidated baseline<br />
methodology for grid-connected electricity generation from renewable sources” (ACM0002);<br />
Not applicable as the values of Operating Margin and Build Margin Emission Factors have been<br />
calculated by the Central Electricity Authority.<br />
• Data needed to recalculate the build margin emission factor, if needed, consistent with “Consolidated<br />
baseline methodology for grid-connected electricity generation from renewable sources”<br />
(ACM0002);<br />
Not applicable as the values of Operating Margin and Build Margin Emission Factors have been<br />
calculated by the Central Electricity Authority.<br />
• For geothermal power projects, data needed to calculate fugitive carbon dioxide and methane<br />
emissions and carbon dioxide emissions from combustion of fossil fuels required to operate the<br />
geothermal power plant.<br />
Not applicable for the project.<br />
• For new hydro electric power projects, the surface area of reservoir at the full reservoir level.<br />
Not applicable for the project.<br />
The project activity essentially involves generation of electricity from wind, the employed WEG can only<br />
convert wind energy into electrical energy and cannot use any other input fuel for electricity generation.<br />
Thus no special ways and means are required to monitor leakage from the project activity.<br />
The proposed project activity requires evacuation facilities for sale to grid and the evacuation facility is<br />
essentially maintained by the state power utility.<br />
The electricity generation measurements are required by the utility and the investors to assess electricity<br />
sales revenue and / or wheeling charges. The project activity has therefore envisaged two independent<br />
measurements of generated electricity from the wind turbines.<br />
• The primary recording of the electricity fed to the state utility grid will be carried out jointly at the<br />
incoming feeder of the state power utility. Machines for sale to utility will be connected to the feeder.<br />
• The joint measurement will be carried out once in a month in presence of both parties (the developer’s<br />
representative and officials of the state power utility). Both parties will sign the recorded reading.<br />
• The secondary monitoring, which will provide a backup (fail-safe measure) in case the primary<br />
monitoring is not carried out, would be done at the individual WEGs. Each WEG is equipped with an<br />
integrated electronic meter. These meters are connected to the Central Monitoring Station (CMS) of<br />
the entire wind farm through a wireless Radio Frequency (RF) network (SCADA). The generation data<br />
of individual machine can be monitored as a real-time entity at CMS. The snapshot of generation on<br />
the last day of every calendar month will be kept as a record both in electronic as well as printed<br />
(paper) form.<br />
The project proponents have signed an “Operation and Maintenance” agreement with the supplier of the<br />
wind turbines for the operation of the wind farm. The O& M management structure is as follows:
CDM – Executive Board<br />
Routine Maintenance Services:<br />
<strong>PROJECT</strong> DESIGN DOCUMENT FORM (CDM PDD) - Version 03.1.<br />
page 35<br />
Routine Maintenance Labour Work involves making available suitable manpower for operation and<br />
maintenance of the equipment and covers periodic preventive maintenance, cleaning and upkeep of the<br />
equipment including –<br />
a) Tower Torquing<br />
b) Blade Cleaning<br />
c) Nacelle Torquing and Cleaning<br />
d) Transformer Oil Filtration<br />
e) Control Panel & LT Panel Maintenance<br />
f) Site and Transformer Yard Maintenance<br />
Security Services: This service includes watch & ward and security of the wind farm and the equipment.<br />
Management Services:<br />
a) Data logging in for power generation, grid availability, machine availability.<br />
b) Preparation and submission of monthly performance report in agreed format.<br />
c) Taking monthly meter reading jointly with utility, of power generated at wind farm and supplied to<br />
grid from the meter/s maintained by utility for the purpose and co-ordinate to obtain necessary power<br />
credit report/ certificate.<br />
Technical Services:<br />
a) Visual inspection of the WTG and all parts thereof.<br />
b) Technical assistance including checking of various technical, safety and operational parameters of the<br />
equipment, trouble shooting and relevant technical services.<br />
c) Annual and monthly training schedules are organized by the manufacturers and suppliers of the wind<br />
turbines.
CDM – Executive Board<br />
<strong>PROJECT</strong> DESIGN DOCUMENT FORM (CDM PDD) - Version 03.1.<br />
The responsibilities of CDM project team is presented below-<br />
page 36<br />
Designation Responsibilities<br />
Project Head � Overall performance monitoring<br />
� Project Execution<br />
Project Executer and Controller � Operation<br />
� Verification of data<br />
� Site visit to check authenticity of data and take<br />
corrective action wherever necessary<br />
� Storage of Data<br />
Site Main Controller � Operation, Monitoring and Verification of data<br />
� Data recording<br />
� Storage of data<br />
Operation and Maintenance Contractor � Operation and Maintenance<br />
� Data recording<br />
� Storage of Data<br />
B.8 Date of completion of the application of the baseline study and monitoring methodology and<br />
the name of the responsible person(s)/entity(ies)<br />
Baseline Completion Date: 7/02/2007<br />
Name of person/entity determining the baseline: Project sponsors & their consultant, MITCON<br />
Consultancy Services Ltd.<br />
SECTION C. Duration of the project activity / crediting period<br />
C.1 Duration of the project activity:<br />
C.1.1 Starting date of the project activity:<br />
Starting date of the project activity is taken as 12/03/2001 as this is the first Purchase Order date<br />
in the bundle by M/s S. K. Parikh<br />
C.1.2 Expected operational lifetime of the project activity:<br />
20 years 0 months<br />
C.2 Choice of the crediting period and related information:<br />
C.2.1. Renewable crediting period<br />
Opted<br />
C.2.1.1. Starting date of the first crediting period:<br />
Starting date of the crediting period is 12/07/2001
CDM – Executive Board<br />
<strong>PROJECT</strong> DESIGN DOCUMENT FORM (CDM PDD) - Version 03.1.<br />
C.2.1.2. Length of the first crediting period:<br />
7 years Renewable (First crediting period – 12/07/2001 to 11/07/2008)<br />
C.2.2. Fixed crediting period:<br />
Not opted<br />
C.2.2.1. Starting date:<br />
Not applicable<br />
C.2.2.2. Length:<br />
Not applicable<br />
SECTION D. Environmental impacts<br />
page 37<br />
D.1 Documentation on the analysis of the environmental impacts, including transboundary<br />
impacts:<br />
Government of India in its notification 17 dated 14th September, 2006, has directed that “construction of<br />
new projects or activities or the expansion or modernization of existing projects or activities listed in the<br />
Schedule to the above mentioned notification entailing capacity addition with change in process and or<br />
technology shall be undertaken in any part of India only after the prior environmental clearance from the<br />
Central Government or as the case may be, by the State Level Environment Impact Assessment<br />
Authority, duly constituted by the Central Government”.<br />
Hence all new projects or expansion and modernization of existing projects or activities listed in category<br />
A and B of the Schedule to the notification have to obtain prior EIA clearance. Wind power projects have<br />
not been included in either of the categories thus these projects do not require to undertake environmental<br />
clearance prior to their installation.<br />
D.2 If environmental impacts are considered significant by the project participants or the host<br />
Party, please provide conclusions and all references to support documentation of an environmental<br />
impact assessment undertaken in accordance with the procedures as required by the host Party:<br />
Brief review of the environmental impacts project activity is discussed below -<br />
During construction phase<br />
17 http://envfor.nic.in/legis/eia/so1533.pdf
CDM – Executive Board<br />
<strong>PROJECT</strong> DESIGN DOCUMENT FORM (CDM PDD) - Version 03.1.<br />
page 38<br />
The construction phase involved erection of WEG in particular location. Although movement of materials<br />
for erection produced some dust pollution, the impacts were negligible and do not have any significant<br />
impact on the environment.<br />
During operation phase<br />
Impact on air<br />
There are absolutely no negative impacts on air due to the project activity.<br />
Impact on water<br />
No water is consumed for the project activity and no effluent is discharged from the project activity and<br />
hence, there is no impact on water due to the project activity.<br />
Impact on biodiversity<br />
The installation of a wind farm does not cause negative impact on ecology. It does not affect flora and<br />
fauna in any way.<br />
SECTION E. Stakeholders’ comments<br />
E.1 Brief description how comments by local stakeholders have been invited and compiled:<br />
The promoters organized formal & informal stakeholder consultation with the objective to inform the<br />
interested stakeholders on the environmental and social impacts of the project activity and discuss their<br />
concerns related to the development and operation of the activity. Details are -<br />
Ref. No. Name of the Sponsor Mode of Stakeholders<br />
Meeting<br />
Date<br />
Mit/bp/12 M/s Vanaz Engineers Ltd. 1.25MW Formal 25/07/2006<br />
0.35MW Formal 27/07/2006<br />
Mit/bp/15 M/s Hindustan Distilleries Formal 17/01/2006<br />
Mit/bp/17 M/s Universal Starch Chem Allied Ltd Formal 27/01/2007<br />
Mit/bp/18 M/s Jaychandra Agro Industries Pvt. Ltd. Formal 27/01/2007<br />
Mit/bp/19 M/s Unique Sugars Limited Formal 27/01/2007<br />
Mit/bp/20 M/s Shri Charbhuja Sales Corporation Formal 18/07/2006<br />
Mit/bp/21 M/s Vishnu Textile Corporation Formal 12/02/2007<br />
Mit/bp/22 M/s Vandana Textiles Formal 12/02/2007<br />
Mit/bp/23 M/s Umang Textiles Formal 12/02/2007<br />
Rest Rest of the sponsors Informal -<br />
E.2 Summary of the comments received:<br />
Once the project and process was informed, including the local job creation and benefits, the local<br />
stakeholders had no objections or negative comments relating to the project
CDM – Executive Board<br />
<strong>PROJECT</strong> DESIGN DOCUMENT FORM (CDM PDD) - Version 03.1.<br />
E.3 Report on how due account was taken of any comments received:<br />
page 39<br />
There were no negative comments received therefore it was not necessary to incorporate the comments<br />
into the project design or alter the project in any way.
CDM – Executive Board<br />
<strong>PROJECT</strong> DESIGN DOCUMENT FORM (CDM PDD) - Version 03.1.<br />
Annex 1<br />
page 40<br />
CONTACT INFORMATION ON PARTICIPANTS IN THE <strong>PROJECT</strong> ACTIVITY<br />
There are 26 individual project participants. Information regarding each participant can be sourced from<br />
MITCON, at following centralized contact. MITCON is the consultant to the project.<br />
Organization: M/s MITCON Consultancy Services Ltd.<br />
Street/P.O.Box: Dr. Rajendra Prasad Road<br />
Building: Kubera Chambers<br />
City: Shivajinagar, Pune<br />
State/Region: Maharashtra<br />
Postfix/ZIP: 411 005<br />
Country: India<br />
Telephone: 020 – 2553 3309, 2553 4322<br />
FAX: 020 – 2553 3206<br />
E-Mail: deepakzade2003@yahoo.com<br />
URL: www.mitconindia.com<br />
Represented by:<br />
Title: Exec. Vice President<br />
Salutation: Mr.<br />
Last Name: Zade<br />
Middle Name: Madhukar<br />
First Name: Deepak<br />
Department: Green Power Division<br />
Mobile: 09822684106<br />
Direct FAX: Not Available<br />
Direct tel: Not Available<br />
Personal E-Mail: deepakzade@indiatimes.com
CDM – Executive Board<br />
<strong>PROJECT</strong> DESIGN DOCUMENT FORM (CDM PDD) - Version 03.1.<br />
Annex 2<br />
INFORMATION REGARDING PUBLIC FUNDING<br />
page 41<br />
� The project has not received any public funding and Official Development Assistance (ODA).<br />
� The project is a unilateral project.
CDM – Executive Board<br />
<strong>PROJECT</strong> DESIGN DOCUMENT FORM (CDM PDD) - Version 03.1.<br />
Annex 3<br />
BASELINE INFORMATION<br />
page 42<br />
Baseline emissions are calculated as the kWh produced by the renewable generating unit multiplied by an<br />
emission co-efficient for the Western, Northern & Southern Region Grid, calculated in a transparent and<br />
conservative manner. ACM0002 provides two options for calculation of grid emission co-efficient for<br />
such project activities:<br />
The baseline emission (BEy in tCO2) is the product of the baseline emission factor (EFy in tCO2/MWh)<br />
times the electricity supplied by the project activity to the grid (EGy in MWh) minus the baseline<br />
electricity supplied to the grid in the case of modified or retrofit facilities (EG baseline in MWh), as<br />
follows:<br />
BEy = (EGy – EGbaseline ) x EFgrid,y<br />
Since the following project does not involve any modification or retrofit of the existing generation facility<br />
hence EGbaseline = 0<br />
EFgrid,y is determined as follows:<br />
EF GRID,Y = 0.75 x EF OM,y + 0.25 x EFBM, y<br />
Where<br />
EF OM,y = Operating Margin Emission Factor<br />
EFBM, y = Build Margin Emission Factor<br />
1. Calculation of operating margin emission factor for the region based on simple OM<br />
For calculation of operating margin four options are available:<br />
(a) Simple operating margin;<br />
(b) Simple adjusted operating margin;<br />
(c) Dispatch data analysis operating margin;<br />
(d) Average operating margin.<br />
According to ACM0002 / version 06 dispatch data analysis should be the first choice but for the current<br />
project, dispatch data analysis cannot be used because of unavailability of data.<br />
The simple OM method was used as the low-cost/must run resources constitute less than 50% of the total<br />
grid generation of Western, Northern and Southern Grid in average of the five most recent years.<br />
The simple OM emission factor (EFOM, simple, y) is calculated as the generation-weighted average<br />
emissions per electricity unit (tCO2/MWh or MU) of all generating sources serving the system, not<br />
including low-operating cost and must-run power plants.
CDM – Executive Board<br />
EF OM, y =<br />
<strong>PROJECT</strong> DESIGN DOCUMENT FORM (CDM PDD) - Version 03.1.<br />
∑ F i, j , y * COEF i,j y<br />
∑ GENj, y<br />
page 43<br />
Where:<br />
Fi, j, y -is the amount of fuel i (in a mass or volume unit) consumed by relevant power sources j in<br />
year(s) y, j refers to the power sources delivering electricity to the grid, not including lowoperating<br />
cost and must run power plants, and including imports to the grid,<br />
COEFi,j y -is the CO2 emission coefficient of fuel i (tCO2 / mass or volume unit of the fuel), taking into<br />
account the carbon content of the fuels used by relevant power sources j and the percent<br />
oxidation of the fuel in year(s) y, and<br />
GENj,y -is the electricity (MWh or MU) delivered to the grid by source j.<br />
The CO2 emission coefficient COEFi is obtained as<br />
Where:<br />
COEFi = NCVi * EFCO2,i * OXIDi<br />
NCVi - is the net calorific value (energy content) per mass or volume unit of a fuel i,<br />
OXIDi - is the oxidation factor of the fuel.<br />
EFCO2 , I - is the CO2 emission factor per unit of energy of the fuel i.<br />
2.Calculation of build margin Factor for the region (ex ante):<br />
Build margin can be calculated as the generation weighted average emission factor (tCO2/MWh or<br />
MU) of a sample of power plant m, as follows:<br />
EF BM, y = Σ Fi,m, y * COEFi, m<br />
Where,<br />
∑ GENm, y<br />
Fi,m,,y, COEFi,m are analogous to the variables described for the simple OM method for plants m.<br />
Baseline emission factor (EF y)
CDM – Executive Board<br />
<strong>PROJECT</strong> DESIGN DOCUMENT FORM (CDM PDD) - Version 03.1.<br />
page 44<br />
The baseline emission factor EFy is calculated as the weighted average of the operating margin emission<br />
factor (EFOM, simple, y) and the build margin emission factor (EFBM, y), where the weights wOM and wBM, by<br />
default, are 75% wOM and 25% wBM and EFOM,y and EFBM,y are calculated as described in Steps 1 and 2 of<br />
consolidated methodology ACM0002 and are expressed in tCO2/MWh or MU.<br />
EF GRID,Y = 0.75 x EF OM,y + 0.25 x EFBM, y<br />
Values for all regional grids for FY 2000-2001 until FY 2004-2005, including inter-regional and cross-border<br />
electricity transfers. (CEA, User Guide: Version 1.1)
CDM – Executive Board<br />
Where:<br />
<strong>PROJECT</strong> DESIGN DOCUMENT FORM (CDM PDD) - Version 03.1.<br />
BE = EGy * EFgrid<br />
Egy - is the net quantity of electricity generated by the project in year y, and<br />
EFgrid – is the carbon emission factor of the Grid<br />
Emission Estimation:<br />
page 45<br />
Emission factor = Net Generation * CEF for fuel * Net Heat Rate * Conversion Factor<br />
(tonnes of CO2) (GWh) (tonnes CO2/TJ) (TJ/GWh) (44/12)<br />
Baseline Emission Co-efficient calculation:<br />
Baseline Emission Co-efficient = Total Baseline Emissions / Total Net Generation<br />
(tonnes of CO2/GWh) (tonnes of CO2) (GWh)<br />
The grid emission factor for Indian power sector for the year 2006 has been calculated by CEA.<br />
Emission reduction due to project activity<br />
Emission Reduction = Baseline Emission – Project Emission – Leakage<br />
As wind power projects fall under clean energy sources for electricity generation, the emission from the<br />
project is taken as zero.<br />
Leakage estimation is also not required.<br />
Therefore:<br />
Grid Emission Factor<br />
Western Regional Grid – 952.5 T CO2/GWh<br />
Southern Regional Grid- 930 T CO2/GWh<br />
Northen Regional Grid – 867.5 T CO2/GWh<br />
Baseline emissions or CERs generated by the project are estimated to be:<br />
Baseline Emissions (project) = Grid Emission Factor * Power Generated from the Project<br />
(tons of CO2) (tons of CO2/GWh) (GWh/year)
<strong>PROJECT</strong> DESIGN DOCUMENT FORM (CDM PDD) - Version 03.1.<br />
CDM – Executive Board page 46<br />
Year VPIL GCEPL ERCON SGA SDG SDG(HUF) SFPI JANAEPL CMIPL<br />
2001<br />
2002<br />
2003<br />
2004<br />
2005 974.36 782.83<br />
2006 1674.00 2827.20 1325.25 1415.97 1382.52 1382.52 1382.52 1158.88 1160.65<br />
2007 1674.00 2827.20 1325.25 1619.25 1581.00 1581.00 1581.00 1325.25 1327.28<br />
Total Estimated Reduction 4322.36 6437.23 2650.50 3035.22 2963.52 2963.52 2963.52 2484.13 2487.93<br />
Crediting Period 7 Years<br />
Annual average over the crediting 617.480 919.604 378.643 433.603 423.361 423.361 423.361 354.876 355.418<br />
period of estimated red. ( t CO2 eqv)<br />
2008 1674 2827.2 1325.25 1619.25 1581 1581 1581 1327.275 1327.275<br />
2009 1674 2827.2 1325.25 1619.25 1581 1581 1581 1327.275 1327.275<br />
2010 1674 2827.2 1325.25 1619.25 1581 1581 1581 1327.275 1327.275<br />
2011 1674 2827.2 1325.25 1619.25 1581 1581 1581 1327.275 1327.275<br />
2012 1674 2827.2 1325.25 1619.25 1581 1581 1581 1327.275 1327.275<br />
2013 1674 2827.2 1325.25 1619.25 1581 1581 1581 1327.275 1327.275<br />
2014 1674 2827.2 1325.25 1619.25 1581 1581 1581 1327.275 1327.275<br />
Total Estimated Reduction 11718 19790.4 9276.75 11334.75 11067 11067 11067 9290.925 9290.925<br />
Crediting Period 7 Years<br />
Annual average over the crediting 1674 2827.2 1325.25 1619.25 1581 1581 1581 1327.275 1327.275<br />
period of estimated red. ( t CO2 eqv)<br />
2015 1674 2827.2 1325.25 1619.25 1581 1581 1581 1327.275 1327.275<br />
2016 1674 2827.2 1325.25 1619.25 1581 1581 1581 1327.275 1327.275<br />
2017 1674 2827.2 1325.25 1619.25 1581 1581 1581 1327.275 1327.275<br />
2018 1674 2827.2 1325.25 1619.25 1581 1581 1581 1327.275 1327.275<br />
2019 1674 2827.2 1325.25 1619.25 1581 1581 1581 1327.275 1327.275<br />
2020 1674 2827.2 1325.25 1619.25 1581 1581 1581 1327.275 1327.275<br />
2021 1674 2827.2 1325.25 1619.25 1581 1581 1581 1327.275 1327.275<br />
Total Estimated Reduction 11718 19790.4 9276.75 11334.75 11067 11067 11067 9290.925 9290.925<br />
Crediting Period 7 Years<br />
Annual average over the crediting<br />
period of estimated red. ( t CO2 eqv)<br />
1674 2827.2 1325.25 1619.25 1581 1581 1581 1327.275 1327.275
<strong>PROJECT</strong> DESIGN DOCUMENT FORM (CDM PDD) - Version 03.1.<br />
CDM – Executive Board page 47<br />
Year SRI SRGC VEL BSCT BSCS HD SKP USCAL JAIPL<br />
2001 244.77 244.77 239.88<br />
2002 539.94 1143 1143 1619.83 560.07 999.51 999.51<br />
2003 571.5 1143 1143 1714.5 560.07 1143 1143<br />
2004 1749.1 571.5 1143 1143 1714.5 560.07 1143 1143<br />
2005 2000.25 571.5 1143 1143 1714.5 560.07 1143 1143<br />
2006 1160.65 1160.65 2000.25 571.5 1143 1143 1714.5 560.07 1143 1143<br />
2007 1327.28 1327.28 2000.25 571.5 1143 1143 1714.5 560.07 1143 1143<br />
Total Estimated Reduction 2487.93 2487.93 7749.89 3397.44 7102.77 7102.77 10192.33 3600.30 6714.51 6714.51<br />
Crediting Period 7 Years<br />
Annual average over the crediting period 355.42 355.42 1107.13 485.35 1014.68 1014.68 1456.05 514.33 959.22 959.22<br />
of estimated red. ( t CO2 eqv)<br />
2008 1327.28 1327.28 2000.25 571.50 1143.00 1143.00 1714.50 560.07 1143.00 1143.00<br />
2009 1327.28 1327.28 2000.25 571.50 1143.00 1143.00 1714.50 560.07 1143.00 1143.00<br />
2010 1327.28 1327.28 2000.25 571.50 1143.00 1143.00 1714.50 560.07 1143.00 1143.00<br />
2011 1327.28 1327.28 2000.25 571.50 1143.00 1143.00 1714.50 560.07 1143.00 1143.00<br />
2012 1327.28 1327.28 2000.25 571.50 1143.00 1143.00 1714.50 560.07 1143.00 1143.00<br />
2013 1327.28 1327.28 2000.25 571.50 1143.00 1143.00 1714.50 560.07 1143.00 1143.00<br />
2014 1327.28 1327.28 2000.25 571.50 1143.00 1143.00 1714.50 560.07 1143.00 1143.00<br />
Total Estimated Reduction 9290.93 9290.93 14001.75 4000.50 8001.00 8001.00 12001.50 3920.49 8001.00 8001.00<br />
Crediting Period 7 Years<br />
Annual average over the crediting period 1327.28 1327.275 2000.25 571.5 1143 1143 1714.5 560.07 1143 1143<br />
of estimated red. ( t CO2 eqv)<br />
2015 1327.28 1327.28 2000.25 571.50 1143.00 1143.00 1714.50 560.07 1143.00 1143.00<br />
2016 1327.28 1327.28 2000.25 571.50 1143.00 1143.00 1714.50 560.07 1143.00 1143.00<br />
2017 1327.28 1327.28 2000.25 571.50 1143.00 1143.00 1714.50 560.07 1143.00 1143.00<br />
2018 1327.28 1327.28 2000.25 571.50 1143.00 1143.00 1714.50 560.07 1143.00 1143.00<br />
2019 1327.28 1327.28 2000.25 571.50 1143.00 1143.00 1714.50 560.07 1143.00 1143.00<br />
2020 1327.28 1327.28 2000.25 571.50 1143.00 1143.00 1714.50 560.07 1143.00 1143.00<br />
2021 1327.28 1327.28 2000.25 571.50 1143.00 1143.00 1714.50 560.07 1143.00 1143.00<br />
Total Estimated Reduction 9290.93 9290.93 14001.75 4000.50 8001.00 8001.00 12001.50 3920.49 8001.00 8001.00<br />
Crediting Period 7 Years<br />
Annual average over the crediting period<br />
of estimated red. ( t CO2 eqv)<br />
1327.28 1327.28 2000.25 571.50 1143.00 1143.00 1714.50 560.07 1143.00 1143.00
<strong>PROJECT</strong> DESIGN DOCUMENT FORM (CDM PDD) - Version 03.1.<br />
CDM – Executive Board page 48<br />
Year USL SCSC VTC VT UT AIPL SEPL SEPL MSPL MSPL Total (All 26<br />
Projects)<br />
2001 88.381 88.381 88.381 88.381 180.369 67.64 1330.948<br />
2002 999.51 560.07 560.07 560.07 560.07 1143 634.37 428.63 12450.64<br />
2003 1143 560.07 560.07 560.07 560.07 1143 634.37 2439.75 428.63 406.62 15853.71<br />
2004 1143 560.07 560.07 560.07 560.07 1143 634.37 2790 428.63 465 18011.48<br />
2005 1143 560.07 560.07 560.07 560.07 1143 634.37 2790 428.63 465 20019.78<br />
2006 1143 560.07 560.07 560.07 560.07 1143 634.37 2790 428.63 465 34293.42<br />
2007 1143 560.07 560.07 560.07 560.07 1143 634.37 2790 428.63 465 35758.37<br />
Total Estimated Reduction 6714.51 3448.80 3448.80 3448.80 3448.80 7038.37 3806.19 13599.75 2639.39 2266.62 137718.3<br />
Crediting Period 7 Years<br />
Annual average over the crediting period 959.22 492.69 492.69 492.69 492.69 1005.48 543.74 1942.82 377.06 323.80 19674.05<br />
of estimated red. ( t CO2 eqv)<br />
2008 1143 560.07 560.07 560.07 560.07 1143 634.37 2790 428.63 465 35760.39<br />
2009 1143 560.07 560.07 560.07 560.07 1143 634.37 2790 428.63 465 35760.39<br />
2010 1143 560.07 560.07 560.07 560.07 1143 634.37 2790 428.63 465 35760.39<br />
2011 1143 560.07 560.07 560.07 560.07 1143 634.37 2790 428.63 465 35760.39<br />
2012 1143 560.07 560.07 560.07 560.07 1143 634.37 2790 428.63 465 35760.39<br />
2013 1143 560.07 560.07 560.07 560.07 1143 634.37 2790 428.63 465 35760.39<br />
2014 1143 560.07 560.07 560.07 560.07 1143 634.37 2790 428.63 465 35760.39<br />
Total Estimated Reduction 8001 3920.49 3920.49 3920.49 3920.49 8001 4440.56 19530 3000.38 3255 250322.7<br />
Crediting Period 7 Years<br />
Annual average over the crediting period 1143 560.07 560.07 560.07 560.07 1143 634.37 2790 428.6 465 35760.39<br />
of estimated red. ( t CO2 eqv)<br />
2015 1143 560.07 560.07 560.07 560.07 1143 634.37 2790 428.63 465 35760.39<br />
2016 1143 560.07 560.07 560.07 560.07 1143 634.37 2790 428.63 465 35760.39<br />
2017 1143 560.07 560.07 560.07 560.07 1143 634.37 2790 428.63 465 35760.39<br />
2018 1143 560.07 560.07 560.07 560.07 1143 634.37 2790 428.63 465 35760.39<br />
2019 1143 560.07 560.07 560.07 560.07 1143 634.37 2790 428.63 465 35760.39<br />
2020 1143 560.07 560.07 560.07 560.07 1143 634.37 2790 428.63 465 35760.39<br />
2021 1143 560.07 560.07 560.07 560.07 1143 634.37 2790 428.63 465 35760.39<br />
Total Estimated Reduction 8001 3920.49 3920.49 3920.49 3920.49 8001 4440.56 19530 3000.38 3255 250322.7<br />
Crediting Period 7 Years<br />
Annual average over the crediting period<br />
of estimated red. ( t CO2 eqv)<br />
1143 560.07 560.07 560.07 560.07 1143 634.37 2790 428.63 465 35760.39
CDM – Executive Board<br />
<strong>PROJECT</strong> DESIGN DOCUMENT FORM (CDM PDD) - Version 03.1.<br />
Annex 4<br />
MONITORING INFORMATION<br />
Data / Parameter: EGy<br />
Data unit: MWh<br />
Description: Electricity generation by the project annually<br />
Source of data to be<br />
used:<br />
Measured<br />
Value of data 38336 (from the year when all machines are commissioned)<br />
Description of<br />
measurement methods<br />
and procedures to be<br />
applied:<br />
QA/QC procedures to<br />
be applied:<br />
page 49<br />
Instrument used is Trivector Energy Meter. Joint meter reading by Regional<br />
electricity board and project promoter.<br />
The project revenue is based on the net units displaced as measured by Main<br />
metering system installed at the interconnection point. Other than main meter<br />
the project proponent has check meter so that the accuracy of main meter can<br />
be verified. The calibration of the meters will be done annually by state<br />
electricity utility. Other than periodic calibration of the meters the reading of<br />
both meters will be matched every month to check for any inconsistency.<br />
Any comment: Data will be archived during the whole crediting period + 2 years<br />
- - - - -