download PDF - Imaging Notes
download PDF - Imaging Notes
download PDF - Imaging Notes
- No tags were found...

Create successful ePaper yourself
Turn your PDF publications into a flip-book with our unique Google optimized e-Paper software.
E arth R e mote Sensingfor Securit yE n e rgy an dthe EnvironmentFall 2007Vol. 22 No. 3Israel-Hizballah2006ConflictAnalysisChinaEmergingWorldView-1in OrbitNASA &Earth Science
Everyday, GeoEye captures noteworthy events taking place around the world,such as the construction of the Beijing 2008 Olympics venues. With IKONOS’sfrequent revisit times, our aerial imaging capabilities, and a robust imagearchive—over 278 million square kilometers—GeoEye provides imagerythat is ideal for planning, analyzing, and detecting changes.2GeoEye will continue its legacy of bringing you the world’s most advancedimagery with GeoEye-1. Our next-generation commercial imaging satellitewill have unparalled positional accuracy as well as the highest resolution, colorimagery in the world—.41-meter panchromatic and 1.65-meter multispectral.GeoEye Imagery Sourcesimaging notes // fall 2007 // www.imagingnotes.comIKONOSOrbView-2Aerial[DMC ® ]GeoEye-1[2008]www.geoeye.com | +1.703.480.5670© Copyright 2007 GeoEye. All rights reserved. DMC ® is a registered trademark of Z/I <strong>Imaging</strong>.
Fall 2007contents3278> columns101438Letters to the EditorPublisher’s LetterPolicy WatchChina: An Emerging EO GiantBy Ray Williamson, PhD, EditorNext-Gen MappingGeoWeb2007: Spatial Data InfrastructureBy Craig Bachmann & Natasha LégerEarth ScopeSummertime… and the Carbon is GrowingBy Tim Foresman, PhDHindsight Guest EditorialUrban Environments and New DesignTechnologiesBy Geoff Zeiss, PhD, Autodesk> F e a t u r e s16WorldView-1 LaunchHalf-meter Pan Imagery Coming Mid-OctoberBy Rod Franklin, Reporter18Satellites & StudentsWinners of The Thacher AwardsBy Dan Stillman, Institute for GlobalEnvironmental Strategies20<strong>Imaging</strong> Destructionin LebanonThe 2006 Israel-Hizballah WarBy Matthew McKinzie, PhD, NRCD &William Arkin, Military Analyst26Urban Land UseClassificationApplying Texture Analysis and AIBy Wenxue Ju, PhD Candidate &Nina Lam, PhD, Professor, LouisianaState University16202632NASA’s EarthScience ProgramLearning from Past Events to Project the FutureBy Edward Goldstein, PhD, AmericanUniversity & NASAimaging notes // fall 2007 // www.imagingnotes.com3
Alaskan Firescover imageFall 2007 / Vol. 22 / No. 3Our Mission<strong>Imaging</strong> <strong>Notes</strong> is the premier publication for commercial, government and academicremote sensing professionals around the world. It provides objective exclusive in-depthreporting that demonstrates how remote sensing technologies and spatial informationilluminate the urgent interrelated issues of the environment, energy and security.<strong>Imaging</strong> <strong>Notes</strong> is affiliated with the Alliance for Earth Observations, a program of TheInstitute for Global Environmental Strategies (www.strategies.org).Publisher/Managing editorMyrna James Yoomyrna@imagingnotes.comEditorRay A. Williamson, PhDray@imagingnotes.comReporterRod FranklinCopy EditorBette MillesonArt DirectorJürgen MantzkeEnfineitz LLCjurgen@enfineit z.comwww.enfineitz.comDeputy Art DirectorAndrew SternardEditorial Advisory BoardChair: Ray A. Williamson, PhDGeorge Washington UniversityMark E. BrenderGeoEyeNancy ColletonInstitute for GlobalEnvironmental StrategiesTimothy W. Foresman, PhDInternational Centre for RemoteSensing EducationWilliam B. Gail, PhDMicrosoft Virtual EarthAnne Hale MiglareseFugro NV/EarthDataKevin Pomfret, Esq.Cantor Arkema, P.C.This image of almost the entire stateof Alaska (shown on both front and back covers)was taken on June 29, 2004, when fires burned over6.5 million acres. Several smoke plumes are visibleall around the Fairbanks area, and Anchorage isobscured by the clouds to the south.The open water on the left (on the back cover)is the Bering Straight, separating Alaska fromRussia, with St. Lawrence Island in between. Thepeninsula to the right is the Seward Peninsula,where Nome is located. The upper right on thefront cover is the Arctic Ocean coastline, with seaice connecting from Barrow to Kaktovik. Canadastretches to the upper right.This is true color imagery, MODIS Bands 1, 4,3 from NASA’s Terra satellite.This image is also published on page 11 inNext-Gen Mapping, illustrating the Alaska FireService’s use of SwathViewer, a visualization tooldeveloped and used by the Geographic InformationNetwork of Alaska, in a story about the GeoWeb.Editorial Contributions<strong>Imaging</strong> <strong>Notes</strong> welcomes contributions for feature articles. We publish articles on theremote sensing industry, including applications, technology, and business. Please seeContributor’s Guidelines on www.imagingnotes.com, and email proposals toeditor@imagingnotes.com.SubscriptionsTo subscribe or renew, please go to www.imagingnotes.com, and click on ‘subscribe.’If you are a current subscriber, renew by locating your accountnumber on your address label to enter the database and update your subscription.If you cannot go online, you may write to the address below.<strong>Imaging</strong> <strong>Notes</strong> (ISSN 0896-7091) Copyright © 2007Blueline Publishing LLCP.O. Box 11569Denver, Colo. 80211303-477-5272All rights reserved. No material may be reproduced or transmitted in any form or byany means without written permission from the publisher. While every precaution is taken toensure accuracy, the publisher and the Alliance for Earth Observations cannot accept responsibilityfor the accuracy of information or for any opinions or views presented in <strong>Imaging</strong> <strong>Notes</strong>.Although trademark and copyright symbols are not used in this publication, they are honored.<strong>Imaging</strong> <strong>Notes</strong> is printed on 20% recycled (10% post-consumer waste) paper. Allinks used contain a percentage of soy base. Our printer meets or exceeds all federalResource Conservation Recovery Act (RCRA) Standards.4imaging notes // fall 2007 // www.imagingnotes.com
finding features in yourimagery just got easier.ENVIFeature Extraction ModuleThe new ENVI Feature Extraction Modulecombines an easy to use interface with powerfultools to help you find features of interest in yourimagery. A new preview window provides instantfeedback. Intuitive workflows get you up tospeed quickly. And, advanced algorithms giveyou consistent results you can trust.We know software. We know the science.Learn more at www.ittvis.com/ENVI.imaging notes // fall 2007 // www.imagingnotes.com5Sensing & Surveillance • Communications • Space • Advanced Engineering & Integrated ServicesITT, the Engineered Blocks, and “Engineered for life” are registered trademarks of ITT Manufacturing Enterprises, Inc., and are used under license. ©2007, ITT Corporation.
No Borders: A New PerspectiveWhat Will It Take To Save the Planet?Publisher’s letterNew satellites are going upcontinually all over the world. In this issue, wecover DigitalGlobe’s WorldView-1launch from Sept. 18. At aboutthe same time, in China, CBERS2B was launched as part of theChina-Brazil satellite program. Ourcolumn Policy Watch discussesthe latest with China’s EO systems.This summer, <strong>Imaging</strong> <strong>Notes</strong> was veryinvolved in bringing you The 5th InternationalSymposium on Digital Earth. We havepublished several articles on that meeting,and we conclude with an excellent summaryby Rod Franklin, which appeared in ourSeptember eNewsletter (www.imagingnotes.com, eNews). Rod has captured well theessence of this global gathering, which “wasa convocation of some enigmatic color…Talks by specialists in human consciousnesswere juxtaposed with speeches fromdata modeling experts. This merging of theincorporeal with the practical was one wayof acknowledging the event’s weighty underlyingthemes: climate change, sustainability,and the onus of intergenerational stewardshipfor the welfare of planet Earth.”As Rod indicates, long-term sustainabilityof the planet emerged as the overridingtheme. Patrick Cusick from Daily PlanetMedia was there from Bangkok, and isnow gathering signatures in support of theU.N. Earth Charter. The charter was writtenand approved by the U.N. Earth CharterCommission, empowering the U.N. SecurityCouncil to implement a binding treaty thatrequires all countries to reduce substantiallytheir human-made carbon emissions.Incorporated into the Earth Charter are fourmain principles: respect and care for all life,ecological integrity, social and economicjustice, and democracy and peace. Tosupport this charter, go to our home page.Ed Mitchell, Apollo 14 astronaut and4th man to walk on the moon, embodiedthis theme when he talked about seeing theEarth from space. Coming “home,” he knewthat the beautiful blue world to which he wasreturning is part of a living system, harmoniousand whole—and that we all participate ina universe of consciousness.That sheer beauty of the Earth from spaceis astounding and transforming. The view—theone with brilliant deep turquoise andaquas—has no borders and no boundariescreating separations. Seeing and understandingthe planet without the borders anddividers, without nationalistic or capitalisticinterests, may be the only way that we cancome together to work for the future of theplanet. This is why the work of the U.N. andsimilar organizations is so important.In order to continue receiving themagazine, you must renew/verify yoursubscription annually at www.imagingnotes.com. If you are getting your own copy of<strong>Imaging</strong> <strong>Notes</strong>, you will need the codes onyour address label to renew.Finally, we would like to acknowledge andapologize for an error in the image appearingon pages 24-25 of the Summer issue. Thisimage of the Kalma Camp in Darfur fromGoogle Earth erroneously included a superimposedinset photo. This image has beencorrected on our website and has alwaysbeen correct on Google Earth.This magazine is for you, so talk to us!— Myrna James YooLetters to the Editor<strong>Imaging</strong> <strong>Notes</strong> is an excellent source forcurrent uses and developing trends ingeospatial data.—Walter Payne , ISR Advocate & Analyst,USSTRATCOM<strong>Imaging</strong> <strong>Notes</strong>, long relevant, is becomingan imperative source for anyone remotelyinterested in the Earth and our relationshipto it. To refuse the opportunity of such a freesubscription is to be oblivious to the worldaround us.—Paolo Greer, Owner, CaravayaI was not aware of all of the informationavailable from Google Earth until I read yourpast issue. Digital analysis is certainly cominginto its own and supplying a tremendousamount of information for the managementof crop irrigation systems and fertility ofcrops. Your magazine is a tremendous sourceof information for me. My specialty is mineralnutrition (iron) of plants.-Dr. Emil Pierson, CEO/Owner,Professional Growers Inc.<strong>Imaging</strong> <strong>Notes</strong> gets better and better. Vol.22(2) was chock full of information of valuefor my class in Remote Sensing, especially thearticles on orbital debris, climate change andGoogle Earth.-Ron Ryder, PhD, Professor, Universityof South Alabama<strong>Imaging</strong> <strong>Notes</strong> is helping to fulfill thedreams that Earth, botanical, zoologicaland meteorological scientists have had forthe past two hundred years. Your magazineprovides excellent information on the stateof the art, the progressive refinement andthe ever-expanding uses of satellite imagingof the Earth’s surface and lower atmosphere.Thanks for your efforts in bringing these tous, for your significant input to the coordinationof like-minded entities throughout theworld and for addressing obvious concerns tothe world forum.Sign up for our monthly eNews!Sign in at www.imagingnotes.com using the password on your address label. Click on“subscribe” to update your information and add your email address.-Dr. Dudley Seifert, ConsultingGeophysicistimaging notes // fall 2007 // www.imagingnotes.com7
ChinaAn Emerging Earth Observations GiantPolicy watchAs is true for many readersof this magazine, my work occasionallytakes me to interesting places in theworld. This year, as an external facultymember of the International SpaceUniversity (Strasbourg, France), I hadthe opportunity to spend a month inBeijing, China, teaching in this year’sSummer Session Program, held atBeihang University of Aeronautics andAstronautics.This experience gave me the chanceto visit various organizations and individualsin Beijing whose work is devotedRay A. Williamson, PhDis <strong>Imaging</strong> <strong>Notes</strong> editor, research professorin the Space Policy Institute of The GeorgeWashington University and ExecutiveDirector of the Secure World Foundation.1to Earth observations research anddevelopment. That experience was a realeye-opener! Not only is China developinga wide variety of new Earth observationsatellites, but it also has an extensiveresearch and applications agenda.China’s plans for a lunar mission havegarnered all the press, especially in theWest, but in my view the real story is inChina’s drive to develop Earth observationsfor practical problems of society.China will be pouring billions of yuan (7.5yuan to the dollar) into Earth observationsdata collection and services over the nextfive years. This could place the country inthe top tier of remote sensing countries.While in Beijing, I was especiallyprivileged to visit the new officesof CRESDA, the China Center forResources Satellite Data and Application,which operates the China-BrazilEarth Resources Satellite (CBERS). Thisfacility hosts one of the three downlinkstations in China for CBERS and also forseveral other satellite systems. CRESDAis the organization responsible for satellitesystem construction and operation,data distribution and applications, andcollation of China’s user requirements forany future planned CBERS systems.Guo Jianning, the center director,pointed out that CRESDA, like the U.S.Geological Survey office in Sioux Falls,North Dakota, is specifically set up toserve the data needs for all of China andof neighboring countries. Previously,some users complained that they werenot able to obtain data readily becausethe relevant agencies were reluctant toshare them with a different ministry. Thisarrangement will correct that problem.After an initial experiment withcharging a small amount for data,during which data sales were very low,China and Brazil now distribute lightlyprocessed (Level 2) CBERS data toChinese and Brazilian users at no cost.Now, just as happened in the UnitedStates when USGS drastically loweredthe price of Landsat data in the 1990s,demand has shot up. Although the initialdata from CBERS-1&2 were of relativelylow quality, Chinese officials are satisfiedthat they have ironed out many of thecreases in data quality and now producedata of reasonable quality for mostapplications.By the time you read this, CBERS-2b,the next stage in the China-Brazilpartnership, will have lifted into orbit,carrying both an improved version of thestandard 20-m multispectral sensor onboard earlier versions, and also a pointable4-m panchromatic sensor, signalingthe partnership’s intent to enter the realmof higher resolution data collection.CBERS-3 and CBERS-4 will followin 2008 and 2010 with several newpanchromatic and multispectral sensors,and in March 2008, China plans tolaunch three additional small Earthsatellites. Termed the HJ-1A, B and C,these satellites will test the scientificand operational capabilities of newlydeveloped hyperspectral, infrared, andsynthetic aperture radar sensors.CRESDA also reports having madesignificant progress in processing dataand in establishing a long-term archivethat will enable China to follow environmentaland other trends over the years. Asa sign of its maturity in processing satellitedata, CRESDA has developed its ownprocessing system to replace the agingproprietary Hughes system that it boughtfrom the United States some years ago.8imaging notes // fall 2007 // www.imagingnotes.com
Figure 1Central part of Brazil, near the border of theAmazonia region (north in image). Dark redis forest; green and grey are bare soil andcropped areas (mainly soybean); bright red inthe center of the image is the forest once cut,which is now regenerating. Image acquiredJuly 14, 2007, by and courtesy of CCD/CBERS-2(High Resolution <strong>Imaging</strong> Camera).I also visited the brand new officesof the China Academy of SciencesCenter on Earth Observations andDigital Earth (CEODE). Led by Dr.Guo Huadong, one of the originatorsof the Digital Earth concept, this officeconsolidates several functions originallymanaged in other institutions. After itsofficial opening in the fall, CEODE willmanage three ground receiving stationsfrom its Satellite Remote SensingCenter, an Airborne Remote Sensing2Figure 2CBERS-2B satellite being integrated and testedat Laboratory for Integration and Testing,at the National Institute for Space Research(INPE), in Sao Jose dos Campos, Brazil. CBERS-2B is inside a radio-frequency anechoicchamber for electromagnetic tests beforebeing sent back to China for launching, whichwas Sept. 19.Center, a Spatial Data Center, and theLaboratory of Digital Earth Sciences.Originally established in 1985, theSatellite Remote Sensing Centerreceives data from 16 foreign satellites,including Landsat, SPOT, Radarsat-1and Envisat.In another high point of my visit, Imet with faculty members in the Instituteof Remote Sensing and GIS at PekingUniversity in order to discuss potentialcooperative activities. This institute isone of the premier university-basedremote sensing institutions in China,and the faculty members there indicatedintense interest in establishing cooperativeprograms with U.S. universities.Finally, I also visited the NationalSatellite Meteorological Center of theChina Meteorological Administration,which operates China’s geosynchronousand polar-orbiting satellites. Here, too,were signs of a considerable drive tobuild newer, more capable satellitesystems, including a new geo-birdcapable of sampling fast-moving stormsystems with high temporal resolution.As one illustration of the maturityof its Earth observations program andthe confidence Chinese officials havein their ability to deliver data to countriesin need, in May, China joined theInternational Charter: Space and NaturalDisasters, a loose-knit organization toprovide data rapidly to disaster-affectedareas around the world.Overall, I found that officials in all thecenters I visited were very interestedin engaging in cooperative activitieswith organizations around the world.CRESDA, in particular, made a specificpoint of emphasizing that it now cooperateswith many of China’s surroundingcountries, supplying data on the samefree terms it extends to China’s ministries.CRESDA officials have traveledto countries in Africa, South America,Australia, and Canada in an effort to findcooperative partners.Because of these efforts, Chinais fast becoming one of the premiercountries in applying Earth observationsto practical problems and is reachingout around the world to find mutuallybeneficial partnerships.imaging notes // fall 2007 // www.imagingnotes.com9
GeoWeb2007The State of Spatial Data InfrastructureNext-gen mappingCraig Bachmann & Natasha LÉgerare partners in ITF Advisors, LLC, anindependent consulting firm with a focuson next-generation strategy and ontranslating the increasingly complex newmedia business environment’s impact onbusiness models, markets and users.Editor’s Note<strong>Imaging</strong> <strong>Notes</strong> brought you the 5thInternational Symposium on Digital Earthin June (www.isde5.org), a gatheringsimilar to the GeoWeb Conference(www.geoweb2007.org). An overview ofThe Digital Earth Symposium is in ourSeptember eNewsletter online.Geospatial web-basedinfrastructure, or the GeoWeb as it is knowntoday, created by the ability to exchangecomplex geodata through such standardsas GML (Geographic Markup Language) 1and KML (Keyhole Markup Language), 2is a game changer in the way geodataare consumed, analyzed, visualized, anddistributed. The second annual GeoWebConference, held in Vancouver July 25-27,2007, is a testament to this change. Galdos,a middleware company for next-generationGIS, teamed up with GITA (GeospatialInformation Technology Association) toco-host GeoWeb2007.12Ron Lake, CEO of Galdos and developerof GML, has a vision for powering theGeoWeb; Henry Rosales, Deputy ExecutiveDirector of GITA, says that GITA membersare looking for faster web-based solutionsto infrastructure (water, utilities, telecommunications,roads, transportation, etc.)operational issues. Together they attractedapproximately 200 decision makers fromaround the world, including such industryleaders as Jack Dangermond, Founder andPresident of ESRI; Vint Cerf, Vice Presidentand Chief Internet Evangelist for Google;Michael Jones, CTO of Google Earth;and Vincent Tao, Director Local Searchand Virtual Earth of Microsoft, to discussthe vision of web-enabled GIS and I/RS(<strong>Imaging</strong>/Remote Sensing).This was first and foremost a softwaretechnology conference with a focus onnew consumer and business applications.Beyond the now traditional 2D web presentation,there were innovations such as multimediaintegration of applications and videointo a 3D spatial landscape. Leica GeosystemsGeospatial <strong>Imaging</strong> demonstrated thepower of multi-media in geospatial sharingthrough Leica TITAN, an online data-sharingsolution including a Geospatial InstantMessenger (GeoIM) and a 3D MyWorld.Amy Zeller, Visualization Product Managerfor Leica Geosystems, describes the GeoIMas “a geospatial data bridge” that enablesusers (including government and commercialdata providers, GIS data clearinghouses,and city, county, state and federal agencies)to access data from other users’ geospatialdata shares into any application such asArcMap, uDig, or Google Earth, and tocommunicate real-time in Leica TITAN’s 3Donline world environment.Where the GeoIM provides other userswith access to your data, the Leica TITAN10imaging notes // fall 2007 // www.imagingnotes.com
Figure 1Leica Geospatial Instant Messenger. This is theprimary communication protocol to chat, discover,<strong>download</strong> and retrieve geospatial dataand web services from Leica. It allows users topublish geospatial data and web services forothers to access and retrieve.Figure 2Leica TITAN Client - 3D MyWorld is a free webbasedapplication based on a 3D Digital Earth.It enables a global network of users to visualize,share and discover data interactively. Thebase imagery in the client is streamed fromGlobeXplorer.Figure 3Image of Alaska on June 29, 2004. Massive smokeplumes cover Alaska from fires that burned over6.5 million acres. True color imagery MODIS Bands1, 4, 3 from NASA’s Terra satellite. This image alsoappears on the cover of this issue. 3client allows users simply to present theirgeospatial profile, including location-basedcontent, to others in a 3D MyWorld. Figure 1illustrates the seamless communicationenabled between users with the GeoIMand the ability to access datasets sharedby others. The 3D globe rotates to allowothers to see your profile, includinggeospatial data and content such ascamera feeds, screenshots and ancillaryinformation. Figure 2 illustrates how userscan rotate the 3D globe to switch amongother users’ 3D MyWorlds.I/RS was a backdrop to many ofthese new applications. In other words,the I/RS image increased in value andinformation to the user based on thenumber of attributes overlaid onto thatimage. Some call this ‘layering,’ or inthe Web2.0 world—the ‘spatial mashup.’Traditionally, structured data is overlaidon images such as census data, weatherdata, or economic data. Now, with suchjava script extensions as GreaseMonkeyand such geotagging software as Meta-Carta, unstructured information can beeasily turned into structured information,and customized maps can be generatedon the web.‘Expressive mapping,’ coined byMansoud Raad, Senior Architect forESRI ArcWeb Services, is the futureof analyzing and interpreting data. Mr.Raad demonstrated several examplesof expressive mapping, including aninteractive book that provides an overlayof more information with each page turn,a multi-media map that incorporatessound and video into the map, and theability to map unstructured data such asnews events to determine a pattern ofbehavior, for example among extremistsand terrorists. Expressive mapping takesvisualizing data, whether it’s business,political, social, or environmental, to anentirely different level. With expressivemapping, the user determines the relevantinputs and the visual presentation.In the midst of Web 2.0 vendors, thesurprising innovation in I/RS came from theUniversity of Alaska, Fairbanks (UAF). UAF isthe only arctic university in the United Statesand supports over 40 research institutes andcenters that focus on issues affecting theArctic Region. A clearinghouse was neededto manage the volumes of geospatial data,in particular I/RS data, consumed by theseresearch centers. Software applications didnot exist to address the problem of viewingimagery that crosses the dateline or thatincludes the North Pole. UAF set out to solvetwo problems: cataloging all their remotesensing data and then providing a serviceenabling users to select geographically andto browse visually the imagery intersectingtheir search region through an interactivebrowser-based tool. SwathViewer is theimaging notes // fall 2007 // www.imagingnotes.com11
Figure 4The MacKenzie River is the longest river in Canada, covering adistance of 1,470 km. The river originates at the Great Slave Lake inthe Northwest Territories and flows north to the Arctic Ocean. Theimage taken by Terra satellite clearly shows the turbid (green tobrown) freshwater runoff into the blue Arctic Ocean waters.visualization tool that emerged and was developedby the Geographic Information Networkof Alaska (GINA) to improve polar research.SwathViewer provides near real-timeimages of 50-60 polar orbiting satellitepasses a day, compared to a six-to-eight hourdelay if visiting NASA or NOAA sites. Thisadvantage became particularly critical to theAlaska Fire Service, Bureau of Land Management,as they were fighting forest fires in2004, when forest fires burned 6,523,182acres across Alaska. The smoke was so thickthat aircraft were unable to launch, becausethere was no runway capable of recoveringthe aircraft that was not completely socked inwith smoke. A satellite orbits the earth aboutevery 90 to 100 minutes, and with opticalI/R, can see fire, clouds and smoke. Massivesmoke plumes can be seen over Alaska inFigure 3 on page 11. With SwathViewer,the Alaska Fire Service was able to browseimagery to monitor fire conditions until thesmoke cleared sufficiently to allow aircraftoperations to resume two days later.UAF is able to provide real-time databecause it has its own ground stations toreceive the satellite feeds. “What differentiatesSwathViewer from other web-basedmapping tools is that we are first to get theimagery because of our ground stations, weare first to enhance the imagery, and we arefirst in making it available to users through aweb-based lightweight viewer,” said KevinEngle, Research Programmer and GroundStation Engineer for GINA. SwathViewerautomatically enhances the imagery tocorrect brightness and contrast variations,producing incredible images. The Swath-Viewer datasets are focused on Alaskaand the polar region, but are not limited toviewing only Alaska. Figure 4 illustrates thefreshwater runoff from the MacKenzie Riverin Canada into the blue Arctic Ocean waters.Global datasets are available online or youcan add your own by pointing SwathViewerat a web mapping service (WMS) of yourchoice. “As a publicly funded institution,UAF would like to make SwathViewer morebroadly available to the public and is lookingfor a partner to help commercialize it andmeet that objective,” said Diane McLean,University of Alaska IP Director.The GeoWeb Conference presentedmany tools and few strategic questions.Web 2.0, in its infancy, has found advertisingas a means of funding a number of toolsthat don’t seem to solve a clear problem.4Next-Gen IntegrationThe web-based geospatial datainfrastructure is here. Is the enterpriseready for it? Web 2.0 and the GeoWebpresent a challenge for traditionalenterprises and organizations thatseek to control the flow of informationboth internally and externally, and tocontrol the tools used by employees.Susan Ancel, General Manager, NetworkServices and Operations for EPCORWater Services and past President ofGITA, acknowledged this tension in herclosing remarks and left attendees withthe following strategic question: “Howdoes an enterprise integrate the new,innovative, off-the-shelf geospatialconsumer applications such asGoogleEarth and Microsoft Virtual Earthwith legacy enterprise GIS systems?”Instead, the problem to be solved appearsto materialize once people have access tonew tools. As long as land and water, laborand capital remain factors of production andare fundamental to food, shelter, and safety,a map is a fundamental organizing principle.The GeoWeb, including Digital Earth,presents an unprecedented opportunity tointegrate volumes of data into meaningfulpresentations that improve decision making.Information and the ability to make better andfaster decisions is the competitive advantageof the future.Endnotes1. The OpenGIS Geography Markup Language(GML) Encoding Specification is an XMLencoding for the modeling, transport andstorage of geographic information, includingthe spatial and non-spatial properties ofgeographic features.2. KML is a file format used to display geographicdata in an Earth browser, such asGoogle Earth, Google Maps, and Google Mapsfor Mobile. KML uses a tag-based structurewith nested elements and attributes and isbased on the XML standard.12imaging notes // fall 2007 // www.imagingnotes.com
Planet Action7 projects already labelled5 projects under reviewPlanet Action is an open initiative launchedmid-2007 that supports projects related toclimate change.Getty imagesThe Planet Action purpose is threefold:support projects originating in scientific orcivilian communities worldwide,set up an open internet platform to providethese projects with extensive visibility andcollaboration tools,promote these projects as a vehicle foreducational programs and communicationoutreach.imaging notes // fall 2007 // www.imagingnotes.comSo far, seven projects are supported byPlanet Action in Brazil (2), Guadeloupe, Iceland,Ivory Coast, Madagascar, Mongolia. Five projectsare currently under review in Africa, Asia andSouth America.Become a partnerwww.planet-action.orgAn initiative from13
Summertime...and the Carbon is GrowingEarth ScopeWith due respect to Mr.Gershwin, more than cotton is growingthis summertime. For the summer months,with families on vacation, we can assumethat most of us, including members ofTimothy W. Foresman, PhDis President of the International Centrefor Remote Sensing Education. Hehas been director of United NationsEnvironment Programme’s Division ofEarly Warning and Assessment (Nairobi,Kenya) and national program managerfor NASA’s Digital Earth (Washington,D.C.). He is editor of The History ofGeographic Information Systems, 1998,Prentice Hall. Dr. Foresman wasthe Director-General for the 5thInternational Symposium on Digital Earth(www.isde5.org).Congress, have been enjoying some timeoff to recreate in the remaining warmdays. But as summer winds down, it’stime for all of us to demonstrate moreawareness of the comprehensive natureof our planetary system, and to attend toour energy and security future as Earth’ssystems continue to behave strangely. Theheat goes on and the carbon dioxide andother greenhouse gases increase theirvolumetric share of our finite atmosphere.But some people are paying attention.Through campaigns such as thisyear’s Live Earth world concerts, rockstars and environmental celebrities likeAl Gore are pushing more infotainmentawareness of the risks we are facingfrom climate change. One responseto these media actions is an increasein the number of people seeking toclean up their carbon footprints, wipetheir environmental slates clean, andlive a carbon-neutralized lifestyle. This,however, is not as easy as it looks.We take a lot for granted in ourdaily professional and personal lives.Even if we walk to the train station, eatwatercress sandwiches, and maintainour compost piles, we are still responsiblefor carbon emissions that continueto blanket the Earth’s atmosphereand raise the global thermostat. Formany folks, the path away from thiscarbon-based dilemma is through theabsolution of our sins via carbon offsetsor carbon credits. Guilt can be cleansedaway with a simple checkoff for carbonoffsets with your next airline trip toMachu Picchu or Cancun.A growing set of carbon offsetbrokers are populating the web usingthe ‘voluntary’ method that enablesgood citizens to pay off the carbondebits associated with their lifestyles.Prices currently range from $1 to $100per ton for your carbon offsets. On the‘regulated’ market, the rates are alsovariable but more easily determined andmonitored by agencies like the ChicagoClimate Exchange (www.climateex.com) in the U.S. and others related tothe Kyoto Protocols for Europe, Canada,Japan, and Australia. These are interestingtimes for the carbon markets—agrowing phenomenon—with importantconsequences for the environment, forthe economy, and for social dimensionat village and city level.Carbon offsets typically use moneypaid to the carbon brokerage firm toinvest in activities that will help reducecarbon emissions into the atmosphere—projects that would otherwise not befunded. Activities such as planting trees(both afforestation and reforestation)and financing renewable energy projectsare most commonly documentedfor the carbon offset funds. And this iswhere the remote sensing world comeson stage.It turns out, after some seriousinvestigation, that the remote sensingcommunity has not settled the issueof whether we can effectively andefficiently map, monitor, model, andmanage carbon offset projects andprograms. After a decade or so, ouraugust and learned international remotesensing community has not defined thestate-of-practice for applying carbonmonitoring science to the nascent regulatoryand certification structures forthe carbon market. We lack standards.There are a curious few remote sensingscientists who have been making claimsthat only their unique capacity and14imaging notes // fall 2007 // www.imagingnotes.com
Figure 1The Carbon Offset Kit is an educational tool available to help people understand these concepts.license-protected methodologies can understand how to locate and measuremeasure and calibrate carbon on the the carbon in our county, our states, andsurface of the planet.anywhere Google Earth will take us?Thirty-five years after the ERTS 1 Right now, you may be surprised tolaunch in July 1972, this situation seems learn that the carbon market is growingincreasingly peculiar. The educated without the benefit of fundamental calibration/validation(Cal/Val) methodolo-layperson might ask what we knowabout mapping and monitoring carbon? gies. The reader is invited to investigateWhy have billions of dollars been fully the status of the Kyoto Protocolinvested in our community and careers if CDM (Clean Development Mechanism)we cannot seem to answer this question at http://cdm.unfccc.int for the state-ofpracticeas it is currently known by thein a forthright and understandablemanner? If we can understand how policy makers.crooks on television shows like CSI are My first scientific paper in thecaught and incarcerated by a speck of late 1970s documented the abilitydust at a crime scene, why can we not to measure the biomass of kelp1(Macrocystis pyrifera) off the waters ofSouthern California using Landsat data,a methodology that yielded an accuracywhich rivaled Dr. Wheeler North’s standardsusing aerial infrared photographicsurveys. Professor Jack Estes, ofUniversity of California, Santa Barbara,created accurate phenological profilesfor remote sensing of agricultural cropsin the early 1970s, as did teams led byProfessors John Jensen in South Carolina,Chris Johansen at LARS/Purdue,Kevin Price at Kansas, and Jim Tuckerat Goddard. It is a bit embarrassingthat the remote sensing community oftalented geospatial specialists appearsto be lagging far behind on the issue ofcarbon monitoring—especially at a timewhen we collectively need to focus onreal programs that will help combine thefinancial markets with our industry andhelp drive down the carbon emissions,regardless of the particular pathway orprogram chosen.As the carbon market grows, cleverand enterprising people will begin toaddress the issue of Cal/Val. Perhapsthe infusion of capital will stimulate arenaissance period for remote sensing.It would be a good tribute to theremote sensing community if a groupof practical-minded scientists andengineers could present a clear pathwayregarding carbon monitoring for vegetativebiomass for both the regulated andvolunteer carbon markets. Along theway, they could send a note to NASAand Congress.The challenges are certainly outthere. The opportunities are certainlyout there. Perhaps we will soon witnessremote sensing-based solutions for thecarbon offset market out there as well.imaging notes // fall 2007 // www.imagingnotes.com15
WorldView-1LaunchHalf-meter Imagery Coming mid-OctoberThe Sept. 18 launch of DigitalGlobe’s next-generationWorldView-1 satellite from Vandenberg Air Force Base rocketed the Coloradocompany’s status as a world leader in the capture of high resolution Earth imagery toa new height. The deployment was the first of two launches that have been planneda year apart as part of a campaign to maintain simultaneously three high-resolutionDigitalGlobe imaging birds in Low Earth Orbit.Equipped with ITT Corporation’s .5-meter resolution panchromatic sensors,WorldView-1 will be capable of collecting up to 750,000 square kilometers of imagesper day, with a revisit time of 1.7 days. The bulk of its capacity has been reserved by theNational Geospatial-Intelligence Agency (NGA) for use in its NextView national securityprogram, but most of these detailed images also will be available commerciallyfrom the DigitalGlobe ImageLibrary.WorldView-1 joins the company’s currentorbiting satellite, QuickBird, at a timewhen the commercial demand for highresolutionEarth imagery is beginningto generate some real mass. Launched inOctober of 2001, Quickbird, at .6-meterpanchromatic and 2.4-meter multispectralresolutions, will now be free to taskfor the commercial market. Still, DigitalGlobewill not reach the apogee of itscorporate objective—a daily collection capacityof one million square kilometers—until it shoots its second next-generationvessel, WorldView-2, into space late nextyear. That privately-underwritten satellitewill be able to image in eight multispectralbands at 1.8 meters.Quickbird has remained the world’shighest-resolution imaging satellite sinceits debut six years ago. Yet its capabilitieswill be surpassed next year when GeoEyeRod FranklinReporterDenver, Colo.(Dulles, Va.) positions its own next-generationbird in the heavens. GeoEye-1 willbe fitted with 1.65-meter multispectralhardware, and, like WorldView-1, it willdedicate its tasks mostly to the NGA nationalsecurity contract. Mark Brender ofGeoEye stated, “This launch is importantnot only to DigitalGlobe but for our entireindustry. Both commercial remote sensingcompanies must succeed in launchingnext-generation imaging systems, and weare next up with the launch of GeoEye-1in the first part of 2008.”So market forces continue to choreographthe competitive dance of 21st Centuryimaging from the near reaches ofspace. Ultimately, though, the projectedlife of a satellite and technology’s arrivalat the lowest common denominator ofpracticable resolution appear to trumpthe efforts of one vendor to outrace hiscompetitor to the next milestone. A casein point is DigitalGlobe, whose constellationof three satellites may be short-lived,considering that QuickBird’s operationallifespan is not expected to last beyond2009. It is factors like this that tend to levelthe playing field to a less variable grade.Geobrowser suppliers, software developersand any number of other originalequipment manufacturers are continuingto seed the commercial demand for Earthimagery to a degree that renders almostacademic the debate over who can claimtitle to being the lead supplier.This kind of reality does nothing todiminish the mollifying beauty of a pristinelaunch. WorldView-1 is the secondcommercial bird to enter orbit on a BoeingDelta 2 rocket under the auspices ofthe United Launch Alliance, a joint venturebetween Boeing and Lockheed Martin.Built by Ball Aerospace & TechnologiesCorporation (Broomfield, Colo.), thesatellite blasted toward the ionosphere at11:35 a.m. PDT on Sept. 18 in an orangeexplosion of liquid oxygen, carrying itspayload of 2,500 kilograms. There wereno adverse events.The craft reached Mach 1 and jettisonedthe first of its solid propellants, andthen its airlift solids. At 4:20 minutes, itsmain engines cut off, and following second-stageseparation, its protective faringseparated and sloughed off. It jettisonedmore solid motors under normal disturbance.At 50 nautical miles it approached8,200 miles per hour. Its main engine cutoffat the ionosphere exploded in a starburst,followed by another explosion withthe second stage ignition and additionalpropellant jettisoning. After several minutes,WorldView-1 had reached a speed in16imaging notes // fall 2007 // www.imagingnotes.com
Figure 1Boeing Delta 2 rocket with WorldView-1 satelliteon board shoots skyward on Sept. 18.excess of 13,000 miles per hour as it approachedits rendezvous with a targeted496-kilometer sun-synchronous orbit.Though American and Europeanvendors appear to jockey tirelessly formarket position, a point of diminishingreturn for image resolution does existfrom technical and legal perspectives.Both panchromatic and multispectral imageryhave secure places reserved in thescheme of national security objectives,and according to Chuck Herring, Digital-Globe’s Director of Corporate Communications,the half-meter benchmark is asclose as any modern sensor needs to see,as a practical consideration.“The resolution of .5 meters is the bestwe can provide to commercial customers,”he said in a recent communication.“So for the foreseeable future, we plan tohave our satellites provide the half-meterresolution imagery. If you have your satelliteprovide higher resolution, you collectless imagery.”Moreover, security-driven governmentrestrictions prevent commercial suppliersand buyers from entering this realm. If acompany did improve its resolution to aquarter meter, Herring said, it would haveto resample the imagery to half meter forevery non-governmental buyer.But WorldView-1 is more than justhawk-eyed. It is also the most nimbleimaging satellite ever launched. The birdsports state-of-the-art geolocation accuracy,stunning agility and in-track stereocollection. Herring explained that thelatter two features allow WorldView-1 tocollect its tasked images with a minimumof flyovers. “Many customers need tohave several point targets within an areacollected,” he said. “With current generationsatellites, this may take severalpasses. With Worldview-1, we are able tocollect five to ten times more point targetsbecause the satellite is so agile and we areable to point at rapid rates.”First images are due back in mid-October.Herring would not say whether Digital-Globe has struck any large commercialdeals with major customers such as Googleoutside of the NGA contract, but did acknowledgethat “they are always interestedin more capabilities and capacity.”All else being equal, WorldView-1’slaunch marks, at minimum, the arrival ofgeospatial data collection at state-of-theart metrics for applications in the mappingand monitoring markets.imaging notes // fall 2007 // www.imagingnotes.com17
SatellitesStudentsHigh School Standouts Earn Thacher Scholars AwardsRachael Born of Norfolk, Va., and Scott Elder of Chino Hills, Calif., were2007 recipients of the Thacher Scholars Awards, a secondary-school competitionthat challenges students to design and conduct exemplary projectsinvolving satellite observations of the Earth. The competition is held annually by theInstitute for Global Environmental Strategies (IGES) in an effort to engage the nextgeneration of scientists in the use of geospatial technology to study the environment."With so many environmental challenges facing our world, it is important thatyoung scholars are engaged in science and technology projects to better understand theplanet,” said Theresa Schwerin, IGES associate director for education. “Rachael andScott best exemplified the spirit of this competition and demonstrated thoughtful usesof remote sensing. We hope they will pursue careers in science and technology."The Thacher Scholars Award was founded in honor of the late Peter S. Thacher,a former IGES board member. Thacher was an internationally recognized leader inpromoting the use of satellite remote sensing. He served as deputy director of theUnited Nations Environment Program, as an advisor to NASA and, until the timeof his death in 1999, as president of the Earth Council Foundation-U.S.A major goal of the award is to introduce students to the numerous uses of satelliteobservations in Earth science research, ranging from climate prediction to archaeology.Entries were judged based on scientific and technical accuracy; creativity andoriginality; quality of presentation; thoroughness of research, methods and procedures;and quality of conclusions.Rachael BornSCOTT ELDERRachael BornBorn, who will be a 12th-grader thisfall at Norfolk Technical Center, earnedthe first-place award of $2,000 with herproject titled, “The Chesapeake Bay — ANational Treasure in Decline.” Born correlatedthe amount of rainfall within theChesapeake Bay watershed with the healthof the bay and its ecosystem. She used riverdischarge data, satellite images showingchlorophyll concentrations, and measurementsof dissolved oxygen in her research.The Chesapeake Bay is the nation’slargest estuary. Its watershed spans sixstates and the District of Columbia.Pollutants enter the bay through the approximately150 rivers and streams thatfeed into it. Increased nutrient runoffcan trigger large blooms of phytoplankton(microscopic algae) that may haveharmful effects on marine ecosystems.At first, the algae can block sunlightfrom penetrating into the water. Withoutsunlight, underwater plants are unable toperform photosynthesis and eventually die.Later, when the algae die, their decomposi-Dan StillmanScience Communications ManagerInstitute for Global EnvironmentalStrategiesArlington, Va.http://www.strategies.org/ThacherScholars18imaging notes // fall 2007 // www.imagingnotes.com
tion depletes the water of dissolved oxygen.Fish and other aquatic animals depend onoxygen and on the habitats provided bysubmerged vegetation for survival.An assessment released in April by theChesapeake Bay Program found that mostof the bay’s waters were “degraded,” itshabitats at risk, and its fish and shellfishpopulations below historic levels, despitemore than 20 years of restoration efforts.“The first thing that you notice aftermoving from a Midwestern state toNorfolk, at least in elementary school,is that there is water everywhere,” saidBorn, who was a third-grader when shemoved to Virginia from Indiana. “Unlikeeveryone else, who just seemed to take itfor granted, I learned as much as I couldabout the beach and water.”To test her hypothesis that increasedrainfall, which typically results in morenutrients carried into the bay, is relatedto poor water health, Born examinedimages of chlorophyll concentrationsand dissolved oxygen levels for years inwhich river discharge into the bay wasunusually low or high. Estimates ofchlorophyll concentrations are derivedFigure 1SeaWiFS Chlorophyll Concentrationfrom observations of ocean color byNASA’s Sea-viewing Wide Field-of-viewSensor (SeaWiFS). The greener the water,the more phytoplankton and, thus,chlorophyll there is. See Figure 1.Born’s findings largely supportedher hypothesis, and her success in thecompetition has inspired her to considerscience as a possible career.“While I have always loved science,winning this award has reaffirmed myinterests in science research,” said Born,who plans to attend a summer workshopin atmospheric, Earth and space sciencesat the University of Wisconsin. “WhileI am still very undecided about what Iwant to do with my life, this award hasmotivated me to look at what science programscolleges offer.”Scott ElderElder, who will enter the 12th grade thisfall at Chino Hills High School, garneredthe second-place prize of $1,000 with“Tracking Storms in the Ionosphere.”Solar activity triggers storms in theionosphere, which can delay Global PositioningSystem signals. Elder showedthat GPS altitude measurement errors(caused by the signal delay) can be usedto track these storms. Predicting solarstorms is critical because of their potentialto disrupt power grids and satellitecommunications, and to injure astronautstraveling through space.A GPS receiver pinpoints the locationof the solar storm, including altitude, usingradio frequency signals transmittedby the GPS constellation of satellites.Elder conducted his study by collectingone month of daily altitude measurementswith a GPS receiver, and graphingthe altitude errors against Kp, an indexthat measures geomagnetic activity. Elderthen used images from NASA’s Solarand Heliospheric Observatory satelliteto identify the solar activity responsiblefor spikes in the Kp data.The graphs of altitude error and Kpindex were a close match, indicating acorrelation between the two.Elder first became interested inthe connection between GPS signalsand the ionosphere during the seventhgrade, when he submitted a projecton the topic to the 2003 CaliforniaState Science Fair. Later, he received a2004 President’s Environmental YouthAward for a project in which he set up alaboratory in his room to monitor pollutionin a local creek. Elder was congratulatedby President Bush at a WhiteHouse ceremony honoring the presidentialaward winners.As Elder prepares to start his senioryear in high school this fall, he's alreadythinking ahead to a possible college majorin environmental biology. “Winningthe Thacher Award showed me that I cancombine my love of satellites with theenvironment,” said Elder, who is workingthis summer with the city of ChinoHills water department on a project tomap sources of stream pollution usingGPS technology.Elder’s father, Mike, says that “beingrecognized (through the Thacher Award)...has inspired Scott to continue to advancehis use of satellite technology for studyingand protecting our environment.”imaging notes // fall 2007 // www.imagingnotes.com19
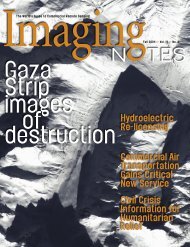
<strong>Imaging</strong>Destructionin LebanonA Perspective from Satellite Remote Sensing on the2006 Israel-Hizballah Warin Israel and Lebanon during thesummer of 2006 was an intense, technologicallycomplex, irregular conflictfought between the nation state of Israeland a terrorist organization, Hizballah.It was the first modern sustainedair campaign by a country other thanthe United States.Israel bombed over 1,000 targets duringthe 34 days of war, eventually moving30,000 Israeli Defense Force (IDF) troopsinto 16 enclaves in south Lebanon. Hizballahconducted the most intense and“conventional” military operation everundertaken by a non-state actor, launchingover 4,000 rockets and projectiles at160 Israeli settlements, towns and cities,and firing over 1,000 powerful anti-tankWilliam M. ArkinAuthor and Military AnalystSouth Pomfret, Vt.blogs.washingtonpost.com/earlywarning/Matthew G. McKinzie, PhDSenior Scientist with the Nuclear ProgramNatural Resources Defense CouncilWashington, D.C.www.nrdc.orgmissiles (mostly inside Lebanon) againstIDF ground forces. More than 950,000Lebanese fled their homes during the warand as many as 300,000 Israelis were displacedfrom northern Israel as a result ofsustained Hizballah rocket fire.During the conflict, remote sensors—particularly the commercial high-resolutionIKONOS and QuickBird sensors—captured images of destruction and wereutilized by the media, United Nationsand non-governmental human rights organizations.For <strong>Imaging</strong> <strong>Notes</strong>’ GeoIntfocus, the authors here provide an overviewof the conflict and compelling examplesof war-time satellite photographyprovided by GeoEye and DigitalGlobe.A KIDNAPPING AND ESCALATIONAt around 9:05 a.m. on Wednesday,July 12, 2006, Hizballah initiated an operationnamed “True Promise,” involvingrocket, anti-tank missile, mortar andsniper fire intended to mask a raid acrossthe international border to kidnap Israelisoldiers. In the course of the initial operation,three Israeli soldiers were killed andtwo reserve soldiers were captured. In response,Israel began retaliatory strikes onHizballah border observation posts andknown positions, resulting in an exchangeof fire between the IDF and Hizballahgunners that ensued across much of theBlue Line (the United Nations defined theBlue Line as the Lebanon/Israel borderdemarcation as it existed in 2000). Heavybombardment also occurred in the areasaround Bint Jbeil and in the Shebaa farmsarea far to the east on the Golan Heights.In pursuit of the kidnappers, IDF conventionalforces entered southern Lebanonfor the first time in six years. At about10:20 a.m., Israel initiated a wave of preplannedretaliatory air strikes in southernLebanon, initially attacking 17 Hizballahcommand posts and bases, as well as threebridges over the Litani River, the generaldemarcation between southern Lebanonand the rest of the country.The most dramatic and symbolic Israelistrike in the first 24 hours was on Beirut’sRafiq Hariri International Airport. Atabout 4:00 a.m. on July 13, aircraft placedfour 2,000-lb. laser-guided bombs withBLU-109 hard target warheads on runwayintersections to shut down airport operations.See Figure 1. An Israeli Army spokesmanstated that “the reason for the attackis that the airport is used as a central hubfor the transfer of weapons and supplies tothe Hizballah terror organization.” ActingLebanese Minister of the Interior AhmedFatfat countered that the airport attackhad nothing to do with Hizballah, butwas instead an attack against Lebanon’s“economic interests,” especially its reboundingcommercial sector and its valuablesummer tourism industry. Later, onthe evening of July 13, four Israeli attackhelicopters were back at the internationalairport, shooting air-to-surface missiles atairport fuel tanks, setting them on fire, illuminatingthe Beirut night sky.BOMBING OF THE SOUTHERN BEIRUTNEIGHBORHOODSMeanwhile, as evening approached onThursday July 13, Hizballah rockets hitthe Stella Maris neighborhood of Haifa,the most southerly location that rocketsfired from Lebanon had ever hit. Israel’sambassador to the U.S., Daniel Ayalon,immediately called the attack on Haifa“a major, major escalation.” Before Hiz-20imaging notes // fall 2007 // www.imagingnotes.com
allah struck Haifa, Israel had alreadydropped leaflets over south Beirut warningresidents to stay away from Hizballahstrongholds (translated from DeutschePress-Agentur):To the Inhabitants of LebanonDue to the terrorist activitiescarried out by Hizballah whichdestroys the effort to find a brighterfuture for Lebanon, the IsraeliArmy will continue its work withinLebanon for as long as it deems fitto protect the citizens of the Stateof Israel.For your own safety and becausewe do not wish to cause anymore civilian deaths, you are advisedto avoid all places frequentedby Hizballah. You should knowthat the continuation of terroristactivities against the State of Israelwill be considered a double-edgedsword for you and Lebanon.—The State of IsraelStrikeLocationsFuel StorageAt this point, in retaliation for Hizballahattacks on Haifa, the IDF implementedwhat its spokesmen labeled “deterrence”strikes, reaching into south Beirutto attack buildings in the main Hizballahheadquarters complex, the home of Secretary-GeneralSayyed Hassan Nasrallah,and the headquarters of Hizballah’s AlManar television. These targets are a shortdrive from swank downtown Beirut andare in the dahiye—Shi’a neighborhoodsof mostly illegal apartment blocks, whichwere, on the eve of the war, home to hundredsof thousands of Lebanon’s poorestpeople. Beirut’s southern suburbs suffereda level of damage unmatched by any otherexample of precision bombing, includingthat in the Iraq wars or Afghanistan.1Figure 1GeoEye IKONOS satellite image of Beirut’s RafiqHariri International Airport acquired on July31, 2006, with strike locations on runways,taxiways and fuel storage highlighted.imaging notes // fall 2007 // www.imagingnotes.com21
HARAT HREIK DISTRICTHARAT HREIK DISTRICT54BIR AL-ABD DISTRICT7BIR AL-ABD DISTRICT26391810AL RAWISDISTRICT2AL RAWISDISTRICT3Hizballah Targets in theSHI’A Districts of Beirut1 Hassan Nasrallah’s house2 Hizballah base3 Hizballah base4 Fadlallah center5 Hizballah base6 Hizballah HQ building complex7 Hizballah base (terrorist activities)8 Hizballah office building9 Hizballah security center10 Hizballah Al-Manar TV stationMid-war, the utter ruin of the dahiye wasdescribed by one observer: “block afterblock of extraordinary canyons of devastation...multi-story tenements collapsedor eviscerated, their domestic interiorsspilled in mountainous waves of rubbleacross the streets.” See Figures 2-3.BRIDGE STRIKES IN LEBANONDuring the 34 days of war, the IDFconducted two parallel efforts: an “airwar” involving attacks on Hizballahfixed and mobile targets (forces, rockets,movements) and Lebanese civilinfrastructure (and to some extent theFigures 2-3IKONOS images of the dahiye districts in southern Beirut: at left an image taken during the firstday of the war (acquired by IKONOS on July 12, 2006) and at right an IKONOS image acquired onAug. 8, 2006. Hizballah target annotations from: “Proof of the Location of the Hezbollah’s MilitaryInfrastructure and Operational Activities Carried Out From Within the Civilian Population (PartTwo Documentation),” pp. 61-73, supplied by the Israeli government to author William Arkin.Lebanese military), and a “groundwar” involving special operations and abelated invasion into Lebanon. For theIsraeli Air Force (IAF), the 2006 warwas the first sustained, around-theclockair campaign with more than 50percent of the missions flown at night.The small distances involved and compactLebanese geography enabled thesestrikes to be mounted not only by IAFF-15 and F-16 fighters, but also by attackhelicopters, extensively supportedby naval ship gunfire and long-rangeground-forces rocket fire. Air attackswere mounted against targets of numerouscategory types: airports, bridgesand roads; Hizballah command, militaryforces, and infrastructure; fuel depotsand gas stations; and communicationsand radar sites.Naval strikes were mostly conductedagainst targets along the Lebanesecoast and included rocket launchsites, launchers, weapons storage sites,roads, radar installations, fuel depotsand gas stations, and other Hizballah“infrastructure.” The IDF stated thatground forces carried out broad artilleryattacks against rocket launchingsites, against “squads of Hizballahterrorists,” and against structures and“strongholds” along the border.In its response to the Hizballah incursionand kidnapping on July 12, theIDF implemented pre-planned strikesagainst Lebanese bridges across theLitani River, following up daily withadditional bridge strikes in southernLebanon, eventually expanding attackson bridges into the Beirut area, the Be-22imaging notes // fall 2007 // www.imagingnotes.com
Airport Bridge, Beirut (June 19, 2006, QuickBird)Airport Bridge, Beirut (August 12, 2006, QuickBird)Habboush Bridge, Nabatiyeh Governante(August 9, 2006, QuickBird)Figure 4QuickBird images of bridges in Lebanon: Habboush Bridge (imageacquired on Aug. 9, 2006), Beirut’s Airport Bridge (before the war,acquired on June 19, 2006 and after it was struck, acquired on Aug.12, 2006), and al-Qa’qa’iyah al-Jisr Bridge (image acquired on July25, 2006), showing a curve of the Litani River.AllBridgesStruckAL-QA’QA’IYAH AL-JISR Bridge,South Lebanon Governate(July 25, 2006, QuickBird)Litani Riverkaa Valley and northern Lebanon. Theaccumulated damage included the destructionof 109 bridges and overpasses,including 16 kilometers of road sectionsin southern Lebanon. By the endof the war, 21 of the 29 bridges over theLitani River were reported damaged ordestroyed (18 in the Tyre district andthree in Marjeyoun). See Figure 4.Israel says that it attacked bridgesand transportation targets to preventthe movement and export of Israeliprisoners out of the country, to stem theflow of arms and military material toHizballah from Syria, and to interdictor prevent the movement of Hizballaharms and forces, including rockets andlaunchers within Lebanon. Eventually,the scope of these strikes foldedin all access points into Syria, both insouthern and northern Lebanon, andall internal bridges of any consequence,with the seeming general justificationthat Hizballah might use the disruptedroutes for movement and re-supply atsome point in the future.EVENTS IN SOUTH LEBANONDuring the conflict, and particularlyat the end when a U.N.-brokeredceasefire loomed, the IDF utilized a significantnumber of weapons carrying“cluster bombs,” including air-delivered,artillery, and medium-range rockets. Thebombs afforded quick reaction “area attack”of Hizballah rocket launching sitesand were additionally intended to impedeHizballah movements along roads goingin and out of known launch areas. Largenumbers of cluster bomb submunitionswere found in and around southern Lebanesevillages after the war, provokingan outcry from the international humanrights community. United Nations deminersand workers on the ground claimthat the majority of Israeli submunitionsexpended—some say as many as 90 percentof the total—were fired by the IDFduring the last 72 hours of the conflict.imaging notes // fall 2007 // www.imagingnotes.com23
5Israel is estimated to have expended anestimated 2.7 million bomblets.According to on-the-ground assessmentsand U.N. mapping of sites whereunexploded submunitions were discovered,cluster bomb use was concentratedin two bands easily within rangeof both artillery and MLRS (MultipleLaunch Rocket System) and largelyaway from the border area: southeast ofRashidiyah on the coast south of Tyreto northeast of Tyre, and from southwestof Brashit and south of Tibnine extendingnorthwards through Qabrikhainto the Bekaa valley to the west ofMarjeyoun. See Figure 5. IDF groundforces could be anticipated to operateFigure 5False color infrared (NIR/G/B) image of Sidiqine in southern Lebanon acquired by QuickBird onJuly 25, 2006, with damage from IDF strikes annotated.at the border area and thus run into thevolatile unexploded bomblets.A CEASEFIRE AND UNCERTAINAFTERMATHUnited Nations mapping was an incomparablesource of information aboutthe war, and after the conflict, UNOSAT(a U.N. programme created to provide theinternational community and developingcountries with enhanced access to satelliteimagery and GIS) compiled a seriesof photo-interpretation products basedupon IKONOS satellite imagery used toidentify individual locations and types ofdamage to buildings, bridges and roads.Commercial remote sensing data provedespecially useful in visualizing militaryevents in southern Lebanon, where hillyterrain, isolated villages, and poorlymappedsettlements contributed to a chaoticunderstanding of the war. Lebaneseand international media coverage, commercialimagery, and “social media,”—24imaging notes // fall 2007 // www.imagingnotes.com
the tracking of the war over the Internetand the extensive use of digital photographyby the average Lebanese citizen andNGOs—opened the war to unprecedentedcontemporaneous description. Shortof communications intercepts, civilianswere seeing almost as much as the IDFand Israeli intelligence were seeing. Andyet, given the nature of air warfare andthe difficulties of interpretation, the civiliancommunity and the media were inmany ways just as much in the dark.On Aug. 11, the United Nations SecurityCouncil unanimously approvedU.N. Security Council Resolution 1701(2006), which called for disarmamentof Hizballah. Lebanon, Hizballah andIsrael all accepted the terms, and theceasefire took effect at 8:00 a.m. local(5:00 a.m. GMT) on Aug. 14.While the political consequences ofthe war continue to unfold, even the basicquestion of “who won” is complex. Bya conventional measure of success, Israelachieved much: Hizballah’s six years ofinvestment and effort to build up infrastructurein southern Lebanon were gone,the routes of Syrian and Iranian re-supplywere disrupted, 70-80 percent of thelong-range and 50 percent of the shortrangelaunchers were destroyed, half ofthe stock of actual rockets and missileswere assessed as destroyed or expended,and more than 600 Hizballah fighterswere dead. But while destruction of theorganization’s support infrastructure—roads and bridges, fuel, communications,media, even financial institutions—accumulated,Hizballah rocket fire was neversubdued and the organization’s militaryoperations were never fully suppressed.Hizballah labels its endurance and survivalin the face of Israeli attack a “DivineVictory,” stating that it is rearmingand more powerful than ever, not onlymilitarily, but also in Lebanese internalpolitics, and in the overall Arab world.Perhaps, in its aftermath, the war in Lebanonin the summer of 2006 has demonstratedthe need to pursue differentmilitary and political strategies againstterrorism in the future.Note This article is adapted fromWilliam Arkin’s forthcoming monograph,Divining Victory: Airpower in the 2006Israel-Hizballah War, a “quick look” studyconducted for the United States Air Force.During the writing of the study in early2007, Arkin was National Security andHuman Rights Fellow at the Carr Center forHuman Rights Policy at the Kennedy Schoolof Government at Harvard University.Matthew McKinzie and William Arkin havecollaborated on bomb damage assessmentstudies for the U.S. government, the UnitedNations, and various non-governmentalorganizations.THE NATIONAL COUNCIL FOR SCIENCE AND THE ENVIRONMENT invites youto participate in the 8th National Conference on Science, Policy, and the Environment, ClimateChange Science and Solutions to develop comprehensive strategies for protecting people andthe planet against the threat of climate change.January 16-18, 2008Ronald Reagan Building and International Trade Center, Washington, D.C.www.NCSEonline.org/2008conferenceMANY OPPORTUNITIES FOR PARTICIPATION• Skill-building workshops• Targeted breakout sessions• Showcase of Solutions Exhibition• Poster SessionFEATURED SPEAKERS INCLUDEJames Rogers, CEO of Duke EnergyTom Lovejoy, President of the Heinz Center forScience, Economics, and the EnvironmentAbigail Kimbell, Chief of the U.S. Forest ServiceBill McKibben, Founder of Step It UpMark Myers, Director of the U.S. Geological SurveryMohan Munasinghe, Vice Chair of theIntergovernmental Panel on Climate Change (IPCC)Register Soon!Early registration rates available until November 2Questions? Call 202.530.5810 oremail conference2008@ncseonline.orgimaging notes // fall 2007 // www.imagingnotes.com25
Urban LandUse ClassificationApplying Texture Analysis and Artificial Intelligence126imaging notes // fall 2007 // www.imagingnotes.com
Urban land use classification has entered an attractive new era with the recently increased availabilityof high-resolution satellite imagery, such as IKONOS and QuickBird. With these advanced sensors, detailed urban componentssuch as single-family and multi-family houses, trees, driveways, and parking lots are now identifiable, as their distinctiveelectromagnetic reflectance and shapes can be captured at a high resolution. This, on one hand, makes detailed land use typeidentification possible, but on the other hand, makes the traditional per-pixel classification unsuitable, because the electromagneticsignature of different land use types, such as residential, commercial, and industrial, now has large in-class varianceand between-class overlap.In contrast, people can easily separatethese different land use zones visuallybecause they can make sense ofimage texture. Drs. Myint and Lamargued in their article, “This spatial informationneeds to be extracted, in additionto its individual spectral value, tocharacterize the heterogeneous natureof urban features in high-resolutionimages.” 1 Intuitively, scientists developedtexture analysis method and artificialintelligence classifiers to improveurban land use classification performance.Recent land use/cover classificationresearch that used both advancedtexture metrics and genetic algorithmsfor classifying land use/cover in NewOrleans was done on an IKONOS image(see Figure 1).The City of New OrleansThe city of New Orleans, located nearthe Gulf of Mexico, is highly populated,with most of its urban area below sea level.New Orleans was devastated by catastrophicCategory III Hurricane Katrinaon August 29, 2005, and many neighborhoodswere severely flooded. As shownin Figure 2, these neighborhoods exhibitdifferent spatial patterns. (See Figure 2.)Texture AnalysisThis research particularly examinesthree cutting-edge techniques: fractaldimension, lacunarity, and Moran’sI spatial autocorrelation index. Thefractal concept was invented by Mandelbrotto measure the self-similarityand irregularity of complex forms suchas coastal lines. 2 In fractal geometry,a two-dimensional image may have afractional dimension between 2 and 3,with a larger value representing a highlyself-similar and rougher surface.Figure 3 shows a computer-simulatedgraphic with a fractal dimension of 2.5,which is generated using Image Characterizationand Modeling System (ICAMS), asoftware package developed by Lam andher collaborates. 3 Most remote sensingimages have larger fractal dimensionsthan this simulated image. Emerson et al.successfully deployed fractal dimensionin land cover classification scenarios withLandsat imagery. 4As a counterpart of fractal dimension,lacunarity was introduced to measurethe “gap” distribution in an image. 5Higher lacunarity generally means amore heterogeneous pattern. Lacunaritywas used to characterize landscape patternand was found to increase accuracyin urban land use/cover classification. 6,1Spatial autocorrelation demonstratesthe spatial similarity or dissimilarity ofneighboring pixels. 7 A widely used measureis Moran’s I index, which rangesfrom -1 to 1 for negative, random, andpositive autocorrelation. Application ofspatial autocorrelation in image classificationincludes use of Semivariogramvectors and Moran’s I. 8Moving window techniques are widelyused to generate local measurements ofthese texture metrics to produce texturallayers. A window is placed on top of theimage, and the texture measurement insidethe window is assigned to the window’scentral pixel (see Figure 4). As thewindow moves across the entire image,a new textural layer will be generated.Different land cover categories then havedifferent spectral characteristics, and differenttextural indices measure differenttextural properties.Figure 5 shows the textural metriccurve of the land use types demonstratedin Figure 2, and Figure 6 shows spectraland temporal views of Jefferson Parish,La. Researchers usually take advantageof this difference to aid in the classification,and significant improvements werereported in Myint and Lam 2005.Artificial Intelligence ClassifiersThe inadequacy of traditional maximumlikelihood classifier in detailed urbanland use classification has inspiredadoption of artificial intelligence in landuse classifiers, such as Liu and Lathrop’sresearch using multi-layer perceptronneural network. 9 Although it has problems,the maximum likelihood classifieris still the most commercially availableclassifier in remote sensing and photogrammetricsoftware and is somewhatreliable in most cases. However, it canbe more promising if it can be furtherimproved or better implemented.This research undertook a further lookat this widely used maximum likelihoodclassifier, with special attention to thesometimes ignored prior probabilities (priorknowledge). Taking this into account,Figure 1IKONOS band 4, 3, 2 false color composition,New Orleans, Louisiana. The area is on theborder between Jefferson Parish and OrleansParish, close to the Mississippi River. Imagecaptured on September 2, 2005. The 4-meterpixel resolution makes it possible to identifydetailed land use types. IKONOS satellite imagerycourtesy of GeoEye.Wenxue Ju, PhD CandidateDepartment of Geography and AnthropologyLouisiana State UniversityBaton Rouge, La.www.lsu.edu/rsgisNina S.-N. Lam, PhDProfessorDepartment of Environmental StudiesLouisiana State UniversityBaton Rouge, La.www.lsu.edu/rsgisimaging notes // fall 2007 // www.imagingnotes.com27
we approached the problem by usinggenetic algorithms to optimize the probabilityparameter by fitting the goal of ahigher accuracy through an evolutionarytraining process (see Figure 7). This optimizedsolution is then used as the priorknowledge to make better classificationwith the maximum likelihood classifier.2WorkflowThe calculation method of fractal dimensionrequires a large window to yielda stable measurement, but a large windowmay blur land use boundaries. Thisresearch used the panchromatic band togenerate three textural layers (fractal dimension,lacunarity, and Moran’s I). Thetextural layers were down sampled andfurther stacked with the spectral green,red and near-infrared bands. Blue bandwas excluded because of atmosphericscatter effects. The composite six-bandimage hence contains not only spectralcharacteristics, but also texture measurementsextracted with three advancedtextural metrics. The composite imagethen went through a standard supervisedclassification based on pre-selected trainingsites, with the adoption of genetic algorithmin the training classifier. ADS40aerial photographs (courtesy of the LSUGIS Clearinghouse Cooperative) wereused to check classification accuracy, andfield work was also performed.A slightly smaller area than Figure 6was used in this research, and hence theflooded area bears no effects on classification,which is the case of most landuse classification. The proposed geneticalgorithm classifier was compared tothe traditional per-pixel-based method.Textural layers were generated with a65x65-meter moving window. A USGSlevel II classification scheme was usedwith only existing land use types considered:residential, woodland, grassland,commercial, industrial and water. Classifiedmaps are shown in Figure 8.Figure 9 demonstrates the improvementof the new method over the traditionalmethod. The test found that thetraditional per-pixel-based maximumlikelihood classification yielded only68.5 percent accuracy, whereas accuracyincreased to 79.7 percent when thegenetic algorithm was used, or to 86.6percent, when texture information wasused. Both the genetic algorithm andthe texture information used togetheryielded an overall 89.3 percent classificationaccuracy.In terms of computational efficiency,a test of 20 training scenarios foundthat on average, less than 10 additionalminutes are needed. Considering thegreat improvement in accuracy, this littleextra time is well justified. Althoughextraction of textural layers is computationallytime-consuming, often takingseveral hours on a fast Windows-basedcomputer, significant reduction in computertime could be made if parallel ordistributed processing were deployed.Detecting flood or land-water interfaceis one important remote sensingapplication. A preliminary experimentwith selected sites in New Orleans wasused to test the texture method with themaximum likelihood classifier, and itshowed (Figure 10) that the omission errorswere significantly reduced in mostflooded land cover types: residential,commercial, woodland, and completelyflooded areas (parking lots, grasslands,etc). The overall accuracy was improvedfrom 60.3 percent to 75.2 percent. Althoughthis preliminary is still not goodenough, it shows great promise of applyingtexture analysis in disaster detection.By further combining LIDAR elevationdata, other artificial intelligence classifiers,and an expert knowledge system,even higher accuracy can be achieved.The way that people identify groundfeatures is based on visualization of bothspectral information (image color) andtextural information (shape, variation,28imaging notes // fall 2007 // www.imagingnotes.com
Figure 21-m resolution IKONOS panchromatic band ofdifferent neighborhoods in New Orleans. Imagecaptured on September 2, 2005. First row fromleft to right: Low density residential/ResidentialI, high density residential/Residential II, woodland;second row: commercial, water, industrial;third row from left to right: flooded Residential I,flooded Residential II, flooded industrial. IKONOSsatellite imagery courtesy of GeoEye.3Figure 3A 500x500 fractal surface generated usingICAMS, Fractal Dimension=2.5.Figure 4Demonstration of the moving window technique(numbers indicating 11-bit DN values of IKONOSsatellite imagery).4655Figure 5Texture curve of different land use types,using a 33x33-meter moving window (Note thatfractal dimension and Moran’s I values arebounded to 2~3 and -1~1, respectively, whilelacunarity has no upper boundary).432Figure 6Spectral (left) and textural (right) view of thesame area. Textural layers representing fractaldimension, lacunarity and Moran’s I are stackedfor a color textural view. The area is near the industrialpark in Jefferson Parish, Louisiana andon the right side (east) of the Mississippi River.IKONOS satellite imagery courtesy of GeoEye.10Residential IResidential IIWoodlandCommercialWaterFractal DimensionLacunarityMoran’s IIndustrialResidential I (Flood)Residential II (Flood)Industrial (Flood)66imaging notes // fall 2007 // www.imagingnotes.com29
80.920.900.880.860.840.820.80100908070605040302010010.90.80.70.60.50.40.30.20.10-0.170.78 0 5 10 15 20 25 30 35 40 45 509GeneticAlgorithm10UNFLOODEDRESIDENTIALCOMMERCIALTextureAnalysisIncrementIncrementBaselineWOODLANDWATERBODYBaselineCombinedMethodOVERALLcompactness, etc). While multiple spectralbands have frequently been used togetherin traditional classification for better separationof different land use types, there is noreason additional multiple textural bandscannot be used to increase accuracy.This comprehensive spectral-spatialimage information will help make computerswork more like image specialists. Unlikeobject-based land use/cover classificationthat is available in some commercialsoftware packages, this research representsan ongoing academic research trend of increasinguse of the texture-layer-aided approach.When the texture-aided approachis combined with artificial intelligence algorithms,classification accuracy improvessignificantly, providing fast, accurate, robust,automated detection of affected areas,which is more critical than ever.Note This research is partially supported byan NSF grant (Award No. BCS-0726512). Use ofimage data from GeoEye and the LSU GIS Clearinghouseis also gratefully acknowledged.Figure 7Training curve of the classifier.Figure 8Classified land use/cover maps using IKONOSmultispectral band 4, 3, 2 with traditionalmaximum likelihood method (top) and the newmethod (bottom).Figure 9Improvement of land use classification accuracywith different approaches, compared tothe traditional maximum likelihood classifier.Figure 10Improvement of flood detection in differentland use categories with texture informationutilized, compared with the per-pixel spectralclassification. Maximum likelihood classifierwas used in both cases.Endnotes1. Myint, S.W, and N.S.-N. Lam, 2005. “Examininglacunarity approaches in comparison withfractal and spatial autocorrelation techniquesfor urban mapping.” PhotogrammetricEngineering & Remote Sensing, 71(8):927-937.2. Mandelbrot, B. B., 1967. “How long is the coastof Britain? Statistical selfsimilarity and fractionaldimension.” Science, 156: 636638.3. Lam, N. S.-N., D. A. Quattrochi, H.-L. Qiu, and W.Zhao, 1998. “Environmental assessment andmonitoring with image characterization andmodeling system using multiscale remotesensing data.” Applied Geographic Studies,2(2):77-93.4. Emerson, C.W., N.S.-N. Lam, and D.A. Quattrochi,1999. “Multi-scale fractal analysis of imagetexture and pattern.” PhotogrammetricEngineering & Remote Sensing, 65(1):51-61.5. Mandelbrot, B.B., 1983. The Fractal Geometryof Nature. New York: W.H.Freeman.6. Plotnick, R.E., R.H. Gardner, and R.V. O’Neill,1993. “Lacunarity indices as measures oflandscape texture.” Landscape Ecology,8(3): 201-211.7. Cliff, A.D., and J.K. Ord, 1973, Spatial Autocorrelation.London: Pion Limited.8. Carr, J.R., and F.P. de Miranda, 1998. “Thesemivariogram in comparison to the co-occurrencematrix for classification of imagetexture.” IEEE Transactions on Geoscienceand Remote Sensing, 36(6): 1945-1952.9. Liu, X., and R.G. Lathrop, 2002. “Urbanchange detection based on an artificialneural network.” International Journal ofRemote Sensing, 23(12): 2513-2518.30imaging notes // fall 2007 // www.imagingnotes.com
Don’t Miss The Nation’sPremier Intelligence Event!LEARN NETWORK DISCOVERGain Insight from the Who’s Who of theIntelligence and Defense Communitiesimaging notes // fall 2007 // www.imagingnotes.comOfficial Media SponsorWhere Our National Security Begins…Connect with Fellow Industry LeadersRegister byOct. 16 andSAVE up to $100Priority Code GS916AView the Latest Geospatial IntelligenceTechnologies31REGISTER AND GET COMPLETE DETAILS ATWWW.GEOINT2007.COM
NASA’s EarthScience ProgramLearning from Past Events to Project the FutureWhat are the future prospects for NASA’s Earthscience program, an activity that has longstruggled for resources and management attentionwithin the space agency? Will the program wither onthe vine, suffering from a drought of funding and alack of clear vision for the follow-on to the existing14-satellite Earth Observing System (EOS)? Or willthe program be reinvigorated, helped by the samepolitical conditions that existed when NASA’s Missionto Planet Earth was proposed by President Bush’sfather as a major national research initiative in the1989-1991 time frame?A case for the latter scenario can befound in a reading of ideas presented bynoted political scientist John Kingdonabout how issues get placed on the policyagenda. Specifically, in Agendas, Alternativesand Public Policies (2nd edition1995), Kingdon contends that the timefor an issue or policy proposal to receiveserious political attention occurs whena condition is defined as a problem demandinggovernmental attention, whenacceptable policy alternatives are specifiedand when the political environmentis ripe for action.NASA’s Mission to Planet Earth wasformally proposed following the eventfulyear of 1988, in which various indicators(e.g., rising global temperature readings,warming ocean temperatures, major hurricanes,droughts, and the Yellowstonewildfires) gave credence to the idea thatEarth’s changing climate could be definedas a public policy problem demandingthe attention of political leaders. NASAhad acknowledged expertise in developingnew technologies for passive and active remotesensing from space. That December,Time magazine eschewed the naming ofa person in its traditional year-ender, anddecided to designate endangered Earth as“Planet of the Year."Led by NASA’s Earth science directorShelby Tilford and a NASA advisory committeepanel headed by former NationalCenter for Atmospheric Research directorFrancis Bretherton, extensive ongoingplanning gave government officials confidencethat a major NASA Earth scienceprogram could be mounted. For politicalleaders on both sides of the political fence,it seemed to make sense to invest in anincreased NASA Earth science effort, inthe context of a multi-agency U.S. GlobalChange Research Program (USGCRP), tohelp inform decision making on global climatechange.In 1989, the incoming George H. W.Bush administration formally proposedNASA’s Mission to Planet Earth. As “Bush41” put it at the time, “Let us remember aswe chase our dreams into the stars that ourfirst responsibility is to our Earth, to ourchildren, to ourselves. Yes, let us dream,and let us pursue those dreams, but let usalso preserve the fragile world we inhabit.”Without much debate, the DemocraticledCongress lent its stamp of approval tothe proposal. The only constraints for theprogram—familiar ones today—were tightbudgets. The 1990 White House-Congressionaldeal to limit domestic discretionaryspending forced NASA to abandon plansfor an $18 billion ten-year program builtaround two large polar orbiting platforms.Within new budget guidelines of $7.25 billionfor the ten-year program, the agencydecided to rely on satellites flying in closeformation, which would still allow for mostof the EOS science objectives to be met.During the George W. Bush administration,the EOS is largely up and runningwith 14 satellites in orbit, but the future ofthe Earth science program is very much indoubt. Before and after the 2004 presidentialdecision to reorient NASA’s missiontoward the goal of developing an outposton the moon and eventually sending astronautpioneers to Mars, there was extensivediscussion within the Bush administrationabout possibly moving NASA’s Earth scienceprograms to NOAA. The Earth scienceprogram at the time was being impactedby funding constraints to NASA asa whole that were resulting in delays to orthe elimination of future missions, and inFigure 1CloudSat will have Cloud Profiling Radar usingmicrowave energy to observe cloud particlesand determine the mass of water and icewithin clouds. The mission will collect informationabout the vertical structure of clouds thatwill help answer key questions about how theyform, evolve and affect our weather, climateand water supply. Artist’s concept of CloudSat,credit: NASA/JPL.Edward Goldstein, PhDInstructorAmerican University, The CatholicUniversity of America and GeorgetownUniversityWriter/Editor, NASAWashington, D.C.32imaging notes // fall 2007 // www.imagingnotes.com
Let us remember as we chase our dreamsinto the stars that our first responsibility isto our Earth, to our children, to ourselves.Yes, let us dream, and let us pursue thosedreams, but let us also preserve the fragileworld we inhabit.— George H.W. Bush, 1989imaging notes // fall 2007 // www.imagingnotes.com33
23reduced funding for research and analysisof data by scientists.Despite these cloudy signals, the timemight once again be ripe for the politicalsystem to provide additional attention andresources to NASA’s Earth science program.Contributing to this view are evidenceof increased public concern aboutthe issue of global climate change afterHurricane Katrina in 2005, the developmentof a priority-setting National ResearchCouncil Decadal Survey for EarthScience and Applications from Space, andchanges in the makeup of the Congressfollowing the 2006 elections.Where NASA’s Earth science programspecifically fits into Kingdon’s model is theperceived need—mostly expressed in publicpolicy circles—to maintain continuityof climate measurements and to get a betterhandle on the question of whether ourplanet is facing a global warming “tippingpoint” that could lead to dramatic increasesin tropical storm intensity, melting of polarice caps, sea level rise, and other fundamentalchanges. No less a figure thanBritish astrophysicist Stephen Hawkingtold a group of Chinese students in June2006 that he was “very worried aboutglobal warming” and afraid that Earth“might end up like Venus, at 250 degreescentigrade and raining sulfuric acid.” 1The public mood also fits into this picture.A CNN/Opinion Research Corporationpoll conducted May 4-6, 2007, foundthat 74 percent of respondents agreed thatglobal warming is a “proven fact,” with54 percent saying the warming is “mostlycaused by emissions from cars and industrialfacilities,” 20 percent saying it is“mostly caused by natural changes,” and22 percent calling global warming “anunproven theory.” Other recent polls backthese numbers.While this public opinion primarilytranslates into discussions about what todo about global warming, with the researchcomponent largely an afterthoughtin the policy conversation, relevant Congressionalcommittees have shown astrong interest in the subject, and the newlineup in Congress has made a difference.The House Science and Technology spaceand aeronautics subcommittee devoted ahearing to NASA’s Earth science programin late June, with Space News reportingthat subcommittee chairman Rep. MarkUdall (D-CO) “expressed concerns thatNASA was not living up to its lead role inmonitoring Earth’s changing climate fromspace.” 2 Also in June, Senate appropriatorsvoted to increase NASA’s Fiscal Year2008 Earth science budget request of $1.534imaging notes // fall 2007 // www.imagingnotes.com
illion by $138 million, with House appropriatorsincreasing the Earth sciencebudget by $60 million, and with an additional$20 million targeted for researchand analysis of Earth science data.The scientific community also hasmade its voice heard, through the developmentof the Decadal Survey for EarthScience and Applications from Space, thefirst time the National Research Councilof the National Academies has produced apriority-setting roadmap for future Earthscience missions. (Editor’s note: Three ofthe authors of the Decadal Survey wroteabout the urgent need for funding in ourSummer Guest Editorial column.)The Decadal Survey, undertaken withthe support of NASA, NOAA and the U.S.Geological Survey, urges the U.S. governmentto spend $3 billion a year to funda series of 17 Earth science missions atminimum between 2010 and 2020, with15 managed by NASA. While calling forNASA to re-energize a major commitmentto Earth science undertaken in the 1990s,the report’s authors warned that due toattrition and funding issues, by 2010 thenumber of operating Earth-observing instrumentson NASA satellites is likely todrop by 40 percent, leaving gaps in dataused to forecast severe weather events suchas hurricanes, tornadoes and tsunamis,and to understand the dynamics of globalclimate change. Richard Anthes, co-chairmanof the two-year study and the AmericanMeteorological Society’s newly electedpresident, argued that NASA resourcesdevoted to Earth science, measured inconstant dollars, have dropped from$2 billion in 2002 to $1.5 billion today,leading to a decline in our country’s capabilitiesto monitor environmental change.The report called for a reinstitution of theprevious funding level.The move to create the Decadal Surveyhad its origins in a 2003 conversationbetween Lennard Fisk, a former NASAAssociate Administrator for Science andthe newly appointed head of the NationalResearch Council’s Space Studies Board,and Ghassem Asrar, NASA’s Earth sciencedirector from 1998-2005.Said Fisk (in a personal communication):“I took over the Space StudiesBoard and I looked around. Andeverybody else had a Decadal(Survey). I viewed Earth scienceas being in disarray and beingpenalized in part for lack of strategy.There was a criticism that theOMB (Office of Management andBudget) leveled on Ghassem when(NASA Administrator Dan) Goldinwas still there: ”Where’s your strategy?”And without a strategy you’rein the penalty box sort of thing. Youjust see a program that is cryingFigure 2out for a Decadal (Survey). So wewent and sold (it). And we sold italso to NOAA. It’s jointly fundedby NOAA and NASA. I wasn’tunaware of how hard this is. TheEarth science community is farmore fractured than many of theother science communities, andalso... there’s a variety of emotionsthat have run through this, Isuspect. One of them is that thereis kind of the Rodney Dangerfieldview of things—no respect. They’vebeen disappointed so many timesby NASA. They went from beingThe intense blue and green colors of the ocean water in this image show the North Atlantic Bloom, made by millionsof surface-dwelling ocean plants, phytoplankton, which are the base of the marine food chain. The land mass tothe middle right of the image is Iceland, and the land mass with ice in the upper left corner is Greenland. NASA imagecreated by Jesse Allen, using data obtained from the MODIS data archives. MODIS image taken on NASA’s Aquasatellite on July 15, 2007.Figure 3Tropical Cyclone 10s (Dina), northeast of Mauritius and Reunion Islands to the southeast of Madagascar, as seenfrom the Sea-viewing Wide-Field-of-View Sensor (SeaWiFS) onboard the OrbView-2 satellite. Visualization date: Jan.24, 2002. Courtesy of the SeaWiFS Project, NASA/Goddard Space Flight Center, and GeoEye.Figure 4This SeaWiFS image shows dense haze over eastern China. The view looks eastward across the Yellow Sea towardsKorea. Visualization date: Dec. 2, 1999. Courtesy of the SeaWiFS Project, NASA/Goddard Space Flight Center, and GeoEye.4imaging notes // fall 2007 // www.imagingnotes.com35
this flagship program extraordinaire,the largest science programever, to being on really hard times...And then you have the differentparts of the community that don’tnecessarily see things collectively.But the two chairs of this, BerrienMoore and Rick Anthes, I think aredoing a superb job of bringing thecommunity along in a systematicway to have a real product that theycan be proud of.”While NASA has welcomed the DecadalSurvey as a useful tool for guiding thedevelopment of future missions, and AdministratorMichael Griffin has expressedpride in NASA’s leadership role in theEarth science field, he also has said the survey’sproposed budget increases for Earthscience at NASA may be unrealistic. Or,as he put it in the Goddard Space Symposiumspeech last March, “When the DecadalSurveys, including the Earth sciencereport, publish rough cost estimates forseveral missions that are obviously off themark by a factor of two or more, we havea self-inflicted problem within the spacecommunity that affects the credibility ofall.” The more immediate question facingNASA’s Earth science program is whetherNASA will receive a budget increase abovethe President’s proposal that will allow forgrowth in the Earth science mission. As ofthis writing, the President has said he willveto any domestic spending measures thatcome in above his budget proposal.In today’s political environment,NASA’s Earth science program certainlyhas drawn more attention parallel togrowing public concern about what itmeans to be living on a warming planet.And the Decadal Survey for Earth Scienceand Applications from Space has providedprogrammatic priorities for Earth sciencethat Administrator Griffin has said NASA“will observe.” But when it comes to politics,budgetary concerns hold the key tothe program’s future. We cannot underestimatethe significance of the continuingbudget squeeze to prospects for NASA’sre-energizing its work in pioneering newEarth science measurements and applications.It is this factor, related to the unsettledpolitical environment, which lendsuncertainty to the question as to whetherNASA’s Earth science program will receivethe boost that its more vocal backers hopeto achieve. Another factor in this equationis the lobbying power of the human spaceflight industry and its supporters, whichtraditionally is a much more focused andorganized community than the communityof Earth scientists.Related to the budget issues, the questionremains as to whether NASA canreconcile its intention to continue emphasizingits priority mission of human androbotic exploration of the solar systemwith an arg-uably looming need for NASAto expand its Earth science research forimportant societal purposes. ShouldNASA at some point in the future receivedirection to do more on both fronts, ideaspresented by the scholar James Q. Wilsonin his 1984 book, Bureaucracy: WhatGovernment Agencies Do and Why TheyDo It, suggests how the agency’s culturemight successfully respond to the newAbout the Authorcircumstances. “A major responsibility ofan executive is not only, as David Selznickhas put it, to infuse the organization withvalue,” writes Wilson, “it is also to discovera way by which different values (andthe different cultures that espouse thosevalues) can productively coexist” (p. 105).Wilson adds, “Some government agencieshave been endowed with so strong asense of agency-wide mission that they doa better job than others in managing thetension among rival occupational subcultures”(p.106).With this point in mind, one way todemonstrate that NASA can performwell more than one important task forthe nation is for the space agency to morebroadly emphasize what AdministratorMichael Griffin has called in congressionaltestimony its common commitment to“technical excellence.” It does not takeaway from the prestige and importanceof human spaceflight for NASA to moreassertively say that Earth science, whilemore prosaic in execution, is a missionthat deserves the attention and pride of theAmerican people.Edward Goldstein received his Ph.D. in Public Administration from The George Washington Universityin January, 2007 for the dissertation “NASA’s Earth Science Program: The Bureaucratic Strugglesof the Space Agency’s Mission to Planet Earth.” While Dr. Goldstein works professionally for NASAas a writer/editor, the views expressed in this essay are solely his own, and do not necessarilyrepresent the views of NASA or the United States Government.5Figure 5This view of Typhoon Jelawat from SeaWiFS istoward the west by northwest with southernJapan visible at right. Image visualized Aug. 8,2000. Image provided by SeaWiFS Project, NASA/Goddard Space Flight Center and GeoEye.Endnotes1. A. Olesen, “Stephen Hawking Warns AboutGlobal Warming,” The Washington Post, June22, 2006, p. A3.2. Brian Berger, “NASA Official Defends Earth ScienceSpending,” Space News, July 2, 2007, p. 6.36imaging notes // fall 2007 // www.imagingnotes.com
guest editorialhindsight(continued from page 38)Several years ago, the NationalInstitute of Standards and Technology(NIST) commissioned a study to attemptto quantify the efficiency losses in theU.S. capital facilities industry resultingfrom inadequate interoperability, includingdesign, engineering, facilities management,and business processes, software systemsand redundant paper records managementacross the entire facility life cycle. TheNIST estimated that poor interoperabilitycost the U.S. capital facilities industry$15.8 billion in 2002, and this is likely tobe a conservative figure.New Design TechnologiesTo enable architects, engineers, andowners and operators of buildings andinfrastructure to address these challenges,the design industry is investing heavily in newtechnologies such as digital prototyping,model-driven design, and interoperability.The business drivers for these transformativetechnology advances are productivity andefficiency by improving the performance offacilities over their full life cycle.Digital prototyping, which allowsarchitects to design and experience abuilding or highway before it is built, relieson many of the same 3D visualizationand simulation technologies underlyingcomputer games. The process allowsarchitects and engineers to convey theirdesigns more effectively, reduces the riskof major modifications to built structures,and enables optimization of buildings andinfrastructure for the full life cycle, includingoperations and maintenance.Most of the world’s buildings andinfrastructure (roads and highways, power,water and wastewater, telecommunications,and oil and gas pipeline networks) aredesigned using CAD desktop applications.Traditional CAD drawings are not intelligentbecause they lack a model or intelligentrepresentation of real-world objects. Modelsmake it possible to design an engine thatcan be animated to visualize the movingparts. In architectural design, this is referredto as building information modeling or BIM,and many people in the industry such as theU.S. GSA are convinced that BIMs not onlyreduce the costs of design and constructionfor new structures, but also significantlyreduce the downstream costs associatedwith operation and maintenance.Breaking down islands of technologyenables the convergence of architecturaldesign, engineering, land development,civil engineering, construction, geospatialdisciplines, and 3D visualization and simulationtechnology. Convergence provides aframework of interoperability across the lifecycleof building and infrastructure investmentinvolving design, construction, andoperation, and enables seamless access toarchitectural, engineering, and geospatialdata inside, outside, and under a facility.Benefits of New DesignTechnologies for Other DisciplinesThe new technologies that are beingdeveloped by the design industry meanthat, during the post-construction phaseof a facility or building, important benefitsare expected to be realized not only foroperations and maintenance staff, but alsofor emergency planners, first responders,and urban planners.For example, emergency responders,instead of going into an emergencysituation with limited information aboutthe building or facility, will be able to haveseamless access to facilities data inside,outside, and underneath urban structuresin an interactive 3D simulation that willreduce the risk to themselves and allowthem to deal more rapidly and effectivelywith emergency situations. This accessinvolves integrating the widest range ofprecision data that was created whenthe building was designed to deliver aprecise synthetic environment that canbe used to simulate the inside (utilities,HVAC systems, furniture, elevators, walls,doors, windows, and structural details);outside (aerial utilities, full city blocksof 3D detail, road access); and under;(underground water, wastewater, gas,power, and telecommunications systems)an urban location and make this availablein a seamless, easy-to-use environment.See Figure 2.Today’s 3D visualization, simulation,and gaming technology enables precisiondesign data to be integrated into aneasy-to-use, interactive model. This meansthat, when a first responder enters a facilityto deal with an emergency situation, he orshe will have at his or her fingertips all of therelevant precision architectural, engineering,and geospatial data inside, outside, andunder that facility in an easily utilized,interactive simulated environment.The integration of model-drivendesign, BIM/CAD/GIS convergencewith 3D visualization and simulationtechnologies, including gaming engines,is breaking down traditional islands oftechnology. The objective is to improvethe productivity and efficiency in theconstruction and facilities managementindustries, but these new technologiesare not only going to change dramaticallyhow we design, manage, and operatebuildings and infrastructure, but are goingto provide important benefits for firstresponders and emergency planners.imaging notes // fall 2007 // www.imagingnotes.com37
Urban EnvironmentsNew Design Technologies Enable Intelligent Simulationhindsight guest editorialThe world’s constructionindustry, with annual spending estimated tobe $2.3 trillion ($1.2 trillion in 2006/2007in the U.S.), is facing serious challenges,including global climate change, aginginfrastructure, a shrinking workforce, andpoor productivity. To enable architects,engineers, and owners and operators ofbuildings and infrastructure to addressthese challenges, the design industryis investing in new technologies suchas digital prototyping, model-drivendesign, and interoperability. These newtechnologies are not only going to changedramatically how we design, manage, andoperate buildings and infrastructure, but aregoing to provide important benefits for firstresponders and emergency planners.Challenges Facing theConstruction IndustryThe share of Americans calling globalwarming the most important environmentalissue rose from 11 percent in 2003 to 35percent in 2006. In the United States alone,buildings account for 39 percent of totalenergy use, 68 percent of total electricityconsumption, and 38 percent of total carbondioxide emissions. Many of our existingbuildings and infrastructure are going to haveto be either replaced or retrofitted to achievezero net carbon emissions and minimizeenvironmental impact while at the same timeyielding a respectable financial return oninvestment. Global climate change has cometo the forefront for this industry.Geoff Zeiss, PhDDirector of TechnologyAutodesk, Inc.geoff.zeiss@autodesk.comBetween the Poles blog:http://geospatial.blogs.com250%200%150%100%50%Construction Productivity1964 1982 20001Figure 1Figure 2Building’s internal 3D simulationAging infrastructure is the next issue.Every two years the American Societyof Civil Engineers (ASCE) prepares aReport Card for American Infrastructure.In 2005, the ASCE awarded Americanroads, bridges, and transit a grade ofD. To put this in context, the FederalHighway Administration reports thatoutdated and substandard road andbridge design, pavement conditions, andsafety features are factors in 30 percentof all fatal highway accidents. The ASCEestimates that motor vehicle crashescost U.S. citizens $230 billion per year,or $819 for each resident for medicalcosts; lost productivity; travel delay;and workplace, insurance and legalcosts. The ASCE estimates that a totalinvestment of $1.6 trillion over five yearsis required to bring U.S. infrastructure togood condition.The workforce is shrinking. In theU.S., one study predicted that by 2010,the number of workers aged 35 to 44will decline by 19 percent, the number ofworkers aged 45 to 54 will increase 21percent, and the number of workers aged55 to 64 will increase 52 percent. Thisis a world-wide phenomenon. A reportprepared in 2004 by the U.S. Departmentof Labor reported, “Industry leaders notedthat the construction industry is experiencinga shortage of workers. This currentshortage is complicated by two trends: thegrowth of the industry, and the retirementof the baby boomers.” The Employmentand Training Administration projectsthat the construction industry will growat an average annual rate of 1.3 percentbetween 2002 and 2012, adding over onemillion new jobs.The construction industry is facingdeclining productivity (see Figure 1). Statisticspublished by U.S. Bureau of LaborStatistics show that in the last 40 years,while non-farm productivity has increasedby over 200 percent, productivity in theconstruction industry has actually declined.In the context of the challenges alreadymentioned, this is creating a crisis for theconstruction industry.Non-Farm ProductivityConstruction productivity and Non-Farm Laborfrom 1964-2003. Constant $ of contracts /workhours of hourly workers. Sources: US Dept.of Commerce, Bureau of Labor statistics2Also, traditionally, disciplines suchas architecture, structural engineering,construction, civil engineering, and GISrepresent classic information silos. Eachhas maintained its own information islandcomprised of design applications and data.(continued on page 37)38imaging notes // fall 2007 // www.imagingnotes.com
See your world in a whole new wayOur GEO products accelerate your company’s location intelligence by putting your most important information inits real-world, 3D, data-rich context – from any device, at any time.Google Earth Pro and Enterprise Solutionswww.google.com/enterpriseimaging notes // fall 2007 // www.imagingnotes.com39© Copyright 2007. All rights reserved. Google and the Google logo are registered trademarks of Google Inc.
Blueline Publishing LLCP.O. Box 11569Denver, Colo. 80211USA