Initial sequencing and analysis of the human genome - Vitagenes
Initial sequencing and analysis of the human genome - Vitagenes
Initial sequencing and analysis of the human genome - Vitagenes

Create successful ePaper yourself
Turn your PDF publications into a flip-book with our unique Google optimized e-Paper software.
articlesGenome Sequencing Centres (Listed in order <strong>of</strong> total genomicsequence contributed, with a partial list <strong>of</strong> personnel. A full list <strong>of</strong>contributors at each centre is available as SupplementaryInformation.)Whitehead Institute for Biomedical Research, Center for GenomeResearch: Eric S. L<strong>and</strong>er 1 *, Lauren M. Linton 1 , Bruce Birren 1 *,Chad Nusbaum 1 *, Michael C. Zody 1 *, Jennifer Baldwin 1 ,Keri Devon 1 , Ken Dewar 1 , Michael Doyle 1 , William FitzHugh 1 *,Roel Funke 1 , Diane Gage 1 , Katrina Harris 1 , Andrew Heaford 1 ,John Howl<strong>and</strong> 1 , Lisa Kann 1 , Jessica Lehoczky 1 , Rosie LeVine 1 ,Paul McEwan 1 , Kevin McKernan 1 , James Meldrim 1 , Jill P. Mesirov 1 *,Cher Mir<strong>and</strong>a 1 , William Morris 1 , Jerome Naylor 1 ,Christina Raymond 1 , Mark Rosetti 1 , Ralph Santos 1 ,Andrew Sheridan 1 , Carrie Sougnez 1 , Nicole Stange-Thomann 1 ,Nikola Stojanovic 1 , Aravind Subramanian 1& Dudley Wyman 1The Sanger Centre: Jane Rogers 2 , John Sulston 2 *,Rachael Ainscough 2 , Stephan Beck 2 , David Bentley 2 , John Burton 2 ,Christopher Clee 2 , Nigel Carter 2 , Alan Coulson 2 ,Rebecca Deadman 2 , Panos Deloukas 2 , Andrew Dunham 2 ,Ian Dunham 2 , Richard Durbin 2 *, Lisa French 2 , Darren Grafham 2 ,Simon Gregory 2 , Tim Hubbard 2 *, Sean Humphray 2 , Adrienne Hunt 2 ,Mat<strong>the</strong>w Jones 2 , Christine Lloyd 2 , Am<strong>and</strong>a McMurray 2 ,Lucy Mat<strong>the</strong>ws 2 , Simon Mercer 2 , Sarah Milne 2 , James C. Mullikin 2 *,Andrew Mungall 2 , Robert Plumb 2 , Mark Ross 2 , Ratna Shownkeen 2& Sarah Sims 2Washington University Genome Sequencing Center:Robert H. Waterston 3 *, Richard K. Wilson 3 , LaDeana W. Hillier 3 *,John D. McPherson 3 , Marco A. Marra 3 , Elaine R. Mardis 3 ,Lucinda A. Fulton 3 , Asif T. Chinwalla 3 *, Kymberlie H. Pepin 3 ,Warren R. Gish 3 , Stephanie L. Chissoe 3 , Michael C. Wendl 3 ,Kim D. Delehaunty 3 , Tracie L. Miner 3 , Andrew Delehaunty 3 ,Jason B. Kramer 3 , Lisa L. Cook 3 , Robert S. Fulton 3 ,Douglas L. Johnson 3 , Patrick J. Minx 3 & S<strong>and</strong>ra W. Clifton 3US DOE Joint Genome Institute: Trevor Hawkins 4 ,Elbert Branscomb 4 , Paul Predki 4 , Paul Richardson 4 ,Sarah Wenning 4 , Tom Slezak 4 , Norman Doggett 4 , Jan-Fang Cheng 4 ,Anne Olsen 4 , Susan Lucas 4 , Christopher Elkin 4 ,Edward Uberbacher 4 & Marvin Frazier 4Baylor College <strong>of</strong> Medicine Human Genome Sequencing Center:Richard A. Gibbs 5 *, Donna M. Muzny 5 , Steven E. Scherer 5 ,John B. Bouck 5 *, Erica J. Sodergren 5 , Kim C. Worley 5 *, Ca<strong>the</strong>rine M.Rives 5 , James H. Gorrell 5 , Michael L. Metzker 5 ,Susan L. Naylor 6 , Raju S. Kucherlapati 7 , David L. Nelson,& George M. Weinstock 8RIKEN Genomic Sciences Center: Yoshiyuki Sakaki 9 ,Asao Fujiyama 9 , Masahira Hattori 9 , Tetsushi Yada 9 ,Atsushi Toyoda 9 , Takehiko Itoh 9 , Chiharu Kawagoe 9 ,Hidemi Watanabe 9 , Yasushi Totoki 9 & Todd Taylor 9Genoscope <strong>and</strong> CNRS UMR-8030: Jean Weissenbach 10 ,Rol<strong>and</strong> Heilig 10 , William Saurin 10 , Francois Artiguenave 10 ,Philippe Brottier 10 , Thomas Bruls 10 , Eric Pelletier 10 ,Ca<strong>the</strong>rine Robert 10 & Patrick Wincker 10GTC Sequencing Center: Douglas R. Smith 11 ,Lynn Doucette-Stamm 11 , Marc Ruben®eld 11 , Keith Weinstock 11 ,Hong Mei Lee 11 & JoAnn Dubois 11Department <strong>of</strong> Genome Analysis, Institute <strong>of</strong> MolecularBiotechnology: Andre Rosenthal 12 , Matthias Platzer 12 ,Gerald Nyakatura 12 , Stefan Taudien 12 & Andreas Rump 12Beijing Genomics Institute/Human Genome Center:Huanming Yang 13 , Jun Yu 13 , Jian Wang 13 , Guyang Huang 14& Jun Gu 15Multimegabase Sequencing Center, The Institute for SystemsBiology: Leroy Hood 16 , Lee Rowen 16 , Anup Madan 16 & Shizen Qin 16Stanford Genome Technology Center: Ronald W. Davis 17 ,Nancy A. Federspiel 17 , A. Pia Abola 17 & Michael J. Proctor 17Stanford Human Genome Center: Richard M. Myers 18 ,Jeremy Schmutz 18 , Mark Dickson 18 , Jane Grimwood 18& David R. Cox 18University <strong>of</strong> Washington Genome Center: Maynard V. Olson 19 ,Rajinder Kaul 19 & Christopher Raymond 19Department <strong>of</strong> Molecular Biology, Keio University School <strong>of</strong>Medicine: Nobuyoshi Shimizu 20 , Kazuhiko Kawasaki 20& Shinsei Minoshima 20University <strong>of</strong> Texas Southwestern Medical Center at Dallas:Glen A. Evans 21 ², Maria Athanasiou 21 & Roger Schultz 21University <strong>of</strong> Oklahoma's Advanced Center for GenomeTechnology: Bruce A. Roe 22 , Feng Chen 22 & Huaqin Pan 22Max Planck Institute for Molecular Genetics: Juliane Ramser 23 ,Hans Lehrach 23 & Richard Reinhardt 23Cold Spring Harbor Laboratory, Lita Annenberg Hazen GenomeCenter: W. Richard McCombie 24 , Melissa de la Bastide 24& Neilay Dedhia 24GBFÐGerman Research Centre for Biotechnology:Helmut BloÈ cker 25 , Klaus Hornischer 25 & Gabriele Nordsiek 25* Genome Analysis Group (listed in alphabetical order, alsoincludes individuals listed under o<strong>the</strong>r headings):Richa Agarwala 26 , L. Aravind 26 , Jeffrey A. Bailey 27 , Alex Bateman 2 ,Sera®m Batzoglou 1 , Ewan Birney 28 , Peer Bork 29,30 , Daniel G. Brown 1 ,Christopher B. Burge 31 , Lorenzo Cerutti 28 , Hsiu-Chuan Chen 26 ,Deanna Church 26 , Michele Clamp 2 , Richard R. Copley 30 ,Tobias Doerks 29,30 , Sean R. Eddy 32 , Evan E. Eichler 27 ,Terrence S. Furey 33 , James Galagan 1 , James G. R. Gilbert 2 ,Cyrus Harmon 34 , Yoshihide Hayashizaki 35 , David Haussler 36 ,Henning Hermjakob 28 , Karsten Hokamp 37 , Wonhee Jang 26 ,L. Steven Johnson 32 , Thomas A. Jones 32 , Simon Kasif 38 ,Arek Kaspryzk 28 , Scot Kennedy 39 , W. James Kent 40 , Paul Kitts 26 ,Eugene V. Koonin 26 , Ian Korf 3 , David Kulp 34 , Doron Lancet 41 ,Todd M. Lowe 42 , Aoife McLysaght 37 , Tarjei Mikkelsen 38 ,John V. Moran 43 , Nicola Mulder 28 , Victor J. Pollara 1 ,Chris P. Ponting 44 , Greg Schuler 26 ,JoÈ rg Schultz 30 , Guy Slater 28 ,Arian F. A. Smit 45 , Elia Stupka 28 , Joseph Szustakowki 38 ,Danielle Thierry-Mieg 26 , Jean Thierry-Mieg 26 , Lukas Wagner 26 ,John Wallis 3 , Raymond Wheeler 34 , Alan Williams 34 , Yuri I. Wolf 26 ,Kenneth H. Wolfe 37 , Shiaw-Pyng Yang 3 & Ru-Fang Yeh 31Scienti®c management: National Human Genome ResearchInstitute, US National Institutes <strong>of</strong> Health: Francis Collins 46 *,Mark S. Guyer 46 , Jane Peterson 46 , Adam Felsenfeld 46 *& Kris A. Wetterstr<strong>and</strong> 46 ; Of®ce <strong>of</strong> Science, US Department <strong>of</strong>Energy: Aristides Patrinos 47 ; The Wellcome Trust: Michael J.Morgan 48NATURE | VOL 409 | 15 FEBRUARY 2001 | www.nature.com © 2001 Macmillan Magazines Ltd861
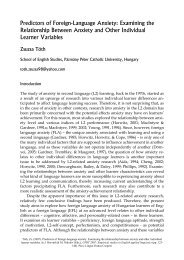
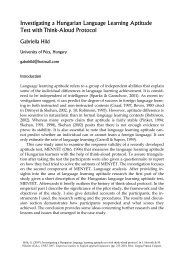
articlesorganisms; <strong>and</strong> <strong>the</strong> history <strong>of</strong> genomic segments. (Comparisonsare drawn throughout with <strong>the</strong> <strong>genome</strong>s <strong>of</strong> <strong>the</strong> budding yeastSaccharomyces cerevisiae, <strong>the</strong> nematode worm Caenorhabditiselegans, <strong>the</strong> fruit¯y Drosophila melanogaster <strong>and</strong> <strong>the</strong> mustard weedArabidopsis thaliana; we refer to <strong>the</strong>se for convenience simply asyeast, worm, ¯y <strong>and</strong> mustard weed.) Finally, we discuss applications<strong>of</strong> <strong>the</strong> sequence to biology <strong>and</strong> medicine <strong>and</strong> describe next steps in<strong>the</strong> project. A full description <strong>of</strong> <strong>the</strong> methods is provided asSupplementary Information on Nature's web site (http://www.nature.com).We recognize that it is impossible to provide a comprehensive<strong>analysis</strong> <strong>of</strong> this vast dataset, <strong>and</strong> thus our goal is to illustrate <strong>the</strong>range <strong>of</strong> insights that can be gleaned from <strong>the</strong> <strong>human</strong> <strong>genome</strong> <strong>and</strong><strong>the</strong>reby to sketch a research agenda for <strong>the</strong> future.Background to <strong>the</strong> Human Genome ProjectThe Human Genome Project arose from two key insights thatemerged in <strong>the</strong> early 1980s: that <strong>the</strong> ability to take global views <strong>of</strong><strong>genome</strong>s could greatly accelerate biomedical research, by allowingresearchers to attack problems in a comprehensive <strong>and</strong> unbiasedfashion; <strong>and</strong> that <strong>the</strong> creation <strong>of</strong> such global views would require acommunal effort in infrastructure building, unlike anything previouslyattempted in biomedical research. Several key projectshelped to crystallize <strong>the</strong>se insights, including:(1) The <strong>sequencing</strong> <strong>of</strong> <strong>the</strong> bacterial viruses FX174 4,5 <strong>and</strong> lambda 6 ,<strong>the</strong>animal virus SV40 7 <strong>and</strong> <strong>the</strong> <strong>human</strong> mitochondrion 8 between 1977<strong>and</strong> 1982. These projects proved <strong>the</strong> feasibility <strong>of</strong> assembling smallsequence fragments into complete <strong>genome</strong>s, <strong>and</strong> showed <strong>the</strong> value<strong>of</strong> complete catalogues <strong>of</strong> genes <strong>and</strong> o<strong>the</strong>r functional elements.(2) The programme to create a <strong>human</strong> genetic map to make itpossible to locate disease genes <strong>of</strong> unknown function based solely on<strong>the</strong>ir inheritance patterns, launched by Botstein <strong>and</strong> colleagues in1980 (ref. 9).(3) The programmes to create physical maps <strong>of</strong> clones covering <strong>the</strong>yeast 10 <strong>and</strong> worm 11 <strong>genome</strong>s to allow isolation <strong>of</strong> genes <strong>and</strong> regionsbased solely on <strong>the</strong>ir chromosomal position, launched by Olson <strong>and</strong>Sulston in <strong>the</strong> mid-1980s.(4) The development <strong>of</strong> r<strong>and</strong>om shotgun <strong>sequencing</strong> <strong>of</strong> complementaryDNA fragments for high-throughput gene discovery bySchimmel 12 <strong>and</strong> Schimmel <strong>and</strong> Sutcliffe 13 , later dubbed expressedsequence tags (ESTs) <strong>and</strong> pursued with automated <strong>sequencing</strong> byVenter <strong>and</strong> o<strong>the</strong>rs 14±20 .The idea <strong>of</strong> <strong>sequencing</strong> <strong>the</strong> entire <strong>human</strong> <strong>genome</strong> was ®rstproposed in discussions at scienti®c meetings organized by <strong>the</strong>US Department <strong>of</strong> Energy <strong>and</strong> o<strong>the</strong>rs from 1984 to 1986 (refs 21,22). A committee appointed by <strong>the</strong> US National Research Councilendorsed <strong>the</strong> concept in its 1988 report 23 , but recommended abroader programme, to include: <strong>the</strong> creation <strong>of</strong> genetic, physical<strong>and</strong> sequence maps <strong>of</strong> <strong>the</strong> <strong>human</strong> <strong>genome</strong>; parallel efforts in keymodel organisms such as bacteria, yeast, worms, ¯ies <strong>and</strong> mice; <strong>the</strong>development <strong>of</strong> technology in support <strong>of</strong> <strong>the</strong>se objectives; <strong>and</strong>research into <strong>the</strong> ethical, legal <strong>and</strong> social issues raised by <strong>human</strong><strong>genome</strong> research. The programme was launched in <strong>the</strong> US as a jointeffort <strong>of</strong> <strong>the</strong> Department <strong>of</strong> Energy <strong>and</strong> <strong>the</strong> National Institutes <strong>of</strong>Health. In o<strong>the</strong>r countries, <strong>the</strong> UK Medical Research Council <strong>and</strong><strong>the</strong> Wellcome Trust supported genomic research in Britain; <strong>the</strong>Centre d'Etude du Polymorphisme Humain <strong>and</strong> <strong>the</strong> French MuscularDystrophy Association launched mapping efforts in France;government agencies, including <strong>the</strong> Science <strong>and</strong> Technology Agency<strong>and</strong> <strong>the</strong> Ministry <strong>of</strong> Education, Science, Sports <strong>and</strong> Culture supportedgenomic research efforts in Japan; <strong>and</strong> <strong>the</strong> European Communityhelped to launch several international efforts, notably <strong>the</strong>programme to sequence <strong>the</strong> yeast <strong>genome</strong>. By late 1990, <strong>the</strong> HumanGenome Project had been launched, with <strong>the</strong> creation <strong>of</strong> <strong>genome</strong>centres in <strong>the</strong>se countries. Additional participants subsequentlyjoined <strong>the</strong> effort, notably in Germany <strong>and</strong> China. In addition, <strong>the</strong>Human Genome Organization (HUGO) was founded to provide aforum for international coordination <strong>of</strong> genomic research. Severalbooks 24±26 provide a more comprehensive discussion <strong>of</strong> <strong>the</strong> genesis<strong>of</strong> <strong>the</strong> Human Genome Project.Through 1995, work progressed rapidly on two fronts (Fig. 1).The ®rst was construction <strong>of</strong> genetic <strong>and</strong> physical maps <strong>of</strong> <strong>the</strong><strong>human</strong> <strong>and</strong> mouse <strong>genome</strong>s 27±31 , providing key tools for identi®cation<strong>of</strong> disease genes <strong>and</strong> anchoring points for genomic sequence.The second was <strong>sequencing</strong> <strong>of</strong> <strong>the</strong> yeast 32 <strong>and</strong> worm 33 <strong>genome</strong>s, as1984 1990 1991 1992 1993 1994 1995 1996 1997 1998 1999 2000 2001Discussion <strong>and</strong> debatein scientific communityNRC reportO<strong>the</strong>r organismsBacterial <strong>genome</strong> <strong>sequencing</strong>H. flu E. coli 39 speciesS. cerevisiae <strong>sequencing</strong>C. elegans <strong>sequencing</strong>D. melanogaster <strong>sequencing</strong>A. thaliana <strong>sequencing</strong>Genetic mapsMicrosatellitesSNPsMousePhysical mapscDNA <strong>sequencing</strong>Genomic <strong>sequencing</strong>Genetic mapsPhysical mapsMicrosatellitesESTsPilot<strong>sequencing</strong>SNPsFull lengthHumancDNA <strong>sequencing</strong>Genomic <strong>sequencing</strong>ESTsPilot project,15%Full lengthWorkingdraft, 90% Finishing, ~100%Chromosome 22 Chromosome 21Figure 1 Timeline <strong>of</strong> large-scale genomic analyses. Shown are selected components <strong>of</strong>work on several non-vertebrate model organisms (red), <strong>the</strong> mouse (blue) <strong>and</strong> <strong>the</strong> <strong>human</strong>(green) from 1990; earlier projects are described in <strong>the</strong> text. SNPs, single nucleotidepolymorphisms; ESTs, expressed sequence tags.862 © 2001 Macmillan Magazines Ltd NATURE | VOL 409 | 15 FEBRUARY 2001 | www.nature.com
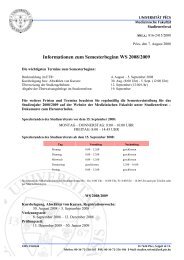
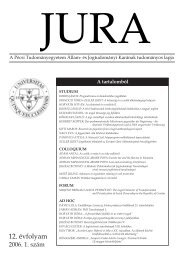
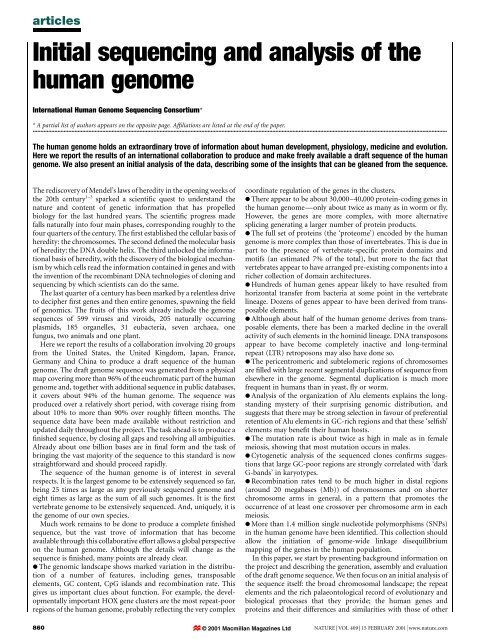
articleswell as targeted regions <strong>of</strong> mammalian <strong>genome</strong>s 34±37 . These projectsshowed that large-scale <strong>sequencing</strong> was feasible <strong>and</strong> developed <strong>the</strong>two-phase paradigm for <strong>genome</strong> <strong>sequencing</strong>. In <strong>the</strong> ®rst, `shotgun',phase, <strong>the</strong> <strong>genome</strong> is divided into appropriately sized segments <strong>and</strong>each segment is covered to a high degree <strong>of</strong> redundancy (typically,eight- to tenfold) through <strong>the</strong> <strong>sequencing</strong> <strong>of</strong> r<strong>and</strong>omly selectedsubfragments. The second is a `®nishing' phase, in which sequencegaps are closed <strong>and</strong> remaining ambiguities are resolved throughdirected <strong>analysis</strong>. The results also showed that complete genomicsequence provided information about genes, regulatory regions <strong>and</strong>chromosome structure that was not readily obtainable from cDNAstudies alone.In 1995, <strong>genome</strong> scientists considered a proposal 38 that wouldhave involved producing a draft <strong>genome</strong> sequence <strong>of</strong> <strong>the</strong> <strong>human</strong><strong>genome</strong> in a ®rst phase <strong>and</strong> <strong>the</strong>n returning to ®nish <strong>the</strong> sequence ina second phase. After vigorous debate, it was decided that such aplan was premature for several reasons. These included <strong>the</strong> need ®rstto prove that high-quality, long-range ®nished sequence could beproduced from most parts <strong>of</strong> <strong>the</strong> complex, repeat-rich <strong>human</strong><strong>genome</strong>; <strong>the</strong> sense that many aspects <strong>of</strong> <strong>the</strong> <strong>sequencing</strong> processwere still rapidly evolving; <strong>and</strong> <strong>the</strong> desirability <strong>of</strong> fur<strong>the</strong>r decreasingcosts.Instead, pilot projects were launched to demonstrate <strong>the</strong> feasibility<strong>of</strong> cost-effective, large-scale <strong>sequencing</strong>, with a target completiondate <strong>of</strong> March 1999. The projects successfully produced®nished sequence with 99.99% accuracy <strong>and</strong> no gaps 39 . They alsointroduced bacterial arti®cial chromosomes (BACs) 40 , a new largeinsertcloning system that proved to be more stable than <strong>the</strong> cosmids<strong>and</strong> yeast arti®cial chromosomes (YACs) 41 that had been usedpreviously. The pilot projects drove <strong>the</strong> maturation <strong>and</strong> convergence<strong>of</strong> <strong>sequencing</strong> strategies, while producing 15% <strong>of</strong> <strong>the</strong> <strong>human</strong><strong>genome</strong> sequence. With successful completion <strong>of</strong> this phase, <strong>the</strong><strong>human</strong> <strong>genome</strong> <strong>sequencing</strong> effort moved into full-scale productionin March 1999.The idea <strong>of</strong> ®rst producing a draft <strong>genome</strong> sequence was revivedat this time, both because <strong>the</strong> ability to ®nish such a sequence was nolonger in doubt <strong>and</strong> because <strong>the</strong>re was great hunger in <strong>the</strong> scienti®ccommunity for <strong>human</strong> sequence data. In addition, some scientistsfavoured prioritizing <strong>the</strong> production <strong>of</strong> a draft <strong>genome</strong> sequenceover regional ®nished sequence because <strong>of</strong> concerns about commercialplans to generate proprietary databases <strong>of</strong> <strong>human</strong> sequencethat might be subject to undesirable restrictions on use 42±44 .The consortium focused on an initial goal <strong>of</strong> producing, in a ®rstproduction phase lasting until June 2000, a draft <strong>genome</strong> sequencecovering most <strong>of</strong> <strong>the</strong> <strong>genome</strong>. Such a draft <strong>genome</strong> sequence,although not completely ®nished, would rapidly allow investigatorsto begin to extract most <strong>of</strong> <strong>the</strong> information in <strong>the</strong> <strong>human</strong> sequence.Experiments showed that <strong>sequencing</strong> clones covering about 90% <strong>of</strong><strong>the</strong> <strong>human</strong> <strong>genome</strong> to a redundancy <strong>of</strong> about four- to ®vefold (`halfshotgun'coverage; see Box 1) would accomplish this 45,46 . The draft<strong>genome</strong> sequence goal has been achieved, as described below.The second sequence production phase is now under way. Itsaims are to achieve full-shotgun coverage <strong>of</strong> <strong>the</strong> existing clonesduring 2001, to obtain clones to ®ll <strong>the</strong> remaining gaps in <strong>the</strong>physical map, <strong>and</strong> to produce a ®nished sequence (apart fromregions that cannot be cloned or sequenced with currently availabletechniques) no later than 2003.Strategic issuesHierarchical shotgun <strong>sequencing</strong>Soon after <strong>the</strong> invention <strong>of</strong> DNA <strong>sequencing</strong> methods 47,48 , <strong>the</strong>shotgun <strong>sequencing</strong> strategy was introduced 49±51 ; it has remained<strong>the</strong> fundamental method for large-scale <strong>genome</strong> <strong>sequencing</strong> 52±54 for<strong>the</strong> past 20 years. The approach has been re®ned <strong>and</strong> extended tomake it more ef®cient. For example, improved protocols forfragmenting <strong>and</strong> cloning DNA allowed construction <strong>of</strong> shotgunlibraries with more uniform representation. The practice <strong>of</strong> <strong>sequencing</strong>from both ends <strong>of</strong> double-str<strong>and</strong>ed clones (`double-barrelled'shotgun <strong>sequencing</strong>) was introduced by Ansorge <strong>and</strong> o<strong>the</strong>rs 37 in1990, allowing <strong>the</strong> use <strong>of</strong> `linking information' between sequencefragments.The application <strong>of</strong> shotgun <strong>sequencing</strong> was also extended byapplying it to larger <strong>and</strong> larger DNA moleculesÐfrom plasmids(, 4 kilobases (kb)) to cosmid clones 37 (40 kb), to arti®cial chromosomescloned in bacteria <strong>and</strong> yeast 55 (100±500 kb) <strong>and</strong> bacterial<strong>genome</strong>s 56 (1±2 megabases (Mb)). In principle, a <strong>genome</strong> <strong>of</strong> arbitrarysize may be directly sequenced by <strong>the</strong> shotgun method,provided that it contains no repeated sequence <strong>and</strong> can be uniformlysampled at r<strong>and</strong>om. The <strong>genome</strong> can <strong>the</strong>n be assembledusing <strong>the</strong> simple computer science technique <strong>of</strong> `hashing' (in whichone detects overlaps by consulting an alphabetized look-up table <strong>of</strong>all k-letter words in <strong>the</strong> data). Ma<strong>the</strong>matical <strong>analysis</strong> <strong>of</strong> <strong>the</strong>expected number <strong>of</strong> gaps as a function <strong>of</strong> coverage is similarlystraightforward 57 .Practical dif®culties arise because <strong>of</strong> repeated sequences <strong>and</strong>cloning bias. Small amounts <strong>of</strong> repeated sequence pose littleproblem for shotgun <strong>sequencing</strong>. For example, one can readilyassemble typical bacterial <strong>genome</strong>s (about 1.5% repeat) or <strong>the</strong>euchromatic portion <strong>of</strong> <strong>the</strong> ¯y <strong>genome</strong> (about 3% repeat). Bycontrast, <strong>the</strong> <strong>human</strong> <strong>genome</strong> is ®lled (. 50%) with repeatedsequences, including interspersed repeats derived from transposableelements, <strong>and</strong> long genomic regions that have been duplicated int<strong>and</strong>em, palindromic or dispersed fashion (see below). Theseinclude large duplicated segments (50±500 kb) with high sequenceidentity (98±99.9%), at which mispairing during recombinationcreates deletions responsible for genetic syndromes. Such featurescomplicate <strong>the</strong> assembly <strong>of</strong> a correct <strong>and</strong> ®nished <strong>genome</strong> sequence.There are two approaches for <strong>sequencing</strong> large repeat-rich<strong>genome</strong>s. The ®rst is a whole-<strong>genome</strong> shotgun <strong>sequencing</strong>approach, as has been used for <strong>the</strong> repeat-poor <strong>genome</strong>s <strong>of</strong> viruses,bacteria <strong>and</strong> ¯ies, using linking information <strong>and</strong> computationalGenomic DNABAC libraryOrganizedmapped largeclone contigsBAC to besequencedShotgunclonesShotgunsequenceAssemblyHierarchical shotgun <strong>sequencing</strong>...ACCGTAAATGGGCTGATCATGCTTAAATGATCATGCTTAAACCCTGTGCATCCTACTG......ACCGTAAATGGGCTGATCATGCTTAAACCCTGTGCATCCTACTG...Figure 2 Idealized representation <strong>of</strong> <strong>the</strong> hierarchical shotgun <strong>sequencing</strong> strategy. Alibrary is constructed by fragmenting <strong>the</strong> target <strong>genome</strong> <strong>and</strong> cloning it into a largefragmentcloning vector; here, BAC vectors are shown. The genomic DNA fragmentsrepresented in <strong>the</strong> library are <strong>the</strong>n organized into a physical map <strong>and</strong> individual BACclones are selected <strong>and</strong> sequenced by <strong>the</strong> r<strong>and</strong>om shotgun strategy. Finally, <strong>the</strong> clonesequences are assembled to reconstruct <strong>the</strong> sequence <strong>of</strong> <strong>the</strong> <strong>genome</strong>.NATURE | VOL 409 | 15 FEBRUARY 2001 | www.nature.com © 2001 Macmillan Magazines Ltd863
articles<strong>analysis</strong> to attempt to avoid misassemblies. The second is <strong>the</strong>`hierarchical shotgun <strong>sequencing</strong>' approach (Fig. 2), also referredto as `map-based', `BAC-based' or `clone-by-clone'. This approachinvolves generating <strong>and</strong> organizing a set <strong>of</strong> large-insert clones(typically 100±200 kb each) covering <strong>the</strong> <strong>genome</strong> <strong>and</strong> separatelyperforming shotgun <strong>sequencing</strong> on appropriately chosen clones.Because <strong>the</strong> sequence information is local, <strong>the</strong> issue <strong>of</strong> long-rangemisassembly is eliminated <strong>and</strong> <strong>the</strong> risk <strong>of</strong> short-range misassemblyis reduced. One caveat is that some large-insert clones may sufferrearrangement, although this risk can be reduced by appropriatequality-control measures involving clone ®ngerprints (see below).The two methods are likely to entail similar costs for producing®nished sequence <strong>of</strong> a mammalian <strong>genome</strong>. The hierarchicalapproach has a higher initial cost than <strong>the</strong> whole-<strong>genome</strong> approach,owing to <strong>the</strong> need to create a map <strong>of</strong> clones (about 1% <strong>of</strong> <strong>the</strong> totalcost <strong>of</strong> <strong>sequencing</strong>) <strong>and</strong> to sequence overlaps between clones. On<strong>the</strong> o<strong>the</strong>r h<strong>and</strong>, <strong>the</strong> whole-<strong>genome</strong> approach is likely to requiremuch greater work <strong>and</strong> expense in <strong>the</strong> ®nal stage <strong>of</strong> producing a®nished sequence, because <strong>of</strong> <strong>the</strong> challenge <strong>of</strong> resolving misassemblies.Both methods must also deal with cloning biases, resulting inunder-representation <strong>of</strong> some regions in ei<strong>the</strong>r large-insert orsmall-insert clone libraries.There was lively scienti®c debate over whe<strong>the</strong>r <strong>the</strong> <strong>human</strong><strong>genome</strong> <strong>sequencing</strong> effort should employ whole-<strong>genome</strong> or hierarchicalshotgun <strong>sequencing</strong>. Weber <strong>and</strong> Myers 58 stimulated <strong>the</strong>sediscussions with a speci®c proposal for a whole-<strong>genome</strong> shotgunapproach, toge<strong>the</strong>r with an <strong>analysis</strong> suggesting that <strong>the</strong> methodcould work <strong>and</strong> be more ef®cient. Green 59 challenged <strong>the</strong>se conclusions<strong>and</strong> argued that <strong>the</strong> potential bene®ts did not outweigh <strong>the</strong>likely risks.In <strong>the</strong> end, we concluded that <strong>the</strong> <strong>human</strong> <strong>genome</strong> <strong>sequencing</strong>effort should employ <strong>the</strong> hierarchical approach for several reasons.First, it was prudent to use <strong>the</strong> approach for <strong>the</strong> ®rst project tosequence a repeat-rich <strong>genome</strong>. With <strong>the</strong> hierarchical approach, <strong>the</strong>ultimate frequency <strong>of</strong> misassembly in <strong>the</strong> ®nished product wouldprobably be lower than with <strong>the</strong> whole-<strong>genome</strong> approach, in whichit would be more dif®cult to identify regions in which <strong>the</strong> assemblywas incorrect.Second, it was prudent to use <strong>the</strong> approach in dealing with anoutbred organism, such as <strong>the</strong> <strong>human</strong>. In <strong>the</strong> whole-<strong>genome</strong> shotgunmethod, sequence would necessarily come from two differentcopies <strong>of</strong> <strong>the</strong> <strong>human</strong> <strong>genome</strong>. Accurate sequence assembly could becomplicated by sequence variation between <strong>the</strong>se two copiesÐbothSNPs (which occur at a rate <strong>of</strong> 1 per 1,300 bases) <strong>and</strong> larger-scalestructural heterozygosity (which has been documented in <strong>human</strong>chromosomes). In <strong>the</strong> hierarchical shotgun method, each largeinsertclone is derived from a single haplotype.Third, <strong>the</strong> hierarchical method would be better able to deal withinevitable cloning biases, because it would more readily allowtargeting <strong>of</strong> additional <strong>sequencing</strong> to under-represented regions.And fourth, it was better suited to a project shared among members<strong>of</strong> a diverse international consortium, because it allowed work <strong>and</strong>responsibility to be easily distributed. As <strong>the</strong> ultimate goal hasalways been to create a high-quality, ®nished sequence to serve as afoundation for biomedical research, we reasoned that <strong>the</strong> advantages<strong>of</strong> this more conservative approach outweighed <strong>the</strong> additionalcost, if any.A biotechnology company, Celera Genomics, has chosen toincorporate <strong>the</strong> whole-<strong>genome</strong> shotgun approach into its ownefforts to sequence <strong>the</strong> <strong>human</strong> <strong>genome</strong>. Their plan 60,61 uses amixed strategy, involving combining some coverage with whole<strong>genome</strong>shotgun data generated by <strong>the</strong> company toge<strong>the</strong>r with <strong>the</strong>publicly available hierarchical shotgun data generated by <strong>the</strong> InternationalHuman Genome Sequencing Consortium. If <strong>the</strong> rawsequence reads from <strong>the</strong> whole-<strong>genome</strong> shotgun component aremade available, it may be possible to evaluate <strong>the</strong> extent to which <strong>the</strong>sequence <strong>of</strong> <strong>the</strong> <strong>human</strong> <strong>genome</strong> can be assembled without <strong>the</strong> needfor clone-based information. Such <strong>analysis</strong> may help to re®ne<strong>sequencing</strong> strategies for o<strong>the</strong>r large <strong>genome</strong>s.Technology for large-scale <strong>sequencing</strong>Sequencing <strong>the</strong> <strong>human</strong> <strong>genome</strong> depended on many technologicalimprovements in <strong>the</strong> production <strong>and</strong> <strong>analysis</strong> <strong>of</strong> sequence data. Keyinnovations were developed both within <strong>and</strong> outside <strong>the</strong> HumanGenome Project. Laboratory innovations included four-colour¯uorescence-based sequence detection 62 , improved ¯uorescentdyes 63±66 , dye-labelled terminators 67 , polymerases speci®callydesigned for <strong>sequencing</strong> 68±70 , cycle <strong>sequencing</strong> 71 <strong>and</strong> capillary gelelectrophoresis 72±74 . These studies contributed to substantialimprovements in <strong>the</strong> automation, quality <strong>and</strong> throughput <strong>of</strong>collecting raw DNA sequence 75,76 . There were also importantadvances in <strong>the</strong> development <strong>of</strong> s<strong>of</strong>tware packages for <strong>the</strong> <strong>analysis</strong><strong>of</strong> sequence data. The PHRED s<strong>of</strong>tware package 77,78 introduced <strong>the</strong>concept <strong>of</strong> assigning a `base-quality score' to each base, on <strong>the</strong> basis<strong>of</strong> <strong>the</strong> probability <strong>of</strong> an erroneous call. These quality scores make itpossible to monitor raw data quality <strong>and</strong> also assist in determiningwhe<strong>the</strong>r two similar sequences truly overlap. The PHRAP computerpackage (http://bozeman.mbt.washington.edu/phrap.docs/phrap.html) <strong>the</strong>n systematically assembles <strong>the</strong> sequence data using <strong>the</strong>base-quality scores. The program assigns `assembly-quality scores'to each base in <strong>the</strong> assembled sequence, providing an objectivecriterion to guide sequence ®nishing. The quality scores were basedon <strong>and</strong> validated by extensive experimental data.Ano<strong>the</strong>r key innovation for scaling up <strong>sequencing</strong> was <strong>the</strong>development by several centres <strong>of</strong> automated methods for samplepreparation. This typically involved creating new biochemicalprotocols suitable for automation, followed by construction <strong>of</strong>appropriate robotic systems.Coordination <strong>and</strong> public data sharingThe Human Genome Project adopted two important principleswith regard to <strong>human</strong> <strong>sequencing</strong>. The ®rst was that <strong>the</strong> collaborationwould be open to centres from any nation. Although potentiallyless ef®cient, in a narrow economic sense, than a centralizedapproach involving a few large factories, <strong>the</strong> inclusive approachwas strongly favoured because we felt that <strong>the</strong> <strong>human</strong> <strong>genome</strong>sequence is <strong>the</strong> common heritage <strong>of</strong> all <strong>human</strong>ity <strong>and</strong> <strong>the</strong> workshould transcend national boundaries, <strong>and</strong> we believed thatscienti®c progress was best assured by a diversity <strong>of</strong> approaches.The collaboration was coordinated through periodic internationalmeetings (referred to as `Bermuda meetings' after <strong>the</strong> venue <strong>of</strong> <strong>the</strong>®rst three ga<strong>the</strong>rings) <strong>and</strong> regular telephone conferences. Work wasshared ¯exibly among <strong>the</strong> centres, with some groups focusing onparticular chromosomes <strong>and</strong> o<strong>the</strong>rs contributing in a <strong>genome</strong>-widefashion.The second principle was rapid <strong>and</strong> unrestricted data release. Thecentres adopted a policy that all genomic sequence data should bemade publicly available without restriction within 24 hours <strong>of</strong>assembly 79,80 . Pre-publication data releases had been pioneered inmapping projects in <strong>the</strong> worm 11 <strong>and</strong> mouse <strong>genome</strong>s 30,81 <strong>and</strong> wereprominently adopted in <strong>the</strong> <strong>sequencing</strong> <strong>of</strong> <strong>the</strong> worm, providing adirect model for <strong>the</strong> <strong>human</strong> <strong>sequencing</strong> efforts. We believed thatscienti®c progress would be most rapidly advanced by immediate<strong>and</strong> free availability <strong>of</strong> <strong>the</strong> <strong>human</strong> <strong>genome</strong> sequence. The explosion<strong>of</strong> scienti®c work based on <strong>the</strong> publicly available sequence data inboth academia <strong>and</strong> industry has con®rmed this judgement.Generating <strong>the</strong> draft <strong>genome</strong> sequenceGenerating a draft sequence <strong>of</strong> <strong>the</strong> <strong>human</strong> <strong>genome</strong> involved threesteps: selecting <strong>the</strong> BAC clones to be sequenced, <strong>sequencing</strong> <strong>the</strong>m<strong>and</strong> assembling <strong>the</strong> individual sequenced clones into an overall draft<strong>genome</strong> sequence. A glossary <strong>of</strong> terms related to <strong>genome</strong> <strong>sequencing</strong><strong>and</strong> assembly is provided in Box 1.The draft <strong>genome</strong> sequence is a dynamic product, which isregularly updated as additional data accumulate en route to <strong>the</strong>864 NATURE | VOL 409 | 15 FEBRUARY 2001 | www.nature.com© 2001 Macmillan Magazines Ltd
articlesultimate goal <strong>of</strong> a completely ®nished sequence. The results beloware based on <strong>the</strong> map <strong>and</strong> sequence data available on 7 October2000, except as o<strong>the</strong>rwise noted. At <strong>the</strong> end <strong>of</strong> this section, weprovide a brief update <strong>of</strong> key data.Clone selectionThe hierarchical shotgun method involves <strong>the</strong> <strong>sequencing</strong> <strong>of</strong> overlappinglarge-insert clones spanning <strong>the</strong> <strong>genome</strong>. For <strong>the</strong> HumanGenome Project, clones were largely chosen from eight large-insertlibraries containing BAC or P1-derived arti®cial chromosome(PAC) clones (Table 1; refs 82±88). The libraries were made bypartial digestion <strong>of</strong> genomic DNA with restriction enzymes.Toge<strong>the</strong>r, <strong>the</strong>y represent around 65-fold coverage (redundant sampling)<strong>of</strong> <strong>the</strong> <strong>genome</strong>. Libraries based on o<strong>the</strong>r vectors, such ascosmids, were also used in early stages <strong>of</strong> <strong>the</strong> project.The libraries (Table 1) were prepared from DNA obtained fromanonymous <strong>human</strong> donors in accordance with US Federal Regulationsfor <strong>the</strong> Protection <strong>of</strong> Human Subjects in Research(45CFR46) <strong>and</strong> following full review by an Institutional ReviewBoard. Brie¯y, <strong>the</strong> opportunity to donate DNA for this purpose wasbroadly advertised near <strong>the</strong> two laboratories engaged in libraryBox 1Genome glossarySequenceRaw sequence Individual unassembled sequence reads, producedby <strong>sequencing</strong> <strong>of</strong> clones containing DNA inserts.Paired-end sequence Raw sequence obtained from both ends <strong>of</strong> acloned insert in any vector, such as a plasmid or bacterial arti®cialchromosome.Finished sequence Complete sequence <strong>of</strong> a clone or <strong>genome</strong>, withan accuracy <strong>of</strong> at least 99.99% <strong>and</strong> no gaps.Coverage (or depth) The average number <strong>of</strong> times a nucleotide isrepresented by a high-quality base in a collection <strong>of</strong> r<strong>and</strong>om rawsequence. Operationally, a `high-quality base' is de®ned as one with anaccuracy <strong>of</strong> at least 99% (corresponding to a PHRED score <strong>of</strong> at least 20).Full shotgun coverage The coverage in r<strong>and</strong>om raw sequenceneeded from a large-insert clone to ensure that it is ready for ®nishing; thisvaries among centres but is typically 8±10-fold. Clones with full shotguncoverage can usually be assembled with only a h<strong>and</strong>ful <strong>of</strong> gaps per100 kb.Half shotgun coverage Half <strong>the</strong> amount <strong>of</strong> full shotgun coverage(typically, 4±5-fold r<strong>and</strong>om coverage).ClonesBAC clone Bacterial arti®cial chromosome vector carrying a genomicDNA insert, typically 100±200 kb. Most <strong>of</strong> <strong>the</strong> large-insert clonessequenced in <strong>the</strong> project were BAC clones.Finished clone A large-insert clone that is entirely represented by®nished sequence.Full shotgun clone A large-insert clone for which full shotgunsequence has been produced.Draft clone A large-insert clone for which roughly half-shotgunsequence has been produced. Operationally, <strong>the</strong> collection <strong>of</strong> draftclones produced by each centre was required to have an averagecoverage <strong>of</strong> fourfold for <strong>the</strong> entire set <strong>and</strong> a minimum coverage <strong>of</strong>threefold for each clone.Predraft clone A large-insert clone for which some shotgunsequence is available, but which does not meet <strong>the</strong> st<strong>and</strong>ards forinclusion in <strong>the</strong> collection <strong>of</strong> draft clones.Contigs <strong>and</strong> scaffoldsContig The result <strong>of</strong> joining an overlapping collection <strong>of</strong> sequences orclones.Scaffold The result <strong>of</strong> connecting contigs by linking information frompaired-end reads from plasmids, paired-end reads from BACs, knownmessenger RNAs or o<strong>the</strong>r sources. The contigs in a scaffold are ordered<strong>and</strong> oriented with respect to one ano<strong>the</strong>r.Fingerprint clone contigs Contigs produced by joining clonesinferred to overlap on <strong>the</strong> basis <strong>of</strong> <strong>the</strong>ir restriction digest ®ngerprints.Sequenced-clone layout Assignment <strong>of</strong> sequenced clones to <strong>the</strong>physical map <strong>of</strong> ®ngerprint clone contigs.<strong>Initial</strong> sequence contigs Contigs produced by merging overlappingsequence reads obtained from a single clone, in a process calledsequence assembly.Merged sequence contigs Contigs produced by taking <strong>the</strong> initialsequence contigs contained in overlapping clones <strong>and</strong> merging thosefound to overlap. These are also referred to simply as `sequence contigs'where no confusion will result.Sequence-contig scaffolds Scaffolds produced by connectingsequence contigs on <strong>the</strong> basis <strong>of</strong> linking information.Sequenced-clone contigs Contigs produced by merging overlappingsequenced clones.Sequenced-clone-contig scaffolds Scaffolds produced by joiningsequenced-clone contigs on <strong>the</strong> basis <strong>of</strong> linking information.Draft <strong>genome</strong> sequence The sequence produced by combining<strong>the</strong> information from <strong>the</strong> individual sequenced clones (by creatingmerged sequence contigs <strong>and</strong> <strong>the</strong>n employing linking information tocreate scaffolds) <strong>and</strong> positioning <strong>the</strong> sequence along <strong>the</strong> physical map <strong>of</strong><strong>the</strong> chromosomes.N50 length A measure <strong>of</strong> <strong>the</strong> contig length (or scaffold length)containing a `typical' nucleotide. Speci®cally, it is <strong>the</strong> maximum length Lsuch that 50% <strong>of</strong> all nucleotides lie in contigs (or scaffolds) <strong>of</strong> size at least L.Computer programs <strong>and</strong> databasesPHRED A widely used computer program that analyses raw sequenceto produce a `base call' with an associated `quality score' for eachposition in <strong>the</strong> sequence. A PHRED quality score <strong>of</strong> X corresponds to anerror probability <strong>of</strong> approximately 10 - X/10 . Thus, a PHRED quality score <strong>of</strong>30 corresponds to 99.9% accuracy for <strong>the</strong> base call in <strong>the</strong> raw read.PHRAP A widely used computer program that assembles rawsequence into sequence contigs <strong>and</strong> assigns to each position in <strong>the</strong>sequence an associated `quality score', on <strong>the</strong> basis <strong>of</strong> <strong>the</strong> PHREDscores <strong>of</strong> <strong>the</strong> raw sequence reads. A PHRAP quality score <strong>of</strong> Xcorresponds to an error probability <strong>of</strong> approximately 10 - X/10 . Thus, aPHRAP quality score <strong>of</strong> 30 corresponds to 99.9% accuracy for a base in<strong>the</strong> assembled sequence.GigAssembler A computer program developed during this projectfor merging <strong>the</strong> information from individual sequenced clones into a draft<strong>genome</strong> sequence.Public sequence databases The three coordinated internationalsequence databases: GenBank, <strong>the</strong> EMBL data library <strong>and</strong> DDBJ.Map featuresSTS Sequence tagged site, corresponding to a short (typically lessthan 500 bp) unique genomic locus for which a polymerase chainreaction assay has been developed.EST Expressed sequence tag, obtained by performing a single rawsequence read from a r<strong>and</strong>om complementary DNA clone.SSR Simple sequence repeat, a sequence consisting largely <strong>of</strong> at<strong>and</strong>em repeat <strong>of</strong> a speci®c k-mer (such as (CA) 15 ). Many SSRs arepolymorphic <strong>and</strong> have been widely used in genetic mapping.SNP Single nucleotide polymorphism, or a single nucleotide position in<strong>the</strong> <strong>genome</strong> sequence for which two or more alternative alleles arepresent at appreciable frequency (traditionally, at least 1%) in <strong>the</strong> <strong>human</strong>population.Genetic map A <strong>genome</strong> map in which polymorphic loci arepositioned relative to one ano<strong>the</strong>r on <strong>the</strong> basis <strong>of</strong> <strong>the</strong> frequency withwhich <strong>the</strong>y recombine during meiosis. The unit <strong>of</strong> distance iscentimorgans (cM), denoting a 1% chance <strong>of</strong> recombination.Radiation hybrid (RH) map A <strong>genome</strong> map in which STSs arepositioned relative to one ano<strong>the</strong>r on <strong>the</strong> basis <strong>of</strong> <strong>the</strong> frequency withwhich <strong>the</strong>y are separated by radiation-induced breaks. The frequency isassayed by analysing a panel <strong>of</strong> <strong>human</strong>±hamster hybrid cell lines, eachproduced by lethally irradiating <strong>human</strong> cells <strong>and</strong> fusing <strong>the</strong>m withrecipient hamster cells such that each carries a collection <strong>of</strong> <strong>human</strong>chromosomal fragments. The unit <strong>of</strong> distance is centirays (cR), denotinga 1% chance <strong>of</strong> a break occuring between two loci.NATURE | VOL 409 | 15 FEBRUARY 2001 | www.nature.com © 2001 Macmillan Magazines Ltd865
articlesconstruction. Volunteers <strong>of</strong> diverse backgrounds were accepted on a®rst-come, ®rst-taken basis. Samples were obtained after discussionwith a genetic counsellor <strong>and</strong> written informed consent. Thesamples were made anonymous as follows: <strong>the</strong> sampling laboratorystripped all identi®ers from <strong>the</strong> samples, applied r<strong>and</strong>om numericlabels, <strong>and</strong> transferred <strong>the</strong>m to <strong>the</strong> processing laboratory, which<strong>the</strong>n removed all labels <strong>and</strong> relabelled <strong>the</strong> samples. All records <strong>of</strong> <strong>the</strong>labelling were destroyed. The processing laboratory chose samplesat r<strong>and</strong>om from which to prepare DNA <strong>and</strong> immortalized cell lines.Around 5±10 samples were collected for every one that waseventually used. Because no link was retained between donor <strong>and</strong>DNA sample, <strong>the</strong> identity <strong>of</strong> <strong>the</strong> donors for <strong>the</strong> libraries is notknown, even by <strong>the</strong> donors <strong>the</strong>mselves. A more complete descriptioncan be found at http://www.nhgri.nih.gov/Grant_info/Funding/Statements/RFA/<strong>human</strong>_subjects.html.During <strong>the</strong> pilot phase, centres showed that sequence-tagged sites(STSs) from previously constructed genetic <strong>and</strong> physical mapscould be used to recover BACs from speci®c regions. As <strong>sequencing</strong>exp<strong>and</strong>ed, some centres continued this approach, augmented withadditional probes from ¯ow sorting <strong>of</strong> chromosomes to obtainlong-range coverage <strong>of</strong> speci®c chromosomes or chromosomalregions 89±94 .For <strong>the</strong> large-scale sequence production phase, a <strong>genome</strong>-widephysical map <strong>of</strong> overlapping clones was also constructed by systematic<strong>analysis</strong> <strong>of</strong> BAC clones representing 20-fold coverage <strong>of</strong> <strong>the</strong><strong>human</strong> <strong>genome</strong> 86 . Most clones came from <strong>the</strong> ®rst three sections <strong>of</strong><strong>the</strong> RPCI-11 library, supplemented with clones from sections <strong>of</strong> <strong>the</strong>RPCI-13 <strong>and</strong> CalTech D libraries (Table 1). DNA from each BACclone was digested with <strong>the</strong> restriction enzyme HindIII, <strong>and</strong> <strong>the</strong> sizes<strong>of</strong> <strong>the</strong> resulting fragments were measured by agarose gel electrophoresis.The pattern <strong>of</strong> restriction fragments provides a `®ngerprint'for each BAC, which allows different BACs to be distinguished<strong>and</strong> <strong>the</strong> degree <strong>of</strong> overlaps to be assessed. We used <strong>the</strong>se restrictionfragment®ngerprints to determine clone overlaps, <strong>and</strong> <strong>the</strong>rebyassembled <strong>the</strong> BACs into ®ngerprint clone contigs.The ®ngerprint clone contigs were positioned along <strong>the</strong> chromosomesby anchoring <strong>the</strong>m with STS markers from existing genetic<strong>and</strong> physical maps. Fingerprint clone contigs were tied to speci®cSTSs initially by probe hybridization <strong>and</strong> later by direct search <strong>of</strong> <strong>the</strong>sequenced clones. To localize ®ngerprint clone contigs that did notcontain known markers, new STSs were generated <strong>and</strong> placed ontochromosomes 95 . Representative clones were also positioned by ¯uorescencein situ hybridization (FISH) (ref. 86 <strong>and</strong> C. McPherson,unpublished).We selected clones from <strong>the</strong> ®ngerprint clone contigs for <strong>sequencing</strong>according to various criteria. Fingerprint data werereviewed 86,90 to evaluate overlaps <strong>and</strong> to assess clone ®delity (tobias against rearranged clones 83,96 ). STS content information <strong>and</strong>BAC end sequence information were also used 91,92 . Where possible,we tried to select a minimally overlapping set spanning a region.However, because <strong>the</strong> <strong>genome</strong>-wide physical map was constructedconcurrently with <strong>the</strong> <strong>sequencing</strong>, continuity in many regions waslow in early stages. These small ®ngerprint clone contigs werenone<strong>the</strong>less useful in identifying validated, nonredundant clonesTable 1 Key large-insert <strong>genome</strong>-wide librariesLibrary name*GenBankabbreviationVectortypeSource DNALibrarysegment orplatenumbersEnzymedigestAverageinsert size(kb)Total number<strong>of</strong> clones inlibraryNumber <strong>of</strong>®ngerprintedclones²BAC-endsequence(ends/clones/clones withboth endssequenced)³Number <strong>of</strong>clones in<strong>genome</strong>layout§Sequenced clones used inconstruction <strong>of</strong> <strong>the</strong> draft <strong>genome</strong>sequenceNumberkTotal bases(Mb)Fraction <strong>of</strong>total fromlibraryCaltech B CTB BAC 987SK cells All HindIII 120 74,496 16 2/1/1 528 518 66.7 0.016Caltech C CTC BAC HumanspermAll HindIII 125 263,040 144 21,956/14,445/7,255621 606 88.4 0.021Caltech D1(CITB-H1)Caltech D2(CITB-E1)CTD BAC HumanspermBACHumanspermAll HindIII 129 162,432 49,833 403,589/226,068/156,631All1,381 1,367 185.6 0.0432,501±2,565 EcoRI 202 24,9602,566±2,671 EcoRI 182 46,3263,000±3,253 EcoRI 142 97,536RPCI-1 RP1 PAC Male, blood All MboI 110 115,200 3,388 1,070 1,053 117.7 0.028RPCI-3 RP3 PAC Male, blood All MboI 115 75,513 644 638 68.5 0.016RPCI-4 RP4 PAC Male, blood All MboI 116 105,251 889 881 95.5 0.022RPCI-5 RP5 PAC Male, blood All MboI 115 142,773 1,042 1,033 116.5 0.027RPCI-11 RP11 BAC Male, blood All 178 543,797 267,931 379,773/ 19,405 19,145 3,165.0 0.743243,764/134,1101 EcoRI 164 108,4992 EcoRI 168 109,4963 EcoRI 181 109,6574 EcoRI 183 109,3825 MboI 196 106,763Total <strong>of</strong> topeight libraries1,482,502 321,312 805,320/484,278/297,99725,580 25,241 3,903.9 0.916Total all libraries 354,510 812,594/ 30,445 29,298 4,260.5 1488,017/100,775...................................................................................................................................................................................................................................................................................................................................................................* For <strong>the</strong> CalTech libraries 82 , see http://www.tree.caltech.edu/lib_status.html; for RPCI libraries 83 , see http://www.chori.org/bacpac/home.htm.² For <strong>the</strong> FPC map <strong>and</strong> ®ngerprinting 84±86 , see http://<strong>genome</strong>.wustl.edu/gsc/<strong>human</strong>/<strong>human</strong>_database.shtml.³ The number <strong>of</strong> raw BAC end sequences (clones/ends/clones with both ends sequenced) available for use in <strong>human</strong> <strong>genome</strong> <strong>sequencing</strong>. Typically, for clones in which sequence was obtained from bo<strong>the</strong>nds, more than 95% <strong>of</strong> both end sequences contained at least 100 bp <strong>of</strong> nonrepetitive sequence. BAC-end <strong>sequencing</strong> <strong>of</strong> RPCI-11 <strong>and</strong> <strong>of</strong> <strong>the</strong> CalTech libraries was done at The Institute for GenomicResearch, <strong>the</strong> California Institute <strong>of</strong> Technology <strong>and</strong> <strong>the</strong> University <strong>of</strong> Washington High Throughput Sequencing Center. The sources for <strong>the</strong> Table were http://www.ncbi.nlm.nih.gov/<strong>genome</strong>/clone/BESstat.shtml <strong>and</strong> refs 87, 88.§ These are <strong>the</strong> clones in <strong>the</strong> sequenced-clone layout map (http://<strong>genome</strong>.wustl.edu/gsc/<strong>human</strong>/Mapping/index.shtml) that were pre-draft, draft or ®nished.k The number <strong>of</strong> sequenced clones used in <strong>the</strong> assembly. This number is less than that in <strong>the</strong> previous column owing to removal <strong>of</strong> a small number <strong>of</strong> obviously contaminated, combined or duplicatedprojects; in addition, not all <strong>of</strong> <strong>the</strong> clones from completed chromosomes 21 <strong>and</strong> 22 were included here because only <strong>the</strong> available ®nished sequence from those chromosomes was used in <strong>the</strong> assembly. The number reported is <strong>the</strong> total sequence from <strong>the</strong> clones indicated in <strong>the</strong> previous column. Potential overlap between clones was not removed here, but Ns were excluded.866 © 2001 Macmillan Magazines Ltd NATURE | VOL 409 | 15 FEBRUARY 2001 | www.nature.com
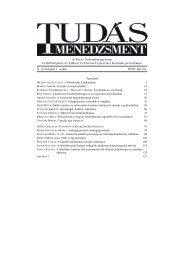
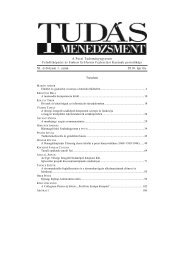
articlesthat were used to `seed' <strong>the</strong> <strong>sequencing</strong> <strong>of</strong> new regions. The small®ngerprint clone contigs were extended or merged with o<strong>the</strong>rs as<strong>the</strong> map matured.The clones that make up <strong>the</strong> draft <strong>genome</strong> sequence <strong>the</strong>refore donot constitute a minimally overlapping setÐ<strong>the</strong>re is overlap <strong>and</strong>redundancy in places. The cost <strong>of</strong> using suboptimal overlaps wasjusti®ed by <strong>the</strong> bene®t <strong>of</strong> earlier availability <strong>of</strong> <strong>the</strong> draft <strong>genome</strong>sequence data. Minimizing <strong>the</strong> overlap between adjacent cloneswould have required completing <strong>the</strong> physical map before undertakinglarge-scale <strong>sequencing</strong>. In addition, <strong>the</strong> overlaps betweenBAC clones provide a rich collection <strong>of</strong> SNPs. More than 1.4 millionSNPs have already been identi®ed from clone overlaps <strong>and</strong> o<strong>the</strong>rsequence comparisons 97 .Because <strong>the</strong> <strong>sequencing</strong> project was shared among twenty centresin six countries, it was important to coordinate selection <strong>of</strong> clonesacross <strong>the</strong> centres. Most centres focused on particular chromosomesor, in some cases, larger regions <strong>of</strong> <strong>the</strong> <strong>genome</strong>. We also maintaineda clone registry to track selected clones <strong>and</strong> <strong>the</strong>ir progress. In laterphases, <strong>the</strong> global map provided an integrated view <strong>of</strong> <strong>the</strong> data fromall centres, facilitating <strong>the</strong> distribution <strong>of</strong> effort to maximize coverage<strong>of</strong> <strong>the</strong> <strong>genome</strong>. Before performing extensive <strong>sequencing</strong> on aFigure 3 The automated production line for sample preparation at <strong>the</strong> WhiteheadInstitute, Center for Genome Research. The system consists <strong>of</strong> custom-designed factorystyleconveyor belt robots that perform all functions from purifying DNA from bacterialcultures through setting up <strong>and</strong> purifying <strong>sequencing</strong> reactions.Sequence (Mb)5,0004,5004,0003,5003,0002,5002,0001,5001,0005000Jan-96Apr-96Jul-96FinishedUnfinished (draft <strong>and</strong> pre-draft)Oct-96Jan-97Apr-97Jul-97Oct-97Jan-98Apr-98MonthJul-98Oct-98Jan-99Apr-99Jul-99Oct-99Jan-00Apr-00Jul-00Oct-00Figure 4 Total amount <strong>of</strong> <strong>human</strong> sequence in <strong>the</strong> High Throughput Genome Sequence(HTGS) division <strong>of</strong> GenBank. The total is <strong>the</strong> sum <strong>of</strong> ®nished sequence (red) <strong>and</strong> un®nished(draft plus predraft) sequence (yellow).clone, several centres routinely examined an initial sample <strong>of</strong> 96 rawsequence reads from each subclone library to evaluate possibleoverlap with previously sequenced clones.SequencingThe selected clones were subjected to shotgun <strong>sequencing</strong>. Although<strong>the</strong> basic approach <strong>of</strong> shotgun <strong>sequencing</strong> is well established, <strong>the</strong>details <strong>of</strong> implementation varied among <strong>the</strong> centres. For example,<strong>the</strong>re were differences in <strong>the</strong> average insert size <strong>of</strong> <strong>the</strong> shotgunlibraries, in <strong>the</strong> use <strong>of</strong> single-str<strong>and</strong>ed or double-str<strong>and</strong>ed cloningvectors, <strong>and</strong> in <strong>sequencing</strong> from one end or both ends <strong>of</strong> each insert.Centres differed in <strong>the</strong> ¯uorescent labels employed <strong>and</strong> in <strong>the</strong> degreeto which <strong>the</strong>y used dye-primers or dye-terminators. The sequencedetectors included both slab gel- <strong>and</strong> capillary-based devices.Detailed protocols are available on <strong>the</strong> web sites <strong>of</strong> many <strong>of</strong> <strong>the</strong>individual centres (URLs can be found at www.nhgri.nih.gov/<strong>genome</strong>_hub). The extent <strong>of</strong> automation also varied greatlyamong <strong>the</strong> centres, with <strong>the</strong> most aggressive automation effortsresulting in factory-style systems able to process more than 100,000<strong>sequencing</strong> reactions in 12 hours (Fig. 3). In addition, centresdiffered in <strong>the</strong> amount <strong>of</strong> raw sequence data typically obtained foreach clone (so-called half-shotgun, full shotgun <strong>and</strong> ®nishedsequence). Sequence information from <strong>the</strong> different centres couldbe directly integrated despite this diversity, because <strong>the</strong> data wereanalysed by a common computational procedure. Raw sequencetraces were processed <strong>and</strong> assembled with <strong>the</strong> PHRED <strong>and</strong> PHRAPs<strong>of</strong>tware packages 77,78 (P. Green, unpublished). All assembled contigs<strong>of</strong> more than 2 kb were deposited in public databases within24 hours <strong>of</strong> assembly.The overall <strong>sequencing</strong> output rose sharply during production(Fig. 4). Following installation <strong>of</strong> new sequence detectors beginningin June 1999, <strong>sequencing</strong> capacity <strong>and</strong> output rose approximatelyeightfold in eight months to nearly 7 million samples processed permonth, with little or no drop in success rate (ratio <strong>of</strong> useable readsto attempted reads). By June 2000, <strong>the</strong> centres were producing rawsequence at a rate equivalent to onefold coverage <strong>of</strong> <strong>the</strong> entire<strong>human</strong> <strong>genome</strong> in less than six weeks. This corresponded to acontinuous throughput exceeding 1,000 nucleotides per second,24 hours per day, seven days per week. This scale-up resulted in aconcomitant increase in <strong>the</strong> sequence available in <strong>the</strong> publicdatabases (Fig. 4).A version <strong>of</strong> <strong>the</strong> draft <strong>genome</strong> sequence was prepared on <strong>the</strong> basis<strong>of</strong> <strong>the</strong> map <strong>and</strong> sequence data available on 7 October 2000. For thisversion, <strong>the</strong> mapping effort had assembled <strong>the</strong> ®ngerprinted BACsinto 1,246 ®ngerprint clone contigs. The <strong>sequencing</strong> effort hadsequenced <strong>and</strong> assembled 29,298 overlapping BACs <strong>and</strong> o<strong>the</strong>r largeinsertclones (Table 2), comprising a total length <strong>of</strong> 4.26 gigabases(Gb). This resulted from around 23 Gb <strong>of</strong> underlying raw shotgunsequence data, or about 7.5-fold coverage averaged across <strong>the</strong><strong>genome</strong> (including both draft <strong>and</strong> ®nished sequence). The variouscontributions to <strong>the</strong> total amount <strong>of</strong> sequence deposited in <strong>the</strong>HTGS division <strong>of</strong> GenBank are given in Table 3.Table 2 Total <strong>genome</strong> sequence from <strong>the</strong> collection <strong>of</strong> sequenced clones, bysequence statusSequencestatusNumber <strong>of</strong>clonesTotal clonelength (Mb)Averagenumber <strong>of</strong>sequencereads per kb*Averagesequencedepth²Total amount<strong>of</strong> rawsequence (Mb)Finished 8,277 897 20±25 8±12 9,085Draft 18,969 3,097 12 4.5 13,395Predraft 2,052 267 6 2.5 667Total 23,147.............................................................................................................................................................................* The average number <strong>of</strong> reads per kb was estimated based on information provided by each<strong>sequencing</strong> centre. This number differed among <strong>sequencing</strong> centres, based on <strong>the</strong> actual protocolsused.² The average depth in high quality bases ($99% accuracy) was estimated from informationprovided by each <strong>sequencing</strong> centre. The average varies among <strong>the</strong> centres, <strong>and</strong> <strong>the</strong> number mayvary considerably for clones with <strong>the</strong> same <strong>sequencing</strong> status. For draft clones in <strong>the</strong> publicdatabases (keyword: HTGS_draft), <strong>the</strong> number can be computed from <strong>the</strong> quality scores listed in<strong>the</strong> database entry.NATURE | VOL 409 | 15 FEBRUARY 2001 | www.nature.com © 2001 Macmillan Magazines Ltd867
articlesBy agreement among <strong>the</strong> centres, <strong>the</strong> collection <strong>of</strong> draft clonesproduced by each centre was required to have fourfold averagesequence coverage, with no clone below threefold. (For this purpose,sequence coverage was de®ned as <strong>the</strong> average number <strong>of</strong> timesthat each base was independently read with a base-quality scorecorresponding to at least 99% accuracy.) We attained an overallaverage <strong>of</strong> 4.5-fold coverage across <strong>the</strong> <strong>genome</strong> for draft clones. Afew <strong>of</strong> <strong>the</strong> sequenced clones fell below <strong>the</strong> minimum <strong>of</strong> threefoldsequence coverage or have not been formally designated by centresas meeting draft st<strong>and</strong>ards; <strong>the</strong>se are referred to as predraft (Table 2).Some <strong>of</strong> <strong>the</strong>se are clones that span remaining gaps in <strong>the</strong> draft<strong>genome</strong> sequence <strong>and</strong> were in <strong>the</strong> process <strong>of</strong> being sequenced on 7October 2000; a few are old submissions from centres that are nolonger active.The lengths <strong>of</strong> <strong>the</strong> initial sequence contigs in <strong>the</strong> draft clones varyas a function <strong>of</strong> coverage, but half <strong>of</strong> all nucleotides reside in initialsequence contigs <strong>of</strong> at least 21.7 kb (see below). Various properties<strong>of</strong> <strong>the</strong> draft clones can be assessed from instances in which <strong>the</strong>re wassubstantial overlap between a draft clone <strong>and</strong> a ®nished (or nearly®nished) clone. By examining <strong>the</strong> sequence alignments in <strong>the</strong>overlap regions, we estimated that <strong>the</strong> initial sequence contigs in adraft sequence clone cover an average <strong>of</strong> about 96% <strong>of</strong> <strong>the</strong> clone <strong>and</strong>are separated by gaps with an average size <strong>of</strong> about 500 bp.Although <strong>the</strong> main emphasis was on producing a draft <strong>genome</strong>sequence, <strong>the</strong> centres also maintained sequence ®nishing activitiesduring this period, leading to a tw<strong>of</strong>old increase in ®nishedsequence from June 1999 to June 2000 (Fig. 4). The total amount<strong>of</strong> <strong>human</strong> sequence in this ®nal form stood at more than 835 Mb on7 October 2000, or more than 25% <strong>of</strong> <strong>the</strong> <strong>human</strong> <strong>genome</strong>. Thisincludes <strong>the</strong> ®nished sequences <strong>of</strong> chromosomes 21 <strong>and</strong> 22 (refs 93,94). As centres have begun to shift from draft to ®nished <strong>sequencing</strong>in <strong>the</strong> last quarter <strong>of</strong> 2000, <strong>the</strong> production <strong>of</strong> ®nished sequence hasincreased to an annualized rate <strong>of</strong> 1 Gb per year <strong>and</strong> is continuing torise.Table 3 Total <strong>human</strong> sequence deposited in <strong>the</strong> HTGS division <strong>of</strong> GenBankSequencing centreTotal <strong>human</strong>sequence (kb)Finished <strong>human</strong>sequence (kb)Whitehead Institute, Center for Genome Research* 1,196,888 46,560The Sanger Centre* 970,789 284,353Washington University Genome Sequencing Center* 765,898 175,279US DOE Joint Genome Institute 377,998 78,486Baylor College <strong>of</strong> Medicine Human Genome Sequencing 345,125 53,418CenterRIKEN Genomic Sciences Center 203,166 16,971Genoscope 85,995 48,808GTC Sequencing Center 71,357 7,014Department <strong>of</strong> Genome Analysis, Institute <strong>of</strong> Molecular 49,865 17,788BiotechnologyBeijing Genomics Institute/Human Genome Center 42,865 6,297Multimegabase Sequencing Center; Institute for Systems 31,241 9,676BiologyStanford Genome Technology Center 29,728 3,530The Stanford Human Genome Center <strong>and</strong> Department <strong>of</strong> 28,162 9,121GeneticsUniversity <strong>of</strong> Washington Genome Center 24,115 14,692Keio University 17,364 13,058University <strong>of</strong> Texas Southwestern Medical Center at Dallas 11,670 7,028University <strong>of</strong> Oklahoma Advanced Center for Genome 10,071 9,155TechnologyMax Planck Institute for Molecular Genetics 7,650 2,940GBF ± German Research Centre for Biotechnology 4,639 2,338Cold Spring Harbor Laboratory Lita Annenberg Hazen 4,338 2,104Genome CenterO<strong>the</strong>r 59,574 35,911Total 4,338,224 842,027.............................................................................................................................................................................Total <strong>human</strong> sequence deposited in GenBank by members <strong>of</strong> <strong>the</strong> International Human GenomeSequencing Consortium, as <strong>of</strong> 8 October 2000.The amount <strong>of</strong> total sequence (®nished plus draftplus predraft) is shown in <strong>the</strong> second column <strong>and</strong> <strong>the</strong> amount <strong>of</strong> ®nished sequence is shown in<strong>the</strong> third column. Total sequence differs from totals in Tables 1 <strong>and</strong> 2 because <strong>of</strong> inclusion <strong>of</strong>padding characters <strong>and</strong> <strong>of</strong> some clones not used in assembly. HTGS, high throughput <strong>genome</strong>sequence.*These three centres produced an additional 2.4 Gb <strong>of</strong> raw plasmid paired-end reads (see Table 4),consisting <strong>of</strong> 0.99 Gb from Whitehead Institute, 0.66 Gb from The Sanger Centre <strong>and</strong> 0.75 Gb fromWashington University.In addition to <strong>sequencing</strong> large-insert clones, three centresgenerated a large collection <strong>of</strong> r<strong>and</strong>om raw sequence reads fromwhole-<strong>genome</strong> shotgun libraries (Table 4; ref. 98). These 5.77million successful sequences contained 2.4 Gb <strong>of</strong> high-qualitybases; this corresponds to about 0.75-fold coverage <strong>and</strong> would bestatistically expected to include about 50% <strong>of</strong> <strong>the</strong> nucleotides in <strong>the</strong><strong>human</strong> <strong>genome</strong> (data available at http://snp.cshl.org/data). Theprimary objective <strong>of</strong> this work was to discover SNPs, by comparing<strong>the</strong>se r<strong>and</strong>om raw sequences (which came from different individuals)with <strong>the</strong> draft <strong>genome</strong> sequence. However, many <strong>of</strong> <strong>the</strong>se rawsequences were obtained from both ends <strong>of</strong> plasmid clones <strong>and</strong><strong>the</strong>reby also provided valuable `linking' information that was usedin sequence assembly. In addition, <strong>the</strong> r<strong>and</strong>om raw sequencesprovide sequence coverage <strong>of</strong> about half <strong>of</strong> <strong>the</strong> nucleotides not yetrepresented in <strong>the</strong> sequenced large-insert clones; <strong>the</strong>se can be usedas probes for portions <strong>of</strong> <strong>the</strong> <strong>genome</strong> not yet recovered.Assembly <strong>of</strong> <strong>the</strong> draft <strong>genome</strong> sequenceWe <strong>the</strong>n set out to assemble <strong>the</strong> sequences from <strong>the</strong> individual largeinsertclones into an integrated draft sequence <strong>of</strong> <strong>the</strong> <strong>human</strong><strong>genome</strong>. The assembly process had to resolve problems arisingfrom <strong>the</strong> draft nature <strong>of</strong> much <strong>of</strong> <strong>the</strong> sequence, from <strong>the</strong> variety <strong>of</strong>clone sources, <strong>and</strong> from <strong>the</strong> high fraction <strong>of</strong> repeated sequences in<strong>the</strong> <strong>human</strong> <strong>genome</strong>. This process involved three steps: ®ltering,layout <strong>and</strong> merging.The entire data set was ®ltered uniformly to eliminate contaminationfrom non<strong>human</strong> sequences <strong>and</strong> o<strong>the</strong>r artefacts that had notalready been removed by <strong>the</strong> individual centres. (Information aboutcontamination was also sent back to <strong>the</strong> centres, which are updating<strong>the</strong> individual entries in <strong>the</strong> public databases.) We also identi®edinstances in which <strong>the</strong> sequence data from one BAC clone wassubstantially contaminated with sequence data from ano<strong>the</strong>r(<strong>human</strong> or non<strong>human</strong>) clone. The problems were resolved inmost instances; 231 clones remained unresolved, <strong>and</strong> <strong>the</strong>se wereeliminated from <strong>the</strong> assembly reported here. Instances <strong>of</strong> lowerlevels <strong>of</strong> cross-contamination (for example, a single 96-well microplatemisassigned to <strong>the</strong> wrong BAC) are more dif®cult to detect;some undoubtedly remain <strong>and</strong> may give rise to small spurioussequence contigs in <strong>the</strong> draft <strong>genome</strong> sequence. Such issues arereadily resolved as <strong>the</strong> clones progress towards ®nished sequence,but <strong>the</strong>y necessitate some caution in certain applications <strong>of</strong> <strong>the</strong>current data.The sequenced clones were <strong>the</strong>n associated with speci®c clones on<strong>the</strong> physical map to produce a `layout'. In principle, sequencedclones that correspond to ®ngerprinted BACs could be directlyassigned by name to ®ngerprint clone contigs on <strong>the</strong> ®ngerprintbasedphysical map. In practice, however, laboratory mixups occasionallyresulted in incorrect assignments. To eliminate such problems,sequenced clones were associated with <strong>the</strong> ®ngerprint clonecontigs in <strong>the</strong> physical map by using <strong>the</strong> sequence data to calculate aTable 4 Plasmid paired-end readsTotal reads deposited* Read pairs² Size range <strong>of</strong> inserts(kb)R<strong>and</strong>om-sheared 3,227,685 1,155,284 1.8±6Enzyme digest 2,539,222 761,010 0.8±4.7Total 5,766,907 1,916,294.............................................................................................................................................................................The plasmid paired-end reads used a mixture <strong>of</strong> DNA from a set <strong>of</strong> 24 samples from <strong>the</strong> DNAPolymorphism Discovery Resource (http://locus.umdnj.edu/nigms/pdr.html). This set <strong>of</strong> 24 anonymousUS residents contains samples from European-Americans, African-Americans, Mexican-Americans, Native Americans <strong>and</strong> Asian-Americans, although <strong>the</strong> ethnicities <strong>of</strong> <strong>the</strong> individualsamples are not identi®ed. Informed consent to contribute samples to <strong>the</strong> DNA PolymorphismDiscovery Resource was obtained from all 450 individuals who contributed samples. Samples from<strong>the</strong> European-American, African-American <strong>and</strong> Mexican-American individuals came from NHANES(http://www.cdc.gov/nchs/nhanes.htm); individuals were recontacted to obtain <strong>the</strong>ir consent for<strong>the</strong> Resource project. New samples were obtained from Asian-Americans whose ancestry wasfrom a variety <strong>of</strong> East <strong>and</strong> South Asian countries. New samples were also obtained for <strong>the</strong> NativeAmericans; tribal permission was obtained ®rst, <strong>and</strong> <strong>the</strong>n individual consents. See http://www.nhgri.nih.gov/Grant_info/Funding/RFA/discover_polymorphisms.html <strong>and</strong> ref. 98.*Re¯ects data deposited with <strong>and</strong> released by The SNP Consortium (see http://snp.cshl.org/data).² Read pairs represents <strong>the</strong> number <strong>of</strong> cases in which sequence from both ends <strong>of</strong> a genomiccloned fragment was determined <strong>and</strong> used in this study as linking information.868 © 2001 Macmillan Magazines Ltd NATURE | VOL 409 | 15 FEBRUARY 2001 | www.nature.com
articlesFingerprint clone contigPick clones for <strong>sequencing</strong>ABSequenced-clone contigSequenced clone ASequenced-clone-contig scaffoldSequence to at least draft coverageMerge dataSequenced clone B<strong>Initial</strong> sequence contigMerged sequence contigOrder <strong>and</strong> orient with mRNA, paired end reads, o<strong>the</strong>r informationSequence-contig scaffoldFigure 7 Levels <strong>of</strong> clone <strong>and</strong> sequence coverage. A `®ngerprint clone contig' isassembled by using <strong>the</strong> computer program FPC 84,451 to analyse <strong>the</strong> restriction enzymedigestion patterns <strong>of</strong> many large-insert clones. Clones are <strong>the</strong>n selected for <strong>sequencing</strong> tominimize overlap between adjacent clones. For a clone to be selected, all <strong>of</strong> its restrictionenzyme fragments (except <strong>the</strong> two vector-insert junction fragments) must be shared withat least one <strong>of</strong> its neighbours on each side in <strong>the</strong> contig. Once <strong>the</strong>se overlapping cloneshave been sequenced, <strong>the</strong> set is a `sequenced-clone contig'. When all selected clonesfrom a ®ngerprint clone contig have been sequenced, <strong>the</strong> sequenced-clone contig will be<strong>the</strong> same as <strong>the</strong> ®ngerprint clone contig. Until <strong>the</strong>n, a ®ngerprint clone contig may containseveral sequenced-clone contigs. After individual clones (for example, A <strong>and</strong> B) have beensequenced to draft coverage <strong>and</strong> <strong>the</strong> clones have been mapped, <strong>the</strong> data are analysed byGigAssembler (Fig. 6), producing merged sequence contigs from initial sequence contigs,<strong>and</strong> linking <strong>the</strong>se to form sequence-contig scaffolds (see Box 1).The remaining 39 contigs containing 0.3% <strong>of</strong> <strong>the</strong> sequence were notpositioned at all.We <strong>the</strong>n merged <strong>the</strong> sequences from overlapping sequencedclones (Fig. 6), using <strong>the</strong> computer program GigAssembler 104 . Theprogram considers nearby sequenced clones, detects overlapsbetween <strong>the</strong> initial sequence contigs in <strong>the</strong>se clones, merges <strong>the</strong>overlapping sequences <strong>and</strong> attempts to order <strong>and</strong> orient <strong>the</strong>sequence contigs. It begins by aligning <strong>the</strong> initial sequence contigsfrom one clone with those from o<strong>the</strong>r clones in <strong>the</strong> same ®ngerprintclone contig on <strong>the</strong> basis <strong>of</strong> length <strong>of</strong> alignment, per cent identity <strong>of</strong><strong>the</strong> alignment, position in <strong>the</strong> sequenced clone layout <strong>and</strong> o<strong>the</strong>rfactors. Alignments are limited to one end <strong>of</strong> each initial sequencecontig for partially overlapping contigs or to both ends <strong>of</strong> an initialsequence contig contained entirely within ano<strong>the</strong>r; this eliminatesinternal alignments that may re¯ect repeated sequence or possiblemisassembly (Fig. 6b). Beginning with <strong>the</strong> highest scoring pairs,initial sequence contigs are <strong>the</strong>n integrated to produce `mergedsequence contigs' (usually referred to simply as `sequence contigs').The program re®nes <strong>the</strong> arrangement <strong>of</strong> <strong>the</strong> clones within <strong>the</strong>®ngerprint clone contig on <strong>the</strong> basis <strong>of</strong> <strong>the</strong> extent <strong>of</strong> sequenceoverlap between <strong>the</strong>m <strong>and</strong> <strong>the</strong>n rebuilds <strong>the</strong> sequence contigs. Next,<strong>the</strong> program selects a sequence path through <strong>the</strong> sequence contigs(Fig. 6c). It tries to use <strong>the</strong> highest quality data by preferring longerinitial sequence contigs <strong>and</strong> avoiding <strong>the</strong> ®rst <strong>and</strong> last 250 bases <strong>of</strong>initial sequence contigs where possible. Finally, it attempts to order<strong>and</strong> orient <strong>the</strong> sequence contigs by using additional information,including sequence data from paired-end plasmid <strong>and</strong> BAC reads,known messenger RNAs <strong>and</strong> ESTs, as well as additional linkinginformation provided by centres. The sequence contigs are <strong>the</strong>rebylinked toge<strong>the</strong>r to create `sequence-contig scaffolds' (Fig. 6d). Theprocess also joins overlapping sequenced clones into sequencedclonecontigs <strong>and</strong> links sequenced-clone contigs to form sequencedclone-contigscaffolds. A ®ngerprint clone contig may containseveral sequenced-clone contigs, because bridging clones remainto be sequenced. The assembly contained 4,884 sequenced-cloneTable 5 The draft <strong>genome</strong> sequenceChromosome Sequence from clones (kb) Sequence from contigs (kb)Finished clones Draft clones Pre-draft clones Contigs containing®nished clonesDeep coveragesequence contigsDraft/predraftsequence contigsAll 826,441 1,734,995 131,476 958,922 840,815 893,1751 50,851 149,027 12,356 61,001 78,773 72,4612 46,909 167,439 7,210 53,775 81,569 86,2143 22,350 152,840 11,057 26,959 79,649 79,6384 15,914 134,973 17,261 19,096 66,165 82,8875 37,973 129,581 2,160 48,895 61,387 59,4316 75,312 76,082 6,696 93,458 28,204 36,4287 94,845 47,328 4,047 103,188 14,434 28,5978 14,538 102,484 7,236 16,659 47,198 60,4009 18,401 77,648 10,864 24,030 42,653 40,23010 16,889 99,181 11,066 21,421 54,054 51,66211 13,162 111,092 4,352 16,145 65,147 47,31412 32,156 84,653 7,651 37,519 43,995 42,94613 16,818 68,983 7,136 22,191 38,319 32,42914 58,989 27,370 565 78,302 3,267 5,35515 2,739 67,453 3,211 3,112 34,758 35,53316 22,987 48,997 1,143 27,751 20,892 24,48417 29,881 36,349 6,600 33,531 14,671 24,62818 5,128 65,284 2,352 6,656 40,947 25,16019 28,481 26,568 369 32,228 7,188 16,00320 54,217 5,302 976 56,534 1,065 2,89621 33,824 0 0 33,824 0 022 33,786 0 0 33,786 0 0X 77,630 45,100 4,941 83,796 14,056 29,820Y 18,169 3,221 363 20,222 333 1,198NA 2,434 1,858 844 2,446 122 2,568UL 2,056 6,182 1,020 2,395 1,969 4,894...................................................................................................................................................................................................................................................................................................................................................................The table presents summary statistics for <strong>the</strong> draft <strong>genome</strong> sequence over <strong>the</strong> entire <strong>genome</strong> <strong>and</strong> by individual chromosome. NA, clones that could not be placed into <strong>the</strong> sequenced clone layout. UL,clones that could be placed in <strong>the</strong> layout, but that could not reliably be placed on a chromosome. First three columns, data from ®nished clones, draft clones <strong>and</strong> predraft clones. The last three columnsbreak <strong>the</strong> data down according to <strong>the</strong> type <strong>of</strong> sequence contig. Contigs containing ®nished clones represent sequence contigs that consist <strong>of</strong> ®nished sequence plus any (small) extensions from mergedsequence contigs that arise from overlap with ¯anking draft clones. Deep coverage sequence contigs include sequence from two or more overlapping un®nished clones; <strong>the</strong>y consist <strong>of</strong> roughly full shotguncoverage <strong>and</strong> thus are longer than <strong>the</strong> average un®nished sequence contig. Draft/predraft sequence contigs are all <strong>of</strong> <strong>the</strong> o<strong>the</strong>r sequence contigs in un®nished clones. Thus, <strong>the</strong> draft <strong>genome</strong> sequenceconsists <strong>of</strong> approximately one-third ®nished sequence, one-third deep coverage sequence <strong>and</strong> one-third draft/pre-draft coverage sequence. In all <strong>of</strong> <strong>the</strong> statistics, we count only nonoverlapping bases in<strong>the</strong> draft <strong>genome</strong> sequence.870 © 2001 Macmillan Magazines Ltd NATURE | VOL 409 | 15 FEBRUARY 2001 | www.nature.com
articlescontigs in 942 ®ngerprint clone contigs.The hierarchy <strong>of</strong> contigs is summarized in Fig. 7. <strong>Initial</strong> sequencecontigs are integrated to create merged sequence contigs, which are<strong>the</strong>n linked to form sequence-contig scaffolds. These scaffolds residewithin sequenced-clone contigs, which in turn reside within ®ngerprintclone contigs.The draft <strong>genome</strong> sequenceThe result <strong>of</strong> <strong>the</strong> assembly process is an integrated draft sequence <strong>of</strong><strong>the</strong> <strong>human</strong> <strong>genome</strong>. Several features <strong>of</strong> <strong>the</strong> draft <strong>genome</strong> sequenceare reported in Tables 5±7, including <strong>the</strong> proportion represented by®nished, draft <strong>and</strong> predraft categories. The Tables also show <strong>the</strong>numbers <strong>and</strong> lengths <strong>of</strong> different types <strong>of</strong> contig, for each chromosome<strong>and</strong> for <strong>the</strong> <strong>genome</strong> as a whole.The contiguity <strong>of</strong> <strong>the</strong> draft <strong>genome</strong> sequence at each level is animportant feature. Two commonly used statistics have signi®cantdrawbacks for describing contiguity. The `average length' <strong>of</strong> a contigis de¯ated by <strong>the</strong> presence <strong>of</strong> many small contigs comprising only asmall proportion <strong>of</strong> <strong>the</strong> <strong>genome</strong>, whereas <strong>the</strong> `length-weightedaverage length' is in¯ated by <strong>the</strong> presence <strong>of</strong> large segments <strong>of</strong>®nished sequence. Instead, we chose to describe <strong>the</strong> contiguity as aproperty <strong>of</strong> <strong>the</strong> `typical' nucleotide. We used a statistic called <strong>the</strong>`N50 length', de®ned as <strong>the</strong> largest length L such that 50% <strong>of</strong> allnucleotides are contained in contigs <strong>of</strong> size at least L.The continuity <strong>of</strong> <strong>the</strong> draft <strong>genome</strong> sequence reported here <strong>and</strong><strong>the</strong> effectiveness <strong>of</strong> assembly can be readily seen from <strong>the</strong> following:half <strong>of</strong> all nucleotides reside within an initial sequence contig <strong>of</strong> atleast 21.7 kb, a sequence contig <strong>of</strong> at least 82 kb, a sequence-contigscaffold <strong>of</strong> at least 274 kb, a sequenced-clone contig <strong>of</strong> at least 826 kb<strong>and</strong> a ®ngerprint clone contig <strong>of</strong> at least 8.4 Mb (Tables 6, 7). Thecumulative distributions for each <strong>of</strong> <strong>the</strong>se measures <strong>of</strong> contiguityare shown in Fig. 8, in which <strong>the</strong> N50 values for each measure can beseen as <strong>the</strong> value at which <strong>the</strong> cumulative distributions cross 50%.We have also estimated <strong>the</strong> size <strong>of</strong> each chromosome, by estimating<strong>the</strong> gap sizes (see below) <strong>and</strong> <strong>the</strong> extent <strong>of</strong> missing heterochromaticsequence 93,94,105±108 (Table 8). This is undoubtedly an oversimpli®cation<strong>and</strong> does not adequately take into account <strong>the</strong> sequence status<strong>of</strong> each chromosome. None<strong>the</strong>less, it provides a useful way to relate<strong>the</strong> draft sequence to <strong>the</strong> chromosomes.Quality assessmentThe draft <strong>genome</strong> sequence already covers <strong>the</strong> vast majority <strong>of</strong> <strong>the</strong><strong>genome</strong>, but it remains an incomplete, intermediate product that isregularly updated as we work towards a complete ®nished sequence.The current version contains many gaps <strong>and</strong> errors. We <strong>the</strong>reforesought to evaluate <strong>the</strong> quality <strong>of</strong> various aspects <strong>of</strong> <strong>the</strong> current draft<strong>genome</strong> sequence, including <strong>the</strong> sequenced clones <strong>the</strong>mselves, <strong>the</strong>irassignment to a position in <strong>the</strong> ®ngerprint clone contigs, <strong>and</strong> <strong>the</strong>assembly <strong>of</strong> initial sequence contigs from <strong>the</strong> individual clones intosequence-contig scaffolds.Nucleotide accuracy is re¯ected in a PHRAP score assigned toeach base in <strong>the</strong> draft <strong>genome</strong> sequence <strong>and</strong> available to usersthrough <strong>the</strong> Genome Browsers (see below) <strong>and</strong> public databaseentries. A summary <strong>of</strong> <strong>the</strong>se scores for <strong>the</strong> un®nished portion <strong>of</strong> <strong>the</strong><strong>genome</strong> is shown in Table 9. About 91% <strong>of</strong> <strong>the</strong> un®nished draft<strong>genome</strong> sequence has an error rate <strong>of</strong> less than 1 per 10,000 bases(PHRAP score . 40), <strong>and</strong> about 96% has an error rate <strong>of</strong> less than 1in 1,000 bases (PHRAP . 30). These values are based only on <strong>the</strong>quality scores for <strong>the</strong> bases in <strong>the</strong> sequenced clones; <strong>the</strong>y do notre¯ect additional con®dence in <strong>the</strong> sequences that are represented inoverlapping clones. The ®nished portion <strong>of</strong> <strong>the</strong> draft <strong>genome</strong>sequence has an error rate <strong>of</strong> less than 1 per 10,000 bases.Individual sequenced clones. We assessed <strong>the</strong> frequency <strong>of</strong> misassemblies,which can occur when <strong>the</strong> assembly program PHRAPjoins two nonadjacent regions in <strong>the</strong> clone into a single initialsequence contig. The frequency <strong>of</strong> misassemblies depends heavilyon <strong>the</strong> depth <strong>and</strong> quality <strong>of</strong> coverage <strong>of</strong> each clone <strong>and</strong> <strong>the</strong> nature <strong>of</strong><strong>the</strong> underlying sequence; thus it may vary among genomic regions<strong>and</strong> among individual centres. Most clone misassemblies are readilycorrected as coverage is added during ®nishing, but <strong>the</strong>y may havebeen propagated into <strong>the</strong> current version <strong>of</strong> <strong>the</strong> draft <strong>genome</strong>sequence <strong>and</strong> <strong>the</strong>y justify caution for certain applications.We estimated <strong>the</strong> frequency <strong>of</strong> misassembly by examininginstances in which <strong>the</strong>re was substantial overlap between a draftclone <strong>and</strong> a ®nished clone. We studied 83 Mb <strong>of</strong> such overlaps,involving about 9,000 initial sequence contigs. We found 5.3instances per Mb in which <strong>the</strong> alignment <strong>of</strong> an initial sequencecontig to <strong>the</strong> ®nished sequence failed to extend to within 200 basesTable 6 Clone level contiguity <strong>of</strong> <strong>the</strong> draft <strong>genome</strong> sequenceChromosome Sequenced-clone contigs Sequenced-clone-contig scaffolds Fingerprint clone contigs with sequenceNumber N50 length (kb) Number N50 length (kb) Number N50 length (kb)All 4,884 826 2,191 2,279 942 8,3981 453 650 197 1,915 106 3,5372 348 1,028 127 3,140 52 10,6283 409 672 201 1,550 73 5,0774 384 606 163 1,659 41 6,9185 385 623 164 1,642 48 5,7476 292 814 98 3,292 17 24,6807 224 1.074 86 3,527 29 20,4018 292 542 115 1,742 43 6,2369 143 1,242 78 2,411 21 29,10810 179 1,097 105 1,952 16 30,28411 224 887 89 3,024 31 9,41412 196 1,138 76 2,717 28 9,54613 128 1,151 56 3,257 13 25,25614 54 3,079 27 8,489 14 22,12815 123 797 56 2,095 19 8,27416 159 620 92 1,317 57 2,71617 138 831 58 2,138 43 2,81618 137 709 47 2,572 24 4,88719 159 569 79 1,200 51 1,53420 42 2,318 20 6,862 9 23,48921 5 28,515 5 28,515 5 28,51522 11 23,048 11 23,048 11 23,048X 325 572 181 1,082 143 1,436Y 27 1,539 20 3,290 8 5,135UL 47 227 40 281 40 281...................................................................................................................................................................................................................................................................................................................................................................Number <strong>and</strong> size <strong>of</strong> sequenced-clone contigs, sequenced-clone-contig scaffolds <strong>and</strong> those ®ngerprint clone contigs (see Box 1) that contain sequenced clones; some small ®ngerprint clone contigs do notas yet have associated sequence. UL, ®ngerprint clone contigs that could not reliably be placed on a chromosome. These length estimates are from <strong>the</strong> draft <strong>genome</strong> sequence, in which gaps betweensequence contigs are arbitrarily represented with 100 Ns <strong>and</strong> gaps between sequence clone contigs with 50,000 Ns for `bridged gaps' <strong>and</strong> 100,000 Ns for `unbridged gaps'. These arbitrary values differminimally from empirical estimates <strong>of</strong> gap size (see text), <strong>and</strong> using <strong>the</strong> empirically derived estimates would change <strong>the</strong> N50 lengths presented here only slightly. For un®nished chromosomes, <strong>the</strong> N50 lengthranges from 1.5 to 3 times <strong>the</strong> arithmetic mean for sequenced-clone contigs, 1.5 to 3 times for sequenced-clone-contig scaffolds, <strong>and</strong> 1.5 to 6 times for ®ngerprint clone contigs with sequence.NATURE | VOL 409 | 15 FEBRUARY 2001 | www.nature.com © 2001 Macmillan Magazines Ltd871
articles<strong>of</strong> <strong>the</strong> end <strong>of</strong> <strong>the</strong> contig, suggesting a possible false join in <strong>the</strong>assembly <strong>of</strong> <strong>the</strong> initial sequence contig. In about half <strong>of</strong> <strong>the</strong>se cases,<strong>the</strong> potential misassembly involved fewer than 400 bases, suggestingthat a single raw sequence read may have been incorrectly joined. Wefound 1.9 instances per Mb in which <strong>the</strong> alignment showed aninternal gap, again suggesting a possible misassembly; <strong>and</strong> 0.5instances per Mb in which <strong>the</strong> alignment indicated that two initialsequence contigs that overlapped by at least 150 bp had not beenmerged by PHRAP. Finally, <strong>the</strong>re were ano<strong>the</strong>r 0.9 instances per Mbwith various o<strong>the</strong>r problems. This gives a total <strong>of</strong> 8.6 instances perMb <strong>of</strong> possible misassembly, with about half being relatively smallissues involving a few hundred bases.Some <strong>of</strong> <strong>the</strong> potential problems might not result from misassembly,but might re¯ect sequence polymorphism in <strong>the</strong> population,a 100Cumulative percentagebCumulative percentage9080706050403020Sequenced clonesSequenced-clone contigs10Sequenced-clone-contig scaffoldsFingerprint clone contigs00 500 1,000 1,500 2,000 2,500 3,000 3,500 4,000 4,500 5,000Size (kb)Clone level continuity100908070605040302010<strong>Initial</strong> sequence contigsSequence contigsSequence-contig scaffolds00 100 200 300 400 500 600 700 800 900 1,000Size (kb)Sequence level continuityFigure 8 Cumulative distributions <strong>of</strong> several measures <strong>of</strong> clone level contiguity <strong>and</strong>sequence contiguity. The ®gures represent <strong>the</strong> proportion <strong>of</strong> <strong>the</strong> draft <strong>genome</strong> sequencecontained in contigs <strong>of</strong> at most <strong>the</strong> indicated size. a, Clone level contiguity. The cloneshave a tight size distribution with an N50 <strong>of</strong> , 160 kb (corresponding to 50% on <strong>the</strong>cumulative distribution). Sequenced-clone contigs represent <strong>the</strong> next level <strong>of</strong> continuity,<strong>and</strong> are linked by mRNA sequences or pairs <strong>of</strong> BAC end sequences to yield <strong>the</strong>sequenced-clone-contig scaffolds. The underlying contiguity <strong>of</strong> <strong>the</strong> layout <strong>of</strong> sequencedclones against <strong>the</strong> ®ngerprinted clone contigs is only partially shown at this scale.b, Sequence contiguity. The input fragments have low continuity (N50 = 21.7 kb). Aftermerging, <strong>the</strong> sequence contigs grow to an N50 length <strong>of</strong> about 82 kb. After linking,sequence-contig scaffolds with an N50 length <strong>of</strong> about 274 kb are created.small rearrangements during growth <strong>of</strong> <strong>the</strong> large-insert clones,regions <strong>of</strong> low-quality sequence or matches between segmentalduplications. Thus, <strong>the</strong> frequency <strong>of</strong> misassemblies may be overstated.On <strong>the</strong> o<strong>the</strong>r h<strong>and</strong>, <strong>the</strong> criteria for recognizing overlapbetween draft <strong>and</strong> ®nished clones may have eliminated somemisassemblies.Layout <strong>of</strong> <strong>the</strong> sequenced clones. We assessed <strong>the</strong> accuracy <strong>of</strong> <strong>the</strong>layout <strong>of</strong> sequenced clones onto <strong>the</strong> ®ngerprinted clone contigs bycalculating <strong>the</strong> concordance between <strong>the</strong> positions assigned to asequenced clone on <strong>the</strong> basis <strong>of</strong> in silico digestion <strong>and</strong> <strong>the</strong> positionassigned on <strong>the</strong> basis <strong>of</strong> BAC end sequence data. The positionsagreed in 98% <strong>of</strong> cases in which independent assignments could bemade by both methods. The results were also compared with wellstudied regions containing both ®nished <strong>and</strong> draft <strong>genome</strong>sequence. These results indicated that sequenced clone order in<strong>the</strong> ®ngerprint map was reliable to within about half <strong>of</strong> one clonelength (,100 kb).A direct test <strong>of</strong> <strong>the</strong> layout is also provided by <strong>the</strong> draft <strong>genome</strong>sequence assembly itself. With extensive coverage <strong>of</strong> <strong>the</strong> <strong>genome</strong>, acorrectly placed clone should usually (although not always) showsequence overlap with its neighbours in <strong>the</strong> map. We found only 421instances <strong>of</strong> `singleton' clones that failed to overlap a neighbouringclone. Close examination <strong>of</strong> <strong>the</strong> data suggests that most <strong>of</strong> <strong>the</strong>se arecorrectly placed, but simply do not yet overlap an adjacentsequenced clone. About 150 clones appeared to be c<strong>and</strong>idates forbeing incorrectly placed.Alignment <strong>of</strong> <strong>the</strong> ®ngerprint clone contigs. The alignment <strong>of</strong> <strong>the</strong>®ngerprint clone contigs with <strong>the</strong> chromosomes was based on <strong>the</strong>radiation hybrid, YAC <strong>and</strong> genetic maps <strong>of</strong> STSs. The positions <strong>of</strong>most <strong>of</strong> <strong>the</strong> STSs in <strong>the</strong> draft <strong>genome</strong> sequence were consistent with<strong>the</strong>se previous maps, but <strong>the</strong> positions <strong>of</strong> about 1.7% differed fromone or more <strong>of</strong> <strong>the</strong>m. Some <strong>of</strong> <strong>the</strong>se disagreements may be due toerrors in <strong>the</strong> layout <strong>of</strong> <strong>the</strong> sequenced clones or in <strong>the</strong> underlyingFigure 9 Overview <strong>of</strong> features <strong>of</strong> draft <strong>human</strong> <strong>genome</strong>. The Figure shows <strong>the</strong> Qoccurrences <strong>of</strong> twelve important types <strong>of</strong> feature across <strong>the</strong> <strong>human</strong> <strong>genome</strong>. Largegrey blocks represent centromeres <strong>and</strong> centromeric heterochromatin (size not precisely toscale). Each <strong>of</strong> <strong>the</strong> feature types is depicted in a track, from top to bottom as follows. (1)Chromosome position in Mb. (2) The approximate positions <strong>of</strong> Giemsa-stainedchromosome b<strong>and</strong>s at <strong>the</strong> 800 b<strong>and</strong> resolution. (3) Level <strong>of</strong> coverage in <strong>the</strong> draft <strong>genome</strong>sequence. Red, areas covered by ®nished clones; yellow, areas covered by predraftsequence. Regions covered by draft sequenced clones are in orange, with darker shadesre¯ecting increasing shotgun sequence coverage. (4) GC content. Percentage <strong>of</strong> bases ina 20,000 base window that are C or G. (5) Repeat density. Red line, density <strong>of</strong> SINE classrepeats in a 100,000-base window; blue line, density <strong>of</strong> LINE class repeats in a 100,000-base window. (6) Density <strong>of</strong> SNPs in a 50,000-base window. The SNPs were detected by<strong>sequencing</strong> <strong>and</strong> alignments <strong>of</strong> r<strong>and</strong>om genomic reads. Some <strong>of</strong> <strong>the</strong> heterogeneity in SNPdensity re¯ects <strong>the</strong> methods used for SNP discovery. Rigorous <strong>analysis</strong> <strong>of</strong> SNP densityrequires comparing <strong>the</strong> number <strong>of</strong> SNPs identi®ed to <strong>the</strong> precise number <strong>of</strong> basessurveyed. (7) Non-coding RNA genes. Brown, functional RNA genes such as tRNAs,snoRNAs <strong>and</strong> rRNAs; light orange, RNA pseudogenes. (8) CpG isl<strong>and</strong>s. Green ticksrepresent regions <strong>of</strong> , 200 bases with CpG levels signi®cantly higher than in <strong>the</strong> <strong>genome</strong>as a whole, <strong>and</strong> GC ratios <strong>of</strong> at least 50%. (9) Exo®sh ecores. Regions <strong>of</strong> homology with<strong>the</strong> puffer®sh T. nigroviridis 292 are blue. (10) ESTs with at least one intron when alignedagainst genomic DNA are shown as black tick marks. (11) The starts <strong>of</strong> genes predicted byGenie or Ensembl are shown as red ticks. The starts <strong>of</strong> known genes from <strong>the</strong> RefSeqdatabase 110 are shown in blue. (12) The names <strong>of</strong> genes that have been uniquely locatedin <strong>the</strong> draft <strong>genome</strong> sequence, characterized <strong>and</strong> named by <strong>the</strong> HGM NomenclatureCommittee. Known disease genes from <strong>the</strong> OMIM database are red, o<strong>the</strong>r genes blue.This Figure is based on an earlier version <strong>of</strong> <strong>the</strong> draft <strong>genome</strong> sequence than analysed in<strong>the</strong> text, owing to production constraints. We are aware <strong>of</strong> various errors in <strong>the</strong> Figure,including omissions <strong>of</strong> some known genes <strong>and</strong> misplacements <strong>of</strong> o<strong>the</strong>rs. Some genes aremapped to more than one location, owing to errors in assembly, close paralogues orpseudogenes. Manual review was performed to select <strong>the</strong> most likely location in <strong>the</strong>secases <strong>and</strong> to correct o<strong>the</strong>r regions. For updated information, see http://<strong>genome</strong>.ucsc.edu/<strong>and</strong> http://www.ensembl.org/.872 © 2001 Macmillan Magazines Ltd NATURE | VOL 409 | 15 FEBRUARY 2001 | www.nature.com
articlesTable 7 Sequence level contiguity <strong>of</strong> <strong>the</strong> draft <strong>genome</strong> sequenceChromosome <strong>Initial</strong> sequence contigs Sequence contigs Sequence-contig scaffoldsNumber N50 length (kb) Number N50 length (kb) Number N50 length (kb)All 396,913 21.7 149,821 81.9 87,757 274.31 37,656 16.5 12,256 59.1 5,457 278.42 32,280 19.9 13,228 57.3 6,959 248.53 38,848 15.6 15,098 37.7 8,964 167.44 28,600 16.0 13,152 33.0 7,402 158.95 30,096 20.4 10,689 72.9 6,378 241.26 17,472 43.6 5,547 180.3 2,554 485.07 12,733 86.4 4,562 335.7 2,726 591.38 19,042 18.1 8,984 38.2 4,631 198.99 15,955 20.1 6,226 55.6 3,766 216.210 21,762 18.7 9,126 47.9 6,886 133.011 29,723 14.3 8,503 40.0 4,684 193.212 22,050 19.1 8,422 63.4 5,526 217.013 13,737 21.7 5,193 70.5 2,659 300.114 4,470 161.4 829 1,371.0 541 2,009.515 13,134 15.3 5,840 30.3 3,229 149.716 10,297 34.4 4,916 119.5 3,337 356.317 10,369 22.9 4,339 90.6 2,616 248.918 16,266 15.3 4,461 51.4 2,540 216.119 6,009 38.4 2,503 134.4 1,551 375.520 2,884 108.6 511 1,346.7 312 813.821 103 340.0 5 28,515.3 5 28,515.322 526 113.9 11 23,048.1 11 23,048.1X 11,062 58.8 4,607 218.6 2,610 450.7Y 557 154.3 140 1,388.6 106 1,439.7UL 1,282 21.4 613 46.0 297 166.4...................................................................................................................................................................................................................................................................................................................................................................This Table is similar to Table 6 but shows <strong>the</strong> number <strong>and</strong> N50 length for various types <strong>of</strong> sequence contig (see Box 1). See legend to Table 6 concerning treatment <strong>of</strong> gaps. For sequence contigs in <strong>the</strong> draft<strong>genome</strong> sequence, <strong>the</strong> N50 length ranges from 1.7 to 5.5 times <strong>the</strong> arithmetic mean for initial sequence contigs, 2.5 to 8.2 times for merged sequence contigs, <strong>and</strong> 6.1 to 10 times for sequence-contigscaffolds.Table 8 Chromosome size estimatesChromosome*Sequencedbases² (Mb)NumberFCC gaps³ SCC gapsk Sequence gaps# Heterochromatin<strong>and</strong> short armadjustments**(Mb)Total basesin gaps§ (Mb)NumberTotal basesin gaps (Mb)NumberTotal basesin gaps I (Mb)Total estimatedchromosome size(includingartefactualduplication in draft<strong>genome</strong>sequence)²² (Mb)Previouslyestimatedchromosomesize³³ (Mb)All 2,692.9 897 152.0 4,076 142.7 145,514 80.6 212 3,289 3,2861 212.2 104 17.7 347 12.1 11,803 6.5 30 279 2632 221.6 50 8.5 296 10.4 12,880 7.1 3 251 2553 186.2 71 12.1 336 11.8 14,689 8.1 3 221 2144 168.1 39 6.6 343 12.0 12,768 7.1 3 197 2035 169.7 46 7.8 337 11.8 10,304 5.7 3 198 1946 158.1 15 2.6 275 9.6 5,225 2.9 3 176 1837 146.2 27 4.6 195 6.8 4,338 2.4 3 163 1718 124.3 41 7.0 249 8.7 8,692 4.8 3 148 1559 106.9 19 3.2 122 4.3 6,083 3.4 22 140 14510 127.1 14 2.4 163 5.7 8,947 5.0 3 143 14411 128.6 29 4.9 193 6.8 8,279 4.6 3 148 14412 124.5 26 4.4 168 5.9 8,226 4.6 3 142 14313 92.9 12 2.0 115 4.0 5,065 2.8 16 118 11414 86.9 13 2.2 40 1.4 775 0.4 16 107 10915 73.4 18 3.1 104 3.6 5,717 3.2 17 100 10616 73.1 55 9.4 102 3.6 4,757 2.6 15 104 9817 72.8 41 7.0 95 3.3 4,261 2.4 3 88 9218 72.9 22 3.7 113 4.0 4,324 2.4 3 86 8519 55.4 49 8.3 108 3.8 2,344 1.3 3 72 6720 60.5 7 1.2 33 1.2 469 0.3 3 66 7221 33.8 4 0.1 0 0.0 0 0.0 11 45 5022 33.8 10 1.0 0 0.0 0 0.0 13 48 56X 127.7 141 24.0 182 6.4 4,282 2.4 3 163 164Y 21.8 6 1.0 19 0.7 113 0.1 27 51 59NA 5.1 0 0 134 0.0 577 0.3 0 0 0UL 9.3 38 0 7 0.0 566 0.3 0 0 0...................................................................................................................................................................................................................................................................................................................................................................* NA, sequenced clones that could not be associated with ®ngerprint clone contigs. UL, clone contigs that could not be reliably placed on a chromosome.² Total number <strong>of</strong> bases in <strong>the</strong> draft <strong>genome</strong> sequence, excluding gaps. Total length <strong>of</strong> scaffold (including gaps contained within clones) is 2.916 Gb.³ Gaps between those ®ngerprint clone contigs that contain sequenced clones excluding gaps for centromeres.§ For un®nished chromosomes, we estimate an average size <strong>of</strong> 0.17 Mb per FCC gap, based on retrospective estimates <strong>of</strong> <strong>the</strong> clone coverage <strong>of</strong> chromosomes 21 <strong>and</strong> 22. Gap estimates for chromosomes21 <strong>and</strong> 22 are taken from refs 93, 94.k Gaps between sequenced-clone contigs within a ®ngerprint clone contig. For un®nished chromosomes, we estimate sequenced clone gaps at 0.035 Mb each, based on evaluation <strong>of</strong> a sample <strong>of</strong> <strong>the</strong>se gaps.# Gaps between two sequence contigs within a sequenced-clone contig.I We estimate <strong>the</strong> average number <strong>of</strong> bases in sequence gaps from alignments <strong>of</strong> <strong>the</strong> initial sequence contigs <strong>of</strong> un®nished clones (see text) <strong>and</strong> extrapolation to <strong>the</strong> whole chromosome.** Including adjustments for estimates <strong>of</strong> <strong>the</strong> sizes <strong>of</strong> <strong>the</strong> short arms <strong>of</strong> <strong>the</strong> acrocentric chromosomes 13, 14, 15, 21 <strong>and</strong> 22 (ref. 105), estimates for <strong>the</strong> centromere <strong>and</strong> heterochromatic regions <strong>of</strong>chromosomes 1, 9 <strong>and</strong> 16 (refs 106, 107) <strong>and</strong> estimates <strong>of</strong> 3 Mb for <strong>the</strong> centromere <strong>and</strong> 24 Mb for telomeric heterochromatin for <strong>the</strong> Y chromosome 108 .²² The sum <strong>of</strong> <strong>the</strong> ®ve lengths in <strong>the</strong> preceding columns. This is an overestimate, because <strong>the</strong> draft <strong>genome</strong> sequence contains some artefactual sequence owing to inability to correctly to merge allunderlying sequence contigs. The total amount <strong>of</strong> artefactual duplication varies among chromosomes; <strong>the</strong> overall amount is estimated by computational <strong>analysis</strong> to be about 100 Mb, or about 3% <strong>of</strong> <strong>the</strong> totallength given, yielding a total estimated size <strong>of</strong> about 3,200 Mb for <strong>the</strong> <strong>human</strong> <strong>genome</strong>.³³ Including heterochromatic regions <strong>and</strong> acrocentric short arm(s) 105 .NATURE | VOL 409 | 15 FEBRUARY 2001 | www.nature.com © 2001 Macmillan Magazines Ltd873
articles®ngerprint map. However, many involve STSs that have beenlocalized on only one or two <strong>of</strong> <strong>the</strong> previous maps or that occuras isolated discrepancies in con¯ict with several ¯anking STSs.Many <strong>of</strong> <strong>the</strong>se cases are probably due to errors in <strong>the</strong> previousmaps (with error rates for individual maps estimated at 1±2% 100 ).O<strong>the</strong>rs may be due to incorrect assignment <strong>of</strong> <strong>the</strong> STSs to <strong>the</strong> draft<strong>genome</strong> sequence (by <strong>the</strong> electronic polymerase chain reaction(e-PCR) computer program) or to database entries that containsequence data from more than one clone (owing to crosscontamination).Graphical views <strong>of</strong> <strong>the</strong> independent data sets were particularlyuseful in detecting problems with order or orientation (Fig. 5).Areas <strong>of</strong> con¯ict were reviewed <strong>and</strong> corrected if supported by <strong>the</strong>underlying data. In <strong>the</strong> version discussed here, <strong>the</strong>re were 41sequenced clones falling in 14 sequenced-clone contigs with STScontent information from multiple maps that disagreed with <strong>the</strong>¯anking clones or sequenced-clone contigs; <strong>the</strong> placement <strong>of</strong> <strong>the</strong>seclones thus remains suspect. Four <strong>of</strong> <strong>the</strong>se instances suggest errorsin <strong>the</strong> ®ngerprint map, whereas <strong>the</strong> o<strong>the</strong>rs suggest errors in <strong>the</strong>layout <strong>of</strong> sequenced clones. These cases are being investigated <strong>and</strong>will be corrected in future versions.Assembly <strong>of</strong> <strong>the</strong> sequenced clones. We assessed <strong>the</strong> accuracy <strong>of</strong> <strong>the</strong>assembly by using a set <strong>of</strong> 148 draft clones comprising 22.4 Mb forwhich ®nished sequence subsequently became available 104 . Theinitial sequence contigs lack information about order <strong>and</strong> orientation,<strong>and</strong> GigAssembler attempts to use linking data to infer suchinformation as far as possible 104 . Starting with initial sequencecontigs that were unordered <strong>and</strong> unoriented, <strong>the</strong> program placed90% <strong>of</strong> <strong>the</strong> initial sequence contigs in <strong>the</strong> correct orientation <strong>and</strong>85% in <strong>the</strong> correct order with respect to one ano<strong>the</strong>r. In a separatetest, GigAssembler was tested on simulated draft data producedfrom ®nished sequence on chromosome 22 <strong>and</strong> similar results wereobtained.Some problems remain at all levels. First, errors in <strong>the</strong> initialsequence contigs persist in <strong>the</strong> merged sequence contigs built from<strong>the</strong>m <strong>and</strong> can cause dif®culties in <strong>the</strong> assembly <strong>of</strong> <strong>the</strong> draft <strong>genome</strong>sequence. Second, GigAssembler may fail to merge some overlappingsequences because <strong>of</strong> poor data quality, allelic differences ormisassemblies <strong>of</strong> <strong>the</strong> initial sequence contigs; this may result inapparent local duplication <strong>of</strong> a sequence. We have estimated byvarious methods <strong>the</strong> amount <strong>of</strong> such artefactual duplication in <strong>the</strong>assembly from <strong>the</strong>se <strong>and</strong> o<strong>the</strong>r sources to be about 100 Mb. On <strong>the</strong>o<strong>the</strong>r h<strong>and</strong>, nearby duplicated sequences may occasionally be incorrectlymerged. Some sequenced clones remain incorrectly placed on<strong>the</strong> layout, as discussed above, <strong>and</strong> o<strong>the</strong>rs (, 0.5%) remain unplaced.The ®ngerprint map has undoubtedly failed to resolve some closelyrelated duplicated regions, such as <strong>the</strong> Williams region <strong>and</strong> severalhighly repetitive subtelomeric <strong>and</strong> pericentric regions (see below).Detailed examination <strong>and</strong> sequence ®nishing may be required tosort out <strong>the</strong>se regions precisely, as has been done with chromosomeY 89 . Finally, small sequenced-clone contigs with limited or no STSTable 9 Distribution <strong>of</strong> PHRAP scores in <strong>the</strong> draft <strong>genome</strong> sequencePHRAP scorePercentage <strong>of</strong> bases in <strong>the</strong> draft<strong>genome</strong> sequence0±9 0.610±19 1.320±29 2.230±39 4.840±49 8.150±59 8.760±69 9.070±79 12.180±89 17.3.90 35.9.............................................................................................................................................................................PHRAP scores are a logarithmically based representation <strong>of</strong> <strong>the</strong> error probability. A PHRAP score <strong>of</strong>X corresponds to an error probability <strong>of</strong> 10 -X/10 . Thus, PHRAP scores <strong>of</strong> 20, 30 <strong>and</strong> 40 correspond toaccuracy <strong>of</strong> 99%, 99.9% <strong>and</strong> 99.99%, respectively. PHRAP scores are derived from qualityscores <strong>of</strong> <strong>the</strong> underlying sequence reads used in sequence assembly. See http://www.<strong>genome</strong>.washington.edu/UWGC/<strong>analysis</strong>tools/phrap.htm.l<strong>and</strong>mark content remain dif®cult to place. Full utilization <strong>of</strong><strong>the</strong> higher resolution radiation hybrid map (<strong>the</strong> TNG map) mayhelp in this 95 . Future targeted FISH experiments <strong>and</strong> increased mapcontinuity will also facilitate positioning <strong>of</strong> <strong>the</strong>se sequences.Genome coverageWe next assessed <strong>the</strong> nature <strong>of</strong> <strong>the</strong> gaps within <strong>the</strong> draft <strong>genome</strong>sequence, <strong>and</strong> attempted to estimate <strong>the</strong> fraction <strong>of</strong> <strong>the</strong> <strong>human</strong><strong>genome</strong> not represented within <strong>the</strong> current version.Gaps in draft <strong>genome</strong> sequence coverage. There are three types <strong>of</strong>gap in <strong>the</strong> draft <strong>genome</strong> sequence: gaps within un®nishedsequenced clones; gaps between sequenced-clone contigs, butwithin ®ngerprint clone contigs; <strong>and</strong> gaps between ®ngerprintclone contigs. The ®rst two types are relatively straightforward toclose simply by performing additional <strong>sequencing</strong> <strong>and</strong> ®nishing onalready identi®ed clones. Closing <strong>the</strong> third type may require screening<strong>of</strong> additional large-insert clone libraries <strong>and</strong> possibly newtechnologies for <strong>the</strong> most recalcitrant regions. We consider <strong>the</strong>sethree cases in turn.We estimated <strong>the</strong> size <strong>of</strong> gaps within draft clones by studyinginstances in which <strong>the</strong>re was substantial overlap between a draftclone <strong>and</strong> a ®nished clone, as described above. The average gap sizein <strong>the</strong>se draft sequenced clones was 554 bp, although <strong>the</strong> preciseestimate was sensitive to certain assumptions in <strong>the</strong> <strong>analysis</strong>.Assuming that <strong>the</strong> sequence gaps in <strong>the</strong> draft <strong>genome</strong> sequenceare fairly represented by this sample, about 80 Mb or about 3%(likely range 2±4%) <strong>of</strong> sequence may lie in <strong>the</strong> 145,514 gaps withindraft sequenced clones.The gaps between sequenced-clone contigs but within ®ngerprintclone contigs are more dif®cult to evaluate directly, because <strong>the</strong>draft <strong>genome</strong> sequence ¯anking many <strong>of</strong> <strong>the</strong> gaps is <strong>of</strong>ten notprecisely aligned with <strong>the</strong> ®ngerprinted clones. However, most aremuch smaller than a single BAC. In fact, nearly three-quarters <strong>of</strong><strong>the</strong>se gaps are bridged by one or more individual BACs, as indicatedby linking information from BAC end sequences. We measured <strong>the</strong>sizes <strong>of</strong> a subset <strong>of</strong> gaps directly by examining restriction fragment®ngerprints <strong>of</strong> overlapping clones. A study <strong>of</strong> 157 `bridged' gaps <strong>and</strong>55 `unbridged' gaps gave an average gap size <strong>of</strong> 25 kb. Allowing for <strong>the</strong>possibility that <strong>the</strong>se gaps may not be fully representative <strong>and</strong> thatsome restriction fragments are not included in <strong>the</strong> calculation, a moreconservative estimate <strong>of</strong> gap size would be 35 kb. This would indicatethat about 150 Mb or 5% <strong>of</strong> <strong>the</strong> <strong>human</strong> <strong>genome</strong> may reside in <strong>the</strong>4,076 gaps between sequenced-clone contigs. This sequence shouldbe readily obtained as <strong>the</strong> clones spanning <strong>the</strong>m are sequenced.The size <strong>of</strong> <strong>the</strong> gaps between ®ngerprint clone contigs wasestimated by comparing <strong>the</strong> ®ngerprint maps to <strong>the</strong> essentiallycompleted chromosomes 21 <strong>and</strong> 22. The <strong>analysis</strong> shows that <strong>the</strong>®ngerprinted BAC clones in <strong>the</strong> global database cover 97±98% <strong>of</strong><strong>the</strong> sequenced portions <strong>of</strong> those chromosomes 86 . The publishedsequences <strong>of</strong> <strong>the</strong>se chromosomes also contain a few small gaps (5<strong>and</strong> 11, respectively) amounting to some 1.6% <strong>of</strong> <strong>the</strong> euchromaticsequence, <strong>and</strong> do not include <strong>the</strong> heterochromatic portion. Thissuggests that <strong>the</strong> gaps between contigs in <strong>the</strong> ®ngerprint mapcontain about 4% <strong>of</strong> <strong>the</strong> euchromatic <strong>genome</strong>. Experience withclosure <strong>of</strong> such gaps on chromosomes 20 <strong>and</strong> 7 suggests that many<strong>of</strong> <strong>the</strong>se gaps are less than one clone in length <strong>and</strong> will be closed byclones from o<strong>the</strong>r libraries. However, recovery <strong>of</strong> sequence from<strong>the</strong>se gaps represents <strong>the</strong> most challenging aspect <strong>of</strong> producing acomplete ®nished sequence <strong>of</strong> <strong>the</strong> <strong>human</strong> <strong>genome</strong>.As ano<strong>the</strong>r measure <strong>of</strong> <strong>the</strong> representation <strong>of</strong> <strong>the</strong> BAC libraries,Riethman 109 has found BAC or cosmid clones that link to telomerichalf-YACs or to <strong>the</strong> telomeric sequence itself for 40 <strong>of</strong> <strong>the</strong> 41 nonsatellitetelomeres. Thus, <strong>the</strong> ®ngerprint map appears to have nosubstantial gaps in <strong>the</strong>se regions. Many <strong>of</strong> <strong>the</strong> pericentric regions arealso represented, but <strong>analysis</strong> is less complete here (see below).Representation <strong>of</strong> r<strong>and</strong>om raw sequences. In ano<strong>the</strong>r approach tomeasuring coverage, we compared a collection <strong>of</strong> r<strong>and</strong>om rawsequence reads to <strong>the</strong> existing draft <strong>genome</strong> sequence. In principle,874 © 2001 Macmillan Magazines Ltd NATURE | VOL 409 | 15 FEBRUARY 2001 | www.nature.com
articles<strong>the</strong> fraction <strong>of</strong> reads matching <strong>the</strong> draft <strong>genome</strong> sequence shouldprovide an estimate <strong>of</strong> <strong>genome</strong> coverage. In practice, <strong>the</strong> comparisonis complicated by <strong>the</strong> need to allow for repeat sequences, <strong>the</strong>imperfect sequence quality <strong>of</strong> both <strong>the</strong> raw sequence <strong>and</strong> <strong>the</strong> draft<strong>genome</strong> sequence, <strong>and</strong> <strong>the</strong> possibility <strong>of</strong> polymorphism. None<strong>the</strong>less,<strong>the</strong> <strong>analysis</strong> provides a reasonable view <strong>of</strong> <strong>the</strong> extent towhich <strong>the</strong> <strong>genome</strong> is represented in <strong>the</strong> draft <strong>genome</strong> sequence <strong>and</strong><strong>the</strong> public databases.We compared <strong>the</strong> raw sequence reads against both <strong>the</strong> sequencesused in <strong>the</strong> construction <strong>of</strong> <strong>the</strong> draft <strong>genome</strong> sequence <strong>and</strong> all <strong>of</strong>GenBank using <strong>the</strong> BLAST computer program. Of <strong>the</strong> 5,615 rawsequence reads analysed (each containing at least 100 bp <strong>of</strong> contiguousnon-repetitive sequence), 4,924 had a match <strong>of</strong> $ 97%identity with a sequenced clone, indicating that 88 6 1.5% <strong>of</strong> <strong>the</strong><strong>genome</strong> was represented in sequenced clones. The estimate issubject to various uncertainties. Most serious is <strong>the</strong> proportion <strong>of</strong>repeat sequence in <strong>the</strong> remainder <strong>of</strong> <strong>the</strong> <strong>genome</strong>. If <strong>the</strong> unsequencedportion <strong>of</strong> <strong>the</strong> <strong>genome</strong> is unusually rich in repeated sequence,we would underestimate its size (although <strong>the</strong> excess would becomprised <strong>of</strong> repeated sequence).We examined those raw sequences that failed to match bycomparing <strong>the</strong>m to <strong>the</strong> o<strong>the</strong>r publicly available sequence resources.Fifty (0.9%) had matches in public databases containing cDNAsequences, STSs <strong>and</strong> similar data. An additional 276 (or 43% <strong>of</strong> <strong>the</strong>remaining raw sequence) had matches to <strong>the</strong> whole-<strong>genome</strong> shotgunreads discussed above (consistent with <strong>the</strong> idea that <strong>the</strong>se readscover about half <strong>of</strong> <strong>the</strong> <strong>genome</strong>).We also examined <strong>the</strong> extent <strong>of</strong> <strong>genome</strong> coverage by aligning <strong>the</strong>cDNA sequences for genes in <strong>the</strong> RefSeq dataset 110 to <strong>the</strong> draft<strong>genome</strong> sequence. We found that 88% <strong>of</strong> <strong>the</strong> bases <strong>of</strong> <strong>the</strong>se cDNAscould be aligned to <strong>the</strong> draft <strong>genome</strong> sequence at high stringency (atleast 98% identity). (A few <strong>of</strong> <strong>the</strong> alignments with ei<strong>the</strong>r <strong>the</strong> r<strong>and</strong>omraw sequence reads or <strong>the</strong> cDNAs may be to a highly similar regionin <strong>the</strong> <strong>genome</strong>, but such matches should affect <strong>the</strong> estimate <strong>of</strong><strong>genome</strong> coverage by considerably less than 1%, based on <strong>the</strong>estimated extent <strong>of</strong> duplication within <strong>the</strong> <strong>genome</strong> (see below).)These results indicate that about 88% <strong>of</strong> <strong>the</strong> <strong>human</strong> <strong>genome</strong> isrepresented in <strong>the</strong> draft <strong>genome</strong> sequence <strong>and</strong> about 94% in <strong>the</strong>combined publicly available sequence databases. The ®gure <strong>of</strong> 88%agrees well with our independent estimates above that about 3%,5% <strong>and</strong> 4% <strong>of</strong> <strong>the</strong> <strong>genome</strong> reside in <strong>the</strong> three types <strong>of</strong> gap in <strong>the</strong> draft<strong>genome</strong> sequence.Finally, a small experimental check was performed by screening alarge-insert clone library with probes corresponding to 16 <strong>of</strong> <strong>the</strong>whole <strong>genome</strong> shotgun reads that failed to match <strong>the</strong> draft <strong>genome</strong>sequence. Five hybridized to many clones from different ®ngerprintclone contigs <strong>and</strong> were discarded as being repetitive. Of <strong>the</strong>remaining eleven, two fell within sequenced clones (presumablywithin sequence gaps <strong>of</strong> <strong>the</strong> ®rst type), eight fell in ®ngerprint clonecontigs but between sequenced clones (gaps <strong>of</strong> <strong>the</strong> second type) <strong>and</strong>one failed to identify clones in <strong>the</strong> ®ngerprint map (gaps <strong>of</strong> <strong>the</strong> thirdtype) but did identify clones in ano<strong>the</strong>r large-insert library.Although <strong>the</strong>se numbers are small, <strong>the</strong>y are consistent with <strong>the</strong>view that <strong>the</strong> much <strong>of</strong> <strong>the</strong> remaining <strong>genome</strong> sequence lies withinalready identi®ed clones in <strong>the</strong> current map.Estimates <strong>of</strong> <strong>genome</strong> <strong>and</strong> chromosome sizes. Informed by this<strong>analysis</strong> <strong>of</strong> <strong>genome</strong> coverage, we proceeded to estimate <strong>the</strong> sizes <strong>of</strong><strong>the</strong> <strong>genome</strong> <strong>and</strong> each <strong>of</strong> <strong>the</strong> chromosomes (Table 8). Beginning with<strong>the</strong> current assigned sequence for each chromosome, we correctedfor <strong>the</strong> known gaps on <strong>the</strong> basis <strong>of</strong> <strong>the</strong>ir estimated sizes (seeabove). We attempted to account for <strong>the</strong> sizes <strong>of</strong> centromeres <strong>and</strong>heterochromatin, nei<strong>the</strong>r <strong>of</strong> which are well represented in <strong>the</strong> draftsequence. Finally, we corrected for around 100 Mb <strong>of</strong> artefactualduplication in <strong>the</strong> assembly. We arrived at a total <strong>human</strong> <strong>genome</strong>size estimate <strong>of</strong> around 3,200 Mb, which compares favourably withprevious estimates based on DNA content.We also independently estimated <strong>the</strong> size <strong>of</strong> <strong>the</strong> euchromaticportion <strong>of</strong> <strong>the</strong> <strong>genome</strong> by determining <strong>the</strong> fraction <strong>of</strong> <strong>the</strong> 5,615r<strong>and</strong>om raw sequences that matched <strong>the</strong> ®nished portion <strong>of</strong><strong>the</strong> <strong>human</strong> <strong>genome</strong> (whose total length is known with greaterprecision). Twenty-nine per cent <strong>of</strong> <strong>the</strong>se raw sequences found amatch among 835 Mb <strong>of</strong> nonredundant ®nished sequence. Thisleads to an estimate <strong>of</strong> <strong>the</strong> euchromatic <strong>genome</strong> size <strong>of</strong> 2.9 Gb. Thisagrees reasonably with <strong>the</strong> prediction above based on <strong>the</strong> length <strong>of</strong><strong>the</strong> draft <strong>genome</strong> sequence (Table 8).Update. The results above re¯ect <strong>the</strong> data on 7 October 2000. Newdata are continually being added, with improvements being made to<strong>the</strong> physical map, new clones being sequenced to close gaps <strong>and</strong>draft clones progressing to full shotgun coverage <strong>and</strong> ®nishing. Thedraft <strong>genome</strong> sequence will be regularly reassembled <strong>and</strong> publiclyreleased.Currently, <strong>the</strong> physical map has been re®ned such that <strong>the</strong>number <strong>of</strong> ®ngerprint clone contigs has fallen from 1,246 to 965;this re¯ects <strong>the</strong> elimination <strong>of</strong> some artefactual contigs <strong>and</strong> <strong>the</strong>closure <strong>of</strong> some gaps. The sequence coverage has risen such that90% <strong>of</strong> <strong>the</strong> <strong>human</strong> <strong>genome</strong> is now represented in <strong>the</strong> sequencedclones <strong>and</strong> more than 94% is represented in <strong>the</strong> combined publiclyavailable sequence databases. The total amount <strong>of</strong> ®nished sequenceis now around 1 Gb.Broad genomic l<strong>and</strong>scapeWhat biological insights can be gleaned from <strong>the</strong> draft sequence? Inthis section, we consider very large-scale features <strong>of</strong> <strong>the</strong> draft<strong>genome</strong> sequence: <strong>the</strong> distribution <strong>of</strong> GC content, CpG isl<strong>and</strong>s<strong>and</strong> recombination rates, <strong>and</strong> <strong>the</strong> repeat content <strong>and</strong> gene content <strong>of</strong><strong>the</strong> <strong>human</strong> <strong>genome</strong>. The draft <strong>genome</strong> sequence makes it possible tointegrate <strong>the</strong>se features <strong>and</strong> o<strong>the</strong>rs at scales ranging from individualFigure 10 Screen shot from UCSC Draft Human Genome Browser. Seehttp://<strong>genome</strong>.ucsc.edu/.Figure 11 Screen shot from <strong>the</strong> Genome Browser <strong>of</strong> Project Ensembl. Seehttp://www.ensembl.org.NATURE | VOL 409 | 15 FEBRUARY 2001 | www.nature.com © 2001 Macmillan Magazines Ltd875
articlesnucleotides to collections <strong>of</strong> chromosomes. Unless noted, all analyseswere conducted on <strong>the</strong> assembled draft <strong>genome</strong> sequencedescribed above.Figure 9 provides a high-level view <strong>of</strong> <strong>the</strong> contents <strong>of</strong> <strong>the</strong> draft<strong>genome</strong> sequence, at a scale <strong>of</strong> about 3.8 Mb per centimetre. Ofcourse, navigating information spanning nearly ten orders <strong>of</strong>magnitude requires computational tools to extract <strong>the</strong> full value.We have created <strong>and</strong> made freely available various `Genome Browsers'.Browsers were developed <strong>and</strong> are maintained by <strong>the</strong> University<strong>of</strong> California at Santa Cruz (Fig. 10) <strong>and</strong> <strong>the</strong> EnsEMBL project <strong>of</strong> <strong>the</strong>European Bioinformatics Institute <strong>and</strong> <strong>the</strong> Sanger Centre (Fig. 11).Additional browsers have been created; URLs are listed atwww.nhgri.nih.gov/<strong>genome</strong>_hub. These web-based computertools allow users to view an annotated display <strong>of</strong> <strong>the</strong> draft <strong>genome</strong>sequence, with <strong>the</strong> ability to scroll along <strong>the</strong> chromosomes <strong>and</strong>zoom in or out to different scales. They include: <strong>the</strong> nucleotidesequence, sequence contigs, clone contigs, sequence coverage <strong>and</strong>®nishing status, local GC content, CpG isl<strong>and</strong>s, known STS markersfrom previous genetic <strong>and</strong> physical maps, families <strong>of</strong> repeatsequences, known genes, ESTs <strong>and</strong> mRNAs, predicted genes, SNPs<strong>and</strong> sequence similarities with o<strong>the</strong>r organisms (currently <strong>the</strong>puffer®sh Tetraodon nigroviridis). These browsers will be updatedas <strong>the</strong> draft <strong>genome</strong> sequence is re®ned <strong>and</strong> corrected as additionalannotations are developed.In addition to using <strong>the</strong> Genome Browsers, one can downloadBox 2Sources <strong>of</strong> publicly available sequence data <strong>and</strong> o<strong>the</strong>r relevantgenomic informationhttp://<strong>genome</strong>.ucsc.edu/University <strong>of</strong> California at Santa CruzContains <strong>the</strong> assembly <strong>of</strong> <strong>the</strong> draft <strong>genome</strong> sequence used in this paper <strong>and</strong>updateshttp://<strong>genome</strong>.wustl.edu/gsc/ <strong>human</strong>/Mapping/Washington UniversityContains links to clone <strong>and</strong> accession maps <strong>of</strong> <strong>the</strong> <strong>human</strong> <strong>genome</strong>http://www.ensembl.orgEBI/Sanger CentreAllows access to DNA <strong>and</strong> protein sequences with automatic baseline annotationhttp://www.ncbi.nlm.nih.gov/ <strong>genome</strong>/guide/NCBIViews <strong>of</strong> chromosomes <strong>and</strong> maps <strong>and</strong> loci with links to o<strong>the</strong>r NCBI resourceshttp://www.ncbi.nlm.nih.gov/ genemap99/Gene map 99: contains data <strong>and</strong> viewers for radiation hybrid maps <strong>of</strong> EST-basedSTSsfrom <strong>the</strong>se sites <strong>the</strong> entire draft <strong>genome</strong> sequence toge<strong>the</strong>r with <strong>the</strong>annotations in a computer-readable format. The sequences <strong>of</strong> <strong>the</strong>underlying sequenced clones are all available through <strong>the</strong> publicsequence databases. URLs for <strong>the</strong>se <strong>and</strong> o<strong>the</strong>r <strong>genome</strong> websites arelisted in Box 2. A larger list <strong>of</strong> useful URLs can be found atwww.nhgri.nih.gov/<strong>genome</strong>_hub. An introduction to using <strong>the</strong>draft <strong>genome</strong> sequence, as well as associated databases <strong>and</strong> analyticaltools, is provided in an accompanying paper 111 .In addition, <strong>the</strong> <strong>human</strong> cytogenetic map has been integrated with<strong>the</strong> draft <strong>genome</strong> sequence as part <strong>of</strong> a related project. The BACResource Consortium 103 established dense connections between <strong>the</strong>maps using more than 7,500 sequenced large-insert clones that hadbeen cytogenetically mapped by FISH; <strong>the</strong> average density <strong>of</strong> <strong>the</strong>map is 2.3 clones per Mb. Although <strong>the</strong> precision <strong>of</strong> <strong>the</strong> integrationis limited by <strong>the</strong> resolution <strong>of</strong> FISH, <strong>the</strong> links provide a powerfultool for <strong>the</strong> <strong>analysis</strong> <strong>of</strong> cytogenetic aberrations in inherited diseases<strong>and</strong> cancer. These cytogenetic links can also be accessed through <strong>the</strong>Genome Browsers.Long-range variation in GC contentThe existence <strong>of</strong> GC-rich <strong>and</strong> GC-poor regions in <strong>the</strong> <strong>human</strong><strong>genome</strong> was ®rst revealed by experimental studies involving densitygradient separation, which indicated substantial variation in averageGC content among large fragments. Subsequent studies haveindicated that <strong>the</strong>se GC-rich <strong>and</strong> GC-poor regions may havedifferent biological properties, such as gene density, composition<strong>of</strong> repeat sequences, correspondence with cytogenetic b<strong>and</strong>s <strong>and</strong>recombination rate 112±117 . Many <strong>of</strong> <strong>the</strong>se studies were indirect, owingto <strong>the</strong> lack <strong>of</strong> suf®cient sequence data.The draft <strong>genome</strong> sequence makes it possible to explore <strong>the</strong>variation in GC content in a direct <strong>and</strong> global manner. Visualinspection (Fig. 9) con®rms that local GC content undergoessubstantial long-range excursions from its <strong>genome</strong>-wide average<strong>of</strong> 41%. If <strong>the</strong> <strong>genome</strong> were drawn from a uniform distribution <strong>of</strong>GC content, <strong>the</strong> local GC content in a window <strong>of</strong> size n bp shouldbe 41 6 Î((41)(59)/n)%. Fluctuations would be modest, with <strong>the</strong>st<strong>and</strong>ard deviation being halved as <strong>the</strong> window size is quadrupledÐfor example, 0.70%, 0.35%, 0.17% <strong>and</strong> 0.09% for windows <strong>of</strong> size 5,20, 80 <strong>and</strong> 320 kb.The draft <strong>genome</strong> sequence, however, contains many regions withmuch more extreme variation. There are huge regions (. 10 Mb)with GC content far from <strong>the</strong> average. For example, <strong>the</strong> most distal48 Mb <strong>of</strong> chromosome 1p (from <strong>the</strong> telomere to about STS markerD1S3279) has an average GC content <strong>of</strong> 47.1%, <strong>and</strong> chromosome 13has a 40-Mb region (roughly between STS marker A005X38 <strong>and</strong>12,000http://compbio.ornl.gov/channel/index.htmlOak Ridge National LaboratoryJava viewers for <strong>human</strong> <strong>genome</strong> datahttp://hgrep.ims.u-tokyo.ac.jp/RIKEN <strong>and</strong> <strong>the</strong> University <strong>of</strong> TokyoGives an overview <strong>of</strong> <strong>the</strong> entire <strong>human</strong> <strong>genome</strong> structurehttp://snp.cshl.org/The SNP ConsortiumIncludes a variety <strong>of</strong> ways to query for SNPs in <strong>the</strong> <strong>human</strong> <strong>genome</strong>http://www.ncbi.nlm.nih.gov/Omim/Online Mendelian Inheritance in ManContain information about <strong>human</strong> genes <strong>and</strong> diseaseNumber <strong>of</strong> 20-kb windows10,0008,0006,0004,0002,000http://www.nhgri.nih.gov/ELSI/ <strong>and</strong> http://www.ornl.gov/hgmis/elsi/elsi.htmlNHGRI <strong>and</strong> DOEContains information, links <strong>and</strong> articles on a wide range <strong>of</strong> social, ethical <strong>and</strong> legalissues020 25 30 35 40 45 50 55 60 65 70GC contentFigure 12 Histogram <strong>of</strong> GC content <strong>of</strong> 20-kb windows in <strong>the</strong> draft <strong>genome</strong> sequence.876 © 2001 Macmillan Magazines Ltd NATURE | VOL 409 | 15 FEBRUARY 2001 | www.nature.com
articles60%-50%-40%-30%-20%-60%-50%-40%-30%-20%-60%-50%-40%-30%-20%-0 Mb0 Mb0 Mb50 Mb5 Mb0.5 Mb100 Mb10 Mb1 MbFigure 13 Variation in GC content at various scales. The GC content in subregions <strong>of</strong> a100-Mb region <strong>of</strong> chromosome 1 is plotted, starting at about 83 Mb from <strong>the</strong> beginning <strong>of</strong><strong>the</strong> draft <strong>genome</strong> sequence. This region is AT-rich overall. Top, <strong>the</strong> GC content <strong>of</strong> <strong>the</strong>entire 100-Mb region analysed in non-overlapping 20-kb windows. Middle, GC content <strong>of</strong><strong>the</strong> ®rst 10 Mb, analysed in 2-kb windows. Bottom, GC content <strong>of</strong> <strong>the</strong> ®rst 1 Mb, analysedin 200-bp windows. At this scale, gaps in <strong>the</strong> sequence can be seen.stsG30423) with only 36% GC content. There are also examples <strong>of</strong>large shifts in GC content between adjacent multimegabase regions.For example, <strong>the</strong> average GC content on chromosome 17q is 50%for <strong>the</strong> distal 10.3 Mb but drops to 38% for <strong>the</strong> adjacent 3.9 Mb.There are regions <strong>of</strong> less than 300 kb with even wider swings in GCcontent, for example, from 33.1% to 59.3%.Long-range variation in GC content is evident not just fromextreme outliers, but throughout <strong>the</strong> <strong>genome</strong>. The distribution <strong>of</strong>average GC content in 20-kb windows across <strong>the</strong> draft <strong>genome</strong>sequence is shown in Fig. 12. The spread is 15-fold larger thanpredicted by a uniform process. Moreover, <strong>the</strong> st<strong>and</strong>ard deviationbarely decreases as window size increases by successive factors <strong>of</strong>fourÐ5.9%, 5.2%, 4.9% <strong>and</strong> 4.6% for windows <strong>of</strong> size 5, 20, 80 <strong>and</strong>320 kb. The distribution is also notably skewed, with 58% below <strong>the</strong>average <strong>and</strong> 42% above <strong>the</strong> average <strong>of</strong> 41%, with a long tail <strong>of</strong> GCrichregions.Bernardi <strong>and</strong> colleagues 118,119 proposed that <strong>the</strong> long-range variationin GC content may re¯ect that <strong>the</strong> <strong>genome</strong> is composed <strong>of</strong> amosaic <strong>of</strong> compositionally homogeneous regions that <strong>the</strong>y dubbed`isochores'. They suggested that <strong>the</strong> skewed distribution is composed<strong>of</strong> ®ve normal distributions, corresponding to ®ve distincttypes <strong>of</strong> isochore (L1, L2, H1, H2 <strong>and</strong> H3, with GC contents <strong>of</strong>, 38%, 38±42%, 42±47%, 47±52% <strong>and</strong> . 52%, respectively).We studied <strong>the</strong> draft <strong>genome</strong> sequence to see whe<strong>the</strong>r strictisochores could be identi®ed. For example, <strong>the</strong> sequence wasdivided into 300-kb windows, <strong>and</strong> each window was subdividedinto 20-kb subwindows. We calculated <strong>the</strong> average GC content foreach window <strong>and</strong> subwindow, <strong>and</strong> investigated how much <strong>of</strong> <strong>the</strong>variance in <strong>the</strong> GC content <strong>of</strong> subwindows across <strong>the</strong> <strong>genome</strong> can bestatistically `explained' by <strong>the</strong> average GC content in each window.About three-quarters <strong>of</strong> <strong>the</strong> <strong>genome</strong>-wide variance among 20-kbwindows can be statistically explained by <strong>the</strong> average GC content <strong>of</strong>300-kb windows that contain <strong>the</strong>m, but <strong>the</strong> residual variance amongsubwindows (st<strong>and</strong>ard deviation, 2.4%) is still far too large to beconsistent with a homogeneous distribution. In fact, <strong>the</strong> hypo<strong>the</strong>sis<strong>of</strong> homogeneity could be rejected for each 300-kb window in <strong>the</strong>draft <strong>genome</strong> sequence.Similar results were obtained with o<strong>the</strong>r window <strong>and</strong> subwindowsizes. Some <strong>of</strong> <strong>the</strong> local heterogeneity in GC content is attributable totransposable element insertions (see below). Such repeat elementstypically have a higher GC content than <strong>the</strong> surrounding sequence,with <strong>the</strong> effect being strongest for <strong>the</strong> most recent insertions.These results rule out a strict notion <strong>of</strong> isochores as compositionallyhomogeneous. Instead, <strong>the</strong>re is substantial variation atmany different scales, as illustrated in Fig. 13. Although isochoresdo not appear to merit <strong>the</strong> pre®x `iso', <strong>the</strong> <strong>genome</strong> clearly doescontain large regions <strong>of</strong> distinctive GC content <strong>and</strong> it is likely to beworth rede®ning <strong>the</strong> concept so that it becomes possible rigorouslyto partition <strong>the</strong> <strong>genome</strong> into regions. In <strong>the</strong> absence <strong>of</strong> a precisede®nition, we will loosely refer to such regions as `GC contentdomains' in <strong>the</strong> context <strong>of</strong> <strong>the</strong> discussion below.Fickett et al. 120 have explored a model in which <strong>the</strong> underlyingpreference for a particular GC content drifts continuously throughout<strong>the</strong> <strong>genome</strong>, an approach that bears fur<strong>the</strong>r examination.Churchill 121 has proposed that <strong>the</strong> boundaries between GC contentdomains can in some cases be predicted by a hidden Markov model,with one state representing a GC-rich region <strong>and</strong> one representingan AT-rich region. We found that this approach tended to identifyonly very short domains <strong>of</strong> less than a kilobase (data not shown),but variants <strong>of</strong> this approach deserve fur<strong>the</strong>r attention.The correlation between GC content domains <strong>and</strong> variousbiological properties is <strong>of</strong> great interest, <strong>and</strong> this is likely to be <strong>the</strong>most fruitful route to underst<strong>and</strong>ing <strong>the</strong> basis <strong>of</strong> variation in GCcontent. As described below, we con®rm <strong>the</strong> existence <strong>of</strong> strongcorrelations with both repeat content <strong>and</strong> gene density. Using <strong>the</strong>integration between <strong>the</strong> draft <strong>genome</strong> sequence <strong>and</strong> <strong>the</strong> cytogeneticmap described above, it is possible to con®rm a statisticallysigni®cant correlation between GC content <strong>and</strong> Giemsa b<strong>and</strong>s (Gb<strong>and</strong>s).For example, 98% <strong>of</strong> large-insert clones mapping to <strong>the</strong>darkest G-b<strong>and</strong>s are in 200-kb regions <strong>of</strong> low GC content (average37%), whereas more than 80% <strong>of</strong> clones mapping to <strong>the</strong> lightest G-b<strong>and</strong>s are in regions <strong>of</strong> high GC content (average 45%) 103 . Estimatedb<strong>and</strong> locations can be seen in Fig. 9 <strong>and</strong> viewed in <strong>the</strong> context <strong>of</strong>o<strong>the</strong>r <strong>genome</strong> annotation at http://<strong>genome</strong>.ucsc.edu/goldenPath/mapPlots/ <strong>and</strong> http://<strong>genome</strong>.ucsc.edu/goldenPath/hgTracks.html.CpG isl<strong>and</strong>sA related topic is <strong>the</strong> distribution <strong>of</strong> so-called CpG isl<strong>and</strong>s across <strong>the</strong><strong>genome</strong>. The dinucleotide CpG is notable because it is greatlyunder-represented in <strong>human</strong> DNA, occurring at only about one-®fth <strong>of</strong> <strong>the</strong> roughly 4% frequency that would be expected by simplymultiplying <strong>the</strong> typical fraction <strong>of</strong> Cs <strong>and</strong> Gs (0.21 ´ 0.21). Thede®cit occurs because most CpG dinucleotides are methylated on<strong>the</strong> cytosine base, <strong>and</strong> spontaneous deamination <strong>of</strong> methyl-Cresidues gives rise to T residues. (Spontaneous deamination <strong>of</strong>ordinary cytosine residues gives rise to uracil residues that arereadily recognized <strong>and</strong> repaired by <strong>the</strong> cell.) As a result, methyl-CpG dinucleotides steadily mutate to TpG dinucleotides. However,<strong>the</strong> <strong>genome</strong> contains many `CpG isl<strong>and</strong>s' in which CpG dinucleotidesare not methylated <strong>and</strong> occur at a frequency closer to thatpredicted by <strong>the</strong> local GC content. CpG isl<strong>and</strong>s are <strong>of</strong> particularinterest because many are associated with <strong>the</strong> 59 ends <strong>of</strong> genes 122±127 .We searched <strong>the</strong> draft <strong>genome</strong> sequence for CpG isl<strong>and</strong>s. Ideally,<strong>the</strong>y should be de®ned by directly testing for <strong>the</strong> absence <strong>of</strong> cytosinemethylation, but that was not practical for this report. There areNATURE | VOL 409 | 15 FEBRUARY 2001 | www.nature.com © 2001 Macmillan Magazines Ltd877
articlesTable 10 Number <strong>of</strong> CpG isl<strong>and</strong>s by GC contentGC content<strong>of</strong> isl<strong>and</strong>Number<strong>of</strong> isl<strong>and</strong>sPercentage<strong>of</strong> isl<strong>and</strong>sNucleotidesin isl<strong>and</strong>sPercentage <strong>of</strong>nucleotidesin isl<strong>and</strong>sTotal 28,890 100 19,818,547 100.80% 22 0.08 5,916 0.0370±80% 5,884 20 3,111,965 1660±70% 18,779 65 13,110,924 6650±60% 4,205 15 3,589,742 18.............................................................................................................................................................................Potential CpG isl<strong>and</strong>s were identi®ed by searching <strong>the</strong> draft <strong>genome</strong> sequence one base at a time,scoring each dinucleotide (+17 for GC, -1 for o<strong>the</strong>rs) <strong>and</strong> identifying maximally scoring segments.Each segment was <strong>the</strong>n evaluated to determine GC content ($50%), length (.200) <strong>and</strong> ratio <strong>of</strong>observed proportion <strong>of</strong> GC dinucleotides to <strong>the</strong> expected proportion on <strong>the</strong> basis <strong>of</strong> <strong>the</strong> GC content<strong>of</strong> <strong>the</strong> segment (.0.60), using a modi®cation <strong>of</strong> a program developed by G. Micklem (personalcommunication).various computer programs that attempt to identify CpG isl<strong>and</strong>s on<strong>the</strong> basis <strong>of</strong> primary sequence alone. These programs differ in someimportant respects (such as how aggressively <strong>the</strong>y subdivide longCpG-containing regions), <strong>and</strong> <strong>the</strong> precise correspondence wi<strong>the</strong>xperimentally undermethylated isl<strong>and</strong>s has not been validated.Never<strong>the</strong>less, <strong>the</strong>re is a good correlation, <strong>and</strong> computational <strong>analysis</strong>thus provides a reasonable picture <strong>of</strong> <strong>the</strong> distribution <strong>of</strong> CpGisl<strong>and</strong>s in <strong>the</strong> <strong>genome</strong>.To identify CpG isl<strong>and</strong>s, we used <strong>the</strong> de®nition proposed byGardiner-Garden <strong>and</strong> Frommer 128 <strong>and</strong> embodied in a computerprogram. We searched <strong>the</strong> draft <strong>genome</strong> sequence for CpG isl<strong>and</strong>s,using both <strong>the</strong> full sequence <strong>and</strong> <strong>the</strong> sequence masked to eliminaterepeat sequences. The number <strong>of</strong> regions satisfying <strong>the</strong> de®nition <strong>of</strong>a CpG isl<strong>and</strong> was 50,267 in <strong>the</strong> full sequence <strong>and</strong> 28,890 in <strong>the</strong>repeat-masked sequence. The difference re¯ects <strong>the</strong> fact that somerepeat elements (notably Alu) are GC-rich. Although some <strong>of</strong> <strong>the</strong>serepeat elements may function as control regions, it seems unlikelythat most <strong>of</strong> <strong>the</strong> apparent CpG isl<strong>and</strong>s in repeat sequences arefunctional. Accordingly, we focused on those in <strong>the</strong> non-repeatedsequence. The count <strong>of</strong> 28,890 CpG isl<strong>and</strong>s is reasonably close to <strong>the</strong>previous estimate <strong>of</strong> about 35,000 (ref. 129, as modi®ed by ref. 130).Most <strong>of</strong> <strong>the</strong> isl<strong>and</strong>s are short, with 60±70% GC content (Table 10).More than 95% <strong>of</strong> <strong>the</strong> isl<strong>and</strong>s are less than 1,800 bp long, <strong>and</strong> morethan 75% are less than 850 bp. The longest CpG isl<strong>and</strong> (onchromosome 10) is 36,619 bp long, <strong>and</strong> 322 are longer than 3,000bp. Some <strong>of</strong> <strong>the</strong> larger isl<strong>and</strong>s contain ribosomal pseudogenes,although RNA genes <strong>and</strong> pseudogenes account for only a smallproportion <strong>of</strong> all isl<strong>and</strong>s (, 0.5%). The smaller isl<strong>and</strong>s are consistentwith <strong>the</strong>ir previously hypo<strong>the</strong>sized function, but <strong>the</strong> role <strong>of</strong><strong>the</strong>se larger isl<strong>and</strong>s is uncertain.The density <strong>of</strong> CpG isl<strong>and</strong>s varies substantially among some <strong>of</strong><strong>the</strong> chromosomes. Most chromosomes have 5±15 isl<strong>and</strong>s per Mb,with a mean <strong>of</strong> 10.5 isl<strong>and</strong>s per Mb. However, chromosome Y has anNumber <strong>of</strong> genes per Mb2520151050111 1514 6 9 12248 3207 105 2113 18X2217160 10 20 30 40 50Number <strong>of</strong> CpG isl<strong>and</strong>s per MbFigure 14 Number <strong>of</strong> CpG isl<strong>and</strong>s per Mb for each chromosome, plotted against <strong>the</strong>number <strong>of</strong> genes per Mb (<strong>the</strong> number <strong>of</strong> genes was taken from GeneMap98 (ref. 100)).Chromosomes 16, 17, 22 <strong>and</strong> particularly 19 are clear outliers, with a density <strong>of</strong> CpGisl<strong>and</strong>s that is even greater than would be expected from <strong>the</strong> high gene counts for <strong>the</strong>sefour chromosomes.19unusually low 2.9 isl<strong>and</strong>s per Mb, <strong>and</strong> chromosomes 16, 17 <strong>and</strong> 22have 19±22 isl<strong>and</strong>s per Mb. The extreme outlier is chromosome 19,with 43 isl<strong>and</strong>s per Mb. Similar trends are seen when considering <strong>the</strong>percentage <strong>of</strong> bases contained in CpG isl<strong>and</strong>s. The relative density <strong>of</strong>CpG isl<strong>and</strong>s correlates reasonably well with estimates <strong>of</strong> relativegene density on <strong>the</strong>se chromosomes, based both on previousmapping studies involving ESTs (Fig. 14) <strong>and</strong> on <strong>the</strong> distribution<strong>of</strong> gene predictions discussed below.Comparison <strong>of</strong> genetic <strong>and</strong> physical distanceThe draft <strong>genome</strong> sequence makes it possible to compare genetic<strong>and</strong> physical distances <strong>and</strong> <strong>the</strong>reby to explore variation in <strong>the</strong> rate <strong>of</strong>recombination across <strong>the</strong> <strong>human</strong> chromosomes. We focus here onlarge-scale variation. Finer variation is examined in an accompanyingpaper 131 .The genetic <strong>and</strong> physical maps are integrated by 5,282 polymorphicloci from <strong>the</strong> Marsh®eld genetic map 102 , whose positionsare known in terms <strong>of</strong> centimorgans (cM) <strong>and</strong> Mb along <strong>the</strong>chromosomes. Figure 15 shows <strong>the</strong> comparison <strong>of</strong> <strong>the</strong> draft<strong>genome</strong> sequence for chromosome 12 with <strong>the</strong> male, female <strong>and</strong>sex-averaged maps. One can calculate <strong>the</strong> approximate ratio <strong>of</strong> cMper Mb across a chromosome (re¯ected in <strong>the</strong> slopes in Fig. 15) <strong>and</strong><strong>the</strong> average recombination rate for each chromosome arm.Two striking features emerge from <strong>analysis</strong> <strong>of</strong> <strong>the</strong>se data. First, <strong>the</strong>average recombination rate increases as <strong>the</strong> length <strong>of</strong> <strong>the</strong> chromosomearm decreases (Fig. 16). Long chromosome arms have anaverage recombination rate <strong>of</strong> about 1 cM per Mb, whereas <strong>the</strong>shortest arms are in <strong>the</strong> range <strong>of</strong> 2 cM per Mb. A similar trend hasbeen seen in <strong>the</strong> yeast <strong>genome</strong> 132,133 , despite <strong>the</strong> fact that <strong>the</strong> physicalscale is nearly 200 times as small. Moreover, experimental studieshave shown that leng<strong>the</strong>ning or shortening yeast chromosomesresults in a compensatory change in recombination rate 132 .The second observation is that <strong>the</strong> recombination rate tends to besuppressed near <strong>the</strong> centromeres <strong>and</strong> higher in <strong>the</strong> distal portions<strong>of</strong> most chromosomes, with <strong>the</strong> increase largely in <strong>the</strong> terminalDistance from centromere (cM)1401301201101009012q8070605040302010012p1020304050Sex-averagedMaleFemale600 10 20 30 40 50 60 70 80 90 100 110 120 130 140Centromere Position (Mb)Figure 15 Distance in cM along <strong>the</strong> genetic map <strong>of</strong> chromosome 12 plotted againstposition in Mb in <strong>the</strong> draft <strong>genome</strong> sequence. Female, male <strong>and</strong> sex-averaged maps areshown. Female recombination rates are much higher than male recombination rates. Theincreased slopes at ei<strong>the</strong>r end <strong>of</strong> <strong>the</strong> chromosome re¯ect <strong>the</strong> increased rates <strong>of</strong>recombination per Mb near <strong>the</strong> telomeres. Conversely, <strong>the</strong> ¯atter slope near <strong>the</strong>centromere shows decreased recombination <strong>the</strong>re, especially in male meiosis. This istypical <strong>of</strong> <strong>the</strong> o<strong>the</strong>r chromosomes as well (see http://<strong>genome</strong>.ucsc.edu/goldenPath/mapPlots). Discordant markers may be map, marker placement or assembly errors.878 © 2001 Macmillan Magazines Ltd NATURE | VOL 409 | 15 FEBRUARY 2001 | www.nature.com
articles20±35 Mb. The increase is most pronounced in <strong>the</strong> male meioticmap. The effect can be seen, for example, from <strong>the</strong> higher slope atboth ends <strong>of</strong> chromosome 12 (Fig. 15). Regional <strong>and</strong> sex-speci®ceffects have been observed for chromosome 21 (refs 110, 134).Why is recombination higher on smaller chromosome arms? Ahigher rate would increase <strong>the</strong> likelihood <strong>of</strong> at least one crossoverduring meiosis on each chromosome arm, as is generally observedin <strong>human</strong> chiasmata counts 135 . Crossovers are believed to benecessary for normal meiotic disjunction <strong>of</strong> homologous chromosomepairs in eukaryotes. An extreme example is <strong>the</strong> pseudoautosomalregions on chromosomes Xp <strong>and</strong> Yp, which pair during malemeiosis; this physical region <strong>of</strong> only 2.6 Mb has a genetic length <strong>of</strong>50 cM (corresponding to 20 cM per Mb), with <strong>the</strong> result that acrossover is virtually assured.Mechanistically, <strong>the</strong> increased rate <strong>of</strong> recombination on shorterchromosome arms could be explained if, once an initial recombinationevent occurs, additional nearby events are blocked by positivecrossover interference on each arm. Evidence from yeast mutants inwhich interference is abolished shows that interference plays a keyrole in distributing a limited number <strong>of</strong> crossovers among <strong>the</strong>various chromosome arms in yeast 136 . An alternative possibility isthat a checkpoint mechanism scans for <strong>and</strong> enforces <strong>the</strong> presence <strong>of</strong>at least one crossover on each chromosome arm.Variation in recombination rates along chromosomes <strong>and</strong>between <strong>the</strong> sexes is likely to re¯ect variation in <strong>the</strong> initiation <strong>of</strong>meiosis-induced double-str<strong>and</strong> breaks (DSBs) that initiate recombination.DSBs in yeast have been associated with openchromatin 137,138 , ra<strong>the</strong>r than with speci®c DNA sequence motifs.With <strong>the</strong> availability <strong>of</strong> <strong>the</strong> draft <strong>genome</strong> sequence, it should bepossible to explore in an analogous manner whe<strong>the</strong>r variationin <strong>human</strong> recombination rates re¯ects systematic differences inchromosome accessibility during meiosis.Repeat content <strong>of</strong> <strong>the</strong> <strong>human</strong> <strong>genome</strong>A puzzling observation in <strong>the</strong> early days <strong>of</strong> molecular biology wasthat <strong>genome</strong> size does not correlate well with organismal complexity.For example, Homo sapiens has a <strong>genome</strong> that is 200 times aslarge as that <strong>of</strong> <strong>the</strong> yeast S. cerevisiae, but 200 times as small as that <strong>of</strong>Recombination rate (cM per Mb)32.521.510.500 20 40 60 80 100 120 140 160Length <strong>of</strong> chromosome arm (Mb)Figure 16 Rate <strong>of</strong> recombination averaged across <strong>the</strong> euchromatic portion <strong>of</strong> eachchromosome arm plotted against <strong>the</strong> length <strong>of</strong> <strong>the</strong> chromosome arm in Mb. For largechromosomes, <strong>the</strong> average recombination rates are very similar, but as chromosome armlength decreases, average recombination rates rise markedly.Amoeba dubia 139,140 . This mystery (<strong>the</strong> C-value paradox) was largelyresolved with <strong>the</strong> recognition that <strong>genome</strong>s can contain a largequantity <strong>of</strong> repetitive sequence, far in excess <strong>of</strong> that devoted toprotein-coding genes (reviewed in refs 140, 141).In <strong>the</strong> <strong>human</strong>, coding sequences comprise less than 5% <strong>of</strong> <strong>the</strong><strong>genome</strong> (see below), whereas repeat sequences account for at least50% <strong>and</strong> probably much more. Broadly, <strong>the</strong> repeats fall into ®veclasses: (1) transposon-derived repeats, <strong>of</strong>ten referred to as interspersedrepeats; (2) inactive (partially) retroposed copies <strong>of</strong> cellulargenes (including protein-coding genes <strong>and</strong> small structural RNAs),usually referred to as processed pseudogenes; (3) simple sequencerepeats, consisting <strong>of</strong> direct repetitions <strong>of</strong> relatively short k-merssuch as (A) n , (CA) n or (CGG) n ; (4) segmental duplications, consisting<strong>of</strong> blocks <strong>of</strong> around 10±300 kb that have been copied fromone region <strong>of</strong> <strong>the</strong> <strong>genome</strong> into ano<strong>the</strong>r region; <strong>and</strong> (5) blocks <strong>of</strong>t<strong>and</strong>emly repeated sequences, such as at centromeres, telomeres,<strong>the</strong> short arms <strong>of</strong> acrocentric chromosomes <strong>and</strong> ribosomal geneclusters. (These regions are intentionally under-represented in <strong>the</strong>draft <strong>genome</strong> sequence <strong>and</strong> are not discussed here.)Repeats are <strong>of</strong>ten described as `junk' <strong>and</strong> dismissed as uninteresting.However, <strong>the</strong>y actually represent an extraordinary trove <strong>of</strong>information about biological processes. The repeats constitute arich palaeontological record, holding crucial clues about evolutionaryevents <strong>and</strong> forces. As passive markers, <strong>the</strong>y provide assaysfor studying processes <strong>of</strong> mutation <strong>and</strong> selection. It is possible torecognize cohorts <strong>of</strong> repeats `born' at <strong>the</strong> same time <strong>and</strong> to follow<strong>the</strong>ir fates in different regions <strong>of</strong> <strong>the</strong> <strong>genome</strong> or in different species.As active agents, repeats have reshaped <strong>the</strong> <strong>genome</strong> by causingectopic rearrangements, creating entirely new genes, modifying <strong>and</strong>reshuf¯ing existing genes, <strong>and</strong> modulating overall GC content. Theyalso shed light on chromosome structure <strong>and</strong> dynamics, <strong>and</strong>provide tools for medical genetic <strong>and</strong> population genetic studies.The <strong>human</strong> is <strong>the</strong> ®rst repeat-rich <strong>genome</strong> to be sequenced, <strong>and</strong>so we investigated what information could be gleaned from thismajority component <strong>of</strong> <strong>the</strong> <strong>human</strong> <strong>genome</strong>. Although some <strong>of</strong> <strong>the</strong>general observations about repeats were suggested by previousstudies, <strong>the</strong> draft <strong>genome</strong> sequence provides <strong>the</strong> ®rst comprehensiveview, allowing some questions to be resolved <strong>and</strong> new mysteries toemerge.Transposon-derived repeatsMost <strong>human</strong> repeat sequence is derived from transposableelements 142,143 . We can currently recognize about 45% <strong>of</strong> <strong>the</strong><strong>genome</strong> as belonging to this class. Much <strong>of</strong> <strong>the</strong> remaining`unique' DNA must also be derived from ancient transposableelement copies that have diverged too far to be recognized assuch. To describe our analyses <strong>of</strong> interspersed repeats, it is necessarybrie¯y to review <strong>the</strong> relevant features <strong>of</strong> <strong>human</strong> transposableelements.Classes <strong>of</strong> transposable elements. In mammals, almost all transposableelements fall into one <strong>of</strong> four types (Fig. 17), <strong>of</strong> which threetranspose through RNA intermediates <strong>and</strong> one transposes directlyas DNA. These are long interspersed elements (LINEs), shortinterspersed elements (SINEs), LTR retrotransposons <strong>and</strong> DNAtransposons.LINEs are one <strong>of</strong> <strong>the</strong> most ancient <strong>and</strong> successful inventions ineukaryotic <strong>genome</strong>s. In <strong>human</strong>s, <strong>the</strong>se transposons are about 6 kblong, harbour an internal polymerase II promoter <strong>and</strong> encode twoopen reading frames (ORFs). Upon translation, a LINE RNAassembles with its own encoded proteins <strong>and</strong> moves to <strong>the</strong> nucleus,where an endonuclease activity makes a single-str<strong>and</strong>ed nick <strong>and</strong><strong>the</strong> reverse transcriptase uses <strong>the</strong> nicked DNA to prime reversetranscription from <strong>the</strong> 39 end <strong>of</strong> <strong>the</strong> LINE RNA. Reverse transcriptionfrequently fails to proceed to <strong>the</strong> 59 end, resulting in manytruncated, nonfunctional insertions. Indeed, most LINE-derivedrepeats are short, with an average size <strong>of</strong> 900 bp for all LINE1 copies,<strong>and</strong> a median size <strong>of</strong> 1,070 bp for copies <strong>of</strong> <strong>the</strong> currently activeLINE1 element (L1Hs). New insertion sites are ¯anked by a smallNATURE | VOL 409 | 15 FEBRUARY 2001 | www.nature.com © 2001 Macmillan Magazines Ltd879
articlesClasses <strong>of</strong> interspersed repeat in <strong>the</strong> <strong>human</strong> <strong>genome</strong>Length CopynumberLINEs AutonomousORF1 ORF2 (pol)AAA 6–8 kb 850,000ABSINEs Non-autonomous AAA100–300 bp 1,500,000Fraction <strong>of</strong><strong>genome</strong>21%13%Retrovirus-likeelementsAutonomousNon-autonomousgag pol (env)(gag)6–11 kb1.5–3 kb450,0008%DNAtransposonfossilsAutonomousNon-autonomoustransposase2–3 kb80–3,000 bp300,0003%Figure 17 Almost all transposable elements in mammals fall into one <strong>of</strong> four classes. See text for details.target site duplication <strong>of</strong> 7±20 bp. The LINE machinery is believedto be responsible for most reverse transcription in <strong>the</strong> <strong>genome</strong>,including <strong>the</strong> retrotransposition <strong>of</strong> <strong>the</strong> non-autonomous SINEs 144<strong>and</strong> <strong>the</strong> creation <strong>of</strong> processed pseudogenes 145,146 . Three distantlyrelated LINE families are found in <strong>the</strong> <strong>human</strong> <strong>genome</strong>: LINE1,LINE2 <strong>and</strong> LINE3. Only LINE1 is still active.SINEs are wildly successful freeloaders on <strong>the</strong> backs <strong>of</strong> LINEelements. They are short (about 100±400 bp), harbour an internalpolymerase III promoter <strong>and</strong> encode no proteins. These nonautonomoustransposons are thought to use <strong>the</strong> LINE machineryfor transposition. Indeed, most SINEs `live' by sharing <strong>the</strong> 39 endwith a resident LINE element 144 . The promoter regions <strong>of</strong> all knownSINEs are derived from tRNA sequences, with <strong>the</strong> exception <strong>of</strong> asingle monophyletic family <strong>of</strong> SINEs derived from <strong>the</strong> signalrecognition particle component 7SL. This family, which also doesnot share its 39 end with a LINE, includes <strong>the</strong> only active SINE in <strong>the</strong><strong>human</strong> <strong>genome</strong>: <strong>the</strong> Alu element. By contrast, <strong>the</strong> mouse has bothtRNA-derived <strong>and</strong> 7SL-derived SINEs. The <strong>human</strong> <strong>genome</strong> containsthree distinct monophyletic families <strong>of</strong> SINEs: <strong>the</strong> active Alu,<strong>and</strong> <strong>the</strong> inactive MIR <strong>and</strong> Ther2/MIR3.LTR retroposons are ¯anked by long terminal direct repeats thatcontain all <strong>of</strong> <strong>the</strong> necessary transcriptional regulatory elements. Theautonomous elements (retrotransposons) contain gag <strong>and</strong> polgenes, which encode a protease, reverse transcriptase, RNAse H<strong>and</strong> integrase. Exogenous retroviruses seem to have arisen fromendogenous retrotransposons by acquisition <strong>of</strong> a cellular envelopegene (env) 147 . Transposition occurs through <strong>the</strong> retroviral mechanismwith reverse transcription occurring in a cytoplasmic virus-likeparticle, primed by a tRNA (in contrast to <strong>the</strong> nuclear location <strong>and</strong>chromosomal priming <strong>of</strong> LINEs). Although a variety <strong>of</strong> LTR retrotransposonsexist, only <strong>the</strong> vertebrate-speci®c endogenous retroviruses(ERVs) appear to have been active in <strong>the</strong> mammalian<strong>genome</strong>. Mammalian retroviruses fall into three classes (I±III),each comprising many families with independent origins. Most(85%) <strong>of</strong> <strong>the</strong> LTR retroposon-derived `fossils' consist only <strong>of</strong> anisolated LTR, with <strong>the</strong> internal sequence having been lost byhomologous recombination between <strong>the</strong> ¯anking LTRs.DNA transposons resemble bacterial transposons, having terminalinverted repeats <strong>and</strong> encoding a transposase that binds near <strong>the</strong>inverted repeats <strong>and</strong> mediates mobility through a `cut-<strong>and</strong>-paste'mechanism. The <strong>human</strong> <strong>genome</strong> contains at least seven majorclasses <strong>of</strong> DNA transposon, which can be subdivided into manyfamilies with independent origins 148 (see RepBase, http://www.girinst.org/,server/repbase.html). DNA transposons tend to haveshort life spans within a species. This can be explained by contrasting<strong>the</strong> modes <strong>of</strong> transposition <strong>of</strong> DNA transposons <strong>and</strong> LINEelements. LINE transposition tends to involve only functionalelements, owing to <strong>the</strong> cis-preference by which LINE proteinsassemble with <strong>the</strong> RNA from which <strong>the</strong>y were translated. Bycontrast, DNA transposons cannot exercise a cis-preference: <strong>the</strong>encoded transposase is produced in <strong>the</strong> cytoplasm <strong>and</strong>, when itreturns to <strong>the</strong> nucleus, it cannot distinguish active from inactiveelements. As inactive copies accumulate in <strong>the</strong> <strong>genome</strong>, transpositionbecomes less ef®cient. This checks <strong>the</strong> expansion <strong>of</strong> any DNAtransposon family <strong>and</strong> in due course causes it to die out. To survive,DNA transposons must eventually move by horizontal transferto virgin <strong>genome</strong>s, <strong>and</strong> <strong>the</strong>re is considerable evidence for suchtransfer 149±153 .Transposable elements employ different strategies to ensure <strong>the</strong>irevolutionary survival. LINEs <strong>and</strong> SINEs rely almost exclusively onvertical transmission within <strong>the</strong> host <strong>genome</strong> 154 (but see refs 148,155). DNA transposons are more promiscuous, requiring relativelyfrequent horizontal transfer. LTR retroposons use both strategies,with some being long-term active residents <strong>of</strong> <strong>the</strong> <strong>human</strong> <strong>genome</strong>(such as members <strong>of</strong> <strong>the</strong> ERVL family) <strong>and</strong> o<strong>the</strong>rs having only shortresidence times.Table 11 Number <strong>of</strong> copies <strong>and</strong> fraction <strong>of</strong> <strong>genome</strong> for classes <strong>of</strong> interspersedrepeatNumber <strong>of</strong>copies (´ 1,000)Total number <strong>of</strong>bases in <strong>the</strong> draft<strong>genome</strong>sequence (Mb)Fraction <strong>of</strong> <strong>the</strong>draft <strong>genome</strong>sequence (%)Number <strong>of</strong>families(subfamilies)SINEs 1,558 359.6 13.14Alu 1,090 290.1 10.60 1 (,20)MIR 393 60.1 2.20 1 (1)MIR3 75 9.3 0.34 1 (1)LINEs 868 558.8 20.42LINE1 516 462.1 16.89 1 (,55)LINE2 315 88.2 3.22 1 (2)LINE3 37 8.4 0.31 1 (2)LTR elements 443 227.0 8.29ERV-class I 112 79.2 2.89 72 (132)ERV(K)-class II 8 8.5 0.31 10 (20)ERV (L)-class III 83 39.5 1.44 21 (42)MaLR 240 99.8 3.65 1 (31)DNA elements 294 77.6 2.84hAT groupMER1-Charlie 182 38.1 1.39 25 (50)Zaphod 13 4.3 0.16 4 (10)Tc-1 groupMER2-Tigger 57 28.0 1.02 12 (28)Tc2 4 0.9 0.03 1 (5)Mariner 14 2.6 0.10 4 (5)PiggyBac-like 2 0.5 0.02 10 (20)Unclassi®ed 22 3.2 0.12 7 (7)Unclassi®ed 3 3.8 0.14 3 (4)Total interspersed1,226.8 44.83repeats.............................................................................................................................................................................The number <strong>of</strong> copies <strong>and</strong> base pair contributions <strong>of</strong> <strong>the</strong> major classes <strong>and</strong> subclasses <strong>of</strong>transposable elements in <strong>the</strong> <strong>human</strong> <strong>genome</strong>. Data extracted from a RepeatMasker <strong>analysis</strong> <strong>of</strong><strong>the</strong> draft <strong>genome</strong> sequence (RepeatMasker version 09092000, sensitive settings, using RepBaseUpdate 5.08). In calculating percentages, RepeatMasker excluded <strong>the</strong> runs <strong>of</strong> Ns linking <strong>the</strong> contigsin <strong>the</strong> draft <strong>genome</strong> sequence. In <strong>the</strong> last column, separate consensus sequences in <strong>the</strong> repeatdatabases are considered subfamilies, ra<strong>the</strong>r than families, when <strong>the</strong> sequences are closely relatedor related through intermediate subfamilies.880 © 2001 Macmillan Magazines Ltd NATURE | VOL 409 | 15 FEBRUARY 2001 | www.nature.com
transposon <strong>and</strong>, being generally under no functional constraint, hasaccumulated mutations r<strong>and</strong>omly <strong>and</strong> independently <strong>of</strong> o<strong>the</strong>rcopies. We can infer <strong>the</strong> sequence <strong>of</strong> <strong>the</strong> ancestral active elementsby clustering <strong>the</strong> modern derivatives into phylogenetic trees <strong>and</strong>building a consensus based on <strong>the</strong> multiple sequence alignment <strong>of</strong> acluster <strong>of</strong> copies. Using available consensus sequences for knownrepeat subfamilies, we calculated <strong>the</strong> per cent divergence from <strong>the</strong>inferred ancestral active transposon for each <strong>of</strong> three millioninterspersed repeats in <strong>the</strong> draft <strong>genome</strong> sequence.The percentage <strong>of</strong> sequence divergence can be converted into anapproximate age in millions <strong>of</strong> years (Myr) on <strong>the</strong> basis <strong>of</strong> evolutionaryinformation. Care is required in calibrating <strong>the</strong> clock,because <strong>the</strong> rate <strong>of</strong> sequence divergence may not be constant overtime or between lineages 139 . The relative-rate test 157 can be used tocalculate <strong>the</strong> sequence divergence that accumulated in a lineage aftera given timepoint, on <strong>the</strong> basis <strong>of</strong> comparison with a sibling speciesthat diverged at that time <strong>and</strong> an outgroup species. For example, <strong>the</strong>substitution rate over roughly <strong>the</strong> last 25 Myr in <strong>the</strong> <strong>human</strong> lineagecan be calculated by using old world monkeys (which divergedabout 25 Myr ago) as a sibling species <strong>and</strong> new world monkeys as anoutgroup. We have used currently available calibrations for <strong>the</strong><strong>human</strong> lineage, but <strong>the</strong> issue should be revisited as sequenceinformation becomes available from different mammals.Figure 18a shows <strong>the</strong> representation <strong>of</strong> various classes <strong>of</strong> transarticlesCensus <strong>of</strong> <strong>human</strong> repeats. We began by taking a census <strong>of</strong> <strong>the</strong>transposable elements in <strong>the</strong> draft <strong>genome</strong> sequence, using arecently updated version <strong>of</strong> <strong>the</strong> RepeatMasker program (version09092000) run under sensitive settings (see http://repeatmasker.<strong>genome</strong>.washington.edu). This program scans sequences to identifyfull-length <strong>and</strong> partial members <strong>of</strong> all known repeat familiesrepresented in RepBase Update (version 5.08; see http://www.girinst.org/,server/repbase.html <strong>and</strong> ref. 156). Table 11 shows <strong>the</strong>number <strong>of</strong> copies <strong>and</strong> fraction <strong>of</strong> <strong>the</strong> draft <strong>genome</strong> sequenceoccupied by each <strong>of</strong> <strong>the</strong> four major classes <strong>and</strong> <strong>the</strong> main subclasses.The precise count <strong>of</strong> repeats is obviously underestimated because<strong>the</strong> <strong>genome</strong> sequence is not ®nished, but <strong>the</strong>ir density <strong>and</strong> o<strong>the</strong>rproperties can be stated with reasonable con®dence. Currentlyrecognized SINEs, LINEs, LTR retroposons <strong>and</strong> DNA transposoncopies comprise 13%, 20%, 8% <strong>and</strong> 3% <strong>of</strong> <strong>the</strong> sequence, respectively.We expect <strong>the</strong>se densities to grow as more repeat families arerecognized, among which will be lower copy number LTR elements<strong>and</strong> DNA transposons, <strong>and</strong> possibly high copy number ancient(highly diverged) repeats.Age distribution. The age distribution <strong>of</strong> <strong>the</strong> repeats in <strong>the</strong> <strong>human</strong><strong>genome</strong> provides a rich `fossil record' stretching over severalhundred million years. The ancestry <strong>and</strong> approximate age <strong>of</strong> eachfossil can be inferred by exploiting <strong>the</strong> fact that each copy is derivedfrom, <strong>and</strong> <strong>the</strong>refore initially carried <strong>the</strong> sequence <strong>of</strong>, a <strong>the</strong>n-activeaFraction <strong>of</strong> <strong>human</strong> <strong>genome</strong>comprised by repeat class (%)cFraction <strong>of</strong> mouse <strong>genome</strong>comprised by repeat class (%)2.62.42.22.01.81.61.41.21.00.80.60.40.20.01.41.21.00.80.60.40.2
articlesposable elements in categories re¯ecting equal amounts <strong>of</strong> sequencedivergence. In Fig. 18b <strong>the</strong> data are grouped into four binscorresponding to successive 25-Myr periods, on <strong>the</strong> basis <strong>of</strong> anapproximate clock. Figure 19 shows <strong>the</strong> mean ages <strong>of</strong> varioussubfamilies <strong>of</strong> DNA transposons. Several facts are apparent from<strong>the</strong>se graphs. First, most interspersed repeats in <strong>the</strong> <strong>human</strong> <strong>genome</strong>predate <strong>the</strong> eu<strong>the</strong>rian radiation. This is a testament to <strong>the</strong> extremelyslow rate with which nonfunctional sequences are cleared fromvertebrate <strong>genome</strong>s (see below concerning comparison with <strong>the</strong> ¯y).Second, LINE <strong>and</strong> SINE elements have extremely long lives. Themonophyletic LINE1 <strong>and</strong> Alu lineages are at least 150 <strong>and</strong> 80 Myrold, respectively. In earlier times, <strong>the</strong> reigning transposons wereLINE2 <strong>and</strong> MIR 148,158 . The SINE MIR was perfectly adapted forreverse transcription by LINE2, as it carried <strong>the</strong> same 50-basesequence at its 39 end. When LINE2 became extinct 80±100 Myrago, it spelled <strong>the</strong> doom <strong>of</strong> MIR.Third, <strong>the</strong>re were two major peaks <strong>of</strong> DNA transposon activity(Fig. 19). The ®rst involved Charlie elements <strong>and</strong> occurred longbefore <strong>the</strong> eu<strong>the</strong>rian radiation; <strong>the</strong> second involved Tigger elements<strong>and</strong> occurred after this radiation. Because DNA transposons canproduce large-scale chromosome rearrangements 159±162 , it is possiblethat widespread activity could be involved in speciation events.Fourth, <strong>the</strong>re is no evidence for DNA transposon activity in <strong>the</strong>past 50 Myr in <strong>the</strong> <strong>human</strong> <strong>genome</strong>. The youngest two DNAtransposon families that we can identify in <strong>the</strong> draft <strong>genome</strong>sequence (MER75 <strong>and</strong> MER85) show 6±7% divergence from <strong>the</strong>irrespective consensus sequences representing <strong>the</strong> ancestral element(Fig. 19), indicating that <strong>the</strong>y were active before <strong>the</strong> divergence <strong>of</strong><strong>human</strong>s <strong>and</strong> new world monkeys. Moreover, <strong>the</strong>se elements wererelatively unsuccessful, toge<strong>the</strong>r contributing just 125 kb to <strong>the</strong> draft<strong>genome</strong> sequence.Number <strong>of</strong> kb covered by family8,0007,0006,0005,0004,0003,0002,0001,000CharliePiggyBac-likeMarinerTc2TiggerUnclassifiedZaphod00 0.05 0.1 0.15 0.2 0.25 0.3 0.35 0.4Average nucleotide substitution level for familyFigure 19 Median ages <strong>and</strong> per cent <strong>of</strong> <strong>the</strong> <strong>genome</strong> covered by subfamilies <strong>of</strong> DNAtransposons. The Charlie <strong>and</strong> Zaphod elements were hobo-Activator-Tam3 (hAT) DNAtransposons; Mariner, Tc2 <strong>and</strong> Tigger were Tc1-like elements. Unlike retroposons, DNAtransposons are thought to have a short life span in a <strong>genome</strong>. Thus, <strong>the</strong> average ormedian divergence <strong>of</strong> copies from <strong>the</strong> consensus is a particularly accurate measure <strong>of</strong> <strong>the</strong>age <strong>of</strong> <strong>the</strong> DNA transposon copies.Finally, LTR retroposons appear to be teetering on <strong>the</strong> brink <strong>of</strong>extinction, if <strong>the</strong>y have not already succumbed. For example, <strong>the</strong>most proli®c elements (ERVL <strong>and</strong> MaLRs) ¯ourished for more than100 Myr but appear to have died out about 40 Myr ago 163,164 . Only asingle LTR retroposon family (HERVK10) is known to have transposedsince our divergence from <strong>the</strong> chimpanzee 7 Myr ago, withonly one known copy (in <strong>the</strong> HLA region) that is not sharedbetween all <strong>human</strong>s 165 . In <strong>the</strong> draft <strong>genome</strong> sequence, we canidentify only three full-length copies with all ORFs intact (<strong>the</strong>®nal total may be slightly higher owing to <strong>the</strong> imperfect state <strong>of</strong><strong>the</strong> draft <strong>genome</strong> sequence).More generally, <strong>the</strong> overall activity <strong>of</strong> all transposons has declinedmarkedly over <strong>the</strong> past 35±50 Myr, with <strong>the</strong> possible exception <strong>of</strong>LINE1 (Fig. 18). Indeed, apart from an exceptional burst <strong>of</strong> activity<strong>of</strong> Alus peaking around 40 Myr ago, <strong>the</strong>re would appear to havebeen a fairly steady decline in activity in <strong>the</strong> hominid lineage since<strong>the</strong> mammalian radiation. The extent <strong>of</strong> <strong>the</strong> decline must be evengreater than it appears because old repeats are gradually removed byr<strong>and</strong>om deletion <strong>and</strong> because old repeat families are harder torecognize <strong>and</strong> likely to be under-represented in <strong>the</strong> repeat databases.(We con®rmed that <strong>the</strong> decline in transposition is not an artefactarising from errors in <strong>the</strong> draft <strong>genome</strong> sequence, which, inprinciple, could increase <strong>the</strong> divergence level in recent elements.First, <strong>the</strong> sequence error rate (Table 9) is far too low to have asigni®cant effect on <strong>the</strong> apparent age <strong>of</strong> recent transposons; <strong>and</strong>second, <strong>the</strong> same result is seen if one considers only ®nishedsequence.)What explains <strong>the</strong> decline in transposon activity in <strong>the</strong> lineageleading to <strong>human</strong>s? We return to this question below, in <strong>the</strong> context<strong>of</strong> <strong>the</strong> observation that <strong>the</strong>re is no similar decline in <strong>the</strong> mouse<strong>genome</strong>.Comparison with o<strong>the</strong>r organisms. We compared <strong>the</strong> complement<strong>of</strong> transposable elements in <strong>the</strong> <strong>human</strong> <strong>genome</strong> with those <strong>of</strong> <strong>the</strong>o<strong>the</strong>r sequenced eukaryotic <strong>genome</strong>s. We analysed <strong>the</strong> ¯y, worm<strong>and</strong> mustard weed <strong>genome</strong>s for <strong>the</strong> number <strong>and</strong> nature <strong>of</strong> repeats(Table 12) <strong>and</strong> <strong>the</strong> age distribution (Fig. 20). (For <strong>the</strong> ¯y, weanalysed <strong>the</strong> 114 Mb <strong>of</strong> un®nished `large' contigs produced by <strong>the</strong>whole-<strong>genome</strong> shotgun assembly 166 , which are reported to representeuchromatic sequence. Similar results were obtained by analysing30 Mb <strong>of</strong> ®nished euchromatic sequence.) The <strong>human</strong> <strong>genome</strong>st<strong>and</strong>s in stark contrast to <strong>the</strong> <strong>genome</strong>s <strong>of</strong> <strong>the</strong> o<strong>the</strong>r organisms.(1) The euchromatic portion <strong>of</strong> <strong>the</strong> <strong>human</strong> <strong>genome</strong> has a muchhigher density <strong>of</strong> transposable element copies than <strong>the</strong> euchromaticDNA <strong>of</strong> <strong>the</strong> o<strong>the</strong>r three organisms. The repeats in <strong>the</strong> o<strong>the</strong>rorganisms may have been slightly underestimated because <strong>the</strong>repeat databases for <strong>the</strong> o<strong>the</strong>r organisms are less complete thanfor <strong>the</strong> <strong>human</strong>, especially with regard to older elements; on <strong>the</strong> o<strong>the</strong>rh<strong>and</strong>, recent additions to <strong>the</strong>se databases appear to increase <strong>the</strong>repeat content only marginally.(2) The <strong>human</strong> <strong>genome</strong> is ®lled with copies <strong>of</strong> ancient transposons,whereas <strong>the</strong> transposons in <strong>the</strong> o<strong>the</strong>r <strong>genome</strong>s tend to be <strong>of</strong> morerecent origin. The difference is most marked with <strong>the</strong> ¯y, but is clearfor <strong>the</strong> o<strong>the</strong>r <strong>genome</strong>s as well. The accumulation <strong>of</strong> old repeats islikely to be determined by <strong>the</strong> rate at which organisms engage in`housecleaning' through genomic deletion. Studies <strong>of</strong> pseudogenesTable 12 Number <strong>and</strong> nature <strong>of</strong> interspersed repeats in eukaryotic <strong>genome</strong>sPercentage<strong>of</strong> basesHuman Fly Worm Mustard weedApproximatenumber <strong>of</strong>familiesPercentage<strong>of</strong> basesApproximatenumber <strong>of</strong>familiesPercentage<strong>of</strong> basesApproximatenumber <strong>of</strong>familiesPercentage<strong>of</strong> basesApproximatenumber <strong>of</strong>familiesLINE/SINE 33.40% 6 0.70% 20 0.40% 10 0.50% 10LTR 8.10% 100 1.50% 50 0.00% 4 4.80% 70DNA 2.80% 60 0.70% 20 5.30% 80 5.10% 80Total 44.40% 170 3.10% 90 6.50% 90 10.50% 160...................................................................................................................................................................................................................................................................................................................................................................The complete <strong>genome</strong>s <strong>of</strong> ¯y, worm, <strong>and</strong> chromosomes 2 <strong>and</strong> 4 <strong>of</strong> mustard weed (as deposited at ncbi.nlm.nih.gov/genbank/<strong>genome</strong>s) were screened against <strong>the</strong> repeats in RepBase Update 5.02(September 2000) with RepeatMasker at sensitive settings.882 © 2001 Macmillan Magazines Ltd NATURE | VOL 409 | 15 FEBRUARY 2001 | www.nature.com
articleshave suggested that small deletions occur at a rate that is 75-foldhigher in ¯ies than in mammals; <strong>the</strong> half-life <strong>of</strong> such nonfunctionalDNA is estimated at 12 Myr for ¯ies <strong>and</strong> 800 Myr for mammals 167 .The rate <strong>of</strong> large deletions has not been systematically compared,but seems likely also to differ markedly.(3) Whereas in <strong>the</strong> <strong>human</strong> two repeat families (LINE1 <strong>and</strong> Alu)account for 60% <strong>of</strong> all interspersed repeat sequence, <strong>the</strong> o<strong>the</strong>rorganisms have no dominant families. Instead, <strong>the</strong> worm, ¯y <strong>and</strong>mustard weed <strong>genome</strong>s all contain many transposon families, eachconsisting <strong>of</strong> typically hundreds to thous<strong>and</strong>s <strong>of</strong> elements. Thisdifference may be explained by <strong>the</strong> observation that <strong>the</strong> verticallytransmitted, long-term residential LINE <strong>and</strong> SINE elements represent75% <strong>of</strong> interspersed repeats in <strong>the</strong> <strong>human</strong> <strong>genome</strong>, but only 5±25% in <strong>the</strong> o<strong>the</strong>r <strong>genome</strong>s. In contrast, <strong>the</strong> horizontally transmitted<strong>and</strong> shorter-lived DNA transposons represent only a small portion<strong>of</strong> all interspersed repeats in <strong>human</strong>s (6%) but a much largerfraction in ¯y, mustard weed <strong>and</strong> worm (25%, 49% <strong>and</strong> 87%,respectively). These features <strong>of</strong> <strong>the</strong> <strong>human</strong> <strong>genome</strong> are probablygeneral to all mammals. The relative lack <strong>of</strong> horizontally transmittedelements may have its origin in <strong>the</strong> well developed immune system<strong>of</strong> mammals, as horizontal transfer requires infectious vectors, suchas viruses, against which <strong>the</strong> immune system guards.We also looked for differences among mammals, by comparing<strong>the</strong> transposons in <strong>the</strong> <strong>human</strong> <strong>and</strong> mouse <strong>genome</strong>s. As with <strong>the</strong><strong>human</strong> <strong>genome</strong>, care is required in calibrating <strong>the</strong> substitution clockfor <strong>the</strong> mouse <strong>genome</strong>. There is considerable evidence that <strong>the</strong> rate<strong>of</strong> substitution per Myr is higher in rodent lineages than in <strong>the</strong>hominid lineages 139,168,169 . In fact, we found clear evidence fordifferent rates <strong>of</strong> substitution by examining families <strong>of</strong> transposableelements whose insertions predate <strong>the</strong> divergence <strong>of</strong> <strong>the</strong> <strong>human</strong> <strong>and</strong>mouse lineages. In an <strong>analysis</strong> <strong>of</strong> 22 such families, we found that <strong>the</strong>substitution level was an average <strong>of</strong> 1.7-fold higher in mouse than<strong>human</strong> (not shown). (This is likely to be an underestimate because<strong>of</strong> an ascertainment bias against <strong>the</strong> most diverged copies.) Thefaster clock in mouse is also evident from <strong>the</strong> fact that <strong>the</strong> ancientLINE2 <strong>and</strong> MIR elements, which transposed before <strong>the</strong> mammalianradiation <strong>and</strong> are readily detectable in <strong>the</strong> <strong>human</strong> <strong>genome</strong>, cannotbe readily identi®ed in available mouse genomic sequence (Fig. 18).We used <strong>the</strong> best available estimates to calibrate substitutionlevels <strong>and</strong> time 169 . The ratio <strong>of</strong> substitution rates varied from about1.7-fold higher over <strong>the</strong> past 100 Myr to about 2.6-fold higher over<strong>the</strong> past 25 Myr.The <strong>analysis</strong> shows that, although <strong>the</strong> overall density <strong>of</strong> <strong>the</strong> fourtransposon types in <strong>human</strong> <strong>and</strong> mouse is similar, <strong>the</strong> age distributionis strikingly different (Fig. 18). Transposon activity in <strong>the</strong>mouse <strong>genome</strong> has not undergone <strong>the</strong> decline seen in <strong>human</strong>s <strong>and</strong>proceeds at a much higher rate. In contrast to <strong>the</strong>ir possibleextinction in <strong>human</strong>s, LTR retroposons are alive <strong>and</strong> well in <strong>the</strong>Proportion <strong>of</strong> interspersed repeats (%)1009080706050403020100HumanFlyWormMustardweed>25% Oldest
articlesProportion <strong>of</strong> <strong>genome</strong> comprised by each class (%)6050403020100SSRLINE2 MIRDNALINE1 ALULTR54GC content (%)Figure 22 Density <strong>of</strong> <strong>the</strong> major repeat classes as a function <strong>of</strong> local GC content, in windows <strong>of</strong> 50 kb.2.0100Frequency <strong>of</strong> Alu class relative to itsaverage density in <strong>the</strong> <strong>genome</strong>1.81.61.41.21.00.80.60.40.2Proportion <strong>of</strong> DNA transposonscomprised by each age group (%)80604020Nucleotidesubsitutionlevel24–30%21–23%16–20%14–15.5%0–13%0.054AluY < 1% ( 4% (5–30 Myr)GC content bins (%)AluSc (25–35 Myr)AluS (35–60 Myr)AluJ, FAM (60–100 Myr)052GC content bins (%)Figure 24 DNA transposon copies in AT-rich DNA tend to be younger than those in moreGC-rich DNA. DNA transposon families were grouped into ®ve age categories by <strong>the</strong>irmedian substitution level (see Fig. 19). The proportion attributed to each age class isshown as a function <strong>of</strong> GC content. Similar patterns are seen for LINE1 <strong>and</strong> LTR elements.Figure 23 Alu elements target AT-rich DNA, but accumulate in GC-rich DNA. This graphshows <strong>the</strong> relative distribution <strong>of</strong> various Alu cohorts as a function <strong>of</strong> local GC content. Thedivergence levels (including CpG sites) <strong>and</strong> ages <strong>of</strong> <strong>the</strong> cohorts are shown in <strong>the</strong> key.similarly resisted <strong>the</strong> insertion <strong>of</strong> transposable elements duringrodent evolution.Distribution by GC content. We next focused on <strong>the</strong> correlationbetween <strong>the</strong> nature <strong>of</strong> <strong>the</strong> transposons in a region <strong>and</strong> its GCcontent. We calculated <strong>the</strong> density <strong>of</strong> each repeat type as a function<strong>of</strong> <strong>the</strong> GC content in 50-kb windows (Fig. 22). As has beenreported 142,173±176 , LINE sequences occur at much higher density inAT-rich regions (roughly fourfold enriched), whereas SINEs (MIR,Alu) show <strong>the</strong> opposite trend (for Alu, up to ®vefold lower in ATrichDNA). LTR retroposons <strong>and</strong> DNA transposons show a moreuniform distribution, dipping only in <strong>the</strong> most GC-rich regions.The preference <strong>of</strong> LINEs for AT-rich DNA seems like a reasonableway for a genomic parasite to accommodate its host, by targetinggene-poor AT-rich DNA <strong>and</strong> <strong>the</strong>reby imposing a lower mutationalburden. Mechanistically, selective targeting is nicely explained by<strong>the</strong> fact that <strong>the</strong> preferred cleavage site <strong>of</strong> <strong>the</strong> LINE endonuclease isTTTT/A (where <strong>the</strong> slash indicates <strong>the</strong> point <strong>of</strong> cleavage), which isused to prime reverse transcription from <strong>the</strong> poly(A) tail <strong>of</strong> LINERNA 177 .The contrary behaviour <strong>of</strong> SINEs, however, is baf¯ing. How doSINEs accumulate in GC-rich DNA, particularly if <strong>the</strong>y depend on<strong>the</strong> LINE transposition machinery 178 ? Notably, <strong>the</strong> same pattern isseen for <strong>the</strong> Alu-like B1 <strong>and</strong> <strong>the</strong> tRNA-derived SINEs in mouse <strong>and</strong>for MIR in <strong>human</strong> 142 . One possibility is that SINEs somehow targetGC-rich DNA for insertion. The alternative is that SINEs initiallyinsert with <strong>the</strong> same proclivity for AT-rich DNA as LINEs, but that<strong>the</strong> distribution is subsequently reshaped by evolutionaryforces 142,179 .We used <strong>the</strong> draft <strong>genome</strong> sequence to investigate this mystery bycomparing <strong>the</strong> proclivities <strong>of</strong> young, adolescent, middle-aged <strong>and</strong>old Alus (Fig. 23). Strikingly, recent Alus show a preference for ATrichDNA resembling that <strong>of</strong> LINEs, whereas progressively olderAlus show a progressively stronger bias towards GC-rich DNA.These results indicate that <strong>the</strong> GC bias must result from strongpressure: Fig. 23 shows that a 13-fold enrichment <strong>of</strong> Alus in GC-richDNA has occurred within <strong>the</strong> last 30 Myr, <strong>and</strong> possibly morerecently.These results raise a new mystery. What is <strong>the</strong> force that produces<strong>the</strong> great <strong>and</strong> rapid enrichment <strong>of</strong> Alus in GC-rich DNA? Oneexplanation may be that deletions are more readily tolerated ingene-poor AT-rich regions than in gene-rich GC-rich regions,resulting in older elements being enriched in GC-rich regions.Such an enrichment is seen for transposable elements such as884 © 2001 Macmillan Magazines Ltd NATURE | VOL 409 | 15 FEBRUARY 2001 | www.nature.com
articlesDNA transposons (Fig. 24). However, this effect seems too slow <strong>and</strong>too small to account for <strong>the</strong> observed remodelling <strong>of</strong> <strong>the</strong> Aludistribution. This can be seen by performing a similar <strong>analysis</strong> forLINE elements (Fig. 25). There is no signi®cant change in <strong>the</strong> LINEdistribution over <strong>the</strong> past 100 Myr, in contrast to <strong>the</strong> rapid changeseen for Alu. There is an eventual shift after more than 100 Myr,although its magnitude is still smaller than seen for Alus.These observations indicate that <strong>the</strong>re may be some force actingparticularly on Alus. This could be a higher rate <strong>of</strong> r<strong>and</strong>om loss <strong>of</strong>Alus in AT-rich DNA, negative selection against Alus in AT-richDNA or positive selection in favour <strong>of</strong> Alus in GC-rich DNA.The ®rst two possibilities seem unlikely because AT-rich DNA isFrequency <strong>of</strong> L1 class relative to itsaverage density in <strong>the</strong> <strong>genome</strong>2.01.81.61.41.21.00.80.60.40.20.052gene-poor <strong>and</strong> tolerates <strong>the</strong> accumulation <strong>of</strong> o<strong>the</strong>r transposableelements. The third seems more feasible, in that it involves selectingin favour <strong>of</strong> <strong>the</strong> minority <strong>of</strong> Alus in GC-rich regions ra<strong>the</strong>r thanagainst <strong>the</strong> majority that lie in AT-rich regions. But positiveselection for Alus in GC-rich regions would imply that <strong>the</strong>y bene®t<strong>the</strong> organism.Schmid 180 has proposed such a function for SINEs. This hypo<strong>the</strong>sisis based on <strong>the</strong> observation that in many species SINEs aretranscribed under conditions <strong>of</strong> stress, <strong>and</strong> <strong>the</strong> resulting RNAsspeci®cally bind a particular protein kinase (PKR) <strong>and</strong> block itsability to inhibit protein translation 181±183 . SINE RNAs would thuspromote protein translation under stress. SINE RNA may be wellsuited to such a role in regulating protein translation, because it canbe quickly transcribed in large quantities from thous<strong>and</strong>s <strong>of</strong>elements <strong>and</strong> it can function without protein translation. Underthis <strong>the</strong>ory, <strong>the</strong>re could be positive selection for SINEs in readilytranscribed open chromatin such as is found near genes. This couldexplain <strong>the</strong> retention <strong>of</strong> Alus in gene-rich GC-rich regions. It is alsoconsistent with <strong>the</strong> observation that SINE density in AT-rich DNA ishigher near genes 142 .Fur<strong>the</strong>r insight about Alus comes from <strong>the</strong> relationship betweenAlu density <strong>and</strong> GC content on individual chromosomes (Fig. 26).There are two outliers. Chromosome 19 is even richer in Alus thanpredicted by its (high) GC content; <strong>the</strong> chromosome comprises 2%<strong>of</strong> <strong>the</strong> <strong>genome</strong>, but contains 5% <strong>of</strong> Alus. On <strong>the</strong> o<strong>the</strong>r h<strong>and</strong>,chromosome Y shows <strong>the</strong> lowest density <strong>of</strong> Alus relative to its GCcontent, being higher than average for GC content less than 40%<strong>and</strong> lower than average for GC content over 40%. Even in AT-richDNA, Alus are under-represented on chromosome Y comparedwith o<strong>the</strong>r young interspersed repeats (see below). These phenomenamay be related to an unusually high gene density on chromosome19 <strong>and</strong> an unusually low density <strong>of</strong> somatically active genes onchromosome Y (both relative to GC content). This would beconsistent with <strong>the</strong> idea that Alu correlates not with GC contentbut with actively transcribed genes.Our results may support <strong>the</strong> controversial idea that SINEsactually earn <strong>the</strong>ir keep in <strong>the</strong> <strong>genome</strong>. Clearly, much additionalwork will be needed to prove or disprove <strong>the</strong> hypo<strong>the</strong>sis that SINEsare genomic symbionts.Biases in <strong>human</strong> mutation. Indirect studies have suggestedthat nucleotide substitution is not uniform across mammalianProportion comprised by Alu0.350.300.250.200.150.100.05052GC content bins (%)Chr1Chr2Chr3Chr4Chr5Chr6Chr7Chr8Chr9Chr10Chr11Chr12Chr13Chr14Chr15Chr16Chr17Chr18Chr19Chr20Chr21Chr22ChrXChrYFigure 26 Comparison <strong>of</strong> <strong>the</strong> Alu density <strong>of</strong> each chromosome as a function <strong>of</strong> local GCcontent. At higher GC levels, <strong>the</strong> Alu density varies widely between chromosomes, withchromosome 19 being a particular outlier. In contrast, <strong>the</strong> LINE1 density pattern is quiteuniform for most chromosomes, with <strong>the</strong> exception <strong>of</strong> a 1.5 to 2-fold over-representationin AT-rich regions <strong>of</strong> <strong>the</strong> X <strong>and</strong> Y chromosomes (not shown).NATURE | VOL 409 | 15 FEBRUARY 2001 | www.nature.com © 2001 Macmillan Magazines Ltd885
articles<strong>genome</strong>s 184±187 . By studying sets <strong>of</strong> repeat elements belonging to acommon cohort, one can directly measure nucleotide substitutionrates in different regions <strong>of</strong> <strong>the</strong> <strong>genome</strong>. We ®nd strong evidencethat <strong>the</strong> pattern <strong>of</strong> neutral substitution differs as a function <strong>of</strong> localGC content (Fig. 27). Because <strong>the</strong> results are observed in repetitiveelements throughout <strong>the</strong> <strong>genome</strong>, <strong>the</strong> variation in <strong>the</strong> pattern <strong>of</strong>nucleotide substitution seems likely to be due to differences in <strong>the</strong>underlying mutational process ra<strong>the</strong>r than to selection.The effect can be seen most clearly by focusing on <strong>the</strong> substitutionprocess g $ a, where g denotes GC or CG base pairs <strong>and</strong> a denotesATor TA base pairs. If K is <strong>the</strong> equilibrium constant in <strong>the</strong> direction<strong>of</strong> a base pairs (de®ned by <strong>the</strong> ratio <strong>of</strong> <strong>the</strong> forward <strong>and</strong> reverserates), <strong>the</strong>n <strong>the</strong> equilibrium GC content should be 1/(1 + K). Twoobservations emerge.First, <strong>the</strong>re is a regional bias in substitution patterns. Theequilibrium constant varies as a function <strong>of</strong> local GC content: gbase pairs are more likely to mutate towards a base pairs in AT-richregions than in GC-rich regions. For <strong>the</strong> <strong>analysis</strong> in Fig. 27, <strong>the</strong>equilibrium constant K is 2.5, 1.9 <strong>and</strong> 1.2 when <strong>the</strong> draft <strong>genome</strong>sequence is partitioned into three bins with average GC content <strong>of</strong>37, 43 <strong>and</strong> 50%, respectively. This bias could be due to a reportedtendency for GC-rich regions to replicate earlier in <strong>the</strong> cell cyclethan AT-rich regions <strong>and</strong> for guanine pools, which are limiting forSubstitution levelin 18% diverged sequence (%)20181614121086420GCATATGCG T A CC A T GType <strong>of</strong> substitutionAverage backgroundnucleotide composition37% GC43% GC50% GCFigure 27 Substitution patterns in interspersed repeats differ as a function <strong>of</strong> GC content.We collected all copies <strong>of</strong> ®ve DNA transposons (Tigger1, Tigger2, Charlie3, MER1 <strong>and</strong>HSMAR2), chosen for <strong>the</strong>ir high copy number <strong>and</strong> well de®ned consensus sequences.DNA transposons are optimal for <strong>the</strong> study <strong>of</strong> neutral substitutions: <strong>the</strong>y do not segregateinto subfamilies with diagnostic differences, presumably because <strong>the</strong>y are short-lived <strong>and</strong>new active families do not evolve in a <strong>genome</strong> (see text). Duplicates <strong>and</strong> close paraloguesresulting from duplication after transposition were eliminated. The copies were groupedon <strong>the</strong> basis <strong>of</strong> GC content <strong>of</strong> <strong>the</strong> ¯anking 1,000 bp on both sides <strong>and</strong> aligned to <strong>the</strong>consensus sequence (representing <strong>the</strong> state <strong>of</strong> <strong>the</strong> copy at integration). Recursive effortsusing parameters arising from this study did not change <strong>the</strong> alignments signi®cantly.Alignments were inspected by h<strong>and</strong>, <strong>and</strong> obvious misalignments caused by insertions <strong>and</strong>duplications were eliminated. Substitutions (n ˆ 80; 000) were counted for each positionin <strong>the</strong> consensus, excluding those in CpG dinucleotides, <strong>and</strong> a substitution frequencymatrix was de®ned. From <strong>the</strong> matrices for each repeat (which corresponded to differentages), a single rate matrix was calculated for <strong>the</strong>se bins <strong>of</strong> GC content (, 40% GC, 40±47% GC <strong>and</strong> . 47% GC). Data are shown for a repeat with an average divergence (innon-CpG sites) <strong>of</strong> 18% in 43% GC content (<strong>the</strong> repeat has slightly higher divergence inAT-rich DNA <strong>and</strong> lower in GC-rich DNA). From <strong>the</strong> rate matrix, we calculated log-likelihoodmatrices with different entropies (divergence levels), which are <strong>the</strong>oretically optimal foralignments <strong>of</strong> neutrally diverged copies to <strong>the</strong>ir common ancestral state (A. Kas <strong>and</strong>A. F. A. Smit, unpublished). These matrices are in use by <strong>the</strong> RepeatMasker program.ATTAGCCGDNA replication, to become depleted late in <strong>the</strong> cell cycle, <strong>the</strong>rebyresulting in a small but signi®cant shift in substitution towards abase pairs 186,188 . Ano<strong>the</strong>r <strong>the</strong>ory proposes that many substitutionsare due to differences in DNA repair mechanisms, possibly relatedto transcriptional activity <strong>and</strong> <strong>the</strong>reby to gene density <strong>and</strong> GCcontent 185,189,190 .There is also an absolute bias in substitution patterns resulting indirectional pressure towards lower GC content throughout <strong>the</strong><strong>human</strong> <strong>genome</strong>. The <strong>genome</strong> is not at equilibrium with respect to<strong>the</strong> pattern <strong>of</strong> nucleotide substitution: <strong>the</strong> expected equilibrium GCcontent corresponding to <strong>the</strong> values <strong>of</strong> K above is 29, 35 <strong>and</strong> 44% forregions with average GC contents <strong>of</strong> 37, 43 <strong>and</strong> 50%, respectively.Recent observations on SNPs 190 con®rm that <strong>the</strong> mutation patternin GC-rich DNA is biased towards a base pairs; it should be possibleto perform similar analyses throughout <strong>the</strong> <strong>genome</strong> with <strong>the</strong>availability <strong>of</strong> 1.4 million SNPs 97,191 . On <strong>the</strong> basis solely <strong>of</strong> nucleotidesubstitution patterns, <strong>the</strong> GC content would be expected to be about7% lower throughout <strong>the</strong> <strong>genome</strong>.What accounts for <strong>the</strong> higher GC content? One possible explanationis that in GC-rich regions, a considerable fraction <strong>of</strong> <strong>the</strong>nucleotides is likely to be under functional constraint owing to<strong>the</strong> high gene density. Selection on coding regions <strong>and</strong> regulatoryCpG isl<strong>and</strong>s may maintain <strong>the</strong> higher-than-predicted GC content.Ano<strong>the</strong>r is that throughout <strong>the</strong> rest <strong>of</strong> <strong>the</strong> <strong>genome</strong>, a constant in¯ux<strong>of</strong> transposable elements tends to increase GC content (Fig. 28).Young repeat elements clearly have a higher GC content than <strong>the</strong>irsurrounding regions, except in extremely GC-rich regions. Moreover,repeat elements clearly shift with age towards a lower GCcontent, closer to that <strong>of</strong> <strong>the</strong> neighbourhood in which <strong>the</strong>y reside.Much <strong>of</strong> <strong>the</strong> `non-repeat' DNA in AT-rich regions probably consists<strong>of</strong> ancient repeats that are not detectable by current methods <strong>and</strong>that have had more time to approach <strong>the</strong> local equilibrium value.The repeats can also be used to study how <strong>the</strong> mutation process isaffected by <strong>the</strong> immediately adjacent nucleotide. Such `contexteffects' will be discussed elsewhere (A. Kas <strong>and</strong> A. F. A. Smit,unpublished results).Fast living on chromosome Y. The pattern <strong>of</strong> interspersed repeatscan be used to shed light on <strong>the</strong> unusual evolutionary history <strong>of</strong>chromosome Y. Our <strong>analysis</strong> shows that <strong>the</strong> genetic material onGC content <strong>of</strong> feature (%)6560555045403530All DNAYoung interspersed repeats(
articleschromosome Y is unusually young, probably owing to a hightolerance for gain <strong>of</strong> new material by insertion <strong>and</strong> loss <strong>of</strong> oldmaterial by deletion. Several lines <strong>of</strong> evidence support this picture.For example, LINE elements on chromosome Yare on average muchyounger than those on autosomes (not shown). Similarly, MaLRfamilyretroposons on chromosome Y are younger than those onautosomes, with <strong>the</strong> representation <strong>of</strong> subfamilies showing a stronginverse correlation with <strong>the</strong> age <strong>of</strong> <strong>the</strong> subfamily. Moreover, chromosomeY has a relative over-representation <strong>of</strong> <strong>the</strong> younger retroviralclass II (ERVK) <strong>and</strong> a relative under-representation <strong>of</strong> <strong>the</strong>primarily older class III (ERVL) compared with o<strong>the</strong>r chromosomes.Overall, chromosome Y seems to maintain a youthfulappearance by rapid turnover.Interspersed repeats on chromosome Y can also be used toestimate <strong>the</strong> relative mutation rates, a m <strong>and</strong> a f , in <strong>the</strong> male <strong>and</strong>female germlines. Chromosome Y always resides in males, whereaschromosome X resides in females twice as <strong>of</strong>ten as in males. Thesubstitution rates, m Y <strong>and</strong> m X , on <strong>the</strong>se two chromosomes shouldthus be in <strong>the</strong> ratio m Y :m X =(a m ):(a m +2a f )/3, provided that oneconsiders equivalent neutral sequences. Several authors have estimated<strong>the</strong> mutation rate in <strong>the</strong> male germline to be ®vefold higherthan in <strong>the</strong> female germline, by comparing <strong>the</strong> rates <strong>of</strong> evolution <strong>of</strong>X- <strong>and</strong> Y-linked genes in <strong>human</strong>s <strong>and</strong> primates. However, Page <strong>and</strong>colleagues 192 have challenged <strong>the</strong>se estimates as too high. Theystudied a 39-kb region that is apparently devoid <strong>of</strong> genes <strong>and</strong> resideswithin a large segmental duplication from X to Y that occurred 3±4Myr ago in <strong>the</strong> <strong>human</strong> lineage. On <strong>the</strong> basis <strong>of</strong> phylogenetic <strong>analysis</strong><strong>of</strong> <strong>the</strong> sequence on <strong>human</strong> Y<strong>and</strong> <strong>human</strong>, chimp <strong>and</strong> gorilla X, <strong>the</strong>yobtained a much lower estimate <strong>of</strong> m Y :m X = 1.36, corresponding toa m :a f = 1.7. They suggested that <strong>the</strong> o<strong>the</strong>r estimates may have beenhigher because <strong>the</strong>y were based on much longer evolutionaryperiods or because <strong>the</strong> genes studied may have been under selection.Our database <strong>of</strong> <strong>human</strong> repeats provides a powerful resource foraddressing this question. We identi®ed <strong>the</strong> repeat elements fromrecent subfamilies (effectively, birth cohorts dating from <strong>the</strong> past50 Myr) <strong>and</strong> measured <strong>the</strong> substitution rates for subfamily memberson chromosomes X <strong>and</strong> Y (Fig. 29). There is a clear linear relationshipwith a slope <strong>of</strong> m Y :m X = 1.57 corresponding to a m :a f = 2.1. Theestimate is in reasonable agreement with that <strong>of</strong> Page et al., althoughit is based on much more total sequence (360 kb on Y, 1.6 Mb on X)<strong>and</strong> a much longer time period. In particular, <strong>the</strong> discrepancy wi<strong>the</strong>arlier reports is not explained by recent changes in <strong>the</strong> <strong>human</strong>lineage. Various <strong>the</strong>ories have been proposed for <strong>the</strong> higher mutationrate in <strong>the</strong> male germline, including <strong>the</strong> greater number <strong>of</strong> celldivisions in <strong>the</strong> formation <strong>of</strong> sperm than eggs <strong>and</strong> different repairmechanisms in sperm <strong>and</strong> eggs.Median substitution level <strong>of</strong>repeat subfamily on Y (%)10500 5 10Median substitution level <strong>of</strong>repeat subfamily on X (%)Figure 29 Higher substitution rate on chromosome Y than on chromosome X. Wecalculated <strong>the</strong> median substitution level (excluding CpG sites) for copies <strong>of</strong> <strong>the</strong> most recentL1 subfamilies (L1Hs±L1PA8) on <strong>the</strong> X <strong>and</strong> Y chromosomes. Only <strong>the</strong> 39 UTR <strong>of</strong> <strong>the</strong> L1element was considered because its consensus sequence is best established.Active transposons. We were interested in identifying <strong>the</strong> youngestretrotransposons in <strong>the</strong> draft <strong>genome</strong> sequence. This set shouldcontain <strong>the</strong> currently active retrotransposons, as well as <strong>the</strong> insertionsites that are still polymorphic in <strong>the</strong> <strong>human</strong> population.The youngest branch in <strong>the</strong> phylogenetic tree <strong>of</strong> <strong>human</strong> LINE1elements is called L1Hs (ref. 158); it differs in its 39 untranslatedregion (UTR) by 12 diagnostic substitutions from <strong>the</strong> next oldestsubfamily (L1PA2). Within <strong>the</strong> L1Hs family, <strong>the</strong>re are twosubsets referred to as Ta <strong>and</strong> pre-Ta, de®ned by a diagnostictrinucleotide 193,194 . All active L1 elements are thought to belong to<strong>the</strong>se two subsets, because <strong>the</strong>y account for all 14 known cases <strong>of</strong><strong>human</strong> disease arising from new L1 transposition (with 13 belongingto <strong>the</strong> Ta subset <strong>and</strong> one to <strong>the</strong> pre-Ta subset) 195,196 . Thesesubsets are also <strong>of</strong> great interest for population genetics because atleast 50% are still segregating as polymorphisms in <strong>the</strong> <strong>human</strong>population 194,197 ; <strong>the</strong>y provide powerful markers for tracingpopulation history because <strong>the</strong>y represent unique (non-recurrent<strong>and</strong> non-revertible) genetic events that can be used (along withsimilarly polymorphic Alus) for reconstructing <strong>human</strong> migrations.LINE1 elements that are retrotransposition-competent shouldconsist <strong>of</strong> a full-length sequence <strong>and</strong> should have both ORFs intact.Eleven such elements from <strong>the</strong> Ta subset have been identi®ed,including <strong>the</strong> likely progenitors <strong>of</strong> mutagenic insertions into <strong>the</strong>factor VIII <strong>and</strong> dystrophin genes 198±202 . A cultured cell retrotranspositionassay has revealed that eight <strong>of</strong> <strong>the</strong>se elements remainretrotransposition-competent 200,202,203 .We searched <strong>the</strong> draft <strong>genome</strong> sequence <strong>and</strong> identi®ed 535 LINEsbelonging to <strong>the</strong> Ta subset <strong>and</strong> 415 belonging to <strong>the</strong> pre-Ta subset.These elements provide a large collection <strong>of</strong> tools for probing<strong>human</strong> population history. We also identi®ed those consisting <strong>of</strong>full-length elements with intact ORFs, which are c<strong>and</strong>idate activeLINEs. We found 39 such elements belonging to <strong>the</strong> Ta subset <strong>and</strong>22 belonging to <strong>the</strong> pre-Ta subset; this substantially increases <strong>the</strong>number in <strong>the</strong> ®rst category <strong>and</strong> provides <strong>the</strong> ®rst known examplesin <strong>the</strong> second category. These elements can now be tested forretrotransposition competence in <strong>the</strong> cell culture assay. Preliminary<strong>analysis</strong> resulted in <strong>the</strong> identi®cation <strong>of</strong> two <strong>of</strong> <strong>the</strong>se elements as <strong>the</strong>likely progenitors <strong>of</strong> mutagenic insertions into <strong>the</strong> b-globin <strong>and</strong>RP2 genes (R. Badge <strong>and</strong> J. V. Moran, unpublished data). Similaranalyses should allow <strong>the</strong> identi®cation <strong>of</strong> <strong>the</strong> progenitors <strong>of</strong> most,if not all, o<strong>the</strong>r known mutagenic L1 insertions.L1 elements can carry extra DNA if transcription extends through<strong>the</strong> native transcriptional termination site into ¯anking genomicDNA. This process, termed L1-mediated transduction, provides ameans for <strong>the</strong> mobilization <strong>of</strong> DNA sequences around <strong>the</strong> <strong>genome</strong><strong>and</strong> may be a mechanism for `exon shuf¯ing' 204 . Twenty-one percent <strong>of</strong> <strong>the</strong> 71 full-length L1s analysed contained non-L1-derivedsequences before <strong>the</strong> 39 target-site duplication site, in cases in which<strong>the</strong> site was unambiguously recognizable. The length <strong>of</strong> <strong>the</strong> transducedsequence was 30±970 bp, supporting <strong>the</strong> suggestion that 0.5±1.0% <strong>of</strong> <strong>the</strong> <strong>human</strong> <strong>genome</strong> may have arisen by LINE-basedtransduction <strong>of</strong> 39 ¯anking sequences 205,206 .Our <strong>analysis</strong> also turned up two instances <strong>of</strong> 59 transduction(145 bp <strong>and</strong> 215 bp). Although this possibility had been suggestedon <strong>the</strong> basis <strong>of</strong> cell culture models 195,203 , <strong>the</strong>se are <strong>the</strong> ®rst documentedexamples. Such events may arise from transcription initiatingin a cellular promoter upstream <strong>of</strong> <strong>the</strong> L1 elements. L1transcription is generally con®ned to <strong>the</strong> germline 207,208 , buttranscription from o<strong>the</strong>r promoters could explain a somatic L1retrotransposition event that resulted in colon cancer 206 .Transposons as a creative force. The primary force for <strong>the</strong> origin<strong>and</strong> expansion <strong>of</strong> most transposons has been selection for <strong>the</strong>irability to create progeny, <strong>and</strong> not a selective advantage for <strong>the</strong> host.However, <strong>the</strong>se sel®sh pieces <strong>of</strong> DNA have been responsible forimportant innovations in many <strong>genome</strong>s, for example by contributingregulatory elements <strong>and</strong> even new genes.Twenty <strong>human</strong> genes have been recognized as probably derivedNATURE | VOL 409 | 15 FEBRUARY 2001 | www.nature.com © 2001 Macmillan Magazines Ltd887
like termini show <strong>the</strong> typical divergence level <strong>of</strong> such elements) <strong>and</strong>is actively transcribed provides strong evidence that it has beenadopted by <strong>the</strong> <strong>human</strong> <strong>genome</strong> as a gene. Its function is unknown.LINE1 activity clearly has also had fringe bene®ts. We mentionedabove <strong>the</strong> possibility <strong>of</strong> exon reshuf¯ing by cotranscription <strong>of</strong>neighbouring DNA. The LINE1 machinery can also cause reversetranscription <strong>of</strong> genic mRNAs, which typically results in nonfunctionalprocessed pseudogenes but can, occasionally, give rise t<strong>of</strong>unctional processed genes. There are at least eight <strong>human</strong> <strong>and</strong>eight mouse genes for which evidence strongly supports such anorigin 211 (see http://www-i®.uni-muenster.de/exapted-retrogenes/tables.html). Many o<strong>the</strong>r intronless genes may have been createdin <strong>the</strong> same way.Transposons have made o<strong>the</strong>r creative contributions to <strong>the</strong><strong>genome</strong>. A few hundred genes, for example, use transcriptionalterminators donated by LTR retroposons (data not shown). O<strong>the</strong>rgenes employ regulatory elements derived from repeat elements 211 .Simple sequence repeatsSimple sequence repeats (SSRs) are a ra<strong>the</strong>r different type <strong>of</strong>repetitive structure that is common in <strong>the</strong> <strong>human</strong> <strong>genome</strong>Ðperfector slightly imperfect t<strong>and</strong>em repeats <strong>of</strong> a particular k-mer. SSRs witha short repeat unit (n = 1±13 bases) are <strong>of</strong>ten termed microsaarticlesfrom transposons 142,209 . These include <strong>the</strong> RAG1 <strong>and</strong> RAG2 recombinases<strong>and</strong> <strong>the</strong> major centromere-binding protein CENPB. Wescanned <strong>the</strong> draft <strong>genome</strong> sequence <strong>and</strong> identi®ed ano<strong>the</strong>r 27 cases,bringing <strong>the</strong> total to 47 (Table 13; refs 142, 209). All but four arederived from DNA transposons, which give rise to only a smallproportion <strong>of</strong> <strong>the</strong> interspersed repeats in <strong>the</strong> <strong>genome</strong>. Why <strong>the</strong>re areso many DNA transposase-like genes, many <strong>of</strong> which still contain<strong>the</strong> critical residues for transposase activity, is a mystery.To illustrate this concept, we describe <strong>the</strong> discovery <strong>of</strong> one <strong>of</strong> <strong>the</strong>new examples. We searched <strong>the</strong> draft <strong>genome</strong> sequence to identify<strong>the</strong> autonomous DNA transposon responsible for <strong>the</strong> distribution<strong>of</strong> <strong>the</strong> non-autonomous MER85 element, one <strong>of</strong> <strong>the</strong> most recently(40±50 Myr ago) active DNA transposons. Most non-autonomouselements are internal deletion products <strong>of</strong> a DNA transposon. Weidenti®ed one instance <strong>of</strong> a large (1,782 bp) ORF ¯anked by <strong>the</strong> 59<strong>and</strong> 39 halves <strong>of</strong> a MER85 element. The ORF encodes a novel protein(partially published as pID 6453533) whose closest homologue is<strong>the</strong> transposase <strong>of</strong> <strong>the</strong> piggyBac DNA transposon, which is found ininsects <strong>and</strong> has <strong>the</strong> same characteristic TTAA target-siteduplications 210 as MER85. The ORF is actively transcribed in fetalbrain <strong>and</strong> in cancer cells. That it has not been lost to mutation in40±50 Myr <strong>of</strong> evolution (whereas <strong>the</strong> ¯anking, noncoding, MER85-Table 13 Human genes derived from transposable elementsGenBank ID* Gene name Related transposon family² Possible fusion gene§ Newly recognized derivationknID 3150436 BC200 FLAM Alu³pID 2330017 Telomerase non-LTR retrotransposonpID 1196425 HERV-3 env Retroviridae/HERV-R³pID 4773880 Syncytin Retroviridae/HERV-W³pID 131827 RAG1 <strong>and</strong> 2 Tc1-likepID 29863 CENP-B Tc1/PogoEST 2529718 Tc1/Pogo +PID 10047247 Tc1/Pogo/Pogo +EST 4524463 Tc1/Pogo/Pogo +pID 4504807 Jerky Tc1/Pogo/TiggerpID 7513096 JRKL Tc1/Pogo/TiggerEST 5112721 Tc1/Pogo/Tigger +EST 11097233 Tc1/Pogo/Tigger +EST 6986275 Sancho Tc1/Pogo/TiggerEST 8616450 Tc1/Pogo/Tigger +EST 8750408 Tc1/Pogo/Tigger +EST 5177004 Tc1/Pogo/Tigger +PID 3413884 KIAA0461 Tc1/Pogo/Tc2 +PID 7959287 KIAA1513 Tc1/Pogo/Tc2 +PID 2231380 Tc1/Mariner/Hsmar1³ +EST 10219887 hAT/Hobo + +PID 6581095 Buster1 hAT/Charlie +PID 7243087 Buster2 hAT/Charlie +PID 6581097 Buster3 hAT/CharliePID 7662294 KIAA0766 hAT/Charlie +PID 10439678 hAT/Charlie +PID 7243087 KIAA1353 hAT/Charlie +PID 7021900 hAT/Charlie/Charlie3³ +PID 4263748 hAT/Charlie/Charlie8³ +EST 8161741 hAT/Charlie/Charlie9³ +pID 4758872 DAP4,pP52 rIPK hAT/Tip100/ZaphodEST 10990063 hAT/Tip100/Zaphod +EST 10101591 hAT/Tip100/Zaphod +pID 7513011 KIAA0543 hAT/Tip100/Tip100 +pID 10439744 hAT/Tip100/Tip100 +pID 10047247 KIAA1586 hAT/Tip100/Tip100 +pID 10439762 hAT/Tip100 + +EST 10459804 hAT/Tip100 +pID 4160548 Tramp hAT/Tam3 +BAC 3522927 hAT/Tam3 +pID 3327088 KIAA0637 hAT/Tam3 +EST 1928552 hAT/Tam3 +pID 6453533 piggyBac/MER85³ +EST 3594004 piggyBac/MER85³ +BAC 4309921 piggyBac/MER85³ +EST 4073914 piggyBac/MER75³ +EST 1963278 piggyBac +...................................................................................................................................................................................................................................................................................................................................................................The Table lists 47 <strong>human</strong> genes, with a likely origin in up to 38 different transposon copies.* Where available, <strong>the</strong> GenBank ID numbers are given for proteins, o<strong>the</strong>rwise a representative EST or a clone name is shown. Six groups (two or three genes each) have similarity at <strong>the</strong> DNA level well beyondthat observed between different DNA transposon families in <strong>the</strong> <strong>genome</strong>; <strong>the</strong>y are indicated in italics, with all but <strong>the</strong> initial member <strong>of</strong> each group indented. This could be explained if <strong>the</strong> genes wereparalogous (derived from a single inserted transposon <strong>and</strong> subsequently duplicated).² Classi®cation <strong>of</strong> <strong>the</strong> transposon.³ Indicates that <strong>the</strong> transposon from which <strong>the</strong> gene is derived is precisely known.§ Proteins probably formed by fusion <strong>of</strong> a cellular <strong>and</strong> transposon gene; many have acquired zinc-®nger domains.k Not previously reported as being derived from transposable element genes. The remaining genes can be found in refs 142, 209.888 © 2001 Macmillan Magazines Ltd NATURE | VOL 409 | 15 FEBRUARY 2001 | www.nature.com
articlesTable 14 SSR content <strong>of</strong> <strong>the</strong> <strong>human</strong> <strong>genome</strong>Length <strong>of</strong> repeat unit Average bases per Mb Average number <strong>of</strong> SSRelements per Mb1 1,660 36.72 5,046 43.13 1,013 11.84 3,383 32.55 2,686 17.66 1,376 15.27 906 8.48 1,139 11.19 900 8.610 1,576 8.611 770 8.7.............................................................................................................................................................................SSRs were identi®ed by using <strong>the</strong> computer program T<strong>and</strong>em Repeat Finder with <strong>the</strong> followingparameters: match score 2, mismatch score 3, indel 5, minimum alignment 50, maximum repeatlength 500, minimum repeat length 1.tellites, whereas those with longer repeat units (n = 14±500 bases)are <strong>of</strong>ten termed minisatellites. With <strong>the</strong> exception <strong>of</strong> poly(A) tailsfrom reverse transcribed messages, SSRs are thought to arise byslippage during DNA replication 212,213 .We compiled a catalogue <strong>of</strong> all SSRs over a given length in <strong>the</strong><strong>human</strong> draft <strong>genome</strong> sequence, <strong>and</strong> studied <strong>the</strong>ir properties(Table 14). SSRs comprise about 3% <strong>of</strong> <strong>the</strong> <strong>human</strong> <strong>genome</strong>, with<strong>the</strong> greatest single contribution coming from dinucleotide repeats(0.5%). (The precise criteria for <strong>the</strong> number <strong>of</strong> repeat units <strong>and</strong> <strong>the</strong>extent <strong>of</strong> divergence allowed in an SSR affect <strong>the</strong> exact census, butnot <strong>the</strong> qualitative conclusions.)There is approximately one SSR per 2 kb (<strong>the</strong> number <strong>of</strong> nonoverlappingt<strong>and</strong>em repeats is 437 per Mb). The catalogue con®rmsvarious properties <strong>of</strong> SSRs that have been inferred from samplingapproaches (Table 15). The most frequent dinucleotide repeats areAC <strong>and</strong> AT (50 <strong>and</strong> 35% <strong>of</strong> dinucleotide repeats, respectively),whereas AG repeats (15%) are less frequent <strong>and</strong> GC repeats (0.1%)are greatly under-represented. The most frequent trinucleotides areAAT <strong>and</strong> AAC (33% <strong>and</strong> 21%, respectively), whereas ACC (4.0%),AGC (2.2%), ACT (1.4%) <strong>and</strong> ACG (0.1%) are relatively rare.Overall, trinucleotide SSRs are much less frequent than dinucleotideSSRs 214 .SSRs have been extremely important in <strong>human</strong> genetic studies,because <strong>the</strong>y show a high degree <strong>of</strong> length polymorphism in <strong>the</strong><strong>human</strong> population owing to frequent slippage by DNA polymeraseduring replication. Genetic markers based on SSRsÐparticularly(CA) n repeatsÐhave been <strong>the</strong> workhorse <strong>of</strong> most <strong>human</strong> diseasemappingstudies 101,102 . The availability <strong>of</strong> a comprehensive catalogue<strong>of</strong> SSRs is thus a boon for <strong>human</strong> genetic studies.The SSR catalogue also allowed us to resolve a mystery regardingmammalian genetic maps. Such genetic maps in rat, mouse <strong>and</strong><strong>human</strong> have a de®cit <strong>of</strong> polymorphic (CA) n repeats on chromosomeX 30,101 . There are two possible explanations for this de®cit. Theremay simply be fewer (CA) n repeats on chromosome X; or (CA) nrepeats may be as dense on chromosome X but less polymorphic in<strong>the</strong> population. In fact, <strong>analysis</strong> <strong>of</strong> <strong>the</strong> draft <strong>genome</strong> sequence showsthat chromosome X has <strong>the</strong> same density <strong>of</strong> (CA) n repeats per Mb as<strong>the</strong> autosomes (data not shown). Thus, <strong>the</strong> de®cit <strong>of</strong> polymorphicmarkers relative to autosomes results from population geneticforces. Possible explanations include that chromosome X has asmaller effective population size, experiences more frequent selectivesweeps reducing diversity (owing to its hemizygosity in males),or has a lower mutation rate (owing to its more frequent passagethrough <strong>the</strong> less mutagenic female germline). The availability <strong>of</strong> <strong>the</strong>draft <strong>genome</strong> sequence should provide ways to test <strong>the</strong>se alternativeexplanations.Segmental duplicationsA remarkable feature <strong>of</strong> <strong>the</strong> <strong>human</strong> <strong>genome</strong> is <strong>the</strong> segmentalduplication <strong>of</strong> portions <strong>of</strong> genomic sequence 215±217 . Such duplicationsinvolve <strong>the</strong> transfer <strong>of</strong> 1±200-kb blocks <strong>of</strong> genomic sequenceto one or more locations in <strong>the</strong> <strong>genome</strong>. The locations <strong>of</strong> bothdonor <strong>and</strong> recipient regions <strong>of</strong> <strong>the</strong> <strong>genome</strong> are <strong>of</strong>ten not t<strong>and</strong>emlyarranged, suggesting mechanisms o<strong>the</strong>r than unequal crossing-overfor <strong>the</strong>ir origin. They are relatively recent, inasmuch as strongsequence identity is seen in both exons <strong>and</strong> introns (in contrast toregions that are considered to show evidence <strong>of</strong> ancient duplications,characterized by similarities only in coding regions). Indeed,many such duplications appear to have arisen in very recentevolutionary time, as judged by high sequence identity <strong>and</strong> by<strong>the</strong>ir absence in closely related species.Segmental duplications can be divided into two categories. First,interchromosomal duplications are de®ned as segments that areduplicated among nonhomologous chromosomes. For example, a9.5-kb genomic segment <strong>of</strong> <strong>the</strong> adrenoleukodystrophy locus fromXq28 has been duplicated to regions near <strong>the</strong> centromeres <strong>of</strong>chromosomes 2, 10, 16 <strong>and</strong> 22 (refs 218, 219). Anecdotal observationssuggest that many interchromosomal duplications map near <strong>the</strong>centromeric <strong>and</strong> telomeric regions <strong>of</strong> <strong>human</strong> chromosomes 218±233 .The second category is intrachromosomal duplications, whichoccur within a particular chromosome or chromosomal arm. Thiscategory includes several duplicated segments, also known as lowcopy repeat sequences, that mediate recurrent chromosomal structuralrearrangements associated with genetic disease 215,217 . Exampleson chromosome 17 include three copies <strong>of</strong> a roughly 200-kb repeatseparated by around 5 Mb <strong>and</strong> two copies <strong>of</strong> a roughly 24-kb repeatseparated by 1.5 Mb. The copies are so similar (99% identity) thatparalogous recombination events can occur, giving rise to contiguousgene syndromes: Smith±Magenis syndrome <strong>and</strong> Charcot±Marie±Tooth syndrome 1A, respectively 34,234 . Several o<strong>the</strong>r examplesare known <strong>and</strong> are also suspected to be responsible for recurrentmicrodeletion syndromes (for example, Prader±Willi/Angelman,Table 15 SSRs by repeat unitRepeat unitNumber <strong>of</strong> SSRs per MbAC 27.7AT 19.4AG 8.2GC 0.1AAT 4.1AAC 2.6AGG 1.5AAG 1.4ATG 0.7CGG 0.6ACC 0.4AGC 0.3ACT 0.2ACG 0.0.............................................................................................................................................................................SSRs were identi®ed as in Table 14.Figure 30 Duplication l<strong>and</strong>scape <strong>of</strong> chromosome 22. The size <strong>and</strong> location <strong>of</strong>intrachromosomal (blue) <strong>and</strong> interchromosomal (red) duplications are depicted forchromosome 22q, using <strong>the</strong> PARASIGHT computer program (Bailey <strong>and</strong> Eichler,unpublished). Each horizontal line represents 1 Mb (ticks, 100-kb intervals). Thechromosome sequence is oriented from centromere (top left) to telomere (bottom right).Pairwise alignments with . 90% nucleotide identity <strong>and</strong> . 1 kb long are shown. Gapswithin <strong>the</strong> chromosomal sequence are <strong>of</strong> known size <strong>and</strong> shown as empty space.NATURE | VOL 409 | 15 FEBRUARY 2001 | www.nature.com © 2001 Macmillan Magazines Ltd889
articlesvelocardi<strong>of</strong>acial/DiGeorge <strong>and</strong> Williams' syndromes 215,235±240 ).Until now, <strong>the</strong> identi®cation <strong>and</strong> characterization <strong>of</strong> segmentalduplications have been based on anecdotal reportsÐfor example,®nding that certain probes hybridize to multiple chromosomal sitesor noticing duplicated sequence at certain recurrent chromosomalbreakpoints. The availability <strong>of</strong> <strong>the</strong> entire genomic sequence willmake it possible to explore <strong>the</strong> nature <strong>of</strong> segmental duplicationsmore systematically. This <strong>analysis</strong> can begin with <strong>the</strong> current state <strong>of</strong><strong>the</strong> draft <strong>genome</strong> sequence, although caution is required becausesome apparent duplications may arise from a failure to mergesequence contigs from overlapping clones. Alternatively, erroneousFigure 31 Duplication l<strong>and</strong>scape <strong>of</strong> chromosome 21. The size <strong>and</strong> location <strong>of</strong>intrachromosomal (blue) <strong>and</strong> interchromosomal (red) duplications are depicted along <strong>the</strong>sequence <strong>of</strong> <strong>the</strong> long arm <strong>of</strong> chromosome 21. Gaps between ®nished sequence aredenoted by empty space but do not represent actual gap size.assembly <strong>of</strong> closely related sequences from nonoverlapping clonesmay underestimate <strong>the</strong> true frequency <strong>of</strong> such features, particularlyamong those segments with <strong>the</strong> highest sequence similarity. Accordingly,we adopted a conservative approach for estimating suchduplication from <strong>the</strong> available draft <strong>genome</strong> sequence.Pericentromeres <strong>and</strong> subtelomeres. We began by re-evaluating <strong>the</strong>®nished sequences <strong>of</strong> chromosomes 21 <strong>and</strong> 22. The initial papers on<strong>the</strong>se chromosomes 93,94 noted some instances <strong>of</strong> interchromosomalduplication near each centromere. With <strong>the</strong> ability now to compare<strong>the</strong>se chromosomes to <strong>the</strong> vast majority <strong>of</strong> <strong>the</strong> <strong>genome</strong>, it isapparent that <strong>the</strong> regions near <strong>the</strong> centromeres consist almostentirely <strong>of</strong> interchromosomal duplicated segments, with littleor no unique sequence. Smaller regions <strong>of</strong> interchromosomalduplication are also observed near <strong>the</strong> telomeres.Chromosome 22 contains a region <strong>of</strong> 1.5 Mb adjacent to <strong>the</strong>centromere in which 90% <strong>of</strong> sequence can now be recognized toconsist <strong>of</strong> interchromosomal duplication (Fig. 30). Conversely, 52%<strong>of</strong> <strong>the</strong> interchromosomal duplications on chromosome 22 werelocated in this region, which comprises only 5% <strong>of</strong> <strong>the</strong> chromosome.Also, <strong>the</strong> subtelomeric end consists <strong>of</strong> a 50-kb region consistingalmost entirely <strong>of</strong> interchromosomal duplications.Chromosome 21 presents a similar l<strong>and</strong>scape (Fig. 31). The ®rst1 Mb after <strong>the</strong> centromere is composed <strong>of</strong> interchromosomalrepeats, as well as <strong>the</strong> largest (. 200 kb) block <strong>of</strong> intrachromosomallyduplicated material. Again, most interchromosomal duplicationson <strong>the</strong> chromosome map to this region <strong>and</strong> <strong>the</strong> mostsubtelomeric region (30 kb) shows extensive duplication amongnonhomologous chromosomes.aSequence identity (%)10099989796959493929190100 200 300 400 500cSequence identity (%)10099989796959493929190100 200 300 400 500Sequence identity (%)10099989796959493929190600 700 800 900 1,000Sequence identity (%)10099989796959493929190600 700 800 900 1,000Sequence identity (%)100999897969594939291901,100 1,200 1,300 1,400 1,500Sequence identity (%)100999897969594939291901,100 1,200 1,300 1,400 1,500bSequence identity10099989796959493929190CTR CMD ALD320 340 360 380 420400 440dSequence identity (%)Sequence identity (%)1009998979695949392919010099989796959493929190100 200 300 400 500600Figure 32 Mosaic patterns <strong>of</strong> duplications. Panels depict various patterns <strong>of</strong> duplicationwithin <strong>the</strong> <strong>human</strong> <strong>genome</strong> (PARASIGHT). For each region, a segment <strong>of</strong> draft <strong>genome</strong>sequence (100±500 kb) is shown with both interchromosomal (red) <strong>and</strong> intrachromosomal(blue) duplications displayed along <strong>the</strong> horizontal line. Below <strong>the</strong> line, each separatesequence duplication is indicated (with a distinct colour) relative to per cent nucleotideidentity for <strong>the</strong> duplicated segment (y axis). Black bars show <strong>the</strong> relative locations <strong>of</strong> largeblocks <strong>of</strong> heterochromatic sequences (alpha, gamma <strong>and</strong> HSAT sequence). a, An activepericentromeric region on chromosome 21. b, An ancestral region from Xq28 that hascontributed various `genic' segments to pericentromeric regions. c, A pericentromeric890 © 2001 Macmillan Magazines Ltd NATURE | VOL 409 | 15 FEBRUARY 2001 | www.nature.com
articlesThe pericentromeric regions are structurally very complex, asillustrated for chromosome 21 in Fig. 32a. The pericentromericregions appear to have been bombarded by successive insertions <strong>of</strong>duplications; <strong>the</strong> insertion events must be fairly recent because <strong>the</strong>degree <strong>of</strong> sequence conservation with <strong>the</strong> genomic source loci isfairly high (90±100%, with an apparent peak around 96%). Distinctinsertions are typically separated by AT-rich or GC-rich minisatellite-likerepeats that have been hypo<strong>the</strong>sized to have a functionalrole in targeting duplications to <strong>the</strong>se regions 233,241 .A single genomic source locus <strong>of</strong>ten gives rise to pericentromericcopies on multiple chromosomes, with each having essentially <strong>the</strong>same breakpoints <strong>and</strong> <strong>the</strong> same degree <strong>of</strong> divergence. An example <strong>of</strong>such a source locus on Xq28 is shown in Fig. 32b. Phylogenetic<strong>analysis</strong> has suggested a two-step mechanism for <strong>the</strong> origin <strong>and</strong>dispersal <strong>of</strong> <strong>the</strong>se segments, whereby an initial segmental duplicationin <strong>the</strong> pericentromeric region <strong>of</strong> one chromosome occurs <strong>and</strong> is<strong>the</strong>n redistributed as part <strong>of</strong> a larger cassette to o<strong>the</strong>r such regions 242 .A comprehensive <strong>analysis</strong> for all chromosomes will have to awaitcomplete <strong>sequencing</strong> <strong>of</strong> <strong>the</strong> <strong>genome</strong>, but <strong>the</strong> evidence from <strong>the</strong> draft<strong>genome</strong> sequence indicates that <strong>the</strong> same picture is likely to be seenthroughout <strong>the</strong> <strong>genome</strong>. Several papers have analysed ®nishedsegments within pericentromeric regions <strong>of</strong> chromosomes 2(160 kb), 10 (400 kb) <strong>and</strong> 16 (300 kb), all <strong>of</strong> which show extensiveinterchromosomal segmental duplication 215,219,232,233 . An examplefrom ano<strong>the</strong>r pericentromeric region on chromosome 11 isshown in Fig. 32c. Interchromosomal duplications in subtelomericregions also appear to be a fairly general phenomenon, as illustratedby a large tract (,500 kb) <strong>of</strong> complex duplication on chromosome 7(Fig. 32d).The explanation for <strong>the</strong> clustering <strong>of</strong> segmental duplications maybe that <strong>the</strong> <strong>genome</strong> has a damage-control mechanism wherebychromosomal breakage products are preferentially inserted intopericentromeric <strong>and</strong>, to a lesser extent, subtelomeric regions. Thepossibility <strong>of</strong> a speci®c mechanism for <strong>the</strong> insertion <strong>of</strong> <strong>the</strong>sesequences has been suggested on <strong>the</strong> basis <strong>of</strong> <strong>the</strong> unusual sequencesfound ¯anking <strong>the</strong> insertions. Although it is also possible that <strong>the</strong>seregions simply have greater tolerance for large insertions, manylarge gene-poor `deserts' have been identi®ed 93 <strong>and</strong> <strong>the</strong>re is noaccumulation <strong>of</strong> duplicated segments within <strong>the</strong>se regions. Alongwith <strong>the</strong> fact that transitions between duplicons (from differentregions <strong>of</strong> <strong>the</strong> <strong>genome</strong>) occur at speci®c sequences, this suggests thatactive recruitment <strong>of</strong> duplications to such regions may occur. In anycase, <strong>the</strong> duplicated regions are in general young (with manyduplications showing ,6% nucleotide divergence from <strong>the</strong>irsource loci) <strong>and</strong> in constant ¯ux, both through additional duplications<strong>and</strong> by large-scale exchange among similar chromosomalenvironments. There is evidence <strong>of</strong> structural polymorphism in<strong>the</strong> <strong>human</strong> population, such as <strong>the</strong> presence or absence <strong>of</strong> olfactoryreceptor segments located within <strong>the</strong> telomeric regions <strong>of</strong> several<strong>human</strong> chromosomes 226,227 .Genome-wide <strong>analysis</strong> <strong>of</strong> segmental duplications. We also performeda global <strong>genome</strong>-wide <strong>analysis</strong> to characterize <strong>the</strong> amount<strong>of</strong> segmental duplication in <strong>the</strong> <strong>genome</strong>. We `repeat-masked' <strong>the</strong>known interspersed repeats in <strong>the</strong> draft <strong>genome</strong> sequence <strong>and</strong>compared <strong>the</strong> remaining draft genomic sequence with itself in amassive all-by-all BLASTN similarity search. We excluded matchesin which <strong>the</strong> sequence identity was so high that it might re¯ectartefactual duplications resulting from a failure to overlap sequencecontigs correctly in assembling <strong>the</strong> draft <strong>genome</strong> sequence. Speci-®cally, we considered only matches with less than 99.5% identity for®nished sequence <strong>and</strong> less than 98% identity for un®nishedsequence.We took several approaches to avoid counting artefactual duplicationsin <strong>the</strong> sequence. In <strong>the</strong> ®rst approach, we studied only®nished sequence. We compared <strong>the</strong> ®nished sequence with itself,to identify segments <strong>of</strong> at least 1 kb <strong>and</strong> 90±99.5% sequenceidentity. This <strong>analysis</strong> will underestimate <strong>the</strong> extent <strong>of</strong> segmentalduplication, because it requires that at least two copies <strong>of</strong> <strong>the</strong>segment are present in <strong>the</strong> ®nished sequence <strong>and</strong> because sometrue duplications have over 99.5% identity.The ®nished sequence consists <strong>of</strong> at least 3.3% segmental duplication(Table 16). Interchromosomal duplication accounts forabout 1.5% <strong>and</strong> intrachromosomal duplication for about 2%,with some overlap (0.2%) between <strong>the</strong>se categories. We analysed<strong>the</strong> lengths <strong>and</strong> divergence <strong>of</strong> <strong>the</strong> segmental duplications (Fig. 33).The duplications tend to be large (10±50 kb) <strong>and</strong> highly homologous,especially for <strong>the</strong> interchromosomal segments. Thesequence divergence for <strong>the</strong> interchromosomal duplicationsappears to peak between 96.5% <strong>and</strong> 97.5%. This may indicatethat interchromosomal duplications occurred in a punctuatedmanner. It will be intriguing to investigate whe<strong>the</strong>r such genomicupheaval has a role in speciation events.In a second approach, we compared <strong>the</strong> entire <strong>human</strong> draft<strong>genome</strong> sequence (®nished <strong>and</strong> un®nished) with itself to identifyduplications with 90±98% sequence identity (Table 17). The draft<strong>genome</strong> sequence contains at least 3.6% segmental duplication. Theactual proportion will be signi®cantly higher, because we excludedmany true matches with more than 98% sequence identity (at least1.1% <strong>of</strong> <strong>the</strong> ®nished sequence). Although exact measurement mustawait a ®nished sequence, <strong>the</strong> <strong>human</strong> <strong>genome</strong> seems likely tocontain about 5% segmental duplication, with most <strong>of</strong> thissequence in large blocks (. 10 kb). Such a high proportion <strong>of</strong>large duplications clearly distinguishes <strong>the</strong> <strong>human</strong> <strong>genome</strong> fromo<strong>the</strong>r sequenced <strong>genome</strong>s, such as <strong>the</strong> ¯y <strong>and</strong> worm (Table 18).The structure <strong>of</strong> large highly paralogous regions presents one <strong>of</strong><strong>the</strong> `serious <strong>and</strong> unanticipated challenges' to producing a ®nishedsequence <strong>of</strong> <strong>the</strong> <strong>genome</strong> 46 . The absence <strong>of</strong> unique STS or ®ngerprintsignatures over large genomic distances (,1 Mb) <strong>and</strong> <strong>the</strong> highdegree <strong>of</strong> sequence similarity makes <strong>the</strong> distinction between paralogoussequence variation <strong>and</strong> allelic polymorphism problematic.Fur<strong>the</strong>rmore, <strong>the</strong> fact that such regions frequently harbour intron±exon structures <strong>of</strong> genuine unique sequence will complicate effortsto generate a <strong>genome</strong>-wide SNP map. The data indicate that amodest portion <strong>of</strong> <strong>the</strong> <strong>human</strong> <strong>genome</strong> may be relatively recalcitrantto genomic-based methods for SNP detection. Owing to <strong>the</strong>irrepetitive nature <strong>and</strong> <strong>the</strong>ir location in <strong>the</strong> <strong>genome</strong>, segmentalTable 16 Fraction <strong>of</strong> ®nished sequence in inter- <strong>and</strong> intrachromosomalduplicationsChromosome Intrachromosomal (%) Interchromosomal (%) All (%)1 1.4 0.5 1.92 0.1 0.6 0.73 0.3 1.1 1.14 0.0 1.0 1.05 0.6 0.3 0.96 0.8 0.4 1.17 3.4 1.3 4.18 0.3 0.1 0.39 0.8 2.9 3.710 2.1 0.8 2.911 1.2 2.1 2.312 1.5 0.3 1.813 0.0 0.5 0.514 0.6 0.4 1.015 3.0 6.9 6.916 4.5 2.0 5.817 1.6 0.3 1.818 0.0 0.7 0.719 3.6 0.3 3.820 0.2 0.3 0.521 1.4 1.6 3.022 6.1 2.6 7.5X 1.8 3.2 5.0Y 12.1 16.0 27.4Un 0.0 0.5 0.5Total 2.0 1.5 3.3.............................................................................................................................................................................Excludes duplications with identities .99.5% to avoid artefactual duplication due to incompletemerger in <strong>the</strong> assembly process. Calculation was performed on <strong>the</strong> ®nished sequence available inSeptember 2000 <strong>and</strong> re¯ects <strong>the</strong> duplications found within <strong>the</strong> total amount <strong>of</strong> ®nished sequence<strong>the</strong>n. Note that <strong>the</strong>re is some overlap between <strong>the</strong> interchromosomal <strong>and</strong> intrachromosomal sets.NATURE | VOL 409 | 15 FEBRUARY 2001 | www.nature.com © 2001 Macmillan Magazines Ltd891
articlesaSum <strong>of</strong> aligned bases (kb)c1,200,000Sum <strong>of</strong> aligned bases (kb)900,000800,000700,000600,000500,000400,000300,000200,000100,00001,000,000800,000600,000400,000200,0000Intrachromosomal90 90.5 91 91.5 92 92.5 93 93.5 94 94.5 95 95.5 96 96.5 97 97.5 98 98.5 99Similarity (%)bSum <strong>of</strong> aligned bases (kb)dSum <strong>of</strong> aligned bases (kb)1,600,0001,400,0001,200,0001,000,000800,000600,000400,000200,00004,000,0003,500,0003,000,0002,500,0002,000,0001,500,0001,000,000500,000Interchromosomal90 90.5 91 91.5 92 92.5 93 93.5 94 94.5 95 95.5 96 96.5 97 97.5 98 98.5 99Similarity (%)01 2 3 4 5 6 7 8 9 10–19 20–29 30–39 40–49 50+ 1 2 3 4 5 6 7 8 9 10–19 20–29 30–39 40–49 50+Length <strong>of</strong> alignment (kb)Length <strong>of</strong> alignment (kb)Figure 33 a±d, Sequence properties <strong>of</strong> segmental duplications. Distributions <strong>of</strong> length<strong>and</strong> per cent nucleotide identity for segmental duplications are shown as a function <strong>of</strong> <strong>the</strong>number <strong>of</strong> aligned bp, for <strong>the</strong> subset <strong>of</strong> ®nished <strong>genome</strong> sequence. Intrachromosomal,red; interchromosomal, blue.duplications may well be underestimated by <strong>the</strong> current <strong>analysis</strong>. Anunderst<strong>and</strong>ing <strong>of</strong> <strong>the</strong> biology, pathology <strong>and</strong> evolution <strong>of</strong> <strong>the</strong>seduplications will require specialized efforts within <strong>the</strong>se exceptionalregions <strong>of</strong> <strong>the</strong> <strong>human</strong> <strong>genome</strong>. The presence <strong>and</strong> distribution <strong>of</strong>such segments may provide evolutionary fodder for processes <strong>of</strong>exon shuf¯ing <strong>and</strong> a general increase in protein diversity associatedwith domain accretion. It will be important to consider both<strong>genome</strong>-wide duplication events <strong>and</strong> more restricted punctuatedevents <strong>of</strong> <strong>genome</strong> duplication as forces in <strong>the</strong> evolution <strong>of</strong> vertebrate<strong>genome</strong>s.Table 17 Fraction <strong>of</strong> <strong>the</strong> draft <strong>genome</strong> sequence in inter- <strong>and</strong> intrachromosomalduplicationsChromosome Intrachromosomal (%) Interchromosomal (%) All (%)1 2.1 1.7 3.42 1.6 1.6 2.63 1.8 1.4 2.74 1.5 2.2 3.05 1.0 0.9 1.86 1.5 1.4 2.77 3.6 1.8 4.58 1.2 1.5 2.19 2.1 2.3 3.810 3.3 2.0 4.711 2.7 1.4 3.712 2.1 1.2 2.813 1.7 1.6 3.014 0.6 0.6 1.215 4.1 4.4 6.716 3.4 3.4 5.517 4.4 1.7 5.718 0.9 1.0 1.919 5.4 1.6 6.320 0.8 1.4 2.021 1.9 4.0 4.822 6.8 7.7 11.9X 1.2 1.1 2.2Y 10.9 13.1 20.8NA 2.3 7.8 8.3UL 11.6 20.8 22.2Total 2.3 2.0 3.6.............................................................................................................................................................................Excludes duplications with identities .98% to avoid artefactual duplication due to incompletemerger in <strong>the</strong> assembly process. Calculation was performed on an earlier version <strong>of</strong> <strong>the</strong> draft<strong>genome</strong> sequence based on data available in July 2000 <strong>and</strong> re¯ects <strong>the</strong> duplications found within<strong>the</strong> total amount <strong>of</strong> ®nished sequence <strong>the</strong>n. Note that <strong>the</strong>re is some overlap between <strong>the</strong>interchromosomal <strong>and</strong> intrachromosomal sets.Gene content <strong>of</strong> <strong>the</strong> <strong>human</strong> <strong>genome</strong>Genes (or at least <strong>the</strong>ir coding regions) comprise only a tiny fraction<strong>of</strong> <strong>human</strong> DNA, but <strong>the</strong>y represent <strong>the</strong> major biological function <strong>of</strong><strong>the</strong> <strong>genome</strong> <strong>and</strong> <strong>the</strong> main focus <strong>of</strong> interest by biologists. They arealso <strong>the</strong> most challenging feature to identify in <strong>the</strong> <strong>human</strong> <strong>genome</strong>sequence.The ultimate goal is to compile a complete list <strong>of</strong> all <strong>human</strong> genes<strong>and</strong> <strong>the</strong>ir encoded proteins, to serve as a `periodic table' forbiomedical research 243 . But this is a dif®cult task. In organismswith small <strong>genome</strong>s, it is straightforward to identify most genes by<strong>the</strong> presence <strong>of</strong> long ORFs. In contrast, <strong>human</strong> genes tend to havesmall exons (encoding an average <strong>of</strong> only 50 codons) separated bylong introns (some exceeding 10 kb). This creates a signal-to-noiseproblem, with <strong>the</strong> result that computer programs for direct geneprediction have only limited accuracy. Instead, computationalprediction <strong>of</strong> <strong>human</strong> genes must rely largely on <strong>the</strong> availability <strong>of</strong>cDNA sequences or on sequence conservation with genes <strong>and</strong>proteins from o<strong>the</strong>r organisms. This approach is adequate forstrongly conserved genes (such as histones or ubiquitin), but maybe less sensitive to rapidly evolving genes (including many crucial tospeciation, sex determination <strong>and</strong> fertilization).Here we describe our efforts to recognize both <strong>the</strong> RNA genes <strong>and</strong>protein-coding genes in <strong>the</strong> <strong>human</strong> <strong>genome</strong>. We also study <strong>the</strong>properties <strong>of</strong> <strong>the</strong> predicted <strong>human</strong> protein set, attempting to discernhow <strong>the</strong> <strong>human</strong> proteome differs from those <strong>of</strong> invertebrates such asworm <strong>and</strong> ¯y.Noncoding RNAsAlthough biologists <strong>of</strong>ten speak <strong>of</strong> a tight coupling between `genesTable 18 Cross-species comparison for large, highly homologous segmentalduplicationsPercentage <strong>of</strong> <strong>genome</strong> (%)Fly Worm Human (®nished)*. 1 kb 1.2 4.25 3.25. 5 kb 0.37 1.50 2.86. 10 kb 0.08 0.66 2.52.............................................................................................................................................................................* This is an underestimate <strong>of</strong> <strong>the</strong> total amount <strong>of</strong> segmental duplication in <strong>the</strong> <strong>human</strong> <strong>genome</strong>because it only re¯ects duplication detectable with available ®nished sequence. The proportion <strong>of</strong>segmental duplications <strong>of</strong> . 1 kb is probably about 5% (see text).892 © 2001 Macmillan Magazines Ltd NATURE | VOL 409 | 15 FEBRUARY 2001 | www.nature.com
articles<strong>and</strong> <strong>the</strong>ir encoded protein products', it is important to rememberthat thous<strong>and</strong>s <strong>of</strong> <strong>human</strong> genes produce noncoding RNAs(ncRNAs) as <strong>the</strong>ir ultimate product 244 . There are several majorclasses <strong>of</strong> ncRNA. (1) Transfer RNAs (tRNAs) are <strong>the</strong> adapters thattranslate <strong>the</strong> triplet nucleic acid code <strong>of</strong> RNA into <strong>the</strong> amino-acidsequence <strong>of</strong> proteins; (2) ribosomal RNAs (rRNAs) are also centralto <strong>the</strong> translational machinery, <strong>and</strong> recent X-ray crystallographyresults strongly indicate that peptide bond formation is catalysed byrRNA, not protein 245,246 ; (3) small nucleolar RNAs (snoRNAs) arerequired for rRNA processing <strong>and</strong> base modi®cation in <strong>the</strong>nucleolus 247,248 ; <strong>and</strong> (4) small nuclear RNAs (snRNAs) are criticalcomponents <strong>of</strong> spliceosomes, <strong>the</strong> large ribonucleoprotein (RNP)complexes that splice introns out <strong>of</strong> pre-mRNAs in <strong>the</strong> nucleus.Humans have both a major, U2 snRNA-dependent spliceosome thatsplices most introns, <strong>and</strong> a minor, U12 snRNA-dependent spliceosomethat splices a rare class <strong>of</strong> introns that <strong>of</strong>ten have AT/ACdinucleotides at <strong>the</strong> splice sites instead <strong>of</strong> <strong>the</strong> canonical GT/AGsplice site consensus 249 .O<strong>the</strong>r ncRNAs include both RNAs <strong>of</strong> known biochemical function(such as telomerase RNA <strong>and</strong> <strong>the</strong> 7SL signal recognitionparticle RNA) <strong>and</strong> ncRNAs <strong>of</strong> enigmatic function (such as <strong>the</strong>large Xist transcript implicated in X dosage compensation 250 , or <strong>the</strong>small vault RNAs found in <strong>the</strong> bizarre vault ribonucleoproteincomplex 251 , which is three times <strong>the</strong> mass <strong>of</strong> <strong>the</strong> ribosome but hasunknown function).ncRNAs do not have translated ORFs, are <strong>of</strong>ten small <strong>and</strong> are notpolyadenylated. Accordingly, novel ncRNAs cannot readily befound by computational gene-®nding techniques (which searchfor features such as ORFs) or experimental <strong>sequencing</strong> <strong>of</strong> cDNA orEST libraries (most <strong>of</strong> which are prepared by reverse transcriptionusing a primer complementary to a poly(A) tail). Even if <strong>the</strong>complete ®nished sequence <strong>of</strong> <strong>the</strong> <strong>human</strong> <strong>genome</strong> were available,discovering novel ncRNAs would still be challenging. We can,however, identify genomic sequences that are homologous toknown ncRNA genes, using BLASTN or, in some cases, morespecialized methods.It is sometimes dif®cult to tell whe<strong>the</strong>r such homologous genesare orthologues, paralogues or closely related pseudogenes (becauseinactivating mutations are much less obvious than for proteincodinggenes). For tRNA, <strong>the</strong>re is suf®ciently detailed informationabout <strong>the</strong> cloverleaf secondary structure to allow true genes <strong>and</strong>pseudogenes to be distinguished with high sensitivity. For manyo<strong>the</strong>r ncRNAs, <strong>the</strong>re is much less structural information <strong>and</strong> so weemploy an operational criterion <strong>of</strong> high sequence similarity (. 95%sequence identity <strong>and</strong> . 95% full length) to distinguish true genesfrom pseudogenes. These assignments will eventually need to bereconciled with experimental data.Transfer RNA genes. The classical experimental estimate <strong>of</strong> <strong>the</strong>number <strong>of</strong> <strong>human</strong> tRNA genes is 1,310 (ref. 252). In <strong>the</strong> draft<strong>genome</strong> sequence, we ®nd only 497 <strong>human</strong> tRNA genes (Tables 19,20). How do we account for this discrepancy? We believe that <strong>the</strong>original estimate is likely to have been in¯ated in two respects. First,it came from a hybridization experiment that probably countedclosely related pseudogenes; by <strong>analysis</strong> <strong>of</strong> <strong>the</strong> draft <strong>genome</strong>sequence, <strong>the</strong>re are in fact 324 tRNA-derived putative pseudogenesTable 19 Number <strong>of</strong> tRNA genes in various organismsOrganism Number <strong>of</strong> canonical tRNAs SeCys tRNAHuman 497 1Worm 584 1Fly 284 1Yeast 273 0Methanococcus jannaschii 36 1Escherichia coli 86 1.............................................................................................................................................................................Number <strong>of</strong> tRNA genes in each <strong>of</strong> six <strong>genome</strong> sequences, according to <strong>analysis</strong> by <strong>the</strong> computerprogram tRNAscan-SE . Canonical tRNAs read one <strong>of</strong> <strong>the</strong> st<strong>and</strong>ard 61 sense codons; this categoryexcludes pseudogenes, undetermined anticodons, putative supressors <strong>and</strong> selenocysteine tRNAs.Most organisms have a selenocysteine (SeCys) tRNA species, but some unicellular eukaryotes donot (such as <strong>the</strong> yeast S. cerevisiae).(Table 20). Second, <strong>the</strong> earlier estimate assumed too high a value for<strong>the</strong> size <strong>of</strong> <strong>the</strong> <strong>human</strong> <strong>genome</strong>; repeating <strong>the</strong> calculation using <strong>the</strong>correct value yields an estimate <strong>of</strong> about 890 tRNA-related loci,which is in reasonable accord with our count <strong>of</strong> 821 tRNA genes <strong>and</strong>pseudogenes in <strong>the</strong> draft <strong>genome</strong> sequence.The <strong>human</strong> tRNA gene set predicted from <strong>the</strong> draft <strong>genome</strong>sequence appears to include most <strong>of</strong> <strong>the</strong> known <strong>human</strong> tRNAspecies. The draft <strong>genome</strong> sequence contains 37 <strong>of</strong> 38 <strong>human</strong>tRNA species listed in a tRNA database 253 , allowing for up to onemismatch. This includes one copy <strong>of</strong> <strong>the</strong> known gene for aspecialized selenocysteine tRNA, one <strong>of</strong> several components <strong>of</strong> abaroque translational mechanism that reads UGA as a selenocysteinecodon in certain rare mRNAs that carry a speci®c cis-actingRNA regulatory site (a so-called SECIS element) in <strong>the</strong>ir 39 UTRs.The one tRNA gene in <strong>the</strong> database not found in <strong>the</strong> draft <strong>genome</strong>sequence is DE9990, a tRNAGlu species, which differs in twopositions from <strong>the</strong> most related tRNA gene in <strong>the</strong> <strong>human</strong><strong>genome</strong>. Possible explanations are that <strong>the</strong> database version <strong>of</strong>this tRNA contains two errors, <strong>the</strong> gene is polymorphic or this isa genuine functional tRNA that is missing from <strong>the</strong> draft <strong>genome</strong>sequence. (The database also lists one additional tRNA gene(DS9994), but this is apparently a contaminant, most similar tobacterial tRNAs; <strong>the</strong> parent entry (Z13399) was withdrawn from <strong>the</strong>DNA database, but <strong>the</strong> tRNA entry has not yet been removed from<strong>the</strong> tRNA database.) Although <strong>the</strong> <strong>human</strong> set appears substantiallycomplete by this test, <strong>the</strong> tRNA gene numbers in Table 19 should beconsidered tentative <strong>and</strong> used with caution. The <strong>human</strong> <strong>and</strong> ¯y (butnot <strong>the</strong> worm) are known to be missing signi®cant amounts <strong>of</strong>heterochromatic DNA, <strong>and</strong> additional tRNA genes could be located<strong>the</strong>re.With this caveat, <strong>the</strong> results indicate that <strong>the</strong> <strong>human</strong> has fewertRNA genes than <strong>the</strong> worm, but more than <strong>the</strong> ¯y. This may seemsurprising, but tRNA gene number in metazoans is thought to berelated not to organismal complexity, but more to idiosyncrasies <strong>of</strong><strong>the</strong> dem<strong>and</strong> for tRNA abundance in certain tissues or stages <strong>of</strong>embryonic development. For example, <strong>the</strong> frog Xenopus laevis,which must load each oocyte with a remarkable 40 ng <strong>of</strong> tRNA,has thous<strong>and</strong>s <strong>of</strong> tRNA genes 254 .The degeneracy <strong>of</strong> <strong>the</strong> genetic code has allowed an inspiredeconomy <strong>of</strong> tRNA anticodon usage. Although 61 sense codonsneed to be decoded, not all 61 different anticodons are present intRNAs. Ra<strong>the</strong>r, tRNAs generally follow stereotyped <strong>and</strong> conservedwobble rules 255±257 . Wobble reduces <strong>the</strong> number <strong>of</strong> required anticodonssubstantially, <strong>and</strong> provides a connection between <strong>the</strong> geneticcode <strong>and</strong> <strong>the</strong> hybridization stability <strong>of</strong> modi®ed <strong>and</strong> unmodi®edRNA bases. In eukaryotes, <strong>the</strong> rules proposed by Guthrie <strong>and</strong>Abelson 256 predict that about 46 tRNA species will be suf®cient toread <strong>the</strong> 61 sense codons (counting <strong>the</strong> initiator <strong>and</strong> elongatormethionine tRNAs as two species). According to <strong>the</strong>se rules, in <strong>the</strong>codon's third (wobble) position, U <strong>and</strong> C are generally decoded by asingle tRNA species, whereas A <strong>and</strong> G are decoded by two separatetRNA species.In `two-codon boxes' <strong>of</strong> <strong>the</strong> genetic code (where codons endingwith U/C encode a different amino acid from those ending withA/G), <strong>the</strong> U/C wobble position should be decoded by a G at position34 in <strong>the</strong> tRNA anticodon. Thus, in <strong>the</strong> top left <strong>of</strong> Fig. 34, <strong>the</strong>re is notRNA with an AAA anticodon for Phe, but <strong>the</strong> GAA anticodon canrecognize both UUU <strong>and</strong> UUC codons in <strong>the</strong> mRNA. In `fourcodonboxes' <strong>of</strong> <strong>the</strong> genetic code (where U, C, A <strong>and</strong> G in <strong>the</strong> wobbleposition all encode <strong>the</strong> same amino acid), <strong>the</strong> U/C wobble positionis almost always decoded by I34 (inosine) in <strong>the</strong> tRNA, where <strong>the</strong>inosine is produced by post-transcriptional modi®cation <strong>of</strong> anadenine (A). In <strong>the</strong> bottom left <strong>of</strong> Fig. 34, for example, <strong>the</strong> GUU<strong>and</strong> GUC codons <strong>of</strong> <strong>the</strong> four-codon Val box are decoded by a tRNAwith an anticodon <strong>of</strong> AAC, which is no doubt modi®ed to IAC.Presumably this pattern, which is strikingly conserved in eukaryotes,has to do with <strong>the</strong> fact that IA base pairs are also possible; thusNATURE | VOL 409 | 15 FEBRUARY 2001 | www.nature.com © 2001 Macmillan Magazines Ltd893
articles<strong>the</strong> IAC anticodon for a Val tRNA could recognize GUU, GUC <strong>and</strong>even GUA codons. Were this same I34 to be utilized in two-codonboxes, however, misreading <strong>of</strong> <strong>the</strong> NNA codon would occur, resultingin translational havoc. Eukaryotic glycine tRNAs represent aconserved exception to this last rule; <strong>the</strong>y use a GCC anticodon todecode GGU <strong>and</strong> GGC, ra<strong>the</strong>r than <strong>the</strong> expected ICC anticodon.Satisfyingly, <strong>the</strong> <strong>human</strong> tRNA set follows <strong>the</strong>se wobble rulesalmost perfectly (Fig. 34). Only three unexpected tRNA speciesare found: single genes for a tRNATyr-AUA, tRNAIle-GAU, <strong>and</strong>tRNAAsn-AUU. Perhaps <strong>the</strong>se are pseudogenes, but <strong>the</strong>y appear tobe plausible tRNAs. We also checked <strong>the</strong> possibility <strong>of</strong> <strong>sequencing</strong>errors in <strong>the</strong>ir anticodons, but each <strong>of</strong> <strong>the</strong>se three genes is in a region<strong>of</strong> high sequence accuracy, with PHRAP quality scores higherthan 70 for every base in <strong>the</strong>ir anticodons.As in all o<strong>the</strong>r organisms, <strong>human</strong> protein-coding genes showcodon biasÐpreferential use <strong>of</strong> one synonymous codon overano<strong>the</strong>r 258 (Fig. 34). In less complex organisms, such as yeast orbacteria, highly expressed genes show <strong>the</strong> strongest codon bias.Cytoplasmic abundance <strong>of</strong> tRNA species is correlated with bothcodon bias <strong>and</strong> overall amino-acid frequency (for example, tRNAsfor preferred codons <strong>and</strong> for more common amino acids are moreabundant). This is presumably driven by selective pressure foref®cient or accurate translation 259 . In many organisms, tRNAabundance in turn appears to be roughly correlated with tRNAgene copy number, so tRNA gene copy number has been used as aproxy for tRNA abundance 260 . In vertebrates, however, codon bias isnot so obviously correlated with gene expression level. Differingcodon biases between <strong>human</strong> genes is more a function <strong>of</strong> <strong>the</strong>irlocation in regions <strong>of</strong> different GC composition 261 . In agreementwith <strong>the</strong> literature, we see only a very rough correlation <strong>of</strong> <strong>human</strong>tRNA gene number with ei<strong>the</strong>r amino-acid frequency or codon bias(Fig. 34). The most obvious outliers in <strong>the</strong>se weak correlations are<strong>the</strong> strongly preferred CUG leucine codon, with a mere six tRNA-Leu-CAG genes producing a tRNA to decode it, <strong>and</strong> <strong>the</strong> relativelyrare cysteine UGU <strong>and</strong> UGC codons, with 30 tRNA genes to decode<strong>the</strong>m.The tRNA genes are dispersed throughout <strong>the</strong> <strong>human</strong> <strong>genome</strong>.However, this dispersal is nonr<strong>and</strong>om. tRNA genes have sometimesbeen seen in clusters at small scales 262,263 but we can now see strikingclustering on a <strong>genome</strong>-wide scale. More than 25% <strong>of</strong> <strong>the</strong> tRNAgenes (140) are found in a region <strong>of</strong> only about 4 Mb on chromosome6. This small region, only about 0.1% <strong>of</strong> <strong>the</strong> <strong>genome</strong>, containsan almost suf®cient set <strong>of</strong> tRNA genes all by itself. The 140 tRNAgenes contain a representative for 36 <strong>of</strong> <strong>the</strong> 49 anticodons found in<strong>the</strong> complete set; <strong>and</strong> <strong>of</strong> <strong>the</strong> 21 isoacceptor types, only tRNAs todecode Asn, Cys, Glu <strong>and</strong> selenocysteine are missing. Many <strong>of</strong> <strong>the</strong>setRNA genes, meanwhile, are clustered elsewhere; 18 <strong>of</strong> <strong>the</strong> 30 CystRNAs are found in a 0.5-Mb stretch <strong>of</strong> chromosome 7 <strong>and</strong> many <strong>of</strong><strong>the</strong> Asn <strong>and</strong> Glu tRNA genes are loosely clustered on chromosome 1.More than half <strong>of</strong> <strong>the</strong> tRNA genes (280 out <strong>of</strong> 497) reside on ei<strong>the</strong>rchromosome 1 or chromosome 6. Chromosomes 3, 4, 8, 9, 10, 12,18, 20, 21 <strong>and</strong> X appear to have fewer than 10 tRNA genes each; <strong>and</strong>chromosomes 22 <strong>and</strong> Y have none at all (each has a singlepseudogene).Ribosomal RNA genes. The ribosome, <strong>the</strong> protein syn<strong>the</strong>ticmachine <strong>of</strong> <strong>the</strong> cell, is made up <strong>of</strong> two subunits <strong>and</strong> contains fourrRNA species <strong>and</strong> many proteins. The large ribosomal subunitcontains 28S <strong>and</strong> 5.8S rRNAs (collectively called `large subunit'(LSU) rRNA) <strong>and</strong> also a 5S rRNA. The small ribosomal subunitcontains 18S rRNA (`small subunit' (SSU) rRNA). The genes forLSU <strong>and</strong> SSU rRNA occur in <strong>the</strong> <strong>human</strong> <strong>genome</strong> as a 44-kb t<strong>and</strong>emrepeat unit 264 . There are thought to be about 150±200 copies <strong>of</strong> thisrepeat unit arrayed on <strong>the</strong> short arms <strong>of</strong> acrocentric chromosomes13, 14, 15, 21 <strong>and</strong> 22 (refs 254, 264). There are no true completePheLeu171 UUU203 UUC73 UUA125 UUGAAA 0GAA 14UAA 8CAA 6Ser14717211845UCUUCCUCAUCGAGAGGAUGACGA10054Tyrstopstop12415800UAUUACUAAUAGAUAGUAUUACUA11100CysstopTrp991190122UGUUGCUGAUGGACA 0GCA 30UCA 0CCA 7Leu127 CUU187 CUC69 CUA392 CUGAAG 13GAG 0UAG 2CAG 6Pro17519717069CCUCCCCCACCGAGGGGGUGGCGG110104HisGln104147121343CAUCACCAACAGAUGGUGUUGCUG0121121Arg4710763115CGUCGCCGACGGACG 9GCG 0UCG 7CCG 5IleMet165 AUU218 AUC71 AUA221 AUGAAU 13GAU 1UAU 5CAU 17Thr13119215063ACUACCACAACGAGUGGUUGUCGU80107AsnLys174199248331AAUAACAAAAAGAUUGUUUUUCUU1331622SerArg121191113110AGUAGCAGAAGGACU 0GCU 7UCU 5CCU 4Val111 GUU146 GUC72 GUA288 GUGAAC 20GAC 0UAC 5CAC 19Ala18528216074GCUGCCGCAGCGAGCGGCUGCCGC250105AspGlu230262301404GAUGACGAAGAGAUCGUCUUCCUC010148Gly112230168160GGUGGCGGAGGGACC 0GCC 11UCC 5CCC 8Figure 34 The <strong>human</strong> genetic code <strong>and</strong> associated tRNA genes. For each <strong>of</strong> <strong>the</strong> 64codons, we show: <strong>the</strong> corresponding amino acid; <strong>the</strong> observed frequency <strong>of</strong> <strong>the</strong> codon per10,000 codons; <strong>the</strong> codon; predicted wobble pairing to a tRNA anticodon (black lines); anunmodi®ed tRNA anticodon sequence; <strong>and</strong> <strong>the</strong> number <strong>of</strong> tRNA genes found with thisanticodon. For example, phenylalanine is encoded by UUU or UUC; UUC is seen morefrequently, 203 to 171 occurrences per 10,000 total codons; both codons are expected tobe decoded by a single tRNA anticodon type, GAA, using a G/U wobble; <strong>and</strong> <strong>the</strong>re are 14tRNA genes found with this anticodon. The modi®ed anticodon sequence in <strong>the</strong> maturetRNA is not shown, even where post-transcriptional modi®cations can be con®dentlypredicted (for example, when an A is used to decode a U/C third position, <strong>the</strong> A is almostcertainly an inosine in <strong>the</strong> mature tRNA). The Figure also does not show <strong>the</strong> number <strong>of</strong>distinct tRNA species (such as distinct sequence families) for each anticodon; <strong>of</strong>ten <strong>the</strong>reis more than one species for each anticodon.894 © 2001 Macmillan Magazines Ltd NATURE | VOL 409 | 15 FEBRUARY 2001 | www.nature.com
articlescopies <strong>of</strong> <strong>the</strong> rDNA t<strong>and</strong>em repeats in <strong>the</strong> draft <strong>genome</strong> sequence,owing to <strong>the</strong> deliberate bias in <strong>the</strong> initial phase <strong>of</strong> <strong>the</strong> <strong>sequencing</strong>effort against <strong>sequencing</strong> BAC clones whose restriction fragment®ngerprints showed <strong>the</strong>m to contain primarily t<strong>and</strong>emly repeatedsequence. Sequence similarity <strong>analysis</strong> with <strong>the</strong> BLASTN computerprogram does, however, detect hundreds <strong>of</strong> rDNA-derived sequencefragments dispersed throughout <strong>the</strong> complete <strong>genome</strong>, includingone `full-length' copy <strong>of</strong> an individual 5.8S rRNA gene not associatedwith a true t<strong>and</strong>em repeat unit (Table 20).The 5S rDNA genes also occur in t<strong>and</strong>em arrays, <strong>the</strong> largest <strong>of</strong>which is on chromosome 1 between 1q41.11 <strong>and</strong> 1q42.13, close to<strong>the</strong> telomere 265,266 . There are 200±300 true 5S genes in <strong>the</strong>searrays 265,267 . The number <strong>of</strong> 5S-related sequences in <strong>the</strong> <strong>genome</strong>,including numerous dispersed pseudogenes, is classically cited as2,000 (refs 252, 254). The long t<strong>and</strong>em array on chromosome 1 isnot yet present in <strong>the</strong> draft <strong>genome</strong> sequence because <strong>the</strong>re are noEcoRI or HindIII sites present, <strong>and</strong> thus it was not cloned in <strong>the</strong>most heavily utilized BAC libraries (Table 1). We expect to recover itduring <strong>the</strong> ®nishing stage. We do detect four individual copies <strong>of</strong> 5SrDNA by our search criteria ($ 95% identity <strong>and</strong> $ 95% fulllength). We also ®nd many more distantly related dispersedsequences (520 at P # 0.001), which we interpret as probablepseudogenes (Table 20).Small nucleolar RNA genes. Eukaryotic rRNA is extensively processed<strong>and</strong> modi®ed in <strong>the</strong> nucleolus. Much <strong>of</strong> this activity isdirected by numerous snoRNAs. These come in two families: C/Dbox snoRNAs (mostly involved in guiding site-speci®c 29-O-ribosemethylations <strong>of</strong> o<strong>the</strong>r RNAs) <strong>and</strong> H/ACA snoRNAs (mostlyinvolved in guiding site-speci®c pseudouridylations) 247,248 . Wecompiled a set <strong>of</strong> 97 known <strong>human</strong> snoRNA gene sequences; 84<strong>of</strong> <strong>the</strong>se (87%) have at least one copy in <strong>the</strong> draft <strong>genome</strong> sequence(Table 20), almost all as single-copy genes.It is thought that all 29-O-ribose methylations <strong>and</strong> pseudouridylationsin eukaryotic rRNA are guided by snoRNAs. There are105±107 methylations <strong>and</strong> around 95 pseudouridylations in <strong>human</strong>rRNA 268 . Only about half <strong>of</strong> <strong>the</strong>se have been tentatively assigned toknown guide snoRNAs. There are also snoRNA-directedmodi®cations on o<strong>the</strong>r stable RNAs, such as U6 (ref. 269), <strong>and</strong><strong>the</strong> extent <strong>of</strong> this is just beginning to be explored. Sequencesimilarity has so far proven insuf®cient to recognize all snoRNAgenes. We <strong>the</strong>refore expect that <strong>the</strong>re are many unrecognizedsnoRNA genes that are not detected by BLAST queries.Spliceosomal RNAs <strong>and</strong> o<strong>the</strong>r ncRNA genes. We also looked forcopies <strong>of</strong> o<strong>the</strong>r known ncRNA genes. We found at least one copy <strong>of</strong>21 (95%) <strong>of</strong> 22 known ncRNAs, including <strong>the</strong> spliceosomalsnRNAs. There were multiple copies for several ncRNAs, asexpected; for example, we ®nd 44 dispersed genes for U6 snRNA,<strong>and</strong> 16 for U1 snRNA (Table 20).For some <strong>of</strong> <strong>the</strong>se RNA genes, homogeneous multigene familiesthat occur in t<strong>and</strong>em arrays are again under-represented owing to<strong>the</strong> restriction enzymes used in constructing <strong>the</strong> BAC libraries <strong>and</strong>,in some instances, <strong>the</strong> decision to delay <strong>the</strong> <strong>sequencing</strong> <strong>of</strong> BACclones with low complexity ®ngerprints indicative <strong>of</strong> t<strong>and</strong>emlyrepeated DNA. The U2 RNA genes are located at <strong>the</strong> RNU2 locus,a t<strong>and</strong>em array <strong>of</strong> 10±20 copies <strong>of</strong> nearly identical 6.1-kb units at17q21±q22 (refs 270±272). Similarly, <strong>the</strong> U3 snoRNA genes(included in <strong>the</strong> aggregate count <strong>of</strong> C/D snoRNAs in Table 20) areclustered at <strong>the</strong> RNU3 locus at 17p11.2, not in a t<strong>and</strong>em array, but ina complex inverted repeat structure <strong>of</strong> about 5±10 copies perhaploid <strong>genome</strong> 273 . The U1 RNA genes are clustered with about30 copies at <strong>the</strong> RNU1 locus at 1p36.1, but this cluster is thought tobe loose <strong>and</strong> irregularly organized; no two U1 genes have beencloned on <strong>the</strong> same cosmid 271 . In <strong>the</strong> draft <strong>genome</strong> sequence, we seesix copies <strong>of</strong> U2 RNA that meet our criteria for true genes, three <strong>of</strong>which appear to be in <strong>the</strong> expected position on chromosome 17. ForU3, so far we see one true copy at <strong>the</strong> correct place on chromosome17p11.2. For U1, we see 16 true genes, 6 <strong>of</strong> which are looselyclustered within 0.6 Mb at 1p36.1 <strong>and</strong> ano<strong>the</strong>r 6 are elsewhere onchromosome 1. Again, <strong>the</strong>se <strong>and</strong> o<strong>the</strong>r clusters will be a matter for<strong>the</strong> ®nishing process.Table 20 Known non-coding RNA genes in <strong>the</strong> draft <strong>genome</strong> sequenceRNA gene* Number expected² Number found³ Number <strong>of</strong>related genes§FunctiontRNA 1,310 497 324 Protein syn<strong>the</strong>sisSSU (18S) rRNA 150±200 0 40 Protein syn<strong>the</strong>sis5.8S rRNA 150±200 1 11 Protein syn<strong>the</strong>sisLSU (28S) rRNA 150±200 0 181 Protein syn<strong>the</strong>sis5S rRNA 200±300 4 520 Protein syn<strong>the</strong>sisU1 ,30 16 134 Spliceosome componentU2 10±20 6 94 Spliceosome componentU4 ?? 4 87 Spliceosome componentU4atac ?? 1 20 Component <strong>of</strong> minor (U11/U12) spliceosomeU5 ?? 1 31 Spliceosome componentU6 ?? 44 1,135 Spliceosome componentU6atac ?? 4 32 Component <strong>of</strong> minor (U11/U12) spliceosomeU7 1 1 3 Histone mRNA 39 processingU11 1 0 6 Component <strong>of</strong> minor (U11/U12) spliceosomeU12 1 1 0 Component <strong>of</strong> minor (U11/U12) spliceosomeSRP (7SL) RNA 4 3 773 Component <strong>of</strong> signal recognition particle (protein secretion)RNAse P 1 1 2 tRNA 59 end processingRNAse MRP 1 1 6 rRNA processingTelomerase RNA 1 1 4 Template for addition <strong>of</strong> telomereshY1 1 1 353 Component <strong>of</strong> Ro RNP, function unknownhY3 1 25 414 Component <strong>of</strong> Ro RNP, function unknownhY4 1 3 115 Component <strong>of</strong> Ro RNP, function unknownhY5 (4.5S RNA) 1 1 9 Component <strong>of</strong> Ro RNP, function unknownVault RNAs 3 3 1 Component <strong>of</strong> 13-MDa vault RNP, function unknown7SK 1 1 330 UnknownH19 1 1 2 UnknownXist 1 1 0 Initiation <strong>of</strong> X chromosome inactivation (dosage compensation)Known C/D snoRNAs 81 69 558 Pre-rRNA processing or site-speci®c ribose methylation <strong>of</strong> rRNAKnown H/ACA snoRNAs 16 15 87 Pre-rRNA processing or site-speci®c pseudouridylation <strong>of</strong> rRNA...................................................................................................................................................................................................................................................................................................................................................................* Known ncRNA genes (or gene families, such as <strong>the</strong> C/D <strong>and</strong> H/ACA snoRNA families); reference sequences were extracted from GenBank <strong>and</strong> used to probe <strong>the</strong> draft <strong>genome</strong> sequence.² Number <strong>of</strong> genes that were expected in <strong>the</strong> <strong>human</strong> <strong>genome</strong>, based on previous literature (note that earlier experimental techniques probably tend to overestimate copy number, by counting closely relatedpseudogenes).³ The copy number <strong>of</strong> `true' full-length genes identi®ed in <strong>the</strong> draft <strong>genome</strong> sequence.§ The copy number <strong>of</strong> o<strong>the</strong>r signi®cantly related copies (pseudogenes, fragments, paralogues) found. Except for <strong>the</strong> 497 true tRNA genes, all sequence similarities were identi®ed by WashU BLASTN 2.0MP(W. Gish, unpublished; http://blast.wustl.edu), with parameters `-kap wordmask = seg B = 50000 W = 8' <strong>and</strong> <strong>the</strong> default +5/-4 DNA scoring matrix. True genes were operationally de®ned as BLAST hitswith $ 95% identity over $ 95% <strong>of</strong> <strong>the</strong> length <strong>of</strong> <strong>the</strong> query. Related sequences were operationally de®ned as all o<strong>the</strong>r BLAST hits with P-values # 0.001.NATURE | VOL 409 | 15 FEBRUARY 2001 | www.nature.com © 2001 Macmillan Magazines Ltd895
articlesTable 21 Characteristics <strong>of</strong> <strong>human</strong> genesMedian Mean Sample (size)Internal exon 122 bp 145 bp RefSeq alignments to draft <strong>genome</strong> sequence, withcon®rmed intron boundaries (43,317 exons)Exon number 7 8.8 RefSeq alignments to ®nished sequence (3,501 genes)Introns 1,023 bp 3,365 bp RefSeq alignments to ®nished sequence (27,238 introns)39 UTR 400 bp 770 bp Con®rmed by mRNA or EST on chromosome 22 (689)59 UTR 240 bp 300 bp Con®rmed by mRNA or EST on chromosome 22 (463)Coding sequence1,100 bp1,340 bpSelected RefSeq entries (1,804)(CDS)367 aa447 aaGenomic extent 14 kb 27 kb Selected RefSeq entries (1,804)...................................................................................................................................................................................................................................................................................................................................................................Median <strong>and</strong> mean values for a number <strong>of</strong> properties <strong>of</strong> <strong>human</strong> protein-coding genes. The 1,804 selected RefSeq entries were those that could be unambiguously aligned to ®nished sequence over <strong>the</strong>irentire length.Our observations also con®rm <strong>the</strong> striking proliferation <strong>of</strong>ncRNA-derived pseudogenes (Table 20). There are hundreds orthous<strong>and</strong>s <strong>of</strong> sequences in <strong>the</strong> draft <strong>genome</strong> sequence related tosome <strong>of</strong> <strong>the</strong> ncRNA genes. The most proli®c pseudogene countsgenerally come from RNA genes transcribed by RNA polymerase IIIpromoters, including U6, <strong>the</strong> hY RNAs <strong>and</strong> SRP-RNA. ThesencRNA pseudogenes presumably arise through reverse transcription.The frequency <strong>of</strong> such events gives insight into how ncRNAgenes can evolve into SINE retroposons, such as <strong>the</strong> tRNA-derivedSINEs found in many vertebrates <strong>and</strong> <strong>the</strong> SRP-RNA-derived Aluelements found in <strong>human</strong>s.Protein-coding genesIdentifying <strong>the</strong> protein-coding genes in <strong>the</strong> <strong>human</strong> <strong>genome</strong> is one <strong>of</strong><strong>the</strong> most important applications <strong>of</strong> <strong>the</strong> sequence data, but also one<strong>of</strong> <strong>the</strong> most dif®cult challenges. We describe below our efforts tocreate an initial <strong>human</strong> gene <strong>and</strong> protein index.Exploring properties <strong>of</strong> known genes. Before attempting toidentify new genes, we explored what could be learned by aligning<strong>the</strong> cDNA sequences <strong>of</strong> known genes to <strong>the</strong> draft <strong>genome</strong> sequence.Genomic alignments allow one to study exon±intron structure <strong>and</strong>local GC content, <strong>and</strong> are valuable for biomedical studies because<strong>the</strong>y connect genes with <strong>the</strong> genetic <strong>and</strong> cytogenetic map, link <strong>the</strong>mwith regulatory sequences <strong>and</strong> facilitate <strong>the</strong> development <strong>of</strong> polymerasechain reaction (PCR) primers to amplify exons. Until now,genomic alignment was available for only about a quarter <strong>of</strong> knowngenes.The `known' genes studied were those in <strong>the</strong> RefSeq database 110 ,amanually curated collection designed to contain nonredundantrepresentatives <strong>of</strong> most full-length <strong>human</strong> mRNA sequences inGenBank (RefSeq intentionally contains some alternative spliceforms <strong>of</strong> <strong>the</strong> same genes). The version <strong>of</strong> RefSeq used contained10,272 mRNAs.The RefSeq genes were aligned with <strong>the</strong> draft <strong>genome</strong> sequence,using both <strong>the</strong> Spidey (S. Wheelan, personal communication) <strong>and</strong>Acembly (D. Thierry-Mieg <strong>and</strong> J. Thierry-Mieg, unpublished;http://www.acedb.org) computer programs. Because this sequenceis incomplete <strong>and</strong> contains errors, not all genes could be fullyaligned <strong>and</strong> some may have been incorrectly aligned. More than92% <strong>of</strong> <strong>the</strong> RefSeq entries could be aligned at high stringency over atleast part <strong>of</strong> <strong>the</strong>ir length, <strong>and</strong> 85% could be aligned over more thanhalf <strong>of</strong> <strong>the</strong>ir length. Some genes (16%) had high stringency alignmentsto more than one location in <strong>the</strong> draft <strong>genome</strong> sequenceowing, for example, to paralogues or pseudogenes. In such cases, weconsidered only <strong>the</strong> best match. In a few <strong>of</strong> <strong>the</strong>se cases, <strong>the</strong> assignmentmay not be correct because <strong>the</strong> true matching region has notyet been sequenced. Three per cent <strong>of</strong> entries appeared to bealternative splice products <strong>of</strong> <strong>the</strong> same gene, on <strong>the</strong> basis <strong>of</strong> <strong>the</strong>iralignment to <strong>the</strong> same location in <strong>the</strong> draft <strong>genome</strong> sequence. In all,we obtained at least partial genomic alignments for 9,212 distinctknown genes <strong>and</strong> essentially complete alignment for 5,364 <strong>of</strong><strong>the</strong>m.Previous efforts to study <strong>human</strong> gene structure 116,274,275 have beenhampered by limited sample sizes <strong>and</strong> strong biases in favour <strong>of</strong>compact genes. Table 21 gives <strong>the</strong> mean <strong>and</strong> median values <strong>of</strong> somebasic characteristics <strong>of</strong> gene structures. Some <strong>of</strong> <strong>the</strong> values may beunderestimates. In particular, <strong>the</strong> UTRs given in <strong>the</strong> RefSeq databaseare likely to be incomplete; <strong>the</strong>y are considerably shorter, forexample, than those derived from careful reconstructions on chromosome22. Intron sizes were measured only for genes in ®nishedgenomic sequence, to mitigate <strong>the</strong> bias arising from <strong>the</strong> fact thataPercentage <strong>of</strong> exonsbPercentage <strong>of</strong> intronscPercentage <strong>of</strong> introns76543210605040302010025201510500 100 200 300 400 500 600 700 800 900 1,000Exon length (bp)30 kbIntron lengthHumanWormFly0 20 40 60 80 100 120 140 160Intron length (bp)HumanWormFlyHumanWormFlyFigure 35 Size distributions <strong>of</strong> exons, introns <strong>and</strong> short introns, in sequenced <strong>genome</strong>s.a, Exons; b, introns; c, short introns (enlarged from b). Con®rmed exons <strong>and</strong> introns for<strong>the</strong> <strong>human</strong> were taken from RefSeq alignments <strong>and</strong> for worm <strong>and</strong> ¯y from Acemblyalignments <strong>of</strong> ESTs (J. <strong>and</strong> D. Thierry-Mieg <strong>and</strong>, for worm, Y. Kohara, unpublished).896 © 2001 Macmillan Magazines Ltd NATURE | VOL 409 | 15 FEBRUARY 2001 | www.nature.com
articleslong introns are more likely than short introns to be interrupted bygaps in <strong>the</strong> draft <strong>genome</strong> sequence. None<strong>the</strong>less, <strong>the</strong>re may be someresidual bias against long genes <strong>and</strong> long introns.There is considerable variation in overall gene size <strong>and</strong> intron size,with both distributions having very long tails. Many genes are over100 kb long, <strong>the</strong> largest known example being <strong>the</strong> dystrophin gene(DMD) at 2.4 Mb. The variation in <strong>the</strong> size distribution <strong>of</strong> codingsequences <strong>and</strong> exons is less extreme, although <strong>the</strong>re are still someremarkable outliers. The titin gene 276 has <strong>the</strong> longest currentlyknown coding sequence at 80,780 bp; it also has <strong>the</strong> largestnumber <strong>of</strong> exons (178) <strong>and</strong> longest single exon (17,106 bp).It is instructive to compare <strong>the</strong> properties <strong>of</strong> <strong>human</strong> genes withthose from worm <strong>and</strong> ¯y. For all three organisms, <strong>the</strong> typical length<strong>of</strong> a coding sequence is similar (1,311 bp for worm, 1,497 bp for ¯y<strong>and</strong> 1,340 bp for <strong>human</strong>), <strong>and</strong> most internal exons fall within acommon peak between 50 <strong>and</strong> 200 bp (Fig. 35a). However, <strong>the</strong>worm <strong>and</strong> ¯y exon distributions have a fatter tail, resulting in alarger mean size for internal exons (218 bp for worm versus 145 bpfor <strong>human</strong>). The conservation <strong>of</strong> preferred exon size across all threespecies supports suggestions <strong>of</strong> a conserved exon-based component<strong>of</strong> <strong>the</strong> splicing machinery 277 . Intriguingly, <strong>the</strong> few extremely short<strong>human</strong> exons show an unusual base composition. In 42 detected<strong>human</strong> exons <strong>of</strong> less than 19 bp, <strong>the</strong> nucleotide frequencies <strong>of</strong> A, G,T <strong>and</strong> C are 39, 33, 15 <strong>and</strong> 12%, respectively, showing a strongpurine bias. Purine-rich sequences may enhance splicing 278,279 , <strong>and</strong> itis possible that such sequences are required or strongly selected forto ensure correct splicing <strong>of</strong> very short exons. Previous studies haveshown that short exons require intronic, but not exonic, splicingenhancers 280 .In contrast to <strong>the</strong> exons, <strong>the</strong> intron size distributions differsubstantially among <strong>the</strong> three species (Fig. 35b, c). The worm <strong>and</strong>¯y each have a reasonably tight distribution, with most introns near<strong>the</strong> preferred minimum intron length (47 bp for worm, 59 bp for¯y) <strong>and</strong> an extended tail (overall average length <strong>of</strong> 267 bp for worm<strong>and</strong> 487 bp for ¯y). Intron size is much more variable in <strong>human</strong>s,with a peak at 87 bp but a very long tail resulting in a mean <strong>of</strong> morethan 3,300 bp. The variation in intron size results in great variationin gene size.The variation in gene size <strong>and</strong> intron size can partly be explainedby <strong>the</strong> fact that GC-rich regions tend to be gene-dense with manycompact genes, whereas AT-rich regions tend to be gene-poor withmany sprawling genes containing large introns. The correlation <strong>of</strong>gene density with GC content is shown in Fig. 36a, b; <strong>the</strong> relativedensity increases more than tenfold as GC content increases fromaFrequency0.200.180.160.140.120.100.080.060.040.020.000.300.320.340.360.380.400.420.440.460.480.500.520.540.560.580.600.620.640.66GC contentGenomeGenes0.680.70b 20Relative gene density1816141210864200.300.320.340.360.380.400.420.440.460.480.500.520.54GC content0.560.580.600.620.640.660.680.70c2,500140Median intron length2,0001,5001,0001201008060Median exon length50040200IntronExon0.3 0.35 0.4 0.45 0.5 0.55 0.6 0.65GC content0Figure 36 GC content. a, Distribution <strong>of</strong> GC content in genes <strong>and</strong> in <strong>the</strong> <strong>genome</strong>. For9,315 known genes mapped to <strong>the</strong> draft <strong>genome</strong> sequence, <strong>the</strong> local GC content wascalculated in a window covering ei<strong>the</strong>r <strong>the</strong> whole alignment or 20,000 bp centred around<strong>the</strong> midpoint <strong>of</strong> <strong>the</strong> alignment, whichever was larger. Ns in <strong>the</strong> sequence were notcounted. GC content for <strong>the</strong> <strong>genome</strong> was calculated for adjacent nonoverlapping 20,000-bp windows across <strong>the</strong> sequence. Both <strong>the</strong> gene <strong>and</strong> <strong>genome</strong> distributions have beennormalized to sum to one. b, Gene density as a function <strong>of</strong> GC content, obtained by taking<strong>the</strong> ratio <strong>of</strong> <strong>the</strong> data in a. Values are less accurate at higher GC levels because <strong>the</strong>denominator is small. c, Dependence <strong>of</strong> mean exon <strong>and</strong> intron lengths on GC content. Forexons <strong>and</strong> introns, <strong>the</strong> local GC content was derived from alignments to ®nished sequenceonly, <strong>and</strong> were calculated from windows covering <strong>the</strong> feature or 10,000 bp centred on <strong>the</strong>feature, whichever was larger.NATURE | VOL 409 | 15 FEBRUARY 2001 | www.nature.com © 2001 Macmillan Magazines Ltd897
articles30% to 50%. The correlation appears to be due primarily to intronsize, which drops markedly with increasing GC content (Fig. 36c).In contrast, coding properties such as exon length (Fig. 36c) or exonnumber (data not shown) vary little. Intergenic distance is alsoprobably lower in high-GC areas, although this is hard to provedirectly until all genes have been identi®ed.The large number <strong>of</strong> con®rmed <strong>human</strong> introns allows us toanalyse variant splice sites, con®rming <strong>and</strong> extending recentreports 281 . Intron positions were con®rmed by applying a stringentcriterion that EST or mRNA sequence show an exact match <strong>of</strong> 8 bpin <strong>the</strong> ¯anking exonic sequence on each side. Of 53,295 con®rmedintrons, 98.12% use <strong>the</strong> canonical dinucleotides GT at <strong>the</strong> 59 splicesite <strong>and</strong> AG at <strong>the</strong> 39 site (GT±AG pattern). Ano<strong>the</strong>r 0.76% use <strong>the</strong>related GC±AG. About 0.10% use AT±AC, which is a rare alternativepattern primarily recognized by <strong>the</strong> variant U12 splicingmachinery 282 . The remaining 1% belong to 177 types, some <strong>of</strong> whichundoubtedly re¯ect <strong>sequencing</strong> or alignment errors.Finally, we looked at alternative splicing <strong>of</strong> <strong>human</strong> genes. Alternativesplicing can allow many proteins to be produced from asingle gene <strong>and</strong> can be used for complex gene regulation. It appearsto be prevalent in <strong>human</strong>s, with lower estimates <strong>of</strong> about 35% <strong>of</strong><strong>human</strong> genes being subject to alternative splicing 283±285 . Thesestudies may have underestimated <strong>the</strong> prevalence <strong>of</strong> alternativesplicing, because <strong>the</strong>y examined only EST alignments coveringonly a portion <strong>of</strong> a gene.To investigate <strong>the</strong> prevalence <strong>of</strong> alternative splicing, we analysedreconstructed mRNA transcripts covering <strong>the</strong> entire coding regions<strong>of</strong> genes on chromosome 22 (omitting small genes with codingregions <strong>of</strong> less than 240 bp). Potential transcripts identi®ed byalignments <strong>of</strong> ESTs <strong>and</strong> cDNAs to genomic sequence were veri®edby <strong>human</strong> inspection. We found 642 transcripts, covering 245 genes(average <strong>of</strong> 2.6 distinct transcripts per gene). Two or more alternativelyspliced transcripts were found for 145 (59%) <strong>of</strong> <strong>the</strong>se genes.A similar <strong>analysis</strong> for <strong>the</strong> gene-rich chromosome 19 gave 1,859transcripts, corresponding to 544 genes (average 3.2 distinct transcriptsper gene). Because we are sampling only a subset <strong>of</strong> alltranscripts, <strong>the</strong> true extent <strong>of</strong> alternative splicing is likely to begreater. These ®gures are considerably higher than those for worm,in which <strong>analysis</strong> reveals alternative splicing for 22% <strong>of</strong> genes forwhich ESTs have been found, with an average <strong>of</strong> 1.34 (12,816/9,516)splice variants per gene. (The apparently higher extent <strong>of</strong> alternativesplicing seen in <strong>human</strong> than in worm was not an artefact resultingfrom much deeper coverage <strong>of</strong> <strong>human</strong> genes by ESTs <strong>and</strong> mRNAs.Although <strong>the</strong>re are many times more ESTs available for <strong>human</strong> thanworm, <strong>the</strong>se ESTs tend to have shorter average length (because manywere <strong>the</strong> product <strong>of</strong> early <strong>sequencing</strong> efforts) <strong>and</strong> many match no<strong>human</strong> genes. We calculated <strong>the</strong> actual coverage per bp used in <strong>the</strong><strong>analysis</strong> <strong>of</strong> <strong>the</strong> <strong>human</strong> <strong>and</strong> worm genes; <strong>the</strong> coverage is onlymodestly higher (about 50%) for <strong>the</strong> <strong>human</strong>, with a strong biastowards 39 UTRs which tend to show much less alternative splicing.We also repeated <strong>the</strong> <strong>analysis</strong> using equal coverage for <strong>the</strong> twoorganisms <strong>and</strong> con®rmed that higher levels <strong>of</strong> alternative splicingwere still seen in <strong>human</strong>.)Seventy per cent <strong>of</strong> alternative splice forms found in <strong>the</strong> genes onchromosomes 19 <strong>and</strong> 22 affect <strong>the</strong> coding sequence, ra<strong>the</strong>r thanmerely changing <strong>the</strong> 39 or 59 UTR. (This estimate may be affected by<strong>the</strong> incomplete representation <strong>of</strong> UTRs in <strong>the</strong> RefSeq database <strong>and</strong>in <strong>the</strong> transcripts studied.) Alternative splicing <strong>of</strong> <strong>the</strong> terminal exonwas seen for 20% <strong>of</strong> 6,105 mRNAs that were aligned to <strong>the</strong> draft<strong>genome</strong> sequence <strong>and</strong> correspond to con®rmed 39 EST clusters. Inaddition to alternative splicing, we found evidence <strong>of</strong> <strong>the</strong> terminalexon employing alternative polyadenylation sites (separated by. 100 bp) in 24% <strong>of</strong> cases.Towards a complete index <strong>of</strong> <strong>human</strong> genes. We next focused oncreating an initial index <strong>of</strong> <strong>human</strong> genes <strong>and</strong> proteins. This index isquite incomplete, owing to <strong>the</strong> dif®culty <strong>of</strong> gene identi®cation in<strong>human</strong> DNA <strong>and</strong> <strong>the</strong> imperfect state <strong>of</strong> <strong>the</strong> draft <strong>genome</strong> sequence.None<strong>the</strong>less, it is valuable for experimental studies <strong>and</strong> providesimportant insights into <strong>the</strong> nature <strong>of</strong> <strong>human</strong> genes <strong>and</strong> proteins.The challenge <strong>of</strong> identifying genes from genomic sequence variesgreatly among organisms. Gene identi®cation is almost trivial inbacteria <strong>and</strong> yeast, because <strong>the</strong> absence <strong>of</strong> introns in bacteria <strong>and</strong><strong>the</strong>ir paucity in yeast means that most genes can be readilyrecognized by ab initio <strong>analysis</strong> as unusually long ORFs. It is notas simple, but still relatively straightforward, to identify genes inanimals with small <strong>genome</strong>s <strong>and</strong> small introns, such as worm <strong>and</strong>¯y. A major factor is <strong>the</strong> high signal-to-noise ratioÐcodingsequences comprise a large proportion <strong>of</strong> <strong>the</strong> <strong>genome</strong> <strong>and</strong> a largeproportion <strong>of</strong> each gene (about 50% for worm <strong>and</strong> ¯y), <strong>and</strong> exonsare relatively large.Gene identi®cation is more dif®cult in <strong>human</strong> DNA. The signalto-noiseratio is lower: coding sequences comprise only a few percent <strong>of</strong> <strong>the</strong> <strong>genome</strong> <strong>and</strong> an average <strong>of</strong> about 5% <strong>of</strong> each gene;internal exons are smaller than in worms; <strong>and</strong> genes appear to havemore alternative splicing. The challenge is underscored by <strong>the</strong> workon <strong>human</strong> chromosomes 21 <strong>and</strong> 22. Even with <strong>the</strong> availability <strong>of</strong>®nished sequence <strong>and</strong> intensive experimental work, <strong>the</strong> gene contentremains uncertain, with upper <strong>and</strong> lower estimates differing byas much as 30%. The initial report <strong>of</strong> <strong>the</strong> ®nished sequence <strong>of</strong>chromosome 22 (ref. 94) identi®ed 247 previously known genes,298 predicted genes con®rmed by sequence homology or ESTs <strong>and</strong>325 ab initio predictions without additional support. Many <strong>of</strong> <strong>the</strong>con®rmed predictions represented partial genes. In <strong>the</strong> past year,440 additional exons (10%) have been added to existing geneannotations by <strong>the</strong> chromosome 22 annotation group, although<strong>the</strong> number <strong>of</strong> con®rmed genes has increased by only 17 <strong>and</strong> somepreviously identi®ed gene predictions have been merged 286 .Before discussing <strong>the</strong> gene predictions for <strong>the</strong> <strong>human</strong> <strong>genome</strong>, itis useful to consider background issues, including previous estimates<strong>of</strong> <strong>the</strong> number <strong>of</strong> <strong>human</strong> genes, lessons learned from worms<strong>and</strong> ¯ies <strong>and</strong> <strong>the</strong> representativeness <strong>of</strong> currently `known' <strong>human</strong>genes.Previous estimates <strong>of</strong> <strong>human</strong> gene number. Although direct enumeration<strong>of</strong> <strong>human</strong> genes is only now becoming possible with <strong>the</strong> advent<strong>of</strong> <strong>the</strong> draft <strong>genome</strong> sequence, <strong>the</strong>re have been many attempts in <strong>the</strong>past quarter <strong>of</strong> a century to estimate <strong>the</strong> number <strong>of</strong> genes indirectly.Early estimates based on reassociation kinetics estimated <strong>the</strong> mRNAcomplexity <strong>of</strong> typical vertebrate tissues to be 10,000±20,000, <strong>and</strong>were extrapolated to suggest around 40,000 for <strong>the</strong> entire <strong>genome</strong> 287 .In <strong>the</strong> mid-1980s, Gilbert suggested that <strong>the</strong>re might be about100,000 genes, based on <strong>the</strong> approximate ratio <strong>of</strong> <strong>the</strong> size <strong>of</strong> a typicalgene (,3 ´ 10 4 bp) to <strong>the</strong> size <strong>of</strong> <strong>the</strong> <strong>genome</strong> (3 ´ 10 9 bp). Althoughthis was intended only as a back-<strong>of</strong>-<strong>the</strong>-envelope estimate, <strong>the</strong>pleasing roundness <strong>of</strong> <strong>the</strong> ®gure seems to have led to it beingwidely quoted <strong>and</strong> adopted in many textbooks. (W. Gilbert,personal communication; ref. 288). An estimate <strong>of</strong> 70,000±80,000genes was made by extrapolating from <strong>the</strong> number <strong>of</strong> CpG isl<strong>and</strong>s<strong>and</strong> <strong>the</strong> frequency <strong>of</strong> <strong>the</strong>ir association with known genes 129 .As <strong>human</strong> sequence information has accumulated, it has beenpossible to derive estimates on <strong>the</strong> basis <strong>of</strong> sampling techniques 289 .Such studies have sought to extrapolate from various types <strong>of</strong> data,including ESTs, mRNAs from known genes, cross-species <strong>genome</strong>comparisons <strong>and</strong> <strong>analysis</strong> <strong>of</strong> ®nished chromosomes. Estimatesbased on ESTs 290 have varied widely, from 35,000 (ref. 130) to120,000 genes 291 . Some <strong>of</strong> <strong>the</strong> discrepancy lies in differing estimates<strong>of</strong> <strong>the</strong> amount <strong>of</strong> contaminating genomic sequence in <strong>the</strong> ESTcollection <strong>and</strong> <strong>the</strong> extent to which multiple distinct ESTs correspondto a single gene. The most rigorous analyses 130 exclude asspurious any ESTs that appear only once in <strong>the</strong> data set <strong>and</strong> carefullycalibrate sensitivity <strong>and</strong> speci®city. Such calculations consistentlyproduce low estimates, in <strong>the</strong> region <strong>of</strong> 35,000.Comparison <strong>of</strong> whole-<strong>genome</strong> shotgun sequence from <strong>the</strong> puffer®shT. nigroviridis with <strong>the</strong> <strong>human</strong> <strong>genome</strong> 292 can be used toestimate <strong>the</strong> density <strong>of</strong> exons (detected as conserved sequences898 NATURE | VOL 409 | 15 FEBRUARY 2001 | www.nature.com© 2001 Macmillan Magazines Ltd
articlesbetween ®sh <strong>and</strong> <strong>human</strong>). These analyses also suggest around30,000 <strong>human</strong> genes.Extrapolations have also been made from <strong>the</strong> gene counts forchromosomes 21 <strong>and</strong> 22 (refs 93, 94), adjusted for differencesin gene densities on <strong>the</strong>se chromosomes, as inferred from ESTmapping. These estimates are between 30,500 <strong>and</strong> 35,500, dependingon <strong>the</strong> precise assumptions used 286 .Insights from invertebrates. The worm <strong>and</strong> ¯y <strong>genome</strong>s contain alarge proportion <strong>of</strong> novel genes (around 50% <strong>of</strong> worm genes <strong>and</strong>30% <strong>of</strong> ¯y genes), in <strong>the</strong> sense <strong>of</strong> showing no signi®cant similarity toorganisms outside <strong>the</strong>ir phylum 293±295 . Such genes may have beenpresent in <strong>the</strong> original eukaryotic ancestor, but were subsequentlylost from <strong>the</strong> lineages <strong>of</strong> <strong>the</strong> o<strong>the</strong>r eukaryotes for which sequence isavailable; <strong>the</strong>y may be rapidly diverging genes, so that it is dif®cult torecognize homologues solely on <strong>the</strong> basis <strong>of</strong> sequence; <strong>the</strong>y mayrepresent true innovations developed within <strong>the</strong> lineage; or <strong>the</strong>ymay represent acquisitions by horizontal transfer. Whatever <strong>the</strong>irorigin, <strong>the</strong>se genes tend to have different biological properties fromhighly conserved genes. In particular, <strong>the</strong>y tend to have low expressionlevels as assayed both by direct studies <strong>and</strong> by a paucity <strong>of</strong>corresponding ESTs, <strong>and</strong> are less likely to produce a visible phenotypein loss-<strong>of</strong>-function genetic experiments 294,296 .Gene prediction. Current gene prediction methods employ combinations<strong>of</strong> three basic approaches: direct evidence <strong>of</strong> transcriptionprovided by ESTs or mRNAs 297±299 ; indirect evidence based onsequence similarity to previously identi®ed genes <strong>and</strong> proteins 300,301 ;<strong>and</strong> ab initio recognition <strong>of</strong> groups <strong>of</strong> exons on <strong>the</strong> basis <strong>of</strong> hiddenMarkov models (HMMs) that combine statistical informationabout splice sites, coding bias <strong>and</strong> exon <strong>and</strong> intron lengths (forexample, Genscan 275 , Genie 302,303 <strong>and</strong> FGENES 304 ).The ®rst approach relies on direct experimental data, but issubject to artefacts arising from contaminating ESTs derived fromunspliced mRNAs, genomic DNA contamination <strong>and</strong> nongenictranscription (for example, from <strong>the</strong> promoter <strong>of</strong> a transposableelement). The ®rst two problems can be mitigated by comparingtranscripts with <strong>the</strong> genomic sequence <strong>and</strong> using only those thatshow clear evidence <strong>of</strong> splicing. This solution, however, tends todiscard evidence from genes with long terminal exons or singleexons. The second approach tends correctly to identify gene-derivedsequences, although some <strong>of</strong> <strong>the</strong>se may be pseudogenes. However, itobviously cannot identify truly novel genes that have no sequencesimilarity to known genes. The third approach would suf®ce alone ifone could accurately de®ne <strong>the</strong> features used by cells for generecognition, but our current underst<strong>and</strong>ing is insuf®cient to doso. The sensitivity <strong>and</strong> speci®city <strong>of</strong> ab initio predictions are greatlyaffected by <strong>the</strong> signal-to-noise ratio. Such methods are moreaccurate in <strong>the</strong> ¯y <strong>and</strong> worm than in <strong>human</strong>. In ¯y, ab initiomethods can correctly predict around 90% <strong>of</strong> individual exons <strong>and</strong>can correctly predict all coding exons <strong>of</strong> a gene in about 40% <strong>of</strong>cases 303 . For <strong>human</strong>, <strong>the</strong> comparable ®gures are only about 70% <strong>and</strong>20%, respectively 94,305 . These estimates may be optimistic, owing to<strong>the</strong> design <strong>of</strong> <strong>the</strong> tests used.In any collection <strong>of</strong> gene predictions, we can expect to see variouserrors. Some gene predictions may represent partial genes, because<strong>of</strong> inability to detect some portions <strong>of</strong> a gene (incomplete sensitivity)or to connect all <strong>the</strong> components <strong>of</strong> a gene (fragmentation);some may be gene fusions; <strong>and</strong> o<strong>the</strong>rs may be spurious predictions(incomplete speci®city) resulting from chance matches or pseudogenes.Creating an initial gene index. We set out to create an initialintegrated gene index (IGI) <strong>and</strong> an associated integrated proteinindex (IPI) for <strong>the</strong> <strong>human</strong> <strong>genome</strong>. We describe <strong>the</strong> results obtainedfrom a version <strong>of</strong> <strong>the</strong> draft <strong>genome</strong> sequence based on <strong>the</strong> sequencedata available in July 2000, to allow time for detailed <strong>analysis</strong> <strong>of</strong> <strong>the</strong>gene <strong>and</strong> protein content. The additional sequence data that hassince become available will affect <strong>the</strong> results quantitatively, but areunlikely to change <strong>the</strong> conclusions qualitatively.We began with predictions produced by <strong>the</strong> Ensembl system 306 .Ensembl starts with ab initio predictions produced by Genscan 275<strong>and</strong> <strong>the</strong>n attempts to con®rm <strong>the</strong>m by virtue <strong>of</strong> similarity toproteins, mRNAs, ESTs <strong>and</strong> protein motifs (contained in <strong>the</strong>Pfam database 307 ) from any organism. In particular, it con®rmsintrons if <strong>the</strong>y are bridged by matches <strong>and</strong> exons if <strong>the</strong>y are ¯ankedby con®rmed introns. It <strong>the</strong>n attempts to extend protein matchesusing <strong>the</strong> GeneWise computer program 308 . Because it requirescon®rmatory evidence to support each gene component, it frequentlyproduces partial gene predictions. In addition, when <strong>the</strong>reis evidence <strong>of</strong> alternative splicing, it reports multiple overlappingtranscripts. In total, Ensembl produced 35,500 gene predictionswith 44,860 transcripts.To reduce fragmentation, we next merged Ensembl-based genepredictions with overlapping gene predictions from ano<strong>the</strong>rprogram, Genie 302 . Genie starts with mRNA or EST matches <strong>and</strong>employs an HMM to extend <strong>the</strong>se matches by using ab initiostatistical approaches. To avoid fragmentation, it attempts to linkinformation from 59 <strong>and</strong> 39 ESTs from <strong>the</strong> same cDNA clone <strong>and</strong><strong>the</strong>reby to produce a complete coding sequence from an initial ATGto a stop codon. As a result, it may generate complete genes moreaccurately than Ensembl in cases where <strong>the</strong>re is extensive ESTsupport. (Genie also generates potential alternative transcripts,but we used only <strong>the</strong> longest transcript in each group.) Wemerged 15,437 Ensembl predictions into 9,526 clusters, <strong>and</strong> <strong>the</strong>longest transcript in each cluster (from ei<strong>the</strong>r Genie or Ensembl)was taken as <strong>the</strong> representative.Next, we merged <strong>the</strong>se results with known genes contained in <strong>the</strong>RefSeq (version <strong>of</strong> 29 September 2000), SWISSPROT (release 39.6<strong>of</strong> 30 August 2000) <strong>and</strong> TrEMBL databases (TrEMBL release 14.17<strong>of</strong> 1 October 2000, TrEMBL_new <strong>of</strong> 1 October 2000). Incorporating<strong>the</strong>se sequences gave rise to overlapping sequences because <strong>of</strong>alternative splice forms <strong>and</strong> partial sequences. To construct anonredundant set, we selected <strong>the</strong> longest sequence from eachoverlapping set by using direct protein comparison <strong>and</strong> by mapping<strong>the</strong> gene predictions back onto <strong>the</strong> <strong>genome</strong> to construct <strong>the</strong> overlappingsets. This may occasionally remove some close paralogues in<strong>the</strong> event that <strong>the</strong> correct genomic location has not yet beensequenced, but this number is expected to be small.Finally, we searched <strong>the</strong> set to eliminate any genes derived fromcontaminating bacterial sequences, recognized by virtue <strong>of</strong> nearidentity to known bacterial plasmids, transposons <strong>and</strong> chromosomalgenes. Although most instances <strong>of</strong> such contamination hadbeen removed in <strong>the</strong> assembly process, a few cases had slippedthrough <strong>and</strong> were removed at this stage.The process resulted in version 1 <strong>of</strong> <strong>the</strong> IGI (IGI.1). Thecomposition <strong>of</strong> <strong>the</strong> corresponding IPI.1 protein set, obtained bytranslating IGI.1, is given in Table 22. There are 31,778 proteinpredictions, with 14,882 from known genes, 4,057 predictions fromEnsembl merged with Genie <strong>and</strong> 12,839 predictions from Ensemblalone. The average lengths are 469 amino acids for <strong>the</strong> knownproteins, 443 amino acids for protein predictions from <strong>the</strong>Ensembl±Genie merge, <strong>and</strong> 187 amino acids for those fromEnsembl alone. (The smaller average size for <strong>the</strong> predictions fromEnsembl alone re¯ects its tendency to predict partial genes where<strong>the</strong>re is supporting evidence for only part <strong>of</strong> <strong>the</strong> gene; <strong>the</strong> remainder<strong>of</strong> <strong>the</strong> gene will <strong>of</strong>ten not be predicted at all, ra<strong>the</strong>r than included aspart <strong>of</strong> ano<strong>the</strong>r prediction. Accordingly, <strong>the</strong> smaller size cannot beused to estimate <strong>the</strong> rate <strong>of</strong> fragmentation in such predictions.)The set corresponds to fewer than 31,000 actual genes, becausesome genes are fragmented into more than one partial prediction<strong>and</strong> some predictions may be spurious or correspond to pseudogenes.As discussed below, our best estimate is that IGI.1 includesabout 24,500 true genes.Evaluation <strong>of</strong> IGI/IPI. We used several approaches to evaluate <strong>the</strong>sensitivity, speci®city <strong>and</strong> fragmentation <strong>of</strong> <strong>the</strong> IGI/IPI set.Comparison with `new' known genes. One approach was to examineNATURE | VOL 409 | 15 FEBRUARY 2001 | www.nature.com 899© 2001 Macmillan Magazines Ltd
articlesTable 22 Properties <strong>of</strong> <strong>the</strong> IGI/IPI <strong>human</strong> protein setSource Number Average length (amino acids) Matches to non<strong>human</strong>proteinsMatches to RIKEN mousecDNA setMatches to RIKEN mouse cDNAset but not to non<strong>human</strong> proteinsRefSeq/SwissProt/TrEMBL 14,882 469 12,708 (85%) 11,599 (78%) 776 (36%)Ensembl±Genie 4,057 443 2,989 (74%) 3,016 (74%) 498 (47%)Ensembl 12,839 187 81,126 (63%) 7,372 (57%) 1,449 (31%)Total 31,778 352 23,813 (75%) 219,873 (69%) 2,723 (34%)...................................................................................................................................................................................................................................................................................................................................................................The matches to non<strong>human</strong> proteins were obtained by using Smith-Waterman sequence alignment with an E-value threshold <strong>of</strong> 10 -3 <strong>and</strong> <strong>the</strong> matches to <strong>the</strong> RIKEN mouse cDNAs by using TBLASTN with anE-value threshold <strong>of</strong> 10 -6 . The last column shows that a signi®cant number <strong>of</strong> <strong>the</strong> IGI members that do not have non<strong>human</strong> protein matches do match sequences in <strong>the</strong> RIKEN mouse cDNA set, suggestingthat both <strong>the</strong> IGI <strong>and</strong> <strong>the</strong> RIKEN sets contain a signi®cant number <strong>of</strong> novel proteins.newly discovered genes arising from independent work that werenot used in our gene prediction effort. We identi®ed 31 such genes:22 recent entries to RefSeq <strong>and</strong> 9 from <strong>the</strong> Sanger Centre's geneidenti®cation program on chromosome X. Of <strong>the</strong>se, 28 werecontained in <strong>the</strong> draft <strong>genome</strong> sequence <strong>and</strong> 19 were representedin <strong>the</strong> IGI/IPI. This suggests that <strong>the</strong> gene prediction process has asensitivity <strong>of</strong> about 68% (19/28) for <strong>the</strong> detection <strong>of</strong> novel genes in<strong>the</strong> draft <strong>genome</strong> sequence <strong>and</strong> that <strong>the</strong> current IGI contains about61% (19/31) <strong>of</strong> novel genes in <strong>the</strong> <strong>human</strong> <strong>genome</strong>. On average, 79%<strong>of</strong> each gene was detected. The extent <strong>of</strong> fragmentation could also beestimated: 14 <strong>of</strong> <strong>the</strong> genes corresponded to a single prediction in <strong>the</strong>IGI/IPI, three genes corresponded to two predictions, one gene tothree predictions <strong>and</strong> one gene to four predictions. This correspondsto a fragmentation rate <strong>of</strong> about 1.4 gene predictions pertrue gene.Comparison with RIKEN mouse cDNAs. In a less direct but largerscaleapproach, we compared <strong>the</strong> IGI gene set to a set <strong>of</strong> mousecDNAs sequenced by <strong>the</strong> Genome Exploration Group <strong>of</strong> <strong>the</strong> RIKENGenomic Sciences Center 309 . This set <strong>of</strong> 15,294 cDNAs, subjected t<strong>of</strong>ull-insert <strong>sequencing</strong>, was enriched for novel genes by selectingcDNAs with novel 39 ends from a collection <strong>of</strong> nearly one millionESTs from diverse tissues <strong>and</strong> developmental timepoints. Wedetermined <strong>the</strong> proportion <strong>of</strong> <strong>the</strong> RIKEN cDNAs that showedsequence similarity to <strong>the</strong> draft <strong>genome</strong> sequence <strong>and</strong> <strong>the</strong> proportionthat showed sequence similarity to <strong>the</strong> IGI/IPI. Around 81% <strong>of</strong><strong>the</strong> genes in <strong>the</strong> RIKEN mouse set showed sequence similarity to <strong>the</strong><strong>human</strong> <strong>genome</strong> sequence, whereas 69% showed sequence similarityto <strong>the</strong> IGI/IPI. This suggests a sensitivity <strong>of</strong> 85% (69/81). This ishigher than <strong>the</strong> sensitivity estimate above, perhaps because some <strong>of</strong><strong>the</strong> matches may be due to paralogues ra<strong>the</strong>r than orthologues. It isconsistent with <strong>the</strong> IGI/IPI representing a substantial fraction <strong>of</strong> <strong>the</strong><strong>human</strong> proteome.Conversely, 69% (22,013/31,898) <strong>of</strong> <strong>the</strong> IGI matches <strong>the</strong> RIKENcDNA set. Table 22 shows <strong>the</strong> breakdown <strong>of</strong> <strong>the</strong>se matches among<strong>the</strong> different components <strong>of</strong> <strong>the</strong> IGI. This is lower than <strong>the</strong>proportion <strong>of</strong> matches among known proteins, although this isexpected because known proteins tend to be more highly conserved(see above) <strong>and</strong> because <strong>the</strong> predictions are on average shorter thanknown proteins. Table 22 also shows <strong>the</strong> numbers <strong>of</strong> matches to <strong>the</strong>RIKEN cDNAs among IGI members that do not match knownproteins. The results indicate that both <strong>the</strong> IGI <strong>and</strong> <strong>the</strong> RIKEN setcontain a signi®cant number <strong>of</strong> genes that are novel in <strong>the</strong> sense <strong>of</strong>not having known protein homologues.Comparison with genes on chromosome 22. We also compared <strong>the</strong>IGI/IPI with <strong>the</strong> gene annotations on chromosome 22, to assess <strong>the</strong>proportion <strong>of</strong> gene predictions corresponding to pseudogenes <strong>and</strong> toestimate <strong>the</strong> rate <strong>of</strong> overprediction. We compared 477 IGI genepredictions to 539 con®rmed genes <strong>and</strong> 133 pseudogenes on chromosome22 (with <strong>the</strong> immunoglobulin lambda locus excluded owingto its highly atypical gene structure). Of <strong>the</strong>se, 43 hit 36 annotatedpseudogenes. This suggests that 9% <strong>of</strong> <strong>the</strong> IGI predictions maycorrespond to pseudogenes <strong>and</strong> also suggests a fragmentation rate<strong>of</strong> 1.2 gene predictions per gene. Of <strong>the</strong> remaining hits, 63 did notoverlap with any current annotations. This would suggest a rate <strong>of</strong>spurious predictions <strong>of</strong> about 13% (63/477), although <strong>the</strong> true rateis likely to be much lower because many <strong>of</strong> <strong>the</strong>se may correspond tounannotated portions <strong>of</strong> existing gene predictions or to currentlyunannotated genes (<strong>of</strong> which <strong>the</strong>re are estimated to be about 100 onthis chromosome 94 ).Chromosomal distribution. Finally, we examined <strong>the</strong> chromosomaldistribution <strong>of</strong> <strong>the</strong> IGI gene set. The average density <strong>of</strong> genepredictions is 11.1 per Mb across <strong>the</strong> <strong>genome</strong>, with <strong>the</strong> extremesbeing chromosome 19 at 26.8 per Mb <strong>and</strong> chromosome Yat 6.4 perMb. It is likely that a signi®cant number <strong>of</strong> <strong>the</strong> predictions onchromosome Y are pseudogenes (this chromosome is known to berich in pseudogenes) <strong>and</strong> thus that <strong>the</strong> density for chromosome Y isan overestimate. The density <strong>of</strong> both genes <strong>and</strong> Alus on chromosome19 is much higher than expected, even accounting for <strong>the</strong> highGC content <strong>of</strong> <strong>the</strong> chromosome; this supports <strong>the</strong> idea that Aludensity is more closely correlated with gene density than with GCcontent itself.Summary. We are clearly still some way from having a complete set<strong>of</strong> <strong>human</strong> genes. The current IGI contains signi®cant numbers <strong>of</strong>partial genes, fragmented <strong>and</strong> fused genes, pseudogenes <strong>and</strong> spuriouspredictions, <strong>and</strong> it also lacks signi®cant numbers <strong>of</strong> true genes.This re¯ects <strong>the</strong> current state <strong>of</strong> gene prediction methods invertebrates even in ®nished sequence, as well as <strong>the</strong> additionalchallenges related to <strong>the</strong> current state <strong>of</strong> <strong>the</strong> draft <strong>genome</strong> sequence.None<strong>the</strong>less, <strong>the</strong> gene predictions provide a valuable starting pointfor a wide range <strong>of</strong> biological studies <strong>and</strong> will be rapidly re®ned in<strong>the</strong> coming year.The <strong>analysis</strong> above allows us to estimate <strong>the</strong> number <strong>of</strong> distinctgenes in <strong>the</strong> IGI, as well as <strong>the</strong> number <strong>of</strong> genes in <strong>the</strong> <strong>human</strong><strong>genome</strong>. The IGI set contains about 15,000 known genes <strong>and</strong> about17,000 gene predictions. Assuming that <strong>the</strong> gene predictions aresubject to a rate <strong>of</strong> overprediction (spurious predictions <strong>and</strong>pseudogenes) <strong>of</strong> 20% <strong>and</strong> a rate <strong>of</strong> fragmentation <strong>of</strong> 1.4, <strong>the</strong> IGIwould be estimated to contain about 24,500 actual <strong>human</strong> genes.Assuming that <strong>the</strong> gene predictions contain about 60% <strong>of</strong>previously unknown <strong>human</strong> genes, <strong>the</strong> total number <strong>of</strong> genes in<strong>the</strong> <strong>human</strong> <strong>genome</strong> would be estimated to be about 31,000. This isconsistent with most recent estimates based on sampling, whichsuggest a gene number <strong>of</strong> 30,000±35,000. If <strong>the</strong>re are 30,000±35,000genes, with an average coding length <strong>of</strong> about 1,400 bp <strong>and</strong> averagegenomic extent <strong>of</strong> about 30 kb, <strong>the</strong>n about 1.5% <strong>of</strong> <strong>the</strong> <strong>human</strong><strong>genome</strong> would consist <strong>of</strong> coding sequence <strong>and</strong> one-third <strong>of</strong> <strong>the</strong><strong>genome</strong> would be transcribed in genes.The IGI/IPI was constructed primarily on <strong>the</strong> basis <strong>of</strong> genepredictions from Ensembl. However, we also generated an exp<strong>and</strong>edset (IGI+) by including additional predictions from two o<strong>the</strong>r geneprediction programs, Genie <strong>and</strong> GenomeScan (C. Burge, personalcommunication). These predictions were not included in <strong>the</strong> coreIGI set, because <strong>of</strong> <strong>the</strong> concern that each additional set will providediminishing returns in identifying true genes while contributing itsown false positives (increased sensitivity at <strong>the</strong> expense <strong>of</strong> speci®city).Genie produced an additional 2,837 gene predictions notoverlapping <strong>the</strong> IGI, <strong>and</strong> GenomeScan produced 6,534 such genepredictions. If all <strong>of</strong> <strong>the</strong>se gene predictions were included in <strong>the</strong> IGI,<strong>the</strong> number <strong>of</strong> <strong>the</strong> 31 new `known' genes (see above) contained in<strong>the</strong> IGI would rise from 19 to 24. This would amount to an increase<strong>of</strong> about 26% in sensitivity, at <strong>the</strong> expense <strong>of</strong> increasing <strong>the</strong> number<strong>of</strong> predicted genes (excluding knowns) by 55%. Allowing a higher900 © 2001 Macmillan Magazines Ltd NATURE | VOL 409 | 15 FEBRUARY 2001 | www.nature.com
articlesoverprediction rate <strong>of</strong> 30% for gene predictions in this exp<strong>and</strong>ed set,<strong>the</strong> <strong>analysis</strong> above suggests that IGI+ set contains about 28,000 truegenes <strong>and</strong> yields an estimate <strong>of</strong> about 32,000 <strong>human</strong> genes. We areinvestigating ways to ®lter <strong>the</strong> exp<strong>and</strong>ed set, to produce an IGI with<strong>the</strong> advantage <strong>of</strong> <strong>the</strong> increased sensitivity resulting from combiningmultiple gene prediction programs without <strong>the</strong> corresponding loss<strong>of</strong> speci®city. Meanwhile, <strong>the</strong> IGI+ set can be used by researcherssearching for genes that cannot be found in <strong>the</strong> IGI.Some classes <strong>of</strong> genes may have been missed by all <strong>of</strong> <strong>the</strong> gene-®nding methods. Genes could be missed if <strong>the</strong>y are expressed at lowlevels or in rare tissues (being absent or very under-represented inEST <strong>and</strong> mRNA databases) <strong>and</strong> have sequences that evolve rapidly(being hard to detect by protein homology <strong>and</strong> <strong>genome</strong> comparison).Both <strong>the</strong> worm <strong>and</strong> ¯y gene sets contain a substantial number<strong>of</strong> such genes 293,294 . Single-exon genes encoding small proteins mayalso have been missed, because EST evidence that supports <strong>the</strong>mcannot be distinguished from genomic contamination in <strong>the</strong> ESTdataset <strong>and</strong> because homology may be hard to detect for smallproteins 310 .The <strong>human</strong> thus appears to have only about twice as many genesas worm or ¯y. However, <strong>human</strong> genes differ in important respectsfrom those in worm <strong>and</strong> ¯y. They are spread out over much largerregions <strong>of</strong> genomic DNA, <strong>and</strong> <strong>the</strong>y are used to construct morealternative transcripts. This may result in perhaps ®ve times as manyprimary protein products in <strong>the</strong> <strong>human</strong> as in <strong>the</strong> worm or ¯y.The predicted gene <strong>and</strong> protein sets described here are clearly farfrom ®nal. None<strong>the</strong>less, <strong>the</strong>y provide a valuable starting point forexperimental <strong>and</strong> computational research. The predictions willimprove progressively as <strong>the</strong> sequence is ®nished, as fur<strong>the</strong>rcon®rmatory evidence becomes available (particularly fromo<strong>the</strong>r vertebrate <strong>genome</strong> sequences, such as those <strong>of</strong> mouse <strong>and</strong>T. nigroviridis), <strong>and</strong> as computational methods improve. We intendto create <strong>and</strong> release updated versions <strong>of</strong> <strong>the</strong> IGI <strong>and</strong> IPI regularly,until <strong>the</strong>y converge to a ®nal accurate list <strong>of</strong> every <strong>human</strong> gene. Thegene predictions will be linked to RefSeq, HUGO <strong>and</strong> SWISSPROTidenti®ers where available, <strong>and</strong> tracking identi®ers between versionswill be included, so that individual genes under study can be tracedforwards as <strong>the</strong> <strong>human</strong> sequence is completed.Comparative proteome <strong>analysis</strong>Knowledge <strong>of</strong> <strong>the</strong> <strong>human</strong> proteome will provide unprecedentedopportunities for studies <strong>of</strong> <strong>human</strong> gene function. Often clues willbe provided by sequence similarity with proteins <strong>of</strong> known functionin model organisms. Such initial observations must <strong>the</strong>n be followedup by detailed studies to establish <strong>the</strong> actual function <strong>of</strong> <strong>the</strong>semolecules in <strong>human</strong>s.For example, 35 proteins are known to be involved in <strong>the</strong> vacuolarprotein-sorting machinery in yeast. Human genes encoding homologuescan be found in <strong>the</strong> draft <strong>human</strong> sequence for 34 <strong>of</strong> <strong>the</strong>seyeast proteins, but precise relationships are not always clear. In ninecases <strong>the</strong>re appears to be a single clear <strong>human</strong> orthologue (a genethat arose as a consequence <strong>of</strong> speciation); in 12 cases <strong>the</strong>re arematches to a family <strong>of</strong> <strong>human</strong> paralogues (genes that arose owing tointra-<strong>genome</strong> duplication); <strong>and</strong> in 13 cases <strong>the</strong>re are matchesto speci®c protein domains 311±314 . Hundreds <strong>of</strong> similar storiesemerge from <strong>the</strong> draft sequence, but each merits a detailed interpretationin context. To treat <strong>the</strong>se subjects properly, <strong>the</strong>re will bemany following studies, <strong>the</strong> ®rst <strong>of</strong> which appear in accompanyingpapers 315±323 .Here, we aim to take a more global perspective on <strong>the</strong> content <strong>of</strong><strong>the</strong> <strong>human</strong> proteome by comparing it with <strong>the</strong> proteomes <strong>of</strong> yeast,worm, ¯y <strong>and</strong> mustard weed. Such comparisons shed useful light on<strong>the</strong> commonalities <strong>and</strong> differences among <strong>the</strong>se eukaryotes 294,324,325 .The <strong>analysis</strong> is necessarily preliminary, because <strong>of</strong> <strong>the</strong> imperfectnature <strong>of</strong> <strong>the</strong> <strong>human</strong> sequence, uncertainties in <strong>the</strong> gene <strong>and</strong> proteinsets for all <strong>of</strong> <strong>the</strong> multicellular organisms considered <strong>and</strong> ourincomplete knowledge <strong>of</strong> protein structures. None<strong>the</strong>less, somegeneral patterns emerge. These include insights into fundamentalmechanisms that create functional diversity, including invention <strong>of</strong>protein domains, expansion <strong>of</strong> protein <strong>and</strong> domain families, evolution<strong>of</strong> new protein architectures <strong>and</strong> horizontal transfer <strong>of</strong> genes.O<strong>the</strong>r mechanisms, such as alternative splicing, post-translationalmodi®cation <strong>and</strong> complex regulatory networks, are also crucial ingenerating diversity but are much harder to discern from <strong>the</strong>primary sequence. We will not attempt to consider <strong>the</strong> effects <strong>of</strong>alternative splicing on proteins; we will consider only a single spliceform from each gene in <strong>the</strong> various organisms, even when multiplesplice forms are known.Functional <strong>and</strong> evolutionary classi®cation. We began by classifying<strong>the</strong> <strong>human</strong> proteome on <strong>the</strong> basis <strong>of</strong> functional categories <strong>and</strong>evolutionary conservation. We used <strong>the</strong> InterPro annotation protocolto identify conserved biochemical <strong>and</strong> cellular processes.InterPro is a tool for combining sequence-pattern informationfrom four databases. The ®rst two databases (PRINTS 326 <strong>and</strong>Prosite 327 ) primarily contain information about motifs correspondingto speci®c family subtypes, such as type II receptor tyrosinekinases (RTK-II) in particular or tyrosine kinases in general. Thesecond two databases (Pfam 307 <strong>and</strong> Prosite Pro®le 327 ) containinformation (in <strong>the</strong> form <strong>of</strong> pro®les or HMMs) about families <strong>of</strong>structural domainsÐfor example, protein kinase domains. Inter-Pro integrates <strong>the</strong> motif <strong>and</strong> domain assignments into a hierarchicalclassi®cation system; so a protein might be classi®ed at <strong>the</strong> mostdetailed level as being an RTK-II, at a more general level as being akinase speci®c for tyrosine, <strong>and</strong> at a still more general level asbeing a protein kinase. The complete hierarchy <strong>of</strong> InterPro entriesis described at http://www.ebi.ac.uk/interpro/. We collapsed <strong>the</strong>InterPro entries into 12 broad categories, each re¯ecting a set <strong>of</strong>cellular functions.The InterPro families are partly <strong>the</strong> product <strong>of</strong> <strong>human</strong> judgement<strong>and</strong> re¯ect <strong>the</strong> current state <strong>of</strong> biological <strong>and</strong> evolutionary knowledge.The system is a valuable way to gain insight into largecollections <strong>of</strong> proteins, but not all proteins can be classi®ed atpresent. The proportions <strong>of</strong> <strong>the</strong> yeast, worm, ¯y <strong>and</strong> mustard weedprotein sets that are assigned to at least one InterPro family is, foreach organism, about 50% (Table 23; refs 307, 326, 327).About 40% <strong>of</strong> <strong>the</strong> predicted <strong>human</strong> proteins in <strong>the</strong> IPI could beassigned to InterPro entries <strong>and</strong> functional categories. On <strong>the</strong> basis<strong>of</strong> <strong>the</strong>se assignments, we could compare organisms according to <strong>the</strong>number <strong>of</strong> proteins in each category (Fig. 37). Compared with <strong>the</strong>two invertebrates, <strong>human</strong>s appear to have many proteins involvedin cytoskeleton, defence <strong>and</strong> immunity, <strong>and</strong> transcription <strong>and</strong>translation. These expansions are clearly related to aspects <strong>of</strong>vertebrate physiology. Humans also have many more proteins thatare classi®ed as falling into more than one functional category (426in <strong>human</strong> versus 80 in worm <strong>and</strong> 57 in ¯y, data not shown).Interestingly, 32% <strong>of</strong> <strong>the</strong>se are transmembrane receptors.We obtained fur<strong>the</strong>r insight into <strong>the</strong> evolutionary conservation <strong>of</strong>proteins by comparing each sequence to <strong>the</strong> complete nonredundantdatabase <strong>of</strong> protein sequences maintained at NCBI, using <strong>the</strong>BLASTP computer program 328 <strong>and</strong> <strong>the</strong>n breaking down <strong>the</strong> matchesaccording to organismal taxonomy (Fig. 38). Overall, 74% <strong>of</strong> <strong>the</strong>proteins had signi®cant matches to known proteins.Such classi®cations are based on <strong>the</strong> presence <strong>of</strong> clearly detectablehomologues in existing databases. Many <strong>of</strong> <strong>the</strong>se genes have surelyevolved from genes that were present in common ancestors but havesince diverged substantially. Indeed, one can detect more distantrelationships by using sensitive computer programs that can recognizeweakly conserved features. Using PSI-BLAST, we can recognizeprobable nonvertebrate homologues for about 45% <strong>of</strong> <strong>the</strong> `vertebrate-speci®c'set. None<strong>the</strong>less, <strong>the</strong> classi®cation is useful for gaininginsights into <strong>the</strong> commonalities <strong>and</strong> differences among <strong>the</strong>proteomes <strong>of</strong> different organisms.Probable horizontal transfer. An interesting category is a set <strong>of</strong> 223proteins that have signi®cant similarity to proteins from bacteria,but no comparable similarity to proteins from yeast, worm, ¯y <strong>and</strong>NATURE | VOL 409 | 15 FEBRUARY 2001 | www.nature.com 901© 2001 Macmillan Magazines Ltd
articlesTable 23 Properties <strong>of</strong> <strong>genome</strong> <strong>and</strong> proteome in essentially completed eukaryotic proteomesHuman Fly Worm Yeast Mustard weedNumber <strong>of</strong> identi®ed genes ,32,000* 13,338 18,266 6,144 25,706% with InterPro matches 51 56 50 50 52Number <strong>of</strong> annotated domain families 1,262 1,035 1,014 851 1,010Number <strong>of</strong> InterPro entries per gene 0.53 0.84 0.63 0.6 0.62Number <strong>of</strong> distinct domain architectures 1,695 1,036 1,018 310 ±Percentage <strong>of</strong> 1-1-1-1 1.40 4.20 3.10 9.20 ±% Signal sequences 20 20 24 11 ±% Transmembrane proteins 20 25 28 15 ±% Repeat-containing 10 11 9 5 ±% Coiled-coil 11 13 10 9 ±...................................................................................................................................................................................................................................................................................................................................................................The numbers <strong>of</strong> distinct architectures were calculated using SMART 339 <strong>and</strong> <strong>the</strong> percentages <strong>of</strong> repeat-containing proteins were estimated using Prospero 452 <strong>and</strong> a P-value threshold <strong>of</strong> 10 -5 . The protein setsused in <strong>the</strong> <strong>analysis</strong> were taken from http://www.ebi.ac.uk/proteome/ for yeast, worm <strong>and</strong> ¯y. The proteins from mustard weed were taken from <strong>the</strong> TAIR website (http:// www.arabidopsis.org/) on 5September 2000. The protein set was searched against <strong>the</strong> InterPro database (http://www.ebi.ac.uk/interpro/) using <strong>the</strong> InterProscan s<strong>of</strong>tware. Comparison <strong>of</strong> protein sequences with <strong>the</strong> InterProdatabase allows prediction <strong>of</strong> protein families, domain <strong>and</strong> repeat families <strong>and</strong> sequence motifs. The searches used Pfam release 5.2 307 , Prints release 26.1 326 , Prosite release 16 327 <strong>and</strong> Prosite preliminarypro®les. InterPro <strong>analysis</strong> results are available as Supplementary Information. The fraction <strong>of</strong> 1-1-1-1 is <strong>the</strong> percentage <strong>of</strong> <strong>the</strong> <strong>genome</strong> that falls into orthologous groups composed <strong>of</strong> only one member eachin <strong>human</strong>, ¯y, worm <strong>and</strong> yeast.* The gene number for <strong>the</strong> <strong>human</strong> is still uncertain (see text). Table is based on 31,778 known genes <strong>and</strong> gene predictions.mustard weed, or indeed from any o<strong>the</strong>r (nonvertebrate) eukaryote.These sequences should not represent bacterial contamination in<strong>the</strong> draft <strong>human</strong> sequence, because we ®ltered <strong>the</strong> sequence toeliminate sequences that were essentially identical to known bacterialplasmid, transposon or chromosomal DNA (such as <strong>the</strong> hoststrains for <strong>the</strong> large-insert clones). To investigate whe<strong>the</strong>r <strong>the</strong>se weregenuine <strong>human</strong> sequences, we designed PCR primers for 35 <strong>of</strong> <strong>the</strong>segenes <strong>and</strong> con®rmed that most could be readily detected directly in<strong>human</strong> genomic DNA (Table 24). Orthologues <strong>of</strong> many <strong>of</strong> <strong>the</strong>segenes have also been detected in o<strong>the</strong>r vertebrates (Table 24).A more detailed computational <strong>analysis</strong> indicated that at least 113<strong>of</strong> <strong>the</strong>se genes are widespread among bacteria, but, among eukaryotes,appear to be present only in vertebrates. It is possible that <strong>the</strong>genes encoding <strong>the</strong>se proteins were present in both early prokaryotes<strong>and</strong> eukaryotes, but were lost in each <strong>of</strong> <strong>the</strong> lineages <strong>of</strong> yeast,worm, ¯y, mustard weed <strong>and</strong>, possibly, from o<strong>the</strong>r nonvertebrateeukaryote lineages. A more parsimonious explanation is that <strong>the</strong>segenes entered <strong>the</strong> vertebrate (or prevertebrate) lineage by horizontaltransfer from bacteria. Many <strong>of</strong> <strong>the</strong>se genes contain introns, whichpresumably were acquired after <strong>the</strong> putative horizontal transferevent. Similar observations indicating probable lineage-speci®chorizontal gene transfers, as well as intron insertion in <strong>the</strong> acquiredgenes, have been made in <strong>the</strong> worm <strong>genome</strong> 329 .Number <strong>of</strong> proteins5,0004,5004,0003,5003,0002,5002,0001,500YeastMustardweedWormFlyHumanWe cannot formally exclude <strong>the</strong> possibility that gene transferoccurred in <strong>the</strong> opposite directionÐthat is, that <strong>the</strong> genes wereinvented in <strong>the</strong> vertebrate lineage <strong>and</strong> <strong>the</strong>n transferred to bacteria.However, we consider this less likely. Under this scenario, <strong>the</strong> broaddistribution <strong>of</strong> <strong>the</strong>se genes among bacteria would require extensivehorizontal dissemination after <strong>the</strong>ir initial acquisition. In addition,<strong>the</strong> functional repertoire <strong>of</strong> <strong>the</strong>se genes, which largely encodeintracellular enzymes (Table 24), is uncharacteristic <strong>of</strong> vertebratespeci®cevolutionary innovations (which appear to be primarilyextracellular proteins; see below).We did not identify a strongly preferred bacterial source for <strong>the</strong>putative horizontally transferred genes, indicating <strong>the</strong> likelihood<strong>of</strong> multiple independent gene transfers from different bacteria(Table 24). Notably, several <strong>of</strong> <strong>the</strong> probable recent acquisitionshave established (or likely) roles in metabolism <strong>of</strong> xenobiotics orstress response. These include several hydrolases <strong>of</strong> differentspeci®cities, including epoxide hydrolase, <strong>and</strong> several dehydrogenases(Table 24). Of particular interest is <strong>the</strong> presence <strong>of</strong> twoparalogues <strong>of</strong> monoamine oxidase (MAO), an enzyme <strong>of</strong> <strong>the</strong>mitochondrial outer membrane that is central in <strong>the</strong> metabolism<strong>of</strong> neuromediators <strong>and</strong> is a target <strong>of</strong> important psychiatricdrugs 330±333 . This example shows that at least some <strong>of</strong> <strong>the</strong> genesthought to be horizontally transferred into <strong>the</strong> vertebrate lineageappear to be involved in important physiological functions <strong>and</strong> soprobably have been ®xed <strong>and</strong> maintained during evolution becauseVertebrate only22%Prokaryotesonly
articles<strong>of</strong> <strong>the</strong> increased selective advantage(s) <strong>the</strong>y provide.Genes shared with ¯y, worm <strong>and</strong> yeast. IPI.1 contains apparenthomologues <strong>of</strong> 61% <strong>of</strong> <strong>the</strong> ¯y proteome, 43% <strong>of</strong> <strong>the</strong> wormproteome <strong>and</strong> 46% <strong>of</strong> <strong>the</strong> yeast proteome. We next considered <strong>the</strong>groups <strong>of</strong> proteins containing likely orthologues <strong>and</strong> paralogues(genes that arose from intra<strong>genome</strong> duplication) in <strong>human</strong>, ¯y,worm <strong>and</strong> yeast.Brie¯y, we performed all-against-all sequence comparison 334 for<strong>the</strong> combined protein sets <strong>of</strong> <strong>human</strong>, yeast, ¯y <strong>and</strong> worm. Pairs <strong>of</strong>sequences that were one ano<strong>the</strong>r's best matches in <strong>the</strong>ir respective<strong>genome</strong>s were considered to be potential orthologues. These were<strong>the</strong>n used to identify orthologous groups across three organisms 335 .Recent species-speci®c paralogues were de®ned by using <strong>the</strong> allagainst-allsequence comparison to cluster <strong>the</strong> protein set for eachorganism. For each sequence found in an orthologous group, <strong>the</strong>recent paralogues were de®ned to be <strong>the</strong> largest species-speci®ccluster including it. The set <strong>of</strong> paralogues may be in¯ated byunrecognized splice variants <strong>and</strong> by fragmentation.We identi®ed 1,308 groups <strong>of</strong> proteins, each containing at leastone predicted orthologue in each species <strong>and</strong> many containingadditional paralogues. The 1,308 groups contained 3,129 <strong>human</strong>proteins, 1,445 ¯y proteins, 1,503 worm proteins <strong>and</strong> 1,441 yeastproteins. These 1,308 groups represent a conserved core <strong>of</strong> proteinsthat are mostly responsible for <strong>the</strong> basic `housekeeping' functions <strong>of</strong><strong>the</strong> cell, including metabolism, DNA replication <strong>and</strong> repair, <strong>and</strong>translation.In 564 <strong>of</strong> <strong>the</strong> 1,308 groups, one orthologue (<strong>and</strong> no additionalparalogues) could be unambiguously assigned for each <strong>of</strong> <strong>human</strong>,¯y, worm <strong>and</strong> yeast. These groups will be referred to as 1-1-1-1groups. More than half (305) <strong>of</strong> <strong>the</strong>se groups could be assigned to<strong>the</strong> functional categories shown in Fig. 37. Within <strong>the</strong>se functionalcategories, <strong>the</strong> numbers <strong>of</strong> groups containing single orthologuesin each <strong>of</strong> <strong>the</strong> four proteomes was: 19 for cellular processes, 66for metabolism, 31 for DNA replication <strong>and</strong> modi®cation, 106for transcription/translation, 13 for intracellular signalling, 24for protein folding <strong>and</strong> degradation, 38 for transport, 5 forTable 24 Probable vertebrate-speci®c acquisitions <strong>of</strong> bacterial genesHuman protein (accession) Predicted function Known orthologues ino<strong>the</strong>r vertebratesBacterial homologuesHuman origin con®rmed byPCRRangeBest hitAAG01853.1FormiminotransferasePig, rat, chicken Thermotoga, Thermoplasma, Thermotoga maritimaYescyclodeaminaseMethylobacterCAB81772.1 Na/glucose cotransporter Rodents, ungulates Most bacteria Vibrio parahaemolyticus Yes (CAB81772, AAC41747.1)AAB59448.1NT* (AAB59448.1,AAA36608.1)AAA36608.1AAC41747.1BAA1143.21 Epoxide hydrolase (a/b-hydrolase) Mouse, Danio, fugu Most bacteria Pseudomonas aeruginosa Yes®shCAB59628.1 Protein-methionine-S-oxide reductase Cow Most bacteria Synechocystis sp. YesBAA91273.1Hypertension-associated protein SA/ Mouse, rat, cow Most bacteria Bacillus halodurans NT*acetate-CoA ligaseCAA75608.1Glucose-6-phosphate transporter/ Mouse, rat Most bacteria Chlamydophila pneumoniae Yesglycogen storage disease type 1bproteinAAA59548.1 Monoamine oxidase Cow, rat, salmon Most bacteria Mycobacterium tuberculosis YesAAB27229.1AAF12736.1Acyl-CoA dehydrogenase, Mouse, rat, pig Most bacteria P. aeruginosa Yesmitochondrial proteinAAA51565.1IGI_M1_ctg19153_147 Aldose-1-epimerase Pig (also found in Streptomyces, Bacillus Streptomyces coelicolor Yesplants)BAA92632.1Predicted carboxylase (C-terminal None Streptomyces, Rhizobium, S. coelicolor Yesdomain, N-terminal domain unique)BacillusBAA34458.1 Uncharacterized protein None Gamma-proteobacteria Escherichia coli YesAAF24044.1 Uncharacterized protein None Most bacteria T. maritima YesBAA34458.1 b-Lactamase superfamily hydrolase None Most bacteria Synechocystis sp. YesBAA91839.1Oxidoreductase (Rossmann fold)fused to a six-transmembrane proteinNone (several <strong>human</strong>paralogues <strong>of</strong> bothparts)Actinomycetes, Leptospira;more distant homologues ino<strong>the</strong>r bacteriaS. coelicolor YesBAA92073.1 Oxidoreductase (Rossmann fold) None Synechocystis, Pseudomonas Synechocystis sp. YesBAA92133.1 a/b-hydrolase None Rickettsia; more distant Rickettsia prowazekiiYeshomologues in o<strong>the</strong>r bacteriaBAA91174.1 ADP-ribosylglycohydrolase None Streptomyces, Aquifex,S. coelicolor YesArchaeoglobus (archaeon),E. coliAAA60043.1Thymidine phosporylase/endo<strong>the</strong>lial None Most bacteria Bacillus stearo<strong>the</strong>rmophilus Yescell growth factorBAA86552.1Ribosomal protein S6-glutamic acid None Most bacteria <strong>and</strong> archaea Haemophilus in¯uenzae YesligaseIGI_M1_ctg12741_7 Ribosomal protein S6-glutamic acid None Most bacteria <strong>and</strong> archaea H. in¯uenzae Yesligase (paralogue <strong>of</strong> <strong>the</strong> above)IGI_M1_ctg13238_61 Hydratase None Synechocystis,Synechocystis sp.YesSphingomonasIGI_M1_ctg13305_116 Homologue <strong>of</strong> histone macro-2A C- None (several <strong>human</strong> Thermotoga, Alcaligenes, E. T. maritima Yesterminal domain, predictedphosphataseparalogues, RNAviruses)coli, more distant homologuesin o<strong>the</strong>r bacteriaIGI_M1_ctg14420_10 Sugar transporter None Most bacteria Synechocystis sp. YesIGI_M1_ctg16010_18 Predicted metal-binding protein None Most bacteria Borrelia burgdorferi YesIGI_M1_ctg16227_58 Pseudouridine synthase None Most bacteria Zymomonas mobilis YesIGI_M1_ctg25107_24 Surfactin syn<strong>the</strong>tase domain None Gram-positive bacteria, Bacillus subtilisYesActinomycetes,Cyanobacteria...................................................................................................................................................................................................................................................................................................................................................................* NT, not tested.Representative genes con®rmed by PCR to be present in <strong>the</strong> <strong>human</strong> <strong>genome</strong>. The similarity to a bacterial homologue was considered to be `signi®cantly' greater than that to eukaryotic homologues if <strong>the</strong>difference in alignment scores returned by BLASTP was greater than 30 bits (,9 orders <strong>of</strong> magnitude in terms <strong>of</strong> E-value). A complete, classi®ed <strong>and</strong> annotated list <strong>of</strong> probable vertebrate-speci®c horizontalgene transfers detected in this <strong>analysis</strong> is available as Supplementary Information. cDNA sequences for each protein were searched, using <strong>the</strong> SSAHA algorithm, against <strong>the</strong> draft <strong>genome</strong> sequence.Primers were designed <strong>and</strong> PCR was performed using three <strong>human</strong> genomic samples <strong>and</strong> a r<strong>and</strong>om BAC clone. The predicted genes were considered to be present in <strong>the</strong> <strong>human</strong> <strong>genome</strong> if a b<strong>and</strong> <strong>of</strong> <strong>the</strong>expected size was found in all three <strong>human</strong> samples but not in <strong>the</strong> control clone.NATURE | VOL 409 | 15 FEBRUARY 2001 | www.nature.com © 2001 Macmillan Magazines Ltd903
articlesmultifunctional proteins <strong>and</strong> 3 for cytoskeletal/structural. No suchgroups were found for defence <strong>and</strong> immunity or cell±cell communication.The 1-1-1-1 groups probably represent key functions that havenot undergone duplication <strong>and</strong> elaboration in <strong>the</strong> various lineages.They include many anabolic enzymes responsible for such functionsas respiratory chain <strong>and</strong> nucleotide biosyn<strong>the</strong>sis. In contrast, <strong>the</strong>reare few catabolic enzymes. As anabolic pathways branch lessfrequently than catabolic pathways, this indicates that alternativeroutes <strong>and</strong> displacements are more frequent in catabolic reactions.If proteins from <strong>the</strong> single-celled yeast are excluded from <strong>the</strong><strong>analysis</strong>, <strong>the</strong>re are 1,195 1-1-1 groups. The additional groupsinclude many examples <strong>of</strong> more complex signalling proteins, suchas receptor-type <strong>and</strong> src-like tyrosine kinases, likely to have arisenearly in <strong>the</strong> metazoan lineage. The fact that this set comprises only asmall proportion <strong>of</strong> <strong>the</strong> proteome <strong>of</strong> each <strong>of</strong> <strong>the</strong> animals indicatesthat, apart from a modest conserved core, <strong>the</strong>re has been extensiveelaboration <strong>and</strong> innovation within <strong>the</strong> protein complement.Most proteins do not show simple 1-1-1 orthologous relationshipsacross <strong>the</strong> three animals. To illustrate this, we investigated <strong>the</strong>nuclear hormone receptor family. In <strong>the</strong> <strong>human</strong> proteome, thisfamily consists <strong>of</strong> 60 different `classical' members, each with a zinc®nger <strong>and</strong> a lig<strong>and</strong>-binding domain. In comparison, <strong>the</strong> ¯y proteomehas 19 <strong>and</strong> <strong>the</strong> worm proteome has 220. As shown in Fig. 39,few simple orthologous relationships can be derived among <strong>the</strong>sehomologues. And, where potential subgroups <strong>of</strong> orthologues <strong>and</strong>(>200)(7)(4) Hepatocyte nuclear factors(3)Steroid(7)hormone(4)(2)(2)Ecdysone(3) Retinoic acids(2)(2)(6) Vitamin D3Ecdysone(3)(3)(3)(3)(3)HumanWormFly(3) Thyroid hormone(3) Retinoic acidsPeroxisomeproliferator activated(2) Apolipoproteinregulatory proteinFigure 39 Simpli®ed cladogram (relationship tree) <strong>of</strong> <strong>the</strong> `many-to-many' relationships <strong>of</strong>classical nuclear receptors. Triangles indicate expansion within one lineage; barsrepresent single members. Numbers in paren<strong>the</strong>ses indicate <strong>the</strong> number <strong>of</strong> paralogues ineach group.paralogues could be identi®ed, it was apparent that <strong>the</strong> functions <strong>of</strong><strong>the</strong> subgroup members could differ signi®cantly. For example, <strong>the</strong>¯y receptor for <strong>the</strong> ¯y-speci®c hormone ecdysone <strong>and</strong> <strong>the</strong> <strong>human</strong>retinoic acid receptors cluster toge<strong>the</strong>r on <strong>the</strong> basis <strong>of</strong> sequencesimilarity. Such examples underscore that <strong>the</strong> assignment <strong>of</strong> functionalsimilarity on <strong>the</strong> basis <strong>of</strong> sequence similarities among <strong>the</strong>sethree organisms is not trivial in most cases.New vertebrate domains <strong>and</strong> proteins. We <strong>the</strong>n explored how <strong>the</strong>proteome <strong>of</strong> vertebrates (as represented by <strong>the</strong> <strong>human</strong>) differs fromthose <strong>of</strong> <strong>the</strong> o<strong>the</strong>r species considered. The 1,262 InterPro familieswere scanned to identify those that contain only vertebrate proteins.Only 94 (7%) <strong>of</strong> <strong>the</strong> families were `vertebrate-speci®c'. Theserepresent 70 protein families <strong>and</strong> 24 domain families. Only one <strong>of</strong><strong>the</strong> 94 families represents enzymes, which is consistent with <strong>the</strong>ancient origins <strong>of</strong> most enzymes 336 . The single vertebrate-speci®cenzyme family identi®ed was <strong>the</strong> pancreatic or eosinophil-associatedribonucleases. These enzymes evolved rapidly, possibly tocombat vertebrate pathogens 337 .The relatively small proportion <strong>of</strong> vertebrate-speci®c multicopyfamilies suggests that few new protein domains have been inventedin <strong>the</strong> vertebrate lineage, <strong>and</strong> that most protein domains trace atleast as far back as a common animal ancestor. This conclusion mustbe tempered by <strong>the</strong> fact that <strong>the</strong> InterPro classi®cation system isincomplete; additional vertebrate-speci®c families undoubtedlyexist that have not yet been recognized in <strong>the</strong> InterPro system.The 94 vertebrate-speci®c families appear to re¯ect importantphysiological differences between vertebrates <strong>and</strong> o<strong>the</strong>r eukaryotes.Defence <strong>and</strong> immunity proteins (23 families) <strong>and</strong> proteins thatfunction in <strong>the</strong> nervous system (17 families) are particularlyenriched in this set. These data indicate <strong>the</strong> recent emergence orrapid divergence <strong>of</strong> <strong>the</strong>se proteins.Representative <strong>human</strong> proteins were previously known for nearlyall <strong>of</strong> <strong>the</strong> vertebrate-speci®c families. This was not surprising, given<strong>the</strong> anthropocentrism <strong>of</strong> biological research. However, <strong>the</strong> <strong>analysis</strong>did identify <strong>the</strong> ®rst mammalian proteins belonging to two <strong>of</strong> <strong>the</strong>sefamilies. Both <strong>of</strong> <strong>the</strong>se families were originally de®ned in ®sh. The®rst is <strong>the</strong> family <strong>of</strong> polar ®sh antifreeze III proteins. We found a<strong>human</strong> sialic acid synthase containing a domain homologous topolar ®sh antifreeze III protein (BAA91818.1). This ®nding suggeststhat ®sh created <strong>the</strong> antifreeze function by adaptation <strong>of</strong> thisdomain. We also found a <strong>human</strong> protein (CAB60269.1) homologousto <strong>the</strong> ependymin found in teleost ®sh. Ependymins aremajor glycoproteins <strong>of</strong> ®sh brains that have been claimed to beinvolved in long-term memory formation 338 . The function <strong>of</strong> <strong>the</strong>mammalian ependymin homologue will need to be elucidated.New architectures from old domains. Whereas <strong>the</strong>re appears to beonly modest invention at <strong>the</strong> level <strong>of</strong> new vertebrate proteindomains, <strong>the</strong>re appears to be substantial innovation in <strong>the</strong> creation<strong>of</strong> new vertebrate proteins. This innovation is evident at <strong>the</strong> level <strong>of</strong>domain architecture, de®ned as <strong>the</strong> linear arrangement <strong>of</strong> domainswithin a polypeptide. New architectures can be created by shuf¯ing,adding or deleting domains, resulting in new proteins from oldparts.We quanti®ed <strong>the</strong> number <strong>of</strong> distinct protein architectures foundin yeast, worm, ¯y <strong>and</strong> <strong>human</strong> by using <strong>the</strong> SMART annotationresource 339 (Fig. 40). The <strong>human</strong> proteome set contained 1.8 timesas many protein architectures as worm or ¯y <strong>and</strong> 5.8 times as manyas yeast. This difference is most prominent in <strong>the</strong> recent evolution <strong>of</strong>novel extracellular <strong>and</strong> transmembrane architectures in <strong>the</strong> <strong>human</strong>lineage. Human extracellular proteins show <strong>the</strong> greatest innovation:<strong>the</strong> <strong>human</strong> has 2.3 times as many extracellular architectures as ¯y<strong>and</strong> 2.0 times as many as worm. The larger number <strong>of</strong> <strong>human</strong>architectures does not simply re¯ect differences in <strong>the</strong> number <strong>of</strong>domains known in <strong>the</strong>se organisms; <strong>the</strong> result remains qualitatively<strong>the</strong> same even if <strong>the</strong> number <strong>of</strong> architectures in each organism isnormalized by dividing by <strong>the</strong> total number <strong>of</strong> domains (notshown). (We also checked that <strong>the</strong> larger number <strong>of</strong> <strong>human</strong>904 © 2001 Macmillan Magazines Ltd NATURE | VOL 409 | 15 FEBRUARY 2001 | www.nature.com
articles2,000Number <strong>of</strong> distinct domain architectures1,8001,6001,4001,2001,000800600400TransmembraneExtracellularIntracellular2000Human Fly Worm YeastFigure 40 Number <strong>of</strong> distinct domain architectures in <strong>the</strong> four eukaryotic <strong>genome</strong>s,predicted using SMART 339 . The number <strong>of</strong> architectures is split into three cellularenvironments: intracellular, extracellular <strong>and</strong> membrane-associated. The increase inarchitectures for <strong>the</strong> <strong>human</strong>, relative to <strong>the</strong> o<strong>the</strong>r lineages, is seen when <strong>the</strong>se numbersare normalized with respect to <strong>the</strong> numbers <strong>of</strong> domains predicted in each phylum. Toavoid artefactual results from <strong>the</strong> relatively low detection rate for some repeat types,t<strong>and</strong>em occurrences <strong>of</strong> tetratricopeptide, armadillo, EF-h<strong>and</strong>, leucine-rich, WD40 orankyrin repeats or C2H2-type zinc ®ngers were treated as single occurrences.architectures could not be an artefact resulting from erroneous genepredictions. Three-quarters <strong>of</strong> <strong>the</strong> architectures can be found inknown genes, which already yields an increase <strong>of</strong> about 50% overworm <strong>and</strong> ¯y. We expect <strong>the</strong> ®nal number <strong>of</strong> <strong>human</strong> architectures togrow as <strong>the</strong> complete gene set is identi®ed.)A related measure <strong>of</strong> proteome complexity can be obtained byconsidering an individual domain <strong>and</strong> counting <strong>the</strong> number <strong>of</strong>different domain types with which it co-occurs. For example,<strong>the</strong> trypsin-like serine protease domain (number 12 in Fig. 41)co-occurs with 18 domain types in <strong>human</strong> (including proteinsinvolved in <strong>the</strong> mammalian complement system, blood coagulation,<strong>and</strong> ®brinolytic <strong>and</strong> related systems). By contrast, <strong>the</strong> trypsin-likeserine protease domain occurs with only eight o<strong>the</strong>r domains in ¯y,®ve in worm <strong>and</strong> one in yeast. Similar results for 27 common domainsare shown in Fig. 41. In general, <strong>the</strong>re are more different co-occurringdomains in <strong>the</strong> <strong>human</strong> proteome than in <strong>the</strong> o<strong>the</strong>r proteomes.One mechanism by which architectures evolve is through <strong>the</strong>fusion <strong>of</strong> additional domains, <strong>of</strong>ten at one or both ends <strong>of</strong> <strong>the</strong>proteins. Such `domain accretion' 340 is seen in many <strong>human</strong> proteinswhen compared with proteins from o<strong>the</strong>r eukaryotes. The effect isillustrated by several chromatin-associated proteins (Fig. 42). In<strong>the</strong>se examples, <strong>the</strong> domain architectures <strong>of</strong> <strong>human</strong> proteins differfrom those found in yeast, worm <strong>and</strong> ¯y proteins only by <strong>the</strong>addition <strong>of</strong> domains at <strong>the</strong>ir termini.Among chromatin-associated proteins <strong>and</strong> transcription factors,a signi®cant proportion <strong>of</strong> domain architectures is shared between<strong>the</strong> vertebrate <strong>and</strong> ¯y, but not with worm (Fig. 43a). The trend waseven more prominent in architectures <strong>of</strong> proteins involved inano<strong>the</strong>r key cellular process, programmed cell death (Fig. 43b).These examples might seem to bear upon <strong>the</strong> unresolved issue <strong>of</strong> <strong>the</strong>evolutionary branching order <strong>of</strong> worms, ¯ies <strong>and</strong> <strong>human</strong>s, suggestingthat worms branched <strong>of</strong>f ®rst. However, <strong>the</strong>re were o<strong>the</strong>r cases inwhich worms <strong>and</strong> <strong>human</strong>s shared architectures not present in ¯y. Aglobal <strong>analysis</strong> <strong>of</strong> shared architectures could not conclusivelydistinguish between <strong>the</strong> two models, given <strong>the</strong> possibility <strong>of</strong> lineage-speci®closs <strong>of</strong> architectures. Comparison <strong>of</strong> protein architecturesmay help to resolve <strong>the</strong> evolutionary issue, but it will requiremore detailed analyses <strong>of</strong> many protein families.New physiology from old proteins. An important aspect <strong>of</strong>Number <strong>of</strong> co-occurring domains70605040302010MustardweedYeastWormFlyHuman01 2 3 4 5 6 7 8 9 10 1112 131415 16 17 18 19 20 21 22 23 24Domain family25 26 27Figure 41 Number <strong>of</strong> different Pfam domain types that co-occur in <strong>the</strong> same protein, foreach <strong>of</strong> <strong>the</strong> 10 most common domain families in each <strong>of</strong> <strong>the</strong> ®ve eukaryotic proteomes.Because some common domain families are shared, <strong>the</strong>re are 27 families ra<strong>the</strong>r than 50.The data are ranked according to decreasing numbers <strong>of</strong> <strong>human</strong> co-occurring Pfamdomains. The domain families are: (1) eukaryotic protein kinase [IPR000719];(2) immunoglobulin domain [IPR003006]; (3) ankyrin repeat [IPR002110]; (4) RING ®nger[IPR001841]; (5) C2H2-type zinc ®nger [IPR000822]; (6) ATP/GTP-binding P-loop[IPR001687]; (7) reverse transcriptase (RNA-dependent DNA polymerase) [IPR000477];(8) leucine-rich repeat [IPR001611]; (9) G-proteinb WD-40 repeats [IPR001680];(10) RNA-binding region RNP-1 (RNA recognition motif) [IPR000504]; (11) C-type lectindomain [IPR001304]; (12) serine proteases, trypsin family [IPR001254]; (13) helicaseC-terminal domain [IPR001650]; (14) collagen triple helix repeat [IPR000087];(15) rhodopsin-like GPCR superfamily [IPR000276]; (16) esterase/lipase/thioesterase[IPR000379]; (17) Myb DNA-binding domain [IPR001005]; (18) F-box domain[IPR001810]; (19) ATP-binding transport protein, 2nd P-loop motif [IPR001051];(20) homeobox domain [IPR001356]; (21) C4-type steroid receptor zinc ®nger[IPR001628]; (22) sugar transporter [IPR001066]; (23) PPR repeats [IPR002885];(24) seven-helix G-protein-coupled receptor, worm (probably olfactory) family [IPR000168];(25) cytochrome P450 enzyme [IPR001128]; (26) fungal transcriptional regulatory protein,N terminus [IPR001138]; (27) domain <strong>of</strong> unknown function DUF38 [IPR002900].NATURE | VOL 409 | 15 FEBRUARY 2001 | www.nature.com © 2001 Macmillan Magazines Ltd905
articlesaYW, F, VBr Br Ba Br Br Br Br Br Br Ba hmgARSC1/2* CG11375* *ZnfZnfbYEp1 Ep2 Ep1 Ep2 BrEp1PHDPHD*YPR031wWPHDPHDZnfF, H WF, HPHDPHDEp2 Br BMB Ch Ch SWI2 Sa hmg Ch Ch SWI2 SaPHDPHDPHDPHD*Lin-49**peregrin*CHD-3/T14G8.1 Mi-2cY, F, VEp1 Ep2E(Pc)-likeCommonancestorPHDPHDPHD2...5PHDPHDBrPHDhmgFsja* TrxW, F, HALRsjaCCCCCCSETSETCCA A A*Figure 42 Examples <strong>of</strong> domain accretion in chromatin proteins. Domain accretion invarious lineages before <strong>the</strong> animal divergence, in <strong>the</strong> apparent coelomate lineage <strong>and</strong> <strong>the</strong>vertebrate lineage are shown using schematic representations <strong>of</strong> domain architectures(not to scale). Asterisks, mobile domains that have participated in <strong>the</strong> accretion. Speciesin which a domain architecture has been identi®ed are indicated above <strong>the</strong> diagram(Y, yeast; W, worm; F, ¯y; V, vertebrate). Protein names are below <strong>the</strong> diagrams. TheMe*PHDPHDPHDHBrHrxPHDsja CCC SET Cdomains are SET, a chromatin protein methyltransferase domain; SWI2, a superfamily IIhelicase/ATPase domain; Sa, sant domain; Br, bromo domain; Ch, chromodomain; C, acysteine triad motif associated with <strong>the</strong> Msl-2 <strong>and</strong> SET domains; A, AT hook motif; EP1/EP2, enhancer <strong>of</strong> polycomb domains 1 <strong>and</strong> 2; Znf, zinc ®nger; sja, SET-JOR-associateddomain (L. Aravind, unpublished); Me, DNA methylase/Hrx-associated DNA binding zinc®nger; Ba, bromo-associated homology motif. a±c, Different examples <strong>of</strong> accretion.vertebrate innovation lies in <strong>the</strong> expansion <strong>of</strong> protein families. Table25 shows <strong>the</strong> most prevalent protein domains <strong>and</strong> protein familiesin <strong>human</strong>s, toge<strong>the</strong>r with <strong>the</strong>ir relative ranks in <strong>the</strong> o<strong>the</strong>r species.About 60% <strong>of</strong> families are more numerous in <strong>the</strong> <strong>human</strong> than in any<strong>of</strong> <strong>the</strong> o<strong>the</strong>r four organisms. This shows that gene duplication hasbeen a major evolutionary force during vertebrate evolution. Aab60102Conserved domain architectures in chromatin proteinsConserved domain architectures in apoptotic proteins3331816Human <strong>and</strong> flyHuman <strong>and</strong> wormWorm <strong>and</strong> flyAll threeHuman <strong>and</strong> flyHuman <strong>and</strong> wormWorm <strong>and</strong> flyAll threeFigure 43 Conservation <strong>of</strong> architectures between animal species. The pie charts illustrate<strong>the</strong> shared domain architectures <strong>of</strong> apparent orthologues that are conserved in at leasttwo <strong>of</strong> <strong>the</strong> three sequenced animal <strong>genome</strong>s. If an architecture was detected in fungi orplants, as well as two <strong>of</strong> <strong>the</strong> animal lineages, it was omitted as ancient <strong>and</strong> its absence in<strong>the</strong> third animal lineage attributed to gene loss. a, Chromatin-associated proteins.b, Components <strong>of</strong> <strong>the</strong> programmed cell death system.comparison <strong>of</strong> relative expansions in <strong>human</strong> versus ¯y is shown inFig. 44.Many <strong>of</strong> <strong>the</strong> families that are exp<strong>and</strong>ed in <strong>human</strong> relative to ¯y<strong>and</strong> worm are involved in distinctive aspects <strong>of</strong> vertebrate physiology.An example is <strong>the</strong> family <strong>of</strong> immunoglobulin (IG) domains,®rst identi®ed in antibodies thirty years ago. Classic (as opposed todivergent) IG domains are completely absent from <strong>the</strong> yeast <strong>and</strong>mustard weed proteomes <strong>and</strong>, although prokaryotic homologuesexist, <strong>the</strong>y have probably been transferred horizontally frommetazoans 341 . Most IG superfamily proteins in invertebrates arecell-surface proteins. In vertebrates, <strong>the</strong> IG repertoire includesimmune functions such as those <strong>of</strong> antibodies, MHC proteins,antibody receptors <strong>and</strong> many lymphocyte cell-surface proteins. Thelarge expansion <strong>of</strong> IG domains in vertebrates shows <strong>the</strong> versatility <strong>of</strong>a single family in evoking rapid <strong>and</strong> effective response to infection.Two prominent families are involved in <strong>the</strong> control <strong>of</strong> development.The <strong>human</strong> <strong>genome</strong> contains 30 ®broblast growth factors(FGFs), as opposed to two FGFs each in <strong>the</strong> ¯y <strong>and</strong> worm. Itcontains 42 transforming growth factor-bs(TGFbs) compared withnine <strong>and</strong> six in <strong>the</strong> ¯y <strong>and</strong> worm, respectively. These growth factorsare involved in organogenesis, such as that <strong>of</strong> <strong>the</strong> liver <strong>and</strong> <strong>the</strong> lung.A ¯y FGF protein, branchless, is involved in developing respiratoryorgans (tracheae) in embryos 342 . Thus, developmental triggers <strong>of</strong>morphogenesis in vertebrates have evolved from related but simplersystems in invertebrates 343 .Ano<strong>the</strong>r example is <strong>the</strong> family <strong>of</strong> intermediate ®lament proteins,with 127 family members. This expansion is almost entirely due to111 keratins, which are chordate-speci®c intermediate ®lamentproteins that form ®laments in epi<strong>the</strong>lia. The large number <strong>of</strong><strong>human</strong> keratins suggests multiple cellular structural support rolesfor <strong>the</strong> many specialized epi<strong>the</strong>lia <strong>of</strong> vertebrates.Finally, <strong>the</strong> olfactory receptor genes comprise a huge gene family<strong>of</strong> about 1,000 genes <strong>and</strong> pseudogenes 344,345 . The number <strong>of</strong> olfactoryreceptors testi®es to <strong>the</strong> importance <strong>of</strong> <strong>the</strong> sense <strong>of</strong> smell invertebrates. A total <strong>of</strong> 906 olfactory receptor genes <strong>and</strong> pseudogenescould be identi®ed in <strong>the</strong> draft <strong>genome</strong> sequence, two-thirds <strong>of</strong>which were not previously annotated. About 80% are found inabout two dozen clusters ranging from 6 to 138 genes <strong>and</strong> encompassingabout 30 Mb (,1%) <strong>of</strong> <strong>the</strong> <strong>human</strong> <strong>genome</strong>. Despite <strong>the</strong>importance <strong>of</strong> smell among our vertebrate ancestors, hominids906 © 2001 Macmillan Magazines Ltd NATURE | VOL 409 | 15 FEBRUARY 2001 | www.nature.com
articlesappear to have considerably less interest in this sense. About 60% <strong>of</strong><strong>the</strong> olfactory receptors in <strong>the</strong> draft <strong>genome</strong> sequence have disruptedORFs <strong>and</strong> appear to be pseudogenes, consistent with recentreports 344,346 suggesting massive functional gene loss in <strong>the</strong> last 10Myr 347,348 . Interestingly, <strong>the</strong>re appears to be a much higher proportion<strong>of</strong> intact genes among class I than class II olfactory receptors,suggesting functional importance.Vertebrates are not unique in employing gene family expansion.For many domain types, expansions appear to have occurredindependently in each <strong>of</strong> <strong>the</strong> major eukaryotic lineages. A goodexample is <strong>the</strong> classical C2H2 family <strong>of</strong> zinc ®nger domains, whichhave exp<strong>and</strong>ed independently in <strong>the</strong> yeast, worm, ¯y <strong>and</strong> <strong>human</strong>lineages (Fig. 45). These independent expansions have resulted innumerous C2H2 zinc ®nger domain-containing proteins that arespeci®c to each lineage. In ¯ies, <strong>the</strong> important components <strong>of</strong> <strong>the</strong>C2H2 zinc ®nger expansion are architectures in which it is combinedwith <strong>the</strong> POZ domain <strong>and</strong> <strong>the</strong> C4DM domain (a metalbindingdomain found only in ¯y). In <strong>human</strong>s, <strong>the</strong> most prevalentexpansions are combinations <strong>of</strong> <strong>the</strong> C2H2 zinc ®nger with POZ(independent <strong>of</strong> <strong>the</strong> one in insects) <strong>and</strong> <strong>the</strong> vertebrate-speci®cKRAB <strong>and</strong> SCAN domains.The homeodomain is similarly exp<strong>and</strong>ed in all animals <strong>and</strong> ispresent in both architectures that are conserved <strong>and</strong> lineage-speci®carchitectures (Fig. 45). This indicates that <strong>the</strong> ancestral animalprobably encoded a signi®cant number <strong>of</strong> homeodomain proteins,but subsequent evolution involved multiple, independent expansions<strong>and</strong> domain shuf¯ing after lineages diverged. Thus, <strong>the</strong> mostprevalent transcription factor families are different in worm, ¯y <strong>and</strong><strong>human</strong> (Fig. 45). This has major biological implications becausetranscription factors are critical in animal development <strong>and</strong> differentiation.The emergence <strong>of</strong> major variations in <strong>the</strong> developmentalbody plans that accompanied <strong>the</strong> early radiation <strong>of</strong> <strong>the</strong> animals 349could have been driven by lineage-speci®c proliferation <strong>of</strong> suchtranscription factors. Beyond <strong>the</strong>se large expansions <strong>of</strong> proteinfamilies, protein components <strong>of</strong> particular functional systemssuch as <strong>the</strong> cell death signalling system show a general increase indiversity <strong>and</strong> numbers in <strong>the</strong> vertebrates relative to o<strong>the</strong>r animals.For example, <strong>the</strong>re are greater numbers <strong>of</strong> <strong>and</strong> more novel architecturesin cell death regulatory proteins such as BCL-2, TNFR <strong>and</strong>NFkB from vertebrates.Conclusion. Five lines <strong>of</strong> evidence point to an increase in <strong>the</strong>complexity <strong>of</strong> <strong>the</strong> proteome from <strong>the</strong> single-celled yeast to <strong>the</strong>multicellular invertebrates <strong>and</strong> to vertebrates such as <strong>the</strong> <strong>human</strong>.Speci®cally, <strong>the</strong> <strong>human</strong> contains greater numbers <strong>of</strong> genes, domain<strong>and</strong> protein families, paralogues, multidomain proteins withmultiple functions, <strong>and</strong> domain architectures. According to <strong>the</strong>semeasures, <strong>the</strong> relatively greater complexity <strong>of</strong> <strong>the</strong> <strong>human</strong> proteomeis a consequence not simply <strong>of</strong> its larger size, but also <strong>of</strong> large-scaleprotein innovation.An important question is <strong>the</strong> extent to which <strong>the</strong> greaterphenotypic complexity <strong>of</strong> vertebrates can be explained simply bytwo- or threefold increases in proteome complexity. The realexplanation may lie in combinatorial ampli®cation <strong>of</strong> <strong>the</strong>semodest differences, by mechanisms that include alternative splicing,post-translational modi®cation <strong>and</strong> cellular regulatory networks.The potential numbers <strong>of</strong> different proteins <strong>and</strong> protein±proteininteractions are vast, <strong>and</strong> <strong>the</strong>ir actual numbers cannot readily bediscerned from <strong>the</strong> <strong>genome</strong> sequence. Elucidating such systemlevelproperties presents one <strong>of</strong> <strong>the</strong> great challenges for modernbiology.Table 25 The most populous InterPro families in <strong>the</strong> <strong>human</strong> proteome <strong>and</strong> o<strong>the</strong>r speciesInterPro IDNo. <strong>of</strong>genesHuman Fly Worm Yeast Mustard weedRankNo. <strong>of</strong>genesRankNo. <strong>of</strong>genesRankNo. <strong>of</strong>genesIPR003006 765 (1) 140 (9) 64 (34) 0 (na) 0 (na) Immunoglobulin domainPR000822 706 (2) 357 (1) 151 (10) 48 (7) 115 (20) C2H2 zinc ®ngerIPR000719 575 (3) 319 (2) 437 (2) 121 (1) 1049 (1) Eukaryotic protein kinaseIPR000276 569 (4) 97 (14) 358 (3) 0 (na) 16 (84) Rhodopsin-like GPCR superfamilyIPR001687 433 (5) 198 (4) 183 (7) 97 (2) 331 (5) P-loop motifIPR000477 350 (6) 10 (65) 50 (41) 6 (36) 80 (35) Reverse transcriptase (RNA-dependent DNA polymerase)IPR000504 300 (7) 157 (6) 96 (21) 54 (6) 255 (8) rrm domainIPR001680 277 (8) 162 (5) 102 (19) 91 (3) 210 (10) G-protein b WD-40 repeatsIPR002110 276 (9) 105 (13) 107 (17) 19 (23) 120 (18) Ankyrin repeatIPR001356 267 (10) 148 (7) 109 (15) 9 (33) 118 (19) Homeobox domainIPR001849 252 (11) 77 (22) 71 (31) 27 (17) 27 (73) PH domainIPR002048 242 (12) 111 (12) 81 (25) 15 (27) 167 (12) EF-h<strong>and</strong> familyIPR000561 222 (13) 81 (20) 113 (14) 0 (na) 17 (83) EGF-like domainIPR001452 215 (14) 72 (23) 62 (35) 25 (18) 3 (97) SH3 domainIPR001841 210 (15) 114 (11) 126 (12) 35 (12) 379 (4) RING ®ngerIPR001611 188 (16) 115 (10) 54 (38) 7 (35) 392 (2) Leucine-rich repeatIPR001909 171 (17) 0 (na) 0 (na) 0 (na) 0 (na) KRAB boxIPR001777 165 (18) 63 (27) 51 (40) 2 (40) 4 (96) Fibronectin type III domainIPR001478 162 (19) 70 (24) 66 (33) 2 (40) 15 (85) PDZ domainIPR001650 155 (20) 87 (17) 78 (27) 79 (4) 148 (13) Helicase C-terminal domainIPR001440 150 (21) 86 (18) 46 (43) 36 (11) 125 (17) TPR repeatIPR002216 133 (22) 65 (26) 99 (20) 2 (40) 31 (69) Ion transport proteinIPR001092 131 (23) 84 (19) 41 (46) 7 (35) 106 (24) Helix±loop±helix DNA-binding domainIPR000008 123 (24) 43 (34) 36 (49) 9 (33) 82 (34) C2 domainIPR001664 119 (25) 4 (71) 22 (63) 1 (41) 2 (98) SH2 domainIPR001254 118 (26) 210 (3) 12 (73) 1 (41) 15 (85) Serine protease, trypsin familyIPR002126 114 (27) 19 (56) 16 (69) 0 (na) 0 (na) Cadherin domainIPR000210 113 (28) 78 (21) 117 (13) 1 (41) 54 (50) BTB/POZ domainIPR000387 112 (29) 35 (40) 108 (16) 12 (30) 21 (79) Tyrosine-speci®c protein phosphatase <strong>and</strong> dual speci®cityprotein phosphatase familyIPR000087 106 (30) 18 (57) 169 (9) 0 (na) 5 (95) Collagen triple helix repeatIPR000379 94 (31) 141 (8) 134 (11) 40 (10) 194 (11) Esterase/lipase/thioesteraseIPR000910 89 (32) 38 (38) 18 (67) 8 (34) 18 (82) HMG1/2 (high mobility group) boxIPR000130 87 (33) 56 (29) 92 (22) 8 (34) 12 (88) Neutral zinc metallopeptidaseIPR001965 84 (34) 37 (39) 24 (61) 16 (26) 71 (39) PHD-®ngerIPR000636 83 (35) 32 (43) 24 (61) 1 (41) 14 (86) Cation channels (non-lig<strong>and</strong> gated)IPR001781 81 (36) 38 (38) 36 (49) 4 (38) 8 (92) LIM domainIPR002035 81 (36) 8 (67) 45 (44) 3 (39) 17 (83) VWA domainIPR001715 80 (37) 33 (42) 30 (55) 3 (39) 18 (82) Calponin homology domainIPR000198 77 (38) 20 (55) 20 (65) 10 (32) 9 (91) RhoGAP domain...................................................................................................................................................................................................................................................................................................................................................................Forty most populous Interpro families found in <strong>the</strong> <strong>human</strong> proteome compared with equivalent numbers from o<strong>the</strong>r species. na, not applicable (used when <strong>the</strong>re are no proteins in an organism in that family).RankNo. <strong>of</strong>genesRankNATURE | VOL 409 | 15 FEBRUARY 2001 | www.nature.com © 2001 Macmillan Magazines Ltd907
articlesSegmental history <strong>of</strong> <strong>the</strong> <strong>human</strong> <strong>genome</strong>In bacteria, genomic segments <strong>of</strong>ten convey important informationabout function: genes located close to one ano<strong>the</strong>r <strong>of</strong>ten encodeproteins in a common pathway <strong>and</strong> are regulated in a commonoperon. In mammals, genes found close to each o<strong>the</strong>r only rarelyhave common functions, but <strong>the</strong>y are still interesting because <strong>the</strong>yhave a common history. In fact, <strong>the</strong> study <strong>of</strong> genomic segments canshed light on biological events as long as 500 Myr ago <strong>and</strong> as recentlyas 20,000 years ago.Conserved segments between <strong>human</strong> <strong>and</strong> mouseHumans <strong>and</strong> mice shared a common ancestor about 100 Myr ago.Despite <strong>the</strong> 200 Myr <strong>of</strong> evolutionary distance between <strong>the</strong> species, asigni®cant fraction <strong>of</strong> genes show synteny between <strong>the</strong> two, beingpreserved within conserved segments. Genes tightly linked in onemammalian species tend to be linked in o<strong>the</strong>rs. In fact, conservedsegments have been observed in even more distant species: <strong>human</strong>sshow conserved segments with ®sh 350,351 <strong>and</strong> even with invertebratessuch as ¯y <strong>and</strong> worm 352 . In general, <strong>the</strong> likelihood that a syntenicrelationship will be disrupted correlates with <strong>the</strong> physical distancebetween <strong>the</strong> loci <strong>and</strong> <strong>the</strong> evolutionary distance between <strong>the</strong> species.Studying conserved segments between <strong>human</strong> <strong>and</strong> mouse hasseveral uses. First, conservation <strong>of</strong> gene order has been used toidentify likely orthologues between <strong>the</strong> species, particularly wheninvestigating disease phenotypes. Second, <strong>the</strong> study <strong>of</strong> conservedsegments among <strong>genome</strong>s helps us to deduce evolutionary ancestry.Fly (number <strong>of</strong> genes)4003503002502820058 71501032117 15 12 9100 36437 23 2129 20 1334 2211351933 18 145027 263130242516600 100 200 300 400 500 600 700 800 900Human (number <strong>of</strong> genes)Figure 44 Relative expansions <strong>of</strong> protein families between <strong>human</strong> <strong>and</strong> ¯y. These datahave not been normalized for proteomic size differences. Blue line, equality betweennormalized family sizes in <strong>the</strong> two organisms. Green line, equality between unnormalizedfamily sizes. Numbered InterPro entries: (1) immunoglobulin domain [IPR003006]; (2) zinc®nger, C2H2 type [IPR000822]; (3) eukaryotic protein kinase [IPR000719]; (4) rhodopsinlikeGPCR superfamily [IPR000276]; (5) ATP/GTP-binding site motif A (P-loop)[IPR001687]; (6) reverse transcriptase (RNA-dependent DNA polymerase) [IPR000477];(7) RNA-binding region RNP-1 (RNA recognition motif) [IPR000504]; (8) G-proteinb WD-40 repeats [IPR001680]; (9) ankyrin repeat [IPR002110]; (10) homeobox domain[IPR001356]; (11) PH domain [IPR001849]; (12) EF-h<strong>and</strong> family [IPR002048]; (13) EGFlikedomain [IPR000561]; (14) Src homology 3 (SH3) domain [IPR001452]; (15) RING®nger [IPR001841]; (16) KRAB box [IPR001909]; (17) leucine-rich repeat [IPR001611];(18) ®bronectin type III domain [IPR001777]; (19) PDZ domain (also known as DHR orGLGF) [IPR001478]; (20) TPR repeat [IPR001440]; (21) helicase C-terminal domain[IPR001650]; (22) ion transport protein [IPR002216]; (23) helix±loop±helix DNA-bindingdomain [IPR001092]; (24) cadherin domain [IPR002126]; (25) intermediate ®lamentproteins [IPR001664]; (26) C2 domain [IPR000008]; (27) Src homology 2 (SH2) domain[IPR000980]; (28) serine proteases, trypsin family [IPR001254]; (29) BTB/POZ domain[IPR000210]; (30) tyrosine-speci®c protein phosphatase <strong>and</strong> dual speci®city proteinphosphatase family [IPR000387]; (31) collagen triple helix repeat [IPR000087]; (32)esterase/lipase/thioesterase [IPR000379]; (33) neutral zinc metallopeptidases, zincbindingregion [IPR000130]; (34) ATP-binding transport protein, 2nd P-loop motif[IPR001051]; (35) ABC transporters family [IPR001617]; (36) cytochrome P450 enzyme[IPR001128]; (37) insect cuticle protein [IPR000618].32And third, detailed comparative maps may assist in <strong>the</strong> assembly <strong>of</strong><strong>the</strong> mouse sequence, using <strong>the</strong> <strong>human</strong> sequence as a scaffold.Two types <strong>of</strong> linkage conservation are commonly described 353 .`Conserved synteny' indicates that at least two genes that reside on acommon chromosome in one species are also located on a commonchromosome in <strong>the</strong> o<strong>the</strong>r species. Syntenic loci are said to lie in a`conserved segment' when not only <strong>the</strong> chromosomal position but<strong>the</strong> linear order <strong>of</strong> <strong>the</strong> loci has been preserved, without interruptionby o<strong>the</strong>r chromosomal rearrangements.An initial survey <strong>of</strong> homologous loci in <strong>human</strong> <strong>and</strong> mouse 354suggested that <strong>the</strong> total number <strong>of</strong> conserved segments would beabout 180. Subsequent estimates based on increasingly detailedcomparative maps have remained close to this projection 353,355,356(http://www.informatics.jax.org). The distribution <strong>of</strong> segmentlengths has corresponded reasonably well to <strong>the</strong> truncated negativeexponential curve predicted by <strong>the</strong> r<strong>and</strong>om breakage model 357 .The availability <strong>of</strong> a draft <strong>human</strong> <strong>genome</strong> sequence allows <strong>the</strong> ®rstglobal <strong>human</strong>±mouse comparison in which <strong>human</strong> physical distancescan be measured in Mb, ra<strong>the</strong>r than cM or orthologous genecounts. We identi®ed likely orthologues by reciprocal comparison<strong>of</strong> <strong>the</strong> <strong>human</strong> <strong>and</strong> mouse mRNAs in <strong>the</strong> LocusLink database, usingmegaBLAST. For each orthologous pair, we mapped <strong>the</strong> location <strong>of</strong><strong>the</strong> <strong>human</strong> gene in <strong>the</strong> draft <strong>genome</strong> sequence <strong>and</strong> <strong>the</strong>n checked <strong>the</strong>location <strong>of</strong> <strong>the</strong> mouse gene in <strong>the</strong> Mouse Genome Informaticsdatabase (http://www.informatics.jax.org). Using a conservativethreshold, we identi®ed 3,920 orthologous pairs in which <strong>the</strong><strong>human</strong> gene could be mapped on <strong>the</strong> draft <strong>genome</strong> sequence withhigh con®dence. Of <strong>the</strong>se, 2,998 corresponding mouse genes had aknown position in <strong>the</strong> mouse <strong>genome</strong>. We <strong>the</strong>n searched forde®nitive conserved segments, de®ned as <strong>human</strong> regions containingorthologues <strong>of</strong> at least two genes from <strong>the</strong> same mouse chromosomeregion (, 15 cM) without interruption by segments from o<strong>the</strong>rchromosomes.We identi®ed 183 de®nitive conserved segments (Fig. 46). Theaverage segment length was 15.4 Mb, with <strong>the</strong> largest segment being90.5 Mb <strong>and</strong> <strong>the</strong> smallest 24 kb. There were also 141 `singletons',segments that contained only a single locus; <strong>the</strong>se are not counted in<strong>the</strong> statistics. Although some <strong>of</strong> <strong>the</strong>se could be short conservedsegments, <strong>the</strong>y could also re¯ect incorrect choices <strong>of</strong> orthologues orproblems with <strong>the</strong> <strong>human</strong> or mouse maps. Because <strong>of</strong> this conservativeapproach, <strong>the</strong> observed number <strong>of</strong> de®nitive segments islikely be lower than <strong>the</strong> correct total. One piece <strong>of</strong> evidence for thisconclusion comes from a more detailed <strong>analysis</strong> on <strong>human</strong> chromosome7 (ref. 358), which identi®ed 20 conserved segments, <strong>of</strong>which three were singletons. Our <strong>analysis</strong> revealed only 13 de®nitivesegments on this chromosome, with nine singletons.The frequency <strong>of</strong> observing a particular gene count in a conservedsegment is plotted on a logarithmic scale in Fig. 47. If chromosomalbreaks occur in a r<strong>and</strong>om fashion (as has been proposed) <strong>and</strong>differences in gene density are ignored, a roughly straight lineshould result. There is a clear excess for n = 1, suggesting that 50%or more <strong>of</strong> <strong>the</strong> singletons are indeed artefactual. Thus, we estimatethat true number <strong>of</strong> conserved segments is around 190±230, in goodagreement with <strong>the</strong> original Nadeau±Taylor prediction 354 .Figure 48 shows a plot <strong>of</strong> <strong>the</strong> frequency <strong>of</strong> lengths <strong>of</strong> conservedsegments, where <strong>the</strong> x-axis scale is shown in Mb. As before, <strong>the</strong>re is afair amount <strong>of</strong> scatter in <strong>the</strong> data for <strong>the</strong> larger segments (where <strong>the</strong>numbers are small), but <strong>the</strong> trend appears to be consistent with ar<strong>and</strong>om breakage model.We attempted to ascertain whe<strong>the</strong>r <strong>the</strong> breakpoint regions haveany special characteristics. This <strong>analysis</strong> was complicated by imprecisionin <strong>the</strong> positioning <strong>of</strong> <strong>the</strong>se breaks, which will tend to blur anyrelationships. With 2,998 orthologues, <strong>the</strong> average interval withinwhich a break is known to have occurred is about 1.1 Mb. Wecompared <strong>the</strong> aggregate features <strong>of</strong> <strong>the</strong>se breakpoint intervals with<strong>the</strong> <strong>genome</strong> as a whole. The mean gene density was lower inbreakpoint regions than in <strong>the</strong> conserved segments (13.8 versus908 © 2001 Macmillan Magazines Ltd NATURE | VOL 409 | 15 FEBRUARY 2001 | www.nature.com
articles18.6 per Mb). This suggests that breakpoints may be more likely tooccur or to undergo ®xation in gene-poor intervals than in generichintervals. The occurrence <strong>of</strong> breakpoints may be promoted byhomologous recombination among repeated sequences 359 . When<strong>the</strong> sequence <strong>of</strong> <strong>the</strong> mouse <strong>genome</strong> is ®nished, this <strong>analysis</strong> can berevisited more precisely.A number <strong>of</strong> examples <strong>of</strong> extended conserved segments <strong>and</strong>syntenies are apparent in Fig. 46. As has been noted, almost all<strong>human</strong> genes on chromosome 17 are found on mouse chromosome11, with two members <strong>of</strong> <strong>the</strong> placental lactogen family from mouse13 inserted. Apart from two singleton loci, <strong>human</strong> chromosome 20appears to be entirely orthologous to mouse chromosome 2,apparently in a single segment. The largest apparently contiguousconserved segment in <strong>the</strong> <strong>human</strong> <strong>genome</strong> is on chromosome 4,including roughly 90.5 Mb <strong>of</strong> <strong>human</strong> DNA that is orthologous tomouse chromosome 5. This <strong>analysis</strong> also allows us to infer <strong>the</strong> likelylocation <strong>of</strong> thous<strong>and</strong>s <strong>of</strong> mouse genes for which <strong>the</strong> <strong>human</strong>orthologue has been located in <strong>the</strong> draft <strong>genome</strong> sequence but <strong>the</strong>mouse locus has not yet been mapped.With about 200 conserved segments between mouse <strong>and</strong> <strong>human</strong><strong>and</strong> about 100 Myr <strong>of</strong> evolution from <strong>the</strong>ir common ancestor 360 ,weobtain an estimated rate <strong>of</strong> about 1.0 chromosomal rearrangementbeing ®xed per Myr. However, <strong>the</strong>re is good evidence that <strong>the</strong> rate <strong>of</strong>chromosomal rearrangement (like <strong>the</strong> rate <strong>of</strong> nucleotide substitutions;see above) differs between <strong>the</strong> two species. Among mammals,rodents may show unusually rapid chromosome alteration. Bycomparison, very few rearrangements have been observed amongprimates, <strong>and</strong> studies <strong>of</strong> a broader array <strong>of</strong> mammalian orders,including cats, cows, sheep <strong>and</strong> pigs, suggest an average rate <strong>of</strong>chromosome alteration <strong>of</strong> only about 0.2 rearrangements per Myrin <strong>the</strong>se lineages 361 . Additional evidence that rodents are outlierscomes from a recent <strong>analysis</strong> <strong>of</strong> synteny between <strong>the</strong> <strong>human</strong> <strong>and</strong>zebra®sh <strong>genome</strong>s. From a study <strong>of</strong> 523 orthologues, it was possibleto project 418 conserved segments 350 . Assuming 400 Myr since acommon vertebrate ancestor <strong>of</strong> zebra®sh <strong>and</strong> <strong>human</strong>s 362 , we obtainan estimate <strong>of</strong> 0.52 rearrangements per Myr. Recent estimates <strong>of</strong>rearrangement rates in plants have suggested bimodality, with somepairs showing rates <strong>of</strong> 0.15±0.41 rearrangements per Myr, <strong>and</strong>o<strong>the</strong>rs showing higher rates <strong>of</strong> 1.1±1.3 rearrangements per Myr 363 .With additional detailed <strong>genome</strong> maps <strong>of</strong> multiple species, it shouldbe possible to determine whe<strong>the</strong>r this particular molecular clock istruly operating at a different rate in various branches <strong>of</strong> <strong>the</strong>evolutionary tree, <strong>and</strong> whe<strong>the</strong>r variations in that rate are bimodalor continuous. It should also be possible to reconstruct <strong>the</strong> karyotypes<strong>of</strong> common ancestors.Ancient duplicated segments in <strong>the</strong> <strong>human</strong> <strong>genome</strong>Ano<strong>the</strong>r approach to genomic history is to study segmental duplicationswithin <strong>the</strong> <strong>human</strong> <strong>genome</strong>. Earlier, we discussed examples<strong>of</strong> recent duplications <strong>of</strong> genomic segments to pericentromeric <strong>and</strong>subtelomeric regions. Most <strong>of</strong> <strong>the</strong>se events appear to be evolutionarydead-ends resulting in nonfunctional pseudogenes; however,segmental duplication is also an important mode <strong>of</strong> evolutionaryinnovation: a duplication permits one copy <strong>of</strong> each gene to drift <strong>and</strong>potentially to acquire a new function.Segmental duplications can occur through unequal crossing overto create gene families in speci®c chromosomal regions. Thismechanism can create both small families, such as <strong>the</strong> ®ve relatedgenes <strong>of</strong> <strong>the</strong> b-globin cluster on chromosome 11, <strong>and</strong> large ones,such as <strong>the</strong> olfactory receptor gene clusters, which toge<strong>the</strong>r containnearly 1,000 genes <strong>and</strong> pseudogenes.WormFlyHumanPOZ:~143Homeodomain:~90 POZ:~95 Homeodomain:~92POZ:~140Homeodomain:~220MATHPOZC2H2C2H2Paired HD HDPOZPaired HD HDPOZC2H2C2H2C2H2C2H2C2H2C2H2PairedHDHDPOZKPou HD Lim HDPou HD Lim HDPOZ APOZbZipPouHDLimHDPOZNHR:~230Zn LBC4DM:80C4DMC2H2C2H2SAZ (MYB-like):35SAZ SAZ SAZKrabKrab:~220C2H2C2H2C2H2C2H2C2H2C2H2ScanScan:~50C2H2C2H2C2H2C2H2C2H2C2H2bHIHbHLH:53bHIHbHLH:105PAS PAS bHIH bHIH PAS PASUnique <strong>and</strong> shared domain organizations in animalsCG-1C5 TigOlf-1TigP53FankankKIAA0833SSRPSh2STATHMGSSRPPHDP53FP53FP53MeFkdwkTigNFATCGBPYCSmyDEAF-1HfP53FankankankankankHMGTigNFKBHistone foldPOZS SPRy ATPaseSAF-AMTFFlyCDP1AAA A AAAAAAF49E12.6E2FE2FWormHBP-1ATXSAZHMGwdwdwdwdwdwdwdwdC2H2C2H2AND-1HMGHMGUBF-1GHLHMG HMG HMG HMGZHX-1PMS-1RFX5RFXHMGHD HD HD HD HDAAAncient architecturesconserved in all animalsShared byfly <strong>and</strong> <strong>human</strong>Unique t<strong>of</strong>ly or wormUnique to<strong>human</strong>Figure 45 Lineage-speci®c expansions <strong>of</strong> domains <strong>and</strong> architectures <strong>of</strong> transcriptionfactors. Top, speci®c families <strong>of</strong> transcription factors that have been exp<strong>and</strong>ed in each <strong>of</strong><strong>the</strong> proteomes. Approximate numbers <strong>of</strong> domains identi®ed in each <strong>of</strong> <strong>the</strong> (nearly)complete proteomes representing <strong>the</strong> lineages are shown next to <strong>the</strong> domains, <strong>and</strong> some<strong>of</strong> <strong>the</strong> most common architectures are shown. Some are shared by different animallineages; o<strong>the</strong>rs are lineage-speci®c. Bottom, samples <strong>of</strong> architectures from transcriptionfactors that are shared by all animals (ancient architectures), shared by ¯y <strong>and</strong> <strong>human</strong> <strong>and</strong>unique to each lineage. Domains: K, kelch; HD, homeodomain; Zn, zinc-binding domain;LB, lig<strong>and</strong>-binding domain; C4DM, novel Zn cluster with four cysteines, probably involvedin protein±protein interactions (L. Aravind, unpublished); MATH, meprin-associated TRAFdomain; CG-1, novel domain in KIAA0909-like transcription factors (L. Aravind,unpublished); MTF, myelin transcription factor domain; SAZ, specialized Myb-like helixturn-helix(HTH) domain found in Stonewall, ADF-1 <strong>and</strong> Zeste (L. Aravind, unpublished); A,AT-hook motif; E2F, winged HTH DNA-binding domain; GHL, gyraseB-histidine kinase-MutL ATPase domain; ATX, ATaXin domain; RFX, RFX winged HTH DNA binding domain;My, MYND domain; KDWK, KDWK DNA-binding domain; POZ, Pox zinc ®nger domain; S,SAP domain; P53F, P53 fold domain; HF, histone fold; ANK, ankyrin repeat; TIG,transcription factor Ig domain; SSRP, structure-speci®c recognition protein domain; C5,5-cysteine metal binding domain; C2H2, classic zinc ®nger domain; WD, WD40 repeats.NATURE | VOL 409 | 15 FEBRUARY 2001 | www.nature.com © 2001 Macmillan Magazines Ltd909
articlesThe most extreme mechanism is whole-<strong>genome</strong> duplication(WGD), through a polyploidization event in which a diploidorganism becomes tetraploid. Such events are classi®ed as autopolyploidyor allopolyploidy, depending on whe<strong>the</strong>r <strong>the</strong>y involvehybridization between members <strong>of</strong> <strong>the</strong> same species or differentspecies. Polyploidization is common in <strong>the</strong> plant kingdom, withmany known examples among wild <strong>and</strong> domesticated crop species.Alfalfa (Medicago sativa) is a naturally occurring autotetraploid 364 ,<strong>and</strong> Nicotiana tabacum, some species <strong>of</strong> cotton (Gossypium) <strong>and</strong>several <strong>of</strong> <strong>the</strong> common brassicas are allotetraploids containing pairs<strong>of</strong> `homeologous' chromosome pairs.In principle, WGD provides <strong>the</strong> raw material for great bursts <strong>of</strong>innovation by allowing <strong>the</strong> duplication <strong>and</strong> divergence <strong>of</strong> entirepathways. Ohno 365 suggested that WGD has played a key role inevolution. There is evidence for an ancient WGD event in <strong>the</strong>ancestry <strong>of</strong> yeast <strong>and</strong> several independent such events in <strong>the</strong> ancestry<strong>of</strong> mustard weed 366±369 . Such ancient WGD events can be hard todetect because only a minority <strong>of</strong> <strong>the</strong> duplicated loci may beretained, with <strong>the</strong> result that <strong>the</strong> genes in duplicated segmentscannot be aligned in a one-to-one correspondence but ra<strong>the</strong>rrequire many gaps. In addition, duplicated segments may besubsequently rearranged. For example, <strong>the</strong> ancient duplication in<strong>the</strong> yeast <strong>genome</strong> appears to have been followed by loss <strong>of</strong> more than90% <strong>of</strong> <strong>the</strong> newly duplicated genes 366 .One <strong>of</strong> <strong>the</strong> most controversial hypo<strong>the</strong>ses about vertebrateevolution is <strong>the</strong> proposal that two WGD events occurred early in<strong>the</strong> vertebrate lineage, around <strong>the</strong> time <strong>of</strong> jawed ®shes some 500 Myrago. Some authors 370±373 have seen support for this <strong>the</strong>ory in <strong>the</strong> factthat many <strong>human</strong> genes occur in sets <strong>of</strong> four homologuesÐmostnotably <strong>the</strong> four extensive HOX gene clusters on chromosomes 2, 7,12 <strong>and</strong> 17, whose duplication dates to around <strong>the</strong> correct time.However, o<strong>the</strong>r authors have disputed this interpretation 374 ,suggesting that <strong>the</strong>se cases may re¯ect unrelated duplications <strong>of</strong>speci®c regions ra<strong>the</strong>r than successive WGD.We analysed <strong>the</strong> draft <strong>genome</strong> sequence for evidence that mightbear on this question. The <strong>analysis</strong> provides many interestingobservations, but no convincing evidence <strong>of</strong> ancient WGD. Welooked for evidence <strong>of</strong> pairs <strong>of</strong> chromosomal regions containingmany homologous genes. Although we found many pairs containinga few homologous genes, <strong>the</strong> <strong>human</strong> <strong>genome</strong> does not appear tocontain any pairs <strong>of</strong> regions where <strong>the</strong> density <strong>of</strong> duplicated genesapproaches <strong>the</strong> densities seen in yeast or mustard weed 366±369 .We also examined <strong>human</strong> proteins in <strong>the</strong> IPI for which <strong>the</strong>orthologues among ¯y or worm proteins occur in <strong>the</strong> ratios 2:1:1,3:1:1, 4:1:1 <strong>and</strong> so on (Fig. 49). The number <strong>of</strong> such families fallssmoothly, with no peak at four <strong>and</strong> some instances <strong>of</strong> ®ve or morehomologues. Although this does not rule out two rounds <strong>of</strong> WGDfollowed by extensive gene loss <strong>and</strong> some unrelated gene duplication,it provides no support for <strong>the</strong> <strong>the</strong>ory. More probatively, if twosuccessive rounds <strong>of</strong> <strong>genome</strong> duplication occurred, phylogenetic<strong>analysis</strong> <strong>of</strong> <strong>the</strong> proteins having 4:1:1 ratios between <strong>human</strong>, ¯y <strong>and</strong>worm would be expected to show more trees with <strong>the</strong> topology(A,B)(C,D) for <strong>the</strong> <strong>human</strong> sequences than (A,(B,(C,D))) 375 .However,<strong>of</strong> 57 sets studied carefully, only 24% <strong>of</strong> <strong>the</strong> trees constructedfrom <strong>the</strong> 4:1:1 set have <strong>the</strong> former topology; this is not signi®cantlydifferent from what would be expected under <strong>the</strong> hypo<strong>the</strong>sis <strong>of</strong>r<strong>and</strong>om sequential duplication <strong>of</strong> individual loci.100Occurrences101 2 3 4 5 6 7 8 9 10 11 12100 10 20 30 40 50 60 70 80 90 100Genes per conserved segmentFigure 47 Distribution <strong>of</strong> number <strong>of</strong> genes per conserved segment between <strong>human</strong> <strong>and</strong>mouse <strong>genome</strong>s.10013 14 15 16 17 18 19 20 21 22 X Y1 2 3 4 5 6 7 8 9 10Occurrences1011 12 13 14 15 16 17 18 19 X YFigure 46 Conserved segments in <strong>the</strong> <strong>human</strong> <strong>and</strong> mouse <strong>genome</strong>. Humanchromosomes, with segments containing at least two genes whose order is conserved in<strong>the</strong> mouse <strong>genome</strong> as colour blocks. Each colour corresponds to a particular mousechromosome. Centromeres, subcentromeric heterochromatin <strong>of</strong> chromosomes 1, 9 <strong>and</strong>16, <strong>and</strong> <strong>the</strong> repetitive short arms <strong>of</strong> 13, 14, 15, 21 <strong>and</strong> 22 are in black.105 10 15 20 25 30 35 40 45 50 55 60 65 70 75 80 85 90Conserved segment length (Mb)Figure 48 Distribution <strong>of</strong> lengths (in 5-Mb bins) <strong>of</strong> conserved segments between <strong>human</strong><strong>and</strong> mouse <strong>genome</strong>s, omitting singletons.910 © 2001 Macmillan Magazines Ltd NATURE | VOL 409 | 15 FEBRUARY 2001 | www.nature.com
articlesWe also searched for sets <strong>of</strong> four chromosomes where <strong>the</strong>re aremultiple genes with homologues on each <strong>of</strong> <strong>the</strong> four. The strongestexample was chromosomes 2, 7, 12 <strong>and</strong> 17, containing <strong>the</strong> HOXclusters as well as additional genes. These four chromosomes appearto have an excess <strong>of</strong> quadruplicated genes. The genes are not allclustered in a single region; this may re¯ect intrachromosomalrearrangement since <strong>the</strong> duplication <strong>of</strong> <strong>the</strong>se genes, or it mayindicate that <strong>the</strong>y result from several independent events. Of <strong>the</strong>genes with homologues on chromosomes 2, 12 <strong>and</strong> 17, many <strong>of</strong>those missing on chromosome 7 are clustered on chromosome 3,suggesting a translocation. Several additional examples <strong>of</strong> groups <strong>of</strong>four chromosomes were found, although <strong>the</strong>y were connected byfewer homologous genes.Although <strong>the</strong> analyses are sensitive to <strong>the</strong> imperfect quality <strong>of</strong> <strong>the</strong>gene predictions, our results so far are insuf®cient to settle whe<strong>the</strong>rtwo rounds <strong>of</strong> WGD occurred around 500 Myr ago. It may bepossible to resolve <strong>the</strong> issue by systematically estimating <strong>the</strong> time <strong>of</strong>each <strong>of</strong> <strong>the</strong> many gene duplication events on <strong>the</strong> basis <strong>of</strong> sequencedivergence, although this is beyond <strong>the</strong> scope <strong>of</strong> this report. Ano<strong>the</strong>rapproach to determining whe<strong>the</strong>r a widespread duplicationoccurred at a particular time in vertebrate evolution would be tosequence <strong>the</strong> <strong>genome</strong>s <strong>of</strong> organisms whose lineages diverged fromvertebrates at appropriate times, such as amphioxus.Recent history from <strong>human</strong> polymorphismThe recent history <strong>of</strong> genomic segments can be probed by studying<strong>the</strong> properties <strong>of</strong> SNPs segregating in <strong>the</strong> current <strong>human</strong> population.The sequence information generated in <strong>the</strong> course <strong>of</strong> thisproject has yielded a huge collection <strong>of</strong> SNPs. These SNPs wereextracted in two ways: by comparing overlapping large-insert clonesderived from distinct haplotypes (ei<strong>the</strong>r different individuals ordifferent chromosomes within an individual) <strong>and</strong> by comparingr<strong>and</strong>om reads from whole-<strong>genome</strong> shotgun libraries derived frommultiple individuals. The <strong>analysis</strong> con®rms an average heterozygosityrate in <strong>the</strong> <strong>human</strong> population <strong>of</strong> about 1 in 1,300 bp (ref. 97).More than 1.42 million SNPs have been assembled into a<strong>genome</strong>-wide map <strong>and</strong> are analysed in detail in an accompanyingpaper 97 . SNP density is also displayed across <strong>the</strong> <strong>genome</strong> in Fig. 9.The SNPs have an average spacing <strong>of</strong> 1.9 kb <strong>and</strong> 63% <strong>of</strong> 5-kbintervals contain a SNP. These polymorphisms are <strong>of</strong> immediateutility for medical genetic studies. Whereas investigators studying agene previously had to expend considerable effort to discoverpolymorphisms across <strong>the</strong> region <strong>of</strong> interest, <strong>the</strong> current collectionnow provides <strong>the</strong>n with about 15 SNPs for gene loci <strong>of</strong> average size.The density <strong>of</strong> SNPs (adjusted for ascertainmentÐthat is, polymorphismsper base screened) varies considerably across <strong>the</strong>Frequency1,4001,2001,0008006004002000Human(x):Fly(1):Worm(1)1 2 3 4 5 6 7 8 9 10 11+No. <strong>of</strong> <strong>human</strong> paraloguesFigure 49 Number <strong>of</strong> <strong>human</strong> paralogues <strong>of</strong> genes having single orthologues in worm <strong>and</strong>¯y.<strong>genome</strong> 97 <strong>and</strong> sheds light on <strong>the</strong> unique properties <strong>and</strong> history <strong>of</strong>each genomic region. The average heterozygosity at a locus willtend to increase in proportion to <strong>the</strong> local mutation rate <strong>and</strong> <strong>the</strong>`age' <strong>of</strong> <strong>the</strong> locus (which can be de®ned as <strong>the</strong> average number <strong>of</strong>generations since <strong>the</strong> most recent common ancestor <strong>of</strong> two r<strong>and</strong>omlychosen copies in <strong>the</strong> population). For example, positiveselection can cause a locus to be unusually `young' <strong>and</strong> balancingselection can cause it to be unusually `old'. An extreme example is<strong>the</strong> HLA region, in which a high SNP density is observed, re¯ecting<strong>the</strong> fact that diverse HLA haplotypes have been maintained formany millions <strong>of</strong> years by balancing selection <strong>and</strong> greatly predate<strong>the</strong> origin <strong>of</strong> <strong>the</strong> <strong>human</strong> species.SNPs can also be used to study linkage disequilibrium in <strong>the</strong><strong>human</strong> <strong>genome</strong> 376 . Linkage disequilibrium refers to <strong>the</strong> persistence<strong>of</strong> ancestral haplotypesÐthat is, genomic segments carrying particularcombinations <strong>of</strong> alleles descended from a common ancestor. Itcan provide a powerful tool for mapping disease genes 377,378 <strong>and</strong> forprobing population history 379±381 . There has been considerablycontroversy concerning <strong>the</strong> typical distance over which linkagedisequilibrium extends in <strong>the</strong> <strong>human</strong> <strong>genome</strong> 382±387 . With <strong>the</strong>collection <strong>of</strong> SNPs now available, it should be possible to resolvethis important issue.Applications to medicine <strong>and</strong> biologyIn most research papers, <strong>the</strong> authors can only speculate about futureapplications <strong>of</strong> <strong>the</strong> work. Because <strong>the</strong> <strong>genome</strong> sequence has beenreleased on a daily basis over <strong>the</strong> past four years, however, we canalready cite many direct applications. We focus on a h<strong>and</strong>ful <strong>of</strong>applications chosen primarily from medical research.Disease genesA key application <strong>of</strong> <strong>human</strong> <strong>genome</strong> research has been <strong>the</strong> ability to®nd disease genes <strong>of</strong> unknown biochemical function by positionalcloning 388 . This method involves mapping <strong>the</strong> chromosomal regioncontaining <strong>the</strong> gene by linkage <strong>analysis</strong> in affected families <strong>and</strong> <strong>the</strong>nscouring <strong>the</strong> region to ®nd <strong>the</strong> gene itself. Positional cloning ispowerful, but it has also been extremely tedious. When <strong>the</strong>approach was ®rst proposed in <strong>the</strong> early 1980s 9 , a researcher wishingto perform positional cloning had to generate genetic markers totrace inheritance; perform chromosomal walking to obtain genomicDNA covering <strong>the</strong> region; <strong>and</strong> analyse a region <strong>of</strong> around 1 Mb byei<strong>the</strong>r direct <strong>sequencing</strong> or indirect gene identi®cation methods.The ®rst two barriers were eliminated with <strong>the</strong> development in <strong>the</strong>mid-1990s <strong>of</strong> comprehensive genetic <strong>and</strong> physical maps <strong>of</strong> <strong>the</strong><strong>human</strong> chromosomes, under <strong>the</strong> auspices <strong>of</strong> <strong>the</strong> Human GenomeProject. The remaining barrier, however, has continued to beformidable.All that is changing with <strong>the</strong> availability <strong>of</strong> <strong>the</strong> <strong>human</strong> draft<strong>genome</strong> sequence. The <strong>human</strong> genomic sequence in public databasesallows rapid identi®cation in silico <strong>of</strong> c<strong>and</strong>idate genes, followedby mutation screening <strong>of</strong> relevant c<strong>and</strong>idates, aided byinformation on gene structure. For a mendelian disorder, a genesearch can now <strong>of</strong>ten be carried out in a matter <strong>of</strong> months with onlya modestly sized team.At least 30 disease genes 55,389±422 (Table 26) have been positionallycloned in research efforts that depended directly on <strong>the</strong> publiclyavailable <strong>genome</strong> sequence. As most <strong>of</strong> <strong>the</strong> <strong>human</strong> sequence hasonly arrived in <strong>the</strong> past twelve months, it is likely that many similardiscoveries are not yet published. In addition, <strong>the</strong>re are many casesin which <strong>the</strong> <strong>genome</strong> sequence played a supporting role, such asproviding c<strong>and</strong>idate microsatellite markers for ®ner genetic linkage<strong>analysis</strong>.The <strong>genome</strong> sequence has also helped to reveal <strong>the</strong> mechanismsleading to some common chromosomal deletion syndromes. Inseveral instances, recurrent deletions have been found to result fromhomologous recombination <strong>and</strong> unequal crossing over betweenlarge, nearly identical intrachromosomal duplications. ExamplesNATURE | VOL 409 | 15 FEBRUARY 2001 | www.nature.com © 2001 Macmillan Magazines Ltd911
articlesinclude <strong>the</strong> DiGeorge/velocardi<strong>of</strong>acial syndrome region on chromosome22 (ref. 238) <strong>and</strong> <strong>the</strong> Williams±Beuren syndrome recurrentdeletion on chromosome 7 (ref. 239).The availability <strong>of</strong> <strong>the</strong> <strong>genome</strong> sequence also allows rapid identi-®cation <strong>of</strong> paralogues <strong>of</strong> disease genes, which is valuable for tworeasons. First, mutations in a paralogous gene may give rise to arelated genetic disease. A good example, discovered through use <strong>of</strong><strong>the</strong> <strong>genome</strong> sequence, is achromatopsia (complete colour blindness).The CNGA3 gene, encoding <strong>the</strong> a-subunit <strong>of</strong> <strong>the</strong> conephotoreceptor cyclic GMP-gated channel, had been shown toharbour mutations in some families with achromatopsia. Computationalsearching <strong>of</strong> <strong>the</strong> <strong>genome</strong> sequences revealed <strong>the</strong> paralogousgene encoding <strong>the</strong> corresponding b-subunit, CNGB3 (which hadnot been apparent from EST databases). The CNGB3 gene wasrapidly shown to be <strong>the</strong> cause <strong>of</strong> achromatopsia in o<strong>the</strong>rfamilies 407,408 . Ano<strong>the</strong>r example is provided by <strong>the</strong> presenilin-1<strong>and</strong> presenilin-2 genes, in which mutations can cause early-onsetAlzheimer's disease 423,424 . Second, <strong>the</strong> paralogue may provide anopportunity for <strong>the</strong>rapeutic intervention, as exempli®ed byattempts to reactivate <strong>the</strong> fetally expressed haemoglobin genes inindividuals with sickle cell disease or b-thalassaemia, caused bymutations in <strong>the</strong> b-globin gene 425 .We undertook a systematic search for paralogues <strong>of</strong> 971 known<strong>human</strong> disease genes with entries in both <strong>the</strong> Online MendelianInheritance in Man (OMIM) database (http://www.ncbi.nlm.nih.gov/Omim/) <strong>and</strong> ei<strong>the</strong>r <strong>the</strong> SwissProt or TrEMBL protein databases.We identi®ed 286 potential paralogues (with <strong>the</strong> requirement <strong>of</strong> amatch <strong>of</strong> at least 50 amino acids with identity greater than 70% butless than 90% if on <strong>the</strong> same chromosome, <strong>and</strong> less than 95% if on adifferent chromosome). Although this <strong>analysis</strong> may have identi®edsome pseudogenes, 89% <strong>of</strong> <strong>the</strong> matches showed homology overmore than one exon in <strong>the</strong> new target sequence, suggesting thatmany are functional. This <strong>analysis</strong> shows <strong>the</strong> potential for rapididenti®cation <strong>of</strong> disease gene paralogues in silico.Drug targetsOver <strong>the</strong> past century, <strong>the</strong> pharmaceutical industry has largelydepended upon a limited set <strong>of</strong> drug targets to develop newTable 26 Disease genes positionally cloned using <strong>the</strong> draft <strong>genome</strong>sequenceLocus Disorder Reference(s)BRCA2 Breast cancer susceptibility 55AIREAutoimmune polygl<strong>and</strong>ular syndrome type 1 (APS1 389or APECED)PEX1 Peroxisome biogenesis disorder 390, 391PDS Pendred syndrome 392XLP X-linked lymphoproliferative disease 393DFNA5 Nonsyndromic deafness 394ATP2A2 Darier's disease 395SEDL X-linked spondyloepiphyseal dysplasia tarda 396WISP3 Progressive pseudorheumatoid dysplasia 397CCM1 Cerebral cavernous malformations 398, 399COL11A2/DFNA13 Nonsyndromic deafness 400LGMD 2G Limb-girdle muscular dystrophy 401EVCEllis-Van Creveld syndrome, Weyer's acrodental 402dysostosisACTN4 Familial focal segmental glomerulosclerosis 403SCN1A Generalized epilepsy with febrile seizures plus type 2 404AASS Familial hyperlysinaemia 405NDRG1 Hereditary motor <strong>and</strong> sensory neuropathy-Lom 406CNGB3 Total colour-blindness 407, 408MUL Mulibrey nanism 409USH1C Usher type 1C 410, 411MYH9 May-Hegglin anomaly 412, 413PRKAR1A Carney's complex 414MYH9 Nonsyndromic hereditary deafness DFNA17 415SCA10 Spinocerebellar ataxia type 10 416OPA1 Optic atrophy 417XLCSNB X-linked congenital stationary night blindness 418FGF23 Hypophosphataemic rickets 419GAN Giant axonal neuropathy 420AAAS Triple-A syndrome 421HSPG2 Schwartz-Jampel syndrome 422.............................................................................................................................................................................<strong>the</strong>rapies. A recent compendium 426,427 lists 483 drug targets asaccounting for virtually all drugs on <strong>the</strong> market. Knowing <strong>the</strong>complete set <strong>of</strong> <strong>human</strong> genes <strong>and</strong> proteins will greatly exp<strong>and</strong> <strong>the</strong>search for suitable drug targets. Although only a minority <strong>of</strong> <strong>human</strong>genes may be drug targets, it has been predicted that <strong>the</strong> number willexceed several thous<strong>and</strong>, <strong>and</strong> this prospect has led to a massiveexpansion <strong>of</strong> genomic research in pharmaceutical research <strong>and</strong>development. A few examples will illustrate <strong>the</strong> point.(1) The neurotransmitter serotonin (5-HT) mediates rapid excitatoryresponses through lig<strong>and</strong>-gated channels. The previouslyidenti®ed 5-HT 3A receptor gene produces functional receptors,but with a much smaller conductance than observed in vivo.Cross-hybridization experiments <strong>and</strong> <strong>analysis</strong> <strong>of</strong> ESTs failed toreveal any o<strong>the</strong>r homologues <strong>of</strong> <strong>the</strong> known receptor. Recently,however, by searching <strong>the</strong> <strong>human</strong> draft <strong>genome</strong> sequence at lowstringency, a putative homologue was identi®ed within a PAC clonefrom <strong>the</strong> long arm <strong>of</strong> chromosome 11 (ref. 428). The homologuewas shown to be expressed in <strong>the</strong> amygdala, caudate <strong>and</strong> hippocampus,<strong>and</strong> a full-length cDNA was subsequently obtained. Thegene, which codes for a serotonin receptor, was named 5-HT 3B .When assembled in a heterodimer with 5-HT 3A , it was shown toaccount for <strong>the</strong> large-conductance neuronal serotonin channel.Given <strong>the</strong> central role <strong>of</strong> <strong>the</strong> serotonin pathway in mood disorders<strong>and</strong> schizophrenia, <strong>the</strong> discovery <strong>of</strong> a major new <strong>the</strong>rapeutic targetis <strong>of</strong> considerable interest.(2) The contractile <strong>and</strong> in¯ammatory actions <strong>of</strong> <strong>the</strong> cysteinylleukotrienes, formerly known as <strong>the</strong> slow reacting substance <strong>of</strong>anaphylaxis (SRS-A), are mediated through speci®c receptors. Thesecond such receptor, CysLT 2 , was identi®ed using <strong>the</strong> combination<strong>of</strong> a rat EST <strong>and</strong> <strong>the</strong> <strong>human</strong> <strong>genome</strong> sequence. This led to <strong>the</strong>cloning <strong>of</strong> a gene with 38% amino-acid identity to <strong>the</strong> only o<strong>the</strong>rreceptor that had previously been identi®ed 429 . This new receptor,which shows high-af®nity binding to several leukotrienes, maps to aregion <strong>of</strong> chromosome 13 that is linked to atopic asthma. The geneis expressed in airway smooth muscles <strong>and</strong> in <strong>the</strong> heart. As <strong>the</strong>leukotriene pathway has been a signi®cant target for <strong>the</strong> development<strong>of</strong> drugs against asthma, <strong>the</strong> discovery <strong>of</strong> a new receptor hasobvious <strong>and</strong> important consequences.(3) Abundant deposition <strong>of</strong> b-amyloid in senile plaques is <strong>the</strong>hallmark <strong>of</strong> Alzheimer's disease. b-Amyloid is generated by proteolyticprocessing <strong>of</strong> <strong>the</strong> amyloid precursor protein (APP). One <strong>of</strong><strong>the</strong> enzymes involved is <strong>the</strong> b-site APP-cleaving enzyme (BACE),which is a transmembrane aspartyl protease. Computationalsearching <strong>of</strong> <strong>the</strong> public <strong>human</strong> draft <strong>genome</strong> sequence recentlyidenti®ed a new sequence homologous to BACE, encoding a proteinnow named BACE2 430,431 . BACE2, which has 52% amino-acidsequence identity to BACE, contains two active protease sites <strong>and</strong>maps to <strong>the</strong> obligatory Down's syndrome region <strong>of</strong> chromosome 21,as does APP. This raises <strong>the</strong> question <strong>of</strong> whe<strong>the</strong>r <strong>the</strong> extra copies <strong>of</strong>both BACE2 <strong>and</strong> APP may contribute to accelerated deposition <strong>of</strong>b-amyloid in <strong>the</strong> brains <strong>of</strong> Down's syndrome patients. The development<strong>of</strong> antagonists to BACE <strong>and</strong> BACE2 represents a promisingapproach to preventing Alzheimer's disease.Given <strong>the</strong>se examples, we undertook a systematic effort toidentify paralogues <strong>of</strong> <strong>the</strong> classic drug target proteins in <strong>the</strong> draft<strong>genome</strong> sequence. The target list 427 was used to identify 603 entriesin <strong>the</strong> SwissProt database with unique accession numbers. Thesewere <strong>the</strong>n searched against <strong>the</strong> current <strong>genome</strong> sequence database,using <strong>the</strong> requirement that a match should have 70±100% identityto at least 50 amino acids. Matches to named proteins were ignored,as we assumed that <strong>the</strong>se represented known homologues.We found 18 putative novel paralogues (Table 27), includingapparent dopamine receptors, purinergic receptors <strong>and</strong> insulin-likegrowth factor receptors. In six cases, <strong>the</strong> novel paralogue matches atleast one EST, adding con®dence that this search process canidentify novel functional genes. For <strong>the</strong> remaining 12 putativeparalogues without an EST match, all have long ORFs <strong>and</strong> all but912 © 2001 Macmillan Magazines Ltd NATURE | VOL 409 | 15 FEBRUARY 2001 | www.nature.com
articlesone show similarity spanning multiple exons separated by introns,so <strong>the</strong>se are not processed pseudogenes. They are likely to representinteresting new c<strong>and</strong>idate drug targets.Basic biologyAlthough <strong>the</strong> examples above re¯ect medical applications, <strong>the</strong>re arealso many similar applications to basic physiology <strong>and</strong> cell biology.To cite one satisfying example, <strong>the</strong> publicly available sequence wasused to solve a mystery that had vexed investigators for severaldecades: <strong>the</strong> molecular basis <strong>of</strong> bitter taste 432 . Humans <strong>and</strong> o<strong>the</strong>ranimals are polymorphic for response to certain bitter tastes.Recently, investigators mapped this trait in both <strong>human</strong>s <strong>and</strong>mice <strong>and</strong> <strong>the</strong>n searched <strong>the</strong> relevant region <strong>of</strong> <strong>the</strong> <strong>human</strong> draft<strong>genome</strong> sequence for G-protein coupled receptors. These studiesled, in quick succession, to <strong>the</strong> discovery <strong>of</strong> a new family <strong>of</strong> suchproteins, <strong>the</strong> demonstration that <strong>the</strong>y are expressed almost exclusivelyin taste buds, <strong>and</strong> <strong>the</strong> experimental con®rmation that <strong>the</strong>receptors in cultured cells respond to speci®c bitter substances 433±435 .The next stepsConsiderable progress has been made in <strong>human</strong> <strong>sequencing</strong>, butmuch remains to be done to produce a ®nished sequence. Evenmore work will be required to extract <strong>the</strong> full information containedin <strong>the</strong> sequence. Many <strong>of</strong> <strong>the</strong> key next steps are already underway.Finishing <strong>the</strong> <strong>human</strong> sequenceThe <strong>human</strong> sequence will serve as a foundation for biomedicalresearch in <strong>the</strong> years ahead, <strong>and</strong> it is thus crucial that <strong>the</strong> remaininggaps be ®lled <strong>and</strong> ambiguities be resolved as quickly as possible. Thiswill involve a three-step program.The ®rst stage involves producing ®nished sequence from clonesspanning <strong>the</strong> current physical map, which covers more than 96% <strong>of</strong><strong>the</strong> euchromatic regions <strong>of</strong> <strong>the</strong> <strong>genome</strong>. About 1 Gb <strong>of</strong> ®nishedsequence is already completed. Almost all <strong>of</strong> <strong>the</strong> remaining clonesare already sequenced to at least draft coverage, <strong>and</strong> <strong>the</strong> rest havebeen selected for <strong>sequencing</strong>. All clones are expected to reach `fullshotgun' coverage (8±10-fold redundancy) by about mid-2001 <strong>and</strong>®nished form (99.99% accuracy) not long <strong>the</strong>reafter, using established<strong>and</strong> increasingly automated protocols.The next stage will be to screen additional libraries to close gapsbetween clone contigs. Directed probing <strong>of</strong> additional large-insertclone libraries should close many <strong>of</strong> <strong>the</strong> remaining gaps. Unclosedgaps will be sized by FISH techniques or o<strong>the</strong>r methods. Twochromosomes, 22 <strong>and</strong> 21, have already been assembled in this`essentially complete' form in this manner 93,94 , <strong>and</strong> chromosomes20, Y, 19, 14 <strong>and</strong> 7 are likely to reach this status in <strong>the</strong> next fewmonths. All chromosomes should be essentially completed by 2003,if not sooner.Finally, techniques must be developed to close recalcitrant gaps.Several hundred such gaps in <strong>the</strong> euchromatic sequence willprobably remain in <strong>the</strong> <strong>genome</strong> after exhaustive screening <strong>of</strong>existing large-insert libraries. New methodologies will be neededto recover sequence from <strong>the</strong>se segments, <strong>and</strong> to de®ne biologicalreasons for <strong>the</strong>ir lack <strong>of</strong> representation in st<strong>and</strong>ard libraries. Ideally,it would be desirable to obtain complete sequence from all heterochromaticregions, such as centromeres <strong>and</strong> ribosomal gene clusters,although most <strong>of</strong> this sequence will consist <strong>of</strong> highlypolymorphic t<strong>and</strong>em repeats containing few protein-coding genes.Developing <strong>the</strong> IGI <strong>and</strong> IPIThe draft <strong>genome</strong> sequence has provided an initial look at <strong>the</strong><strong>human</strong> gene content, but many ambiguities remain. A high prioritywill be to re®ne <strong>the</strong> IGI <strong>and</strong> IPI to <strong>the</strong> point where <strong>the</strong>y accuratelyre¯ect every gene <strong>and</strong> every alternatively spliced form. Several stepsare needed to reach this ambitious goal.Finishing <strong>the</strong> <strong>human</strong> sequence will assist in this effort, but <strong>the</strong>experiences gained on chromosomes 21 <strong>and</strong> 22 show that sequencealone is not enough to allow complete gene identi®cation. Onepowerful approach is cross-species sequence comparison withrelated organisms at suitable evolutionary distances. The sequencecoverage from <strong>the</strong> puffer®sh T. nigroviridis has already provenvaluable in identifying potential exons 292 ; this work is expected tocontinue from its current state <strong>of</strong> onefold coverage to reach at least®vefold coverage later this year. The <strong>genome</strong> sequence <strong>of</strong> <strong>the</strong>laboratory mouse will provide a particularly powerful tool forexon identi®cation, as sequence similarity is expected to identify95±97% <strong>of</strong> <strong>the</strong> exons, as well as a signi®cant number <strong>of</strong> regulatorydomains 436±438 . A public-private consortium is speeding this effort,by producing freely accessible whole-<strong>genome</strong> shotgun coverage thatcan be readily used for cross-species comparison 439 . More thanonefold coverage from <strong>the</strong> C57BL/6J strain has already beencompleted <strong>and</strong> threefold is expected within <strong>the</strong> next few months.In <strong>the</strong> slightly longer term, a program is under way to produce a®nished sequence <strong>of</strong> <strong>the</strong> laboratory mouse.Ano<strong>the</strong>r important step is to obtain a comprehensive collection<strong>of</strong> full-length <strong>human</strong> cDNAs, both as sequences <strong>and</strong> as actual clones.The Mammalian Gene Collection project has been underway for ayear 18 <strong>and</strong> expects to produce 10,000±15,000 <strong>human</strong> full-lengthcDNAs over <strong>the</strong> coming year, which will be available withoutrestrictions on use. The Genome Exploration Group <strong>of</strong> <strong>the</strong>RIKEN Genomic Sciences Center is similarly developing a collection<strong>of</strong> cDNA clones from mouse 309 , which is a valuable complementTable 27 New paralogues <strong>of</strong> common drug targets identi®ed by searching <strong>the</strong> draft <strong>human</strong> <strong>genome</strong> sequenceDrug target Drug target Novel match IGInumberHGM symbolSwissProtaccessionChromosomeChromosomecontainingparaloguePer centidentitydbEST GenBankaccessionAquaporin 7 AQP7 O14520 9 IGI_M1_ctg15869_11 2 92.3 AW593324Arachidonate 12-lipoxygenase ALOX12 P18054 17 IGI_M1_ctg17216_23 17 70.1Calcitonin CALCA P01258 11 IGI_M1_ctg14138_20 12 93.6Calcium channel, voltage-dependent, g-subunit CACNG2 Q9Y698 22 IGI_M1_ctg17137_10 19 70.7DNA polymerase-d, small subunit POLD2 P49005 7 IGI_M1_ctg12903_29 5 86.8Dopamine receptor, D1-a DRD1 P21728 5 IGI_M1_ctg25203_33 16 70.7Dopamine receptor, D1-b DRD5 P21918 4 IGI_M1_ctg17190_14 1 88.0 AI148329Eukaryotic translation elongation factor, 1d EEF1D P29692 2 IGI_M1_ctg16401_37 17 77.6 BE719683FKBP, tacrolimus binding protein, FK506 binding protein FKBP1B Q16645 2 IGI_M1_ctg14291_56 6 79.4Glutamic acid decarboxylase GAD1 Q99259 2 IGI_M1_ctg12341_103 18 70.5Glycine receptor, a1 GLRA1 P23415 5 IGI_M1_ctg16547_14 X 85.5Heparan N-deacetylase/N-sulphotransferase NDST1 P52848 5 IGI_M1_ctg13263_18 4 81.5Insulin-like growth factor-1 receptor IGF1R P08069 15 IGI_M1_ctg18444_3 19 71.8Na,K-ATPase, a-subunit ATP1A1 P05023 1 IGI_M1_ctg14877_54 1 83Purinergic receptor 7 (P2X), lig<strong>and</strong>-gated ion channel P2RX7 Q99572 12 IGI_M1_ctg15140_15 12 80.3 H84353Tubulin, e-chain TUBE* Q9UJT0 6 IGI_M1_ctg13826_4 5 78.5 AA970498Tubulin, x-chain TUBG1 P23258 17 IGI_M1_ctg12599_5 7 84.0Voltage-gated potassium channel, KV3.3 KCNC3 Q14003 19 IGI_M1_ctg13492_5 12 80.1 H49142...................................................................................................................................................................................................................................................................................................................................................................* HGM symbol unknown.NATURE | VOL 409 | 15 FEBRUARY 2001 | www.nature.com © 2001 Macmillan Magazines Ltd913
articlesbecause <strong>of</strong> <strong>the</strong> availability <strong>of</strong> tissues from all developmental timepoints. A challenge will be to de®ne <strong>the</strong> gene-speci®c patterns <strong>of</strong>alternative splicing, which may affect half <strong>of</strong> <strong>human</strong> genes. Existingcollections <strong>of</strong> ESTs <strong>and</strong> cDNAs may allow identi®cation <strong>of</strong> <strong>the</strong> mostabundant <strong>of</strong> <strong>the</strong>se is<strong>of</strong>orms, but systematic exploration <strong>of</strong> thisproblem may require exhaustive <strong>analysis</strong> <strong>of</strong> cDNA libraries frommultiple tissues or perhaps high-throughput reverse transcription±PCR studies. Deep underst<strong>and</strong>ing <strong>of</strong> gene function will probablyrequire knowledge <strong>of</strong> <strong>the</strong> structure, tissue distribution <strong>and</strong> abundance<strong>of</strong> <strong>the</strong>se alternative forms.Large-scale identi®cation <strong>of</strong> regulatory regionsThe one-dimensional script <strong>of</strong> <strong>the</strong> <strong>human</strong> <strong>genome</strong>, shared byessentially all cells in all tissues, contains suf®cient information toprovide for differentiation <strong>of</strong> hundreds <strong>of</strong> different cell types, <strong>and</strong><strong>the</strong> ability to respond to a vast array <strong>of</strong> internal <strong>and</strong> externalin¯uences. Much <strong>of</strong> this plasticity results from <strong>the</strong> carefully orchestratedsymphony <strong>of</strong> transcriptional regulation. Although much hasbeen learned about <strong>the</strong> cis-acting regulatory motifs <strong>of</strong> some speci®cgenes, <strong>the</strong> regulatory signals for most genes remain uncharacterized.Comparative genomics <strong>of</strong> multiple vertebrates <strong>of</strong>fers <strong>the</strong> best hopefor large-scale identi®cation <strong>of</strong> such regulatory sites 440 . Previousstudies <strong>of</strong> sequence alignment <strong>of</strong> regulatory domains <strong>of</strong> orthologousgenes in multiple species has shown a remarkablecorrelation between sequence conservation, dubbed `phylogeneticfootprints' 441 , <strong>and</strong> <strong>the</strong> presence <strong>of</strong> binding motifs for transcriptionfactors. This approach could be particularly powerful if combinedwith expression array technologies that identify cohorts <strong>of</strong> genesthat are coordinately regulated, implicating a common set <strong>of</strong> cisactingregulatory sequences 442±445 . It will also be <strong>of</strong> considerableinterest to study epigenetic modi®cations such as cytosine methylationon a <strong>genome</strong>-wide scale, <strong>and</strong> to determine <strong>the</strong>ir biologicalconsequences 446,447 . Towards this end, a pilot Human Epi<strong>genome</strong>Project has been launched 448,449 .Sequencing <strong>of</strong> additional large <strong>genome</strong>sMore generally, comparative genomics allows biologists to peruseevolution's laboratory notebookÐto identify conserved functionalfeatures <strong>and</strong> recognize new innovations in speci®c lineages. Determination<strong>of</strong> <strong>the</strong> <strong>genome</strong> sequence <strong>of</strong> many organisms is verydesirable. Already, projects are underway to sequence <strong>the</strong> <strong>genome</strong>s<strong>of</strong> <strong>the</strong> mouse, rat, zebra®sh <strong>and</strong> <strong>the</strong> puffer®shes T. nigroviridis <strong>and</strong>Takifugu rubripes. Plans are also under consideration for <strong>sequencing</strong>additional primates <strong>and</strong> o<strong>the</strong>r organisms that will help de®ne keydevelopments along <strong>the</strong> vertebrate <strong>and</strong> nonvertebrate lineages.To realize <strong>the</strong> full promise <strong>of</strong> comparative genomics, however, itneeds to become simple <strong>and</strong> inexpensive to sequence <strong>the</strong> <strong>genome</strong> <strong>of</strong>any organism. Sequencing costs have dropped 100-fold over <strong>the</strong> last10 years, corresponding to a roughly tw<strong>of</strong>old decrease every 18months. This rate is similar to `Moore's law' concerning improvementsin semiconductor manufacture. In both <strong>sequencing</strong> <strong>and</strong>semiconductors, such improvement does not happen automatically,but requires aggressive technological innovation fuelled by majorinvestment. Improvements are needed to move current dideoxy<strong>sequencing</strong> to smaller volumes <strong>and</strong> more rapid <strong>sequencing</strong>times, based upon advances such as microchannel technology.More revolutionary methods, such as mass spectrometry, singlemolecule<strong>sequencing</strong> <strong>and</strong> nanopore approaches 76 , have not yetbeen fully developed, but hold great promise <strong>and</strong> deserve strongencouragement.Completing <strong>the</strong> catalogue <strong>of</strong> <strong>human</strong> variationThe <strong>human</strong> draft <strong>genome</strong> sequence has already allowed <strong>the</strong> identi-®cation <strong>of</strong> more than 1.4 million SNPs, comprising a substantialproportion <strong>of</strong> all common <strong>human</strong> variation. This program shouldbe extended to obtain a nearly complete catalogue <strong>of</strong> commonvariants <strong>and</strong> to identify <strong>the</strong> common ancestral haplotypes present in<strong>the</strong> population. In principle, <strong>the</strong>se genetic tools should make itpossible to perform association studies <strong>and</strong> linkage disequilibriumstudies 376 to identify <strong>the</strong> genes that confer even relatively modest riskfor common diseases. Launching such an intense era <strong>of</strong> <strong>human</strong>molecular epidemiology will also require major advances in <strong>the</strong> costef®ciency <strong>of</strong> genotyping technology, in <strong>the</strong> collection <strong>of</strong> carefullyphenotyped patient cohorts <strong>and</strong> in statistical methods for relatinglarge-scale SNP data to disease phenotype.From sequence to functionThe scienti®c program outlined above focuses on how <strong>the</strong> <strong>genome</strong>sequence can be mined for biological information. In addition, <strong>the</strong>sequence will serve as a foundation for a broad range <strong>of</strong> functionalgenomic tools to help biologists to probe function in a moresystematic manner. These will need to include improved techniques<strong>and</strong> databases for <strong>the</strong> global <strong>analysis</strong> <strong>of</strong>: RNA <strong>and</strong> protein expression,protein localization, protein±protein interactions <strong>and</strong> chemicalinhibition <strong>of</strong> pathways. New computational techniques will beneeded to use such information to model cellular circuitry. A fulldiscussion <strong>of</strong> <strong>the</strong>se important directions is beyond <strong>the</strong> scope <strong>of</strong> thispaper.Concluding thoughtsThe Human Genome Project is but <strong>the</strong> latest increment in aremarkable scienti®c program whose origins stretch back a hundredyears to <strong>the</strong> rediscovery <strong>of</strong> Mendel's laws <strong>and</strong> whose end is nowherein sight. In a sense, it provides a capstone for efforts in <strong>the</strong> pastcentury to discover genetic information <strong>and</strong> a foundation for effortsin <strong>the</strong> coming century to underst<strong>and</strong> it.We ®nd it humbling to gaze upon <strong>the</strong> <strong>human</strong> sequence nowcoming into focus. In principle, <strong>the</strong> string <strong>of</strong> genetic bits holds longsoughtsecrets <strong>of</strong> <strong>human</strong> development, physiology <strong>and</strong> medicine. Inpractice, our ability to transform such information into underst<strong>and</strong>ingremains woefully inadequate. This paper simply recordssome initial observations <strong>and</strong> attempts to frame issues for futurestudy. Ful®lling <strong>the</strong> true promise <strong>of</strong> <strong>the</strong> Human Genome Project willbe <strong>the</strong> work <strong>of</strong> tens <strong>of</strong> thous<strong>and</strong>s <strong>of</strong> scientists around <strong>the</strong> world, inboth academia <strong>and</strong> industry. It is for this reason that our highestpriority has been to ensure that <strong>genome</strong> data are available rapidly,freely <strong>and</strong> without restriction.The scienti®c work will have pr<strong>of</strong>ound long-term consequencesfor medicine, leading to <strong>the</strong> elucidation <strong>of</strong> <strong>the</strong> underlying molecularmechanisms <strong>of</strong> disease <strong>and</strong> <strong>the</strong>reby facilitating <strong>the</strong> design in manycases <strong>of</strong> rational diagnostics <strong>and</strong> <strong>the</strong>rapeutics targeted at thosemechanisms. But <strong>the</strong> science is only part <strong>of</strong> <strong>the</strong> challenge. Wemust also involve society at large in <strong>the</strong> work ahead. We must setrealistic expectations that <strong>the</strong> most important bene®ts will not bereaped overnight. Moreover, underst<strong>and</strong>ing <strong>and</strong> wisdom will berequired to ensure that <strong>the</strong>se bene®ts are implemented broadly <strong>and</strong>equitably. To that end, serious attention must be paid to <strong>the</strong> manyethical, legal <strong>and</strong> social implications (ELSI) raised by <strong>the</strong> acceleratedpace <strong>of</strong> genetic discovery. This paper has focused on <strong>the</strong> scienti®cachievements <strong>of</strong> <strong>the</strong> <strong>human</strong> <strong>genome</strong> <strong>sequencing</strong> efforts. This is not<strong>the</strong> place to engage in a lengthy discussion <strong>of</strong> <strong>the</strong> ELSI issues, whichhave also been a major research focus <strong>of</strong> <strong>the</strong> Human GenomeProject, but <strong>the</strong>se issues are <strong>of</strong> comparable importance <strong>and</strong> couldappropriately ®ll a paper <strong>of</strong> equal length.Finally, it is has not escaped our notice that <strong>the</strong> more we learnabout <strong>the</strong> <strong>human</strong> <strong>genome</strong>, <strong>the</strong> more <strong>the</strong>re is to explore.``We shall not cease from exploration. And <strong>the</strong> end <strong>of</strong> all ourexploring will be to arrive where we started, <strong>and</strong> know <strong>the</strong> place for<strong>the</strong> ®rst time.''ÐT. S. Eliot 450MReceived 7 December 2000; accepted 9 January 2001.1. Correns, C. Untersuchungen uÈber die Xenien bei Zea mays. Berichte der Deutsche BotanischeGesellschaft 17, 410±418 (1899).2. De Vries, H. Sur la loie de disjonction des hybrides. Comptes Rendue Hebdemodaires, Acad. Sci. Paris130, 845±847 (1900).3. von Tschermack, E. Uber KuÈnstliche Kreuzung bei Pisum sativum. Berichte der Deutsche BotanischeGesellschaft 18, 232±239. (1900).4. Sanger, F. et al. Nucleotide sequence <strong>of</strong> bacteriophage F X174 DNA. Nature 265, 687±695 (1977).5. Sanger, F. et al. The nucleotide sequence <strong>of</strong> bacteriophage FX174. J Mol Biol 125, 225±246 (1978).914 NATURE | VOL 409 | 15 FEBRUARY 2001 | www.nature.com© 2001 Macmillan Magazines Ltd
articles6. Sanger, F., Coulson, A. R., Hong, G. F., Hill, D. F. & Petersen, G. B. Nucleotide-sequence <strong>of</strong>bacteriophage Lambda DNA. J. Mol. Biol. 162, 729±773 (1982).7. Fiers, W. et al. Complete nucleotide sequence <strong>of</strong> SV40 DNA. Nature 273, 113±120 (1978).8. Anderson, S. et al. Sequence <strong>and</strong> organization <strong>of</strong> <strong>the</strong> <strong>human</strong> mitochondrial <strong>genome</strong>. Nature 290,457±465 (1981).9. Botstein, D., White, R. L., Skolnick, M. & Davis, R. W. Construction <strong>of</strong> a genetic linkage map in manusing restriction fragment length polymorphisms. Am. J. Hum. Genet. 32, 314±331 (1980).10. Olson, M. V. et al. R<strong>and</strong>om-clone strategy for genomic restriction mapping in yeast. Proc. Natl Acad.Sci. USA 83, 7826±7830 (1986).11. Coulson, A., Sulston, J., Brenner, S. & Karn, J. Toward a physical map <strong>of</strong> <strong>the</strong> <strong>genome</strong> <strong>of</strong> <strong>the</strong> nematodeCaenorhabditis elegans. Proc. Natl Acad. Sci. USA 83, 7821±7825 (1986).12. Putney, S. D., Herlihy, W. C. & Schimmel, P. A new troponin T <strong>and</strong> cDNA clones for 13 differentmuscle proteins, found by shotgun <strong>sequencing</strong>. Nature 302, 718±721 (1983).13. Milner, R. J. & Sutcliffe, J. G. Gene expression in rat brain. Nucleic Acids Res. 11, 5497±5520 (1983).14. Adams, M. D. et al. Complementary DNA <strong>sequencing</strong>: expressed sequence tags <strong>and</strong> <strong>human</strong> <strong>genome</strong>project. Science 252, 1651±1656 (1991).15. Adams, M. D. et al. <strong>Initial</strong> assessment <strong>of</strong> <strong>human</strong> gene diversity <strong>and</strong> expression patterns based upon83 million nucleotides <strong>of</strong> cDNA sequence. Nature 377, 3±174 (1995).16. Okubo, K. et al. Large scale cDNA <strong>sequencing</strong> for <strong>analysis</strong> <strong>of</strong> quantitative <strong>and</strong> qualitative aspects <strong>of</strong>gene expression. Nature Genet. 2, 173±179 (1992).17. Hillier, L. D. et al. Generation <strong>and</strong> <strong>analysis</strong> <strong>of</strong> 280,000 <strong>human</strong> expressed sequence tags. Genome Res.6, 807±828 (1996).18. Strausberg, R. L., Feingold, E. A., Klausner, R. D. & Collins, F. S. The mammalian gene collection.Science 286, 455±457 (1999).19. Berry, R. et al. Gene-based sequence-tagged-sites (STSs) as <strong>the</strong> basis for a <strong>human</strong> gene map. NatureGenet. 10, 415±423 (1995).20. Houlgatte, R. et al. The Genexpress Index: a resource for gene discovery <strong>and</strong> <strong>the</strong> genic map <strong>of</strong> <strong>the</strong><strong>human</strong> <strong>genome</strong>. Genome Res. 5, 272±304 (1995).21. Sinsheimer, R. L. The Santa Cruz WorkshopÐMay 1985. Genomics 5, 954±956 (1989).22. Palca, J. Human <strong>genome</strong>ÐDepartment <strong>of</strong> Energy on <strong>the</strong> map. Nature 321, 371 (1986).23. National Research Council Mapping <strong>and</strong> Sequencing <strong>the</strong> Human Genome (National Academy Press,Washington DC, 1988).24. Bishop, J. E. & Waldholz, M. Genome (Simon <strong>and</strong> Schuster, New York, 1990).25. Kevles, D. J. & Hood, L. (eds) The Code <strong>of</strong> Codes: Scienti®c <strong>and</strong> Social Issues in <strong>the</strong> Human GenomeProject (Harvard Univ. Press, Cambridge, Massachusetts, 1992).26. Cook-Deegan, R. The Gene Wars: Science, Politics, <strong>and</strong> <strong>the</strong> Human Genome (W. W. Norton & Co.,New York, London, 1994).27. Donis-Keller, H. et al. A genetic linkage map <strong>of</strong> <strong>the</strong> <strong>human</strong> <strong>genome</strong>. Cell 51, 319±337 (1987).28. Gyapay, G. et al. The 1993±94 Genethon <strong>human</strong> genetic linkage map. Nature Genet. 7, 246±339(1994).29. Hudson, T. J. et al. An STS-based map <strong>of</strong> <strong>the</strong> <strong>human</strong> <strong>genome</strong>. Science 270, 1945±1954 (1995).30. Dietrich, W. F. et al. A comprehensive genetic map <strong>of</strong> <strong>the</strong> mouse <strong>genome</strong>. Nature 380, 149±152(1996).31. Nusbaum, C. et al. A YAC-based physical map <strong>of</strong> <strong>the</strong> mouse <strong>genome</strong>. Nature Genet. 22, 388±393(1999).32. Oliver, S. G. et al. The complete DNA sequence <strong>of</strong> yeast chromosome III. Nature 357, 38±46 (1992).33. Wilson, R. et al. 2.2 Mb <strong>of</strong> contiguous nucleotide sequence from chromosome III <strong>of</strong> C. elegans.Nature 368, 32±38 (1994).34. Chen, E. Y. et al. The <strong>human</strong> growth hormone locus: nucleotide sequence, biology, <strong>and</strong> evolution.Genomics 4, 479±497 (1989).35. McCombie, W. R. et al. Expressed genes, Alu repeats <strong>and</strong> polymorphisms in cosmids sequencedfrom chromosome 4p16.3. Nature Genet. 1, 348±353 (1992).36. Martin-Gallardo, A. et al. Automated DNA <strong>sequencing</strong> <strong>and</strong> <strong>analysis</strong> <strong>of</strong> 106 kilobases from <strong>human</strong>chromosome 19q13.3. Nature Genet. 1, 34±39 (1992).37. Edwards, A. et al. Automated DNA <strong>sequencing</strong> <strong>of</strong> <strong>the</strong> <strong>human</strong> HPRT locus. Genomics 6, 593±608(1990).38. Marshall, E. A strategy for <strong>sequencing</strong> <strong>the</strong> <strong>genome</strong> 5 years early. Science 267, 783±784 (1995).39. Project to sequence <strong>human</strong> <strong>genome</strong> moves on to <strong>the</strong> starting blocks. Nature 375, 93±94 (1995).40. Shizuya, H. et al. Cloning <strong>and</strong> stable maintenance <strong>of</strong> 300-kilobase-pair fragments <strong>of</strong> <strong>human</strong> DNA inEscherichia coli using an F-factor-based vector. Proc. Natl Acad. Sci. USA 89, 8794±8797 (1992).41. Burke, D. T., Carle, G. F. & Olson, M. V. Cloning <strong>of</strong> large segments <strong>of</strong> exogenous DNA into yeast bymeans <strong>of</strong> arti®cial chromosome vectors. Science 236, 806±812 (1987).42. Marshall, E. A second private <strong>genome</strong> project. Science 281, 1121 (1998).43. Marshall, E. NIH to produce a `working draft' <strong>of</strong> <strong>the</strong> <strong>genome</strong> by 2001. Science 281, 1774±1775(1998).44. Pennisi, E. Academic sequencers challenge Celera in a sprint to <strong>the</strong> ®nish. Science 283, 1822±1823(1999).45. Bouck, J., Miller, W., Gorrell, J. H., Muzny, D. & Gibbs, R. A. Analysis <strong>of</strong> <strong>the</strong> quality <strong>and</strong> utility <strong>of</strong>r<strong>and</strong>om shotgun <strong>sequencing</strong> at low redundancies. Genome Res. 8, 1074±1084 (1998).46. Collins, F. S. et al. New goals for <strong>the</strong> U. S. Human Genome Project: 1998±2003. Science 282, 682±689(1998).47. Sanger, F. & Coulson, A. R. A rapid method for determining sequences in DNA by primed syn<strong>the</strong>siswith DNA polymerase. J. Mol. Biol. 94, 441±448 (1975).48. Maxam, A. M. & Gilbert, W. A new method for <strong>sequencing</strong> DNA. Proc. Natl Acad. Sci. USA 74, 560±564 (1977).49. Anderson, S. Shotgun DNA <strong>sequencing</strong> using cloned DNase I-generated fragments. Nucleic AcidsRes. 9, 3015±3027 (1981).50. Gardner, R. C. et al. The complete nucleotide sequence <strong>of</strong> an infectious clone <strong>of</strong> cauli¯ower mosaicvirus by M13mp7 shotgun <strong>sequencing</strong>. Nucleic Acids Res. 9, 2871±2888 (1981).51. Deininger, P. L. R<strong>and</strong>om subcloning <strong>of</strong> sonicated DNA: application to shotgun DNA sequence<strong>analysis</strong>. Anal. Biochem. 129, 216±223 (1983).52. Chissoe, S. L. et al. Sequence <strong>and</strong> <strong>analysis</strong> <strong>of</strong> <strong>the</strong> <strong>human</strong> ABL gene, <strong>the</strong> BCR gene, <strong>and</strong> regionsinvolved in <strong>the</strong> Philadelphia chromosomal translocation. Genomics 27, 67±82 (1995).53. Rowen, L., Koop, B. F. & Hood, L. The complete 685-kilobase DNA sequence <strong>of</strong> <strong>the</strong> <strong>human</strong> beta Tcell receptor locus. Science 272, 1755±1762 (1996).54. Koop, B. F. et al. Organization, structure, <strong>and</strong> function <strong>of</strong> 95 kb <strong>of</strong> DNA spanning <strong>the</strong> murine T-cellreceptor C alpha/C delta region. Genomics 13, 1209±1230 (1992).55. Wooster, R. et al. Identi®cation <strong>of</strong> <strong>the</strong> breast cancer susceptibility gene BRCA2. Nature 378, 789±792(1995).56. Fleischmann, R. D. et al. Whole-<strong>genome</strong> r<strong>and</strong>om <strong>sequencing</strong> <strong>and</strong> assembly <strong>of</strong> Haemophilusin¯uenzae Rd. Science 269, 496±512 (1995).57. L<strong>and</strong>er, E. S. & Waterman, M. S. Genomic mapping by ®ngerprinting r<strong>and</strong>om clones: ama<strong>the</strong>matical <strong>analysis</strong>. Genomics 2, 231±239 (1988).58. Weber, J. L. & Myers, E. W. Human whole-<strong>genome</strong> shotgun <strong>sequencing</strong>. Genome Res. 7, 401±409(1997).59. Green, P. Against a whole-<strong>genome</strong> shotgun. Genome Res. 7, 410±417 (1997).60. Venter, J. C. et al. Shotgun <strong>sequencing</strong> <strong>of</strong> <strong>the</strong> <strong>human</strong> <strong>genome</strong>. Science 280, 1540±1542 (1998).61. Venter, J. C. et al. The sequence <strong>of</strong> <strong>the</strong> <strong>human</strong> <strong>genome</strong>. Science 291, 1304±1351 (2001).62. Smith, L. M. et al. Fluorescence detection in automated DNA sequence <strong>analysis</strong>. Nature 321, 674±679 (1986).63. Ju, J. Y., Ruan, C. C., Fuller, C. W., Glazer, A. N. & Mathies, R. A. Fluorescence energy-transfer dyelabeledprimers for DNA <strong>sequencing</strong> <strong>and</strong> <strong>analysis</strong>. Proc. Natl Acad. Sci. USA 92, 4347±4351 (1995).64. Lee, L. G. et al. New energy transfer dyes for DNA <strong>sequencing</strong>. Nucleic Acids Res. 25, 2816±2822 (1997).65. Rosenblum, B. B. et al. New dye-labeled terminators for improved DNA <strong>sequencing</strong> patterns.Nucleic Acids Res. 25, 4500±4504 (1997).66. Metzker, M. L., Lu, J. & Gibbs, R. A. Electrophoretically uniform ¯uorescent dyes for automatedDNA <strong>sequencing</strong>. Science 271, 1420±1422 (1996).67. Prober, J. M. et al. A system for rapid DNA <strong>sequencing</strong> with ¯uorescent chain-terminatingdideoxynucleotides. Science 238, 336±341 (1987).68. Reeve, M. A. & Fuller, C. W. A novel <strong>the</strong>rmostable polymerase for DNA <strong>sequencing</strong>. Nature 376,796±797 (1995).69. Tabor, S. & Richardson, C. C. Selective inactivation <strong>of</strong> <strong>the</strong> exonuclease activity <strong>of</strong> bacteriophage T7DNA polymerase by in vitro mutagenesis. J. Biol. Chem. 264, 6447±6458 (1989).70. Tabor, S. & Richardson, C. C. DNA sequence <strong>analysis</strong> with a modi®ed bacteriophage T7 DNApolymeraseÐeffect <strong>of</strong> pyrophosphorolysis <strong>and</strong> metal ions. J. Biol. Chem. 265, 8322±8328 (1990).71. Murray, V. Improved double-str<strong>and</strong>ed DNA <strong>sequencing</strong> using <strong>the</strong> linear polymerase chain reaction.Nucleic Acids Res. 17, 8889 (1989).72. Guttman, A., Cohen, A. S., Heiger, D. N. & Karger, B. L. Analytical <strong>and</strong> micropreparative ultrahighresolution <strong>of</strong> oligonucleotides by polyacrylamide-gel high-performance capillary electrophoresis.Anal. Chem. 62, 137±141 (1990).73. Luckey, J. A. et al. High-speed DNA <strong>sequencing</strong> by capillary electrophoresis. Nucleic Acids Res. 18,4417±4421 (1990).74. Swerdlow, H., Wu, S., Harke, H. & Dovichi, N. J. Capillary gel-electrophoresis for DNA <strong>sequencing</strong>Ðlaser-induced ¯uorescence detection with <strong>the</strong> sheath ¯ow cuvette. J. Chromatogr. 516, 61±67 (1990).75. Meldrum, D. Automation for genomics, part one: preparation for <strong>sequencing</strong>. Genome Res. 10,1081±1092 (2000).76. Meldrum, D. Automation for genomics, part two: sequencers, microarrays, <strong>and</strong> future trends.Genome Res. 10, 1288±1303 (2000).77. Ewing, B. & Green, P. Base-calling <strong>of</strong> automated sequencer traces using phred. II. Error probabilities.Genome Res. 8, 186±194 (1998).78. Ewing, B., Hillier, L., Wendl, M. C. & Green, P. Base-calling <strong>of</strong> automated sequencer traces usingphred. I. Accuracy assessment. Genome Res. 8, 175±185 (1998).79. Bentley, D. R. Genomic sequence information should be released immediately <strong>and</strong> freely in <strong>the</strong>public domain. Science 274, 533±534 (1996).80. Guyer, M. Statement on <strong>the</strong> rapid release <strong>of</strong> genomic DNA sequence. Genome Res. 8, 413 (1998).81. Dietrich, W. et al. A genetic map <strong>of</strong> <strong>the</strong> mouse suitable for typing intraspeci®c crosses. Genetics 131,423±447 (1992).82. Kim, U. J. et al. Construction <strong>and</strong> characterization <strong>of</strong> a <strong>human</strong> bacterial arti®cial chromosomelibrary. Genomics 34, 213±218 (1996).83. Osoegawa, K. et al. Bacterial arti®cial chromosome libraries for mouse <strong>sequencing</strong> <strong>and</strong> functional<strong>analysis</strong>. Genome Res. 10, 116±128 (2000).84. Marra, M. A. et al. High throughput ®ngerprint <strong>analysis</strong> <strong>of</strong> large-insert clones. Genome Res. 7, 1072±1084 (1997).85. Marra, M. et al. A map for sequence <strong>analysis</strong> <strong>of</strong> <strong>the</strong> Arabidopsis thaliana <strong>genome</strong>. Nature Genet. 22,265±270 (1999).86. The International Human Genome Mapping Consortium. A physical map <strong>of</strong> <strong>the</strong> <strong>human</strong> <strong>genome</strong>.Nature 409, 934±941 (2001).87. Zhao, S. et al. Human BAC ends quality assessment <strong>and</strong> sequence analyses. Genomics 63, 321±332(2000).88. Mahairas, G. G. et al. Sequence-tagged connectors: A sequence approach to mapping <strong>and</strong> scanning<strong>the</strong> <strong>human</strong> <strong>genome</strong>. Proc. Natl Acad. Sci. USA 96, 9739±9744 (1999).89. Tilford, C. A. et al. A physical map <strong>of</strong> <strong>the</strong> <strong>human</strong> Y chromosome. Nature 409, 943±945 (2001).90. Bentley, D. R. et al. The physical maps for <strong>sequencing</strong> <strong>human</strong> chromosomes 1, 6, 9, 10, 13, 20 <strong>and</strong> X.Nature 409, 942±943 (2001).91. Montgomery, K. T. et al. A high-resolution map <strong>of</strong> <strong>human</strong> chromosome 12. Nature 409, 945±946(2001).92. BruÈls, T. et al. A physical map <strong>of</strong> <strong>human</strong> chromosome 14. Nature 409, 947±948 (2001).93. Hattori, M. et al. The DNA sequence <strong>of</strong> <strong>human</strong> chromosome 21. Nature 405, 311±319 (2000).94. Dunham, I. et al. The DNA sequence <strong>of</strong> <strong>human</strong> chromosome 22. Nature 402, 489±495 (1999).95. Cox, D. et al. Radiation hybrid map <strong>of</strong> <strong>the</strong> <strong>human</strong> <strong>genome</strong>. Science (in <strong>the</strong> press).96. Osoegawa, K. et al. An improved approach for construction <strong>of</strong> bacterial arti®cial chromosomelibraries. Genomics 52, 1±8 (1998).97. The International SNP Map Working Group. A map <strong>of</strong> <strong>human</strong> <strong>genome</strong> sequence variationcontaining 1.42 million single nucleotide polymorphisms. Nature 409, 928±933 (2001).98. Collins, F. S., Brooks, L. D. & Chakravarti, A. A DNA polymorphism discovery resource for researchon <strong>human</strong> genetic variation. Genome Res. 8, 1229±1231 (1998).99. Stewart, E. A. et al. An STS-based radiation hybrid map <strong>of</strong> <strong>the</strong> <strong>human</strong> <strong>genome</strong>. Genome Res. 7, 422±433 (1997).100. Deloukas, P. et al. A physical map <strong>of</strong> 30,000 <strong>human</strong> genes. Science 282, 744±746 (1998).101. Dib, C. et al. A comprehensive genetic map <strong>of</strong> <strong>the</strong> <strong>human</strong> <strong>genome</strong> based on 5,264 microsatellites.NATURE | VOL 409 | 15 FEBRUARY 2001 | www.nature.com 915© 2001 Macmillan Magazines Ltd
articlesNature 380, 152±154 (1996).102. Broman, K. W., Murray, J. C., Shef®eld, V. C., White, R. L. & Weber, J. L. Comprehensive <strong>human</strong>genetic maps: individual <strong>and</strong> sex-speci®c variation in recombination. Am. J. Hum. Genet. 63, 861±869 (1998).103. The BAC Resource Consortium. Integration <strong>of</strong> cytogenetic l<strong>and</strong>marks into <strong>the</strong> draft sequence <strong>of</strong> <strong>the</strong><strong>human</strong> <strong>genome</strong>. Nature 409, 953±958 (2001).104. Kent, W. J. & Haussler, D. GigAssembler: an algorithm for <strong>the</strong> initial assembly <strong>of</strong> <strong>the</strong> <strong>human</strong> workingdraft . Technical Report UCSC-CRL-00-17 (Univ. California at Santa Cruz, Santa Cruz, California,2001).105. Morton, N. E. Parameters <strong>of</strong> <strong>the</strong> <strong>human</strong> <strong>genome</strong>. Proc. Natl Acad. Sci. USA 88, 7474±7476 (1991).106. Podugolnikova, O. A. & Blumina, M. G. Heterochromatic regions on chromosomes 1, 9, 16, <strong>and</strong> Y inchildren with some disturbances occurring during embryo development. Hum. Genet. 63, 183±188(1983).107. Lundgren, R., Berger, R. & Krist<strong>of</strong>fersson, U. Constitutive heterochromatin C-b<strong>and</strong> polymorphismin prostatic cancer. Cancer Genet. Cytogenet. 51, 57±62 (1991).108. Lee, C., Wevrick, R., Fisher, R. B., Ferguson-Smith, M. A. & Lin, C. C. Human centromeric DNAs.Hum. Genet. 100, 291±304 (1997).109. Riethman, H. C. et al. Integration <strong>of</strong> telomere sequences with <strong>the</strong> draft <strong>human</strong> <strong>genome</strong> sequence.Nature 409, 953±958 (2001).110. Pruit, K. D. & Maglott, D. R. RefSeq <strong>and</strong> LocusLink: NCBI gene-centered resources. Nucleic AcidsRes. 29, 137±140 (2001).111. Wolfsberg, T. G., McEntyre, J. & Schuler, G. D. Guide to <strong>the</strong> draft <strong>human</strong> <strong>genome</strong>. Nature 409, 824±826 (2001).112. Hurst, L. D. & Eyre-Walker, A. Evolutionary genomics: reading <strong>the</strong> b<strong>and</strong>s. Bioessays 22, 105±107(2000).113. Saccone, S. et al. Correlations between isochores <strong>and</strong> chromosomal b<strong>and</strong>s in <strong>the</strong> <strong>human</strong> <strong>genome</strong>.Proc. Natl Acad. Sci. USA 90, 11929±11933 (1993).114. Zoubak, S., Clay, O. & Bernardi, G. The gene distribution <strong>of</strong> <strong>the</strong> <strong>human</strong> <strong>genome</strong>. Gene 174, 95±102(1996).115. Gardiner, K. Base composition <strong>and</strong> gene distribution: critical patterns in mammalian <strong>genome</strong>organization. Trends Genet. 12, 519±524 (1996).116. Duret, L., Mouchiroud, D. & Gautier, C. Statistical <strong>analysis</strong> <strong>of</strong> vertebrate sequences reveals that longgenes are scarce in GC-rich isochores. J. Mol. Evol. 40, 308±317 (1995).117. Saccone, S., De Sario, A., Della Valle, G. & Bernardi, G. The highest gene concentrations in <strong>the</strong><strong>human</strong> <strong>genome</strong> are in telomeric b<strong>and</strong>s <strong>of</strong> metaphase chromosomes. Proc. Natl Acad. Sci. USA 89,4913±4917 (1992).118. Bernardi, G. et al. The mosaic <strong>genome</strong> <strong>of</strong> warm-blooded vertebrates. Science 228, 953±958(1985).119. Bernardi, G. Isochores <strong>and</strong> <strong>the</strong> evolutionary genomics <strong>of</strong> vertebrates. Gene 241, 3±17 (2000).120. Fickett, J. W., Torney, D. C. & Wolf, D. R. Base compositional structure <strong>of</strong> <strong>genome</strong>s. Genomics 13,1056±1064 (1992).121. Churchill, G. A. Stochastic models for heterogeneous DNA sequences. Bull. Math. Biol. 51, 79±94(1989).122. Bird, A., Taggart, M., Frommer, M., Miller, O. J. & Macleod, D. A fraction <strong>of</strong> <strong>the</strong> mouse <strong>genome</strong> thatis derived from isl<strong>and</strong>s <strong>of</strong> nonmethylated, CpG-rich DNA. Cell 40, 91±99 (1985).123. Bird, A. P. CpG isl<strong>and</strong>s as gene markers in <strong>the</strong> vertebrate nucleus. Trends Genet. 3, 342±347 (1987).124. Chan, M. F., Liang, G. & Jones, P. A. Relationship between transcription <strong>and</strong> DNA methylation. Curr.Top. Microbiol. Immunol. 249, 75±86 (2000).125. Holliday, R. & Pugh, J. E. DNA modi®cation mechanisms <strong>and</strong> gene activity during development.Science 187, 226±232 (1975).126. Larsen, F., Gundersen, G., Lopez, R. & Prydz, H. CpG isl<strong>and</strong>s as gene markers in <strong>the</strong> <strong>human</strong> <strong>genome</strong>.Genomics 13, 1095±1107 (1992).127. Tazi, J. & Bird, A. Alternative chromatin structure at CpG isl<strong>and</strong>s. Cell 60, 909±920 (1990).128. Gardiner-Garden, M. & Frommer, M. CpG isl<strong>and</strong>s in vertebrate <strong>genome</strong>s. J. Mol. Biol. 196, 261±282(1987).129. Antequera, F. & Bird, A. Number <strong>of</strong> CpG isl<strong>and</strong>s <strong>and</strong> genes in <strong>human</strong> <strong>and</strong> mouse. Proc. Natl Acad.Sci. USA 90, 11995±11999 (1993).130. Ewing, B. & Green, P. Analysis <strong>of</strong> expressed sequence tags indicates 35,000 <strong>human</strong> genes. NatureGenet. 25, 232±234 (2000).131. Yu, A. Comparison <strong>of</strong> <strong>human</strong> genetic <strong>and</strong> sequence-based physical maps. Nature 409, 951±953 (2001).132. Kaback, D. B., Guacci, V., Barber, D. & Mahon, J. W. Chromosome size-dependent control <strong>of</strong> meioticrecombination. Science 256, 228±232 (1992).133. Riles, L. et al. Physical maps <strong>of</strong> <strong>the</strong> 6 smallest chromosomes <strong>of</strong> Saccharomyces cerevisiae at aresolution <strong>of</strong> 2.6-kilobase pairs. Genetics 134, 81±150 (1993).134. Lynn, A. et al. Patterns <strong>of</strong> meiotic recombination on <strong>the</strong> long arm <strong>of</strong> <strong>human</strong> chromosome 21.Genome Res. 10, 1319±1332 (2000).135. Laurie, D. A. & Hulten, M. A. Fur<strong>the</strong>r studies on bivalent chiasma frequency in <strong>human</strong> males withnormal karyotypes. Ann. Hum. Genet. 49, 189±201 (1985).136. Roeder, G. S. Meiotic chromosomes: it takes two to tango. Genes Dev. 11, 2600±2621 (1997).137. Wu, T.-C. & Lichten, M. Meiosis-induced double-str<strong>and</strong> break sites determined by yeast chromatinstructure. Science 263, 515±518 (1994).138. Gerton, J. L. et al. Global mapping <strong>of</strong> meiotic recombination hotspots <strong>and</strong> coldspots in <strong>the</strong> yeastSaccharomyces cerevisiae. Proc. Natl Acad. Sci. USA 97, 11383±11390 (2000).139. Li, W. -H. Molecular Evolution (Sinauer, Sunderl<strong>and</strong>, Massachusetts, 1997).140. Gregory, T. R. & Hebert, P. D. The modulation <strong>of</strong> DNA content: proximate causes <strong>and</strong> ultimateconsequences. Genome Res. 9, 317±324 (1999).141. Hartl, D. L. Molecular melodies in high <strong>and</strong> low C. Nature Rev. Genet. 1, 145±149 (2000).142. Smit, A. F. Interspersed repeats <strong>and</strong> o<strong>the</strong>r mementos <strong>of</strong> transposable elements in mammalian<strong>genome</strong>s. Curr. Opin. Genet. Dev. 9, 657±663 (1999).143. Prak, E. L. & Haig, H. K. Jr Mobile elements <strong>and</strong> <strong>the</strong> <strong>human</strong> <strong>genome</strong>. Nature Rev. Genet. 1, 134±144(2000).144. Okada, N., Hamada, M., Ogiwara, I. & Ohshima, K. SINEs <strong>and</strong> LINEs share common 39 sequences: areview. Gene 205, 229±243 (1997).145. Esnault, C., Maestre, J. & Heidmann, T. Human LINE retrotransposons generate processedpseudogenes. Nature Genet. 24, 363±367 (2000).146. Wei, W. et al. Human L1 retrotransposition: cis-preference vs. trans-complementation. Mol. Cell.Biol. 21, 1429±1439 (2001)147. Malik, H. S., Henik<strong>of</strong>f, S. & Eickbush, T. H. Poised for contagion: evolutionary origins <strong>of</strong> <strong>the</strong>infectious abilities <strong>of</strong> invertebrate retroviruses. Genome Res. 10, 1307±1318 (2000).148. Smit, A. F. The origin <strong>of</strong> interspersed repeats in <strong>the</strong> <strong>human</strong> <strong>genome</strong>. Curr. Opin. Genet. Dev. 6, 743±748 (1996).149. Clark, J. B. & Tidwell, M. G. A phylogenetic perspective on P transposable element evolution inDrosophila. Proc. Natl Acad. Sci. USA 94, 11428±11433 (1997).150. Haring, E., Hagemann, S. & Pinsker, W. Ancient <strong>and</strong> recent horizontal invasions <strong>of</strong> Drosophilids byP elements. J. Mol. Evol. 51, 577±586 (2000).151. Koga, A. et al. Evidence for recent invasion <strong>of</strong> <strong>the</strong> medaka ®sh <strong>genome</strong> by <strong>the</strong> Tol2 transposableelement. Genetics 155, 273±281 (2000).152. Robertson, H. M. & Lampe, D. J. Recent horizontal transfer <strong>of</strong> a mariner transposable elementamong <strong>and</strong> between Diptera <strong>and</strong> Neuroptera. Mol. Biol. Evol. 12, 850±862 (1995).153. Simmons, G. M. Horizontal transfer <strong>of</strong> hobo transposable elements within <strong>the</strong> Drosophilamelanogaster species complex: evidence from DNA <strong>sequencing</strong>. Mol. Biol. Evol. 9, 1050±1060(1992).154. Malik, H. S., Burke, W. D. & Eickbush, T. H. The age <strong>and</strong> evolution <strong>of</strong> non-LTR retrotransposableelements. Mol. Biol. Evol. 16, 793±805 (1999).155. Kordis, D. & Gubensek, F. Bov-B long interspersed repeated DNA (LINE) sequences are present inVipera ammodytes phospholipase A2 genes <strong>and</strong> in <strong>genome</strong>s <strong>of</strong> Viperidae snakes. Eur. J. Biochem. 246,772±779 (1997).156. Jurka, J. Repbase update: a database <strong>and</strong> an electronic journal <strong>of</strong> repetitive elements. Trends Genet.16, 418±420 (2000).157. Sarich, V. M. & Wilson, A. C. Generation time <strong>and</strong> <strong>genome</strong> evolution in primates. Science 179,1144±1147 (1973).158. Smit, A. F., Toth, G., Riggs, A. D., & Jurka, J. Ancestral, mammalian-wide subfamilies <strong>of</strong> LINE-1repetitive sequences. J. Mol. Biol. 246, 401±417 (1995).159. Lim, J. K. & Simmons, M. J. Gross chromosome rearrangements mediated by transposable elementsin Drosophila melanogaster. Bioessays 16, 269±275 (1994).160. Caceres, M., Ranz, J. M., Barbadilla, A., Long, M. & Ruiz, A. Generation <strong>of</strong> a widespread Drosophilainversion by a transposable element. Science 285, 415±418 (1999).161. Gray, Y. H. It takes two transposons to tango: transposable-element-mediated chromosomalrearrangements. Trends Genet. 16, 461±468 (2000).162. Zhang, J. & Peterson, T. Genome rearrangements by nonlinear transposons in maize. Genetics 153,1403±1410 (1999).163. Smit, A. F. Identi®cation <strong>of</strong> a new, abundant superfamily <strong>of</strong> mammalian LTR-transposons. NucleicAcids Res. 21, 1863±1872 (1993).164. Cordonnier, A., Casella, J. F. & Heidmann, T. Isolation <strong>of</strong> novel <strong>human</strong> endogenous retrovirus-likeelements with foamy virus-related pol sequence. J. Virol. 69, 5890±5897 (1995).165. Medstr<strong>and</strong>, P. & Mager, D. L. Human-speci®c integrations <strong>of</strong> <strong>the</strong> HERV-K endogenous retrovirusfamily. J. Virol. 72, 9782±9787 (1998).166. Myers, E. W. et al. A whole-<strong>genome</strong> assembly <strong>of</strong> Drosophila. Science 287, 2196±2204 (2000).167. Petrov, D. A., Lozovskaya, E. R. & Hartl, D. L. High intrinsic rate <strong>of</strong> DNA loss in Drosophila. Nature384, 346±349 (1996).168. Li, W. H., Ellsworth, D. L., Krushkal, J., Chang, B. H. & Hewett-Emmett, D. Rates <strong>of</strong> nucleotidesubstitution in primates <strong>and</strong> rodents <strong>and</strong> <strong>the</strong> generation-time effect hypo<strong>the</strong>sis. Mol. Phylogenet.Evol. 5, 182±187 (1996).169. Goodman, M. et al. Toward a phylogenetic classi®cation <strong>of</strong> primates based on DNA evidencecomplemented by fossil evidence. Mol. Phylogenet. Evol. 9, 585±598 (1998).170. Kazazian, H. H. Jr & Moran, J. V. The impact <strong>of</strong> L1 retrotransposons on <strong>the</strong> <strong>human</strong> <strong>genome</strong>. NatureGenet. 19, 19±24 (1998).171. Malik, H. S. & Eickbush, T. H. NeSL-1, an ancient lineage <strong>of</strong> site-speci®c non-LTR retrotransposonsfrom Caenorhabditis elegans. Genetics 154, 193±203 (2000).172. Casavant, N. C. et al. The end <strong>of</strong> <strong>the</strong> LINE?: lack <strong>of</strong> recent L1 activity in a group <strong>of</strong> South Americanrodents. Genetics 154, 1809±1817 (2000).173. Meunier-Rotival, M., Soriano, P., Cuny, G., Strauss, F. & Bernardi, G. Sequence organization <strong>and</strong>genomic distribution <strong>of</strong> <strong>the</strong> major family <strong>of</strong> interspersed repeats <strong>of</strong> mouse DNA. Proc. Natl Acad. Sci.USA 79, 355±359 (1982).174. Soriano, P., Meunier-Rotival, M. & Bernardi, G. The distribution <strong>of</strong> interspersed repeats isnonuniform <strong>and</strong> conserved in <strong>the</strong> mouse <strong>and</strong> <strong>human</strong> <strong>genome</strong>s. Proc. Natl Acad. Sci. USA 80, 1816±1820 (1983).175. Goldman, M. A., Holmquist, G. P., Gray, M. C., Caston, L. A. & Nag, A. Replication timing <strong>of</strong> genes<strong>and</strong> middle repetitive sequences. Science 224, 686±692 (1984).176. Manuelidis, L. & Ward, D. C. Chromosomal <strong>and</strong> nuclear distribution <strong>of</strong> <strong>the</strong> HindIII 1.9-kb <strong>human</strong>DNA repeat segment. Chromosoma 91, 28±38 (1984).177. Feng, Q., Moran, J. V., Kazazian, H. H. Jr & Boeke, J. D. Human L1 retrotransposon encodes aconserved endonuclease required for retrotransposition. Cell 87, 905±916 (1996).178. Jurka, J. Sequence patterns indicate an enzymatic involvement in integration <strong>of</strong> mammalianretroposons. Proc. Natl Acad. Sci. USA 94, 1872±1877 (1997).179. Arcot, S. S. et al. High-resolution cartography <strong>of</strong> recently integrated <strong>human</strong> chromosome 19-speci®cAlu fossils. J. Mol. Biol. 281, 843±856 (1998).180. Schmid, C. W. Does SINE evolution preclude Alu function? Nucleic Acids Res. 26, 4541±4550 (1998).181. Chu, W. M., Ballard, R., Carpick, B. W., Williams, B. R. & Schmid, C. W. Potential Alu function:regulation <strong>of</strong> <strong>the</strong> activity <strong>of</strong> double-str<strong>and</strong>ed RNA-activated kinase PKR. Mol. Cell. Biol. 18, 58±68(1998).182. Li, T., Spearow, J., Rubin, C. M. & Schmid, C. W. Physiological stresses increase mouse shortinterspersed element (SINE) RNA expression in vivo. Gene 239, 367±372 (1999).183. Liu, W. M., Chu, W. M., Choudary, P. V. & Schmid, C. W. Cell stress <strong>and</strong> translational inhibitorstransiently increase <strong>the</strong> abundance <strong>of</strong> mammalian SINE transcripts. Nucleic Acids Res. 23, 1758±1765 (1995).184. Filipski, J. Correlation between molecular clock ticking, codon usage ®delity <strong>of</strong> DNA repair,chromosome b<strong>and</strong>ing <strong>and</strong> chromatin compactness in germline cells. FEBS Lett. 217, 184±186(1987).185. Sueoka, N. Directional mutation pressure <strong>and</strong> neutral molecular evolution. Proc. Natl Acad. Sci.916 NATURE | VOL 409 | 15 FEBRUARY 2001 | www.nature.com© 2001 Macmillan Magazines Ltd
articlesUSA 85, 2653±2657 (1988).186. Wolfe, K. H., Sharp, P. M. & Li, W. H. Mutation rates differ among regions <strong>of</strong> <strong>the</strong> mammalian<strong>genome</strong>. Nature 337, 283±285 (1989).187. Bains, W. Local sequence dependence <strong>of</strong> rate <strong>of</strong> base replacement in mammals. Mutat. Res. 267, 43±54 (1992).188. Ma<strong>the</strong>ws, C. K. & Ji, J. DNA precursor asymmetries, replication ®delity, <strong>and</strong> variable <strong>genome</strong>evolution. Bioessays 14, 295±301 (1992).189. Holmquist, G. P. & Filipski, J. Organization <strong>of</strong> mutations along <strong>the</strong> <strong>genome</strong>: a prime determinant <strong>of</strong><strong>genome</strong> evolution. Trends Ecol. Evol. 9, 65±68 (1994).190. Eyre-Walker, A. Evidence <strong>of</strong> selection on silent site base composition in mammals: potentialimplications for <strong>the</strong> evolution <strong>of</strong> isochores <strong>and</strong> junk DNA. Genetics 152, 675±683 (1999).191. The International SNP Map Working Group. An SNP map <strong>of</strong> <strong>the</strong> <strong>human</strong> <strong>genome</strong> generated byreduced representation shotgun <strong>sequencing</strong>. Nature 407, 513±516 (2000).192. Bohossian, H. B., Skaletsky, H. & Page, D. C. Unexpectedly similar rates <strong>of</strong> nucleotide substitutionfound in male <strong>and</strong> female hominids. Nature 406, 622±625 (2000).193. Skowronski, J., Fanning, T. G. & Singer, M. F. Unit-length LINE-1 transcripts in <strong>human</strong>teratocarcinoma cells. Mol. Cell. Biol. 8, 1385±1397 (1988).194. Boissinot, S., Chevret, P. & Furano, A. V. L1 (LINE-1) retrotransposon evolution <strong>and</strong> ampli®cationin recent <strong>human</strong> history. Mol. Biol. Evol. 17, 915±928 (2000).195. Moran, J. V. Human L1 retrotransposition: insights <strong>and</strong> peculiarities learned from a cultured cellretrotransposition assay. Genetica 107, 39±51 (1999).196. Kazazian, H. H. Jr et al. Haemophilia A resulting from de novo insertion <strong>of</strong> L1 sequences represents anovel mechanism for mutation in man. Nature 332, 164±166 (1988).197. Sheen, F.-m. et al. Reading between <strong>the</strong> LINEs: Human genomic variation introduced by LINE-1retrotransposition. Genome Res. 10, 1496±1508 (2000).198. Dombroski, B. A., Mathias, S. L., Nanthakumar, E., Scott, A. F. & Kazazian, H. H. Jr Isolation <strong>of</strong> anactive <strong>human</strong> transposable element. Science 254, 1805±1808 (1991).199. Holmes, S. E., Dombroski, B. A., Krebs, C. M., Boehm, C. D. & Kazazian, H. H. Jr A newretrotransposable <strong>human</strong> L1 element from <strong>the</strong> LRE2 locus on chromosome 1q produces a chimaericinsertion. Nature Genet. 7, 143±148 (1994).200. Sassaman, D. M. et al. Many <strong>human</strong> L1 elements are capable <strong>of</strong> retrotransposition. Nature Genet. 16,37±43 (1997).201. Dombroski, B. A., Scott, A. F. & Kazazian, H. H. Jr Two additional potential retrotransposonsisolated from a <strong>human</strong> L1 subfamily that contains an active retrotransposable element. Proc. NatlAcad. Sci. USA 90, 6513±6517 (1993).202. Kimberl<strong>and</strong>, M. L. et al. Full-length <strong>human</strong> L1 insertions retain <strong>the</strong> capacity for high frequencyretrotransposition in cultured cells. Hum. Mol. Genet. 8, 1557±1560 (1999).203. Moran, J. V. et al. High frequency retrotransposition in cultured mammalian cells. Cell 87, 917±927(1996).204. Moran, J. V., DeBerardinis, R. J. & Kazazian, H. H. Jr Exon shuf¯ing by L1 retrotransposition. Science283, 1530±1534 (1999).205. Pickeral, O. K., Makalowski, W., Boguski, M. S. & Boeke, J. D. Frequent <strong>human</strong> genomic DNAtransduction driven by LINE-1 retrotransposition. Genome Res. 10, 411±415 (2000).206. Miki, Y. et al. Disruption <strong>of</strong> <strong>the</strong> APC gene by a retrotransposal insertion <strong>of</strong> L1 sequence in a coloncancer. Cancer Res. 52, 643±645 (1992).207. Branciforte, D. & Martin, S. L. Developmental <strong>and</strong> cell type speci®city <strong>of</strong> LINE-1 expression inmouse testis: implications for transposition. Mol. Cell. Biol. 14, 2584±2592 (1994).208. Trelogan, S. A. & Martin, S. L. Tightly regulated, developmentally speci®c expression <strong>of</strong> <strong>the</strong> ®rstopen reading frame from LINE-1 during mouse embryogenesis. Proc. Natl Acad. Sci. USA 92, 1520±1524 (1995).209. Jurka, J. & Kapitonov, V. V. Sectorial mutagenesis by transposable elements. Genetica 107, 239±248(1999).210. Fraser, M. J., Ciszczon, T., Elick, T. & Bauser, C. Precise excision <strong>of</strong> TTAA-speci®c lepidopterantransposons piggyBac (IFP2) <strong>and</strong> tagalong (TFP3) from <strong>the</strong> baculovirus <strong>genome</strong> in cell lines fromtwo species <strong>of</strong> Lepidoptera. Insect Mol. Biol. 5, 141±151 (1996).211. Brosius, J. Genomes were forged by massive bombardments with retroelements <strong>and</strong> retrosequences.Genetica 107, 209±238 (1999).212. Kruglyak, S., Durrett, R. T., Schug, M. D. & Aquadro, C. F. Equilibrium distribution <strong>of</strong> microsatelliterepeat length resulting from a balance between slippage events <strong>and</strong> point mutations. Proc. Natl Acad.Sci. USA 95, 10774±10778 (1998).213. Toth, G., Gaspari, Z. & Jurka, J. Microsatellites in different eukaryotic <strong>genome</strong>s: survey <strong>and</strong> <strong>analysis</strong>.Genome Res. 10, 967±981 (2000).214. Ellegren, H. Heterogeneous mutation processes in <strong>human</strong> microsatellite DNA sequences. NatureGenet. 24, 400±402 (2000).215. Ji, Y., Eichler, E. E., Schwartz, S. & Nicholls, R. D. Structure <strong>of</strong> chromosomal duplicons <strong>and</strong> <strong>the</strong>ir rolein mediating <strong>human</strong> genomic disorders. Genome Res. 10, 597±610 (2000).216. Eichler, E. E. Masquerading repeats: paralogous pitfalls <strong>of</strong> <strong>the</strong> <strong>human</strong> <strong>genome</strong>. Genome Res. 8, 758±762 (1998).217. Mazzarella, R. & D. Schlessinger, D. Pathological consequences <strong>of</strong> sequence duplications in <strong>the</strong><strong>human</strong> <strong>genome</strong>. Genome Res. 8, 1007±1021 (1998).218. Eichler, E. E. et al. Interchromosomal duplications <strong>of</strong> <strong>the</strong> adrenoleukodystrophy locus: aphenomenon <strong>of</strong> pericentromeric plasticity. Hum. Mol. Genet. 6, 991±1002 (1997).219. Horvath, J. E., Schwartz, S. & Eichler, E. E. The mosaic structure <strong>of</strong> <strong>human</strong> pericentromeric DNA: astrategy for characterizing complex regions <strong>of</strong> <strong>the</strong> <strong>human</strong> <strong>genome</strong>. Genome Res. 10, 839±852 (2000).220. Br<strong>and</strong>-Arpon, V. et al. A genomic region encompassing a cluster <strong>of</strong> olfactory receptor genes <strong>and</strong> amyosin light chain kinase (MYLK) gene is duplicated on <strong>human</strong> chromosome regions 3q13-q21 <strong>and</strong>3p13. Genomics 56, 98±110 (1999).221. Arnold, N., Wienberg, J., Ermert, K. & Zachau, H. G. Comparative mapping <strong>of</strong> DNA probes derivedfrom <strong>the</strong> V kappa immunoglobulin gene regions on <strong>human</strong> <strong>and</strong> great ape chromosomes by¯uorescence in situ hybridization. Genomics 26, 147±150 (1995).222. Eichler, E. E. et al. Duplication <strong>of</strong> a gene-rich cluster between 16p11.1 <strong>and</strong> Xq28: a novelpericentromeric-directed mechanism for paralogous <strong>genome</strong> evolution. Hum. Mol. Genet. 5, 899±912 (1996).223. Potier, M. et al. Two sequence-ready contigs spanning <strong>the</strong> two copies <strong>of</strong> a 200-kb duplication on<strong>human</strong> 21q: partial sequence <strong>and</strong> polymorphisms. Genomics 51, 417±426 (1998).224. Regnier, V. et al. Emergence <strong>and</strong> scattering <strong>of</strong> multiple neuro®bromatosis (NF1)-related sequencesduring hominoid evolution suggest a process <strong>of</strong> pericentromeric interchromosomal transposition.Hum. Mol. Genet. 6, 9±16 (1997).225. Ritchie, R. J., Mattei, M. G. & Lal<strong>and</strong>e, M. A large polymorphic repeat in <strong>the</strong> pericentromeric region<strong>of</strong> <strong>human</strong> chromosome 15q contains three partial gene duplications. Hum. Mol. Genet. 7, 1253±1260 (1998).226. Trask, B. J. et al. Members <strong>of</strong> <strong>the</strong> olfactory receptor gene family are contained in large blocks <strong>of</strong> DNAduplicated polymorphically near <strong>the</strong> ends <strong>of</strong> <strong>human</strong> chromosomes. Hum. Mol. Genet. 7, 13±26(1998).227. Trask, B. J. et al. Large multi-chromosomal duplications encompass many members <strong>of</strong> <strong>the</strong> olfactoryreceptor gene family in <strong>the</strong> <strong>human</strong> <strong>genome</strong>. Hum. Mol. Genet. 7, 2007±2020 (1998).228. van Deutekom, J. C. et al. Identi®cation <strong>of</strong> <strong>the</strong> ®rst gene (FRG1) from <strong>the</strong> FSHD region on <strong>human</strong>chromosome 4q35. Hum. Mol. Genet. 5, 581±590 (1996).229. Zachau, H. G. The immunoglobulin kappa locusÐorÐwhat has been learned from looking closelyat one-tenth <strong>of</strong> a percent <strong>of</strong> <strong>the</strong> <strong>human</strong> <strong>genome</strong>. Gene 135, 167±173 (1993).230. Zimonjic, D. B., Kelley, M. J., Rubin, J. S., Aaronson, S. A. & Popescu, N. C. Fluorescence in situhybridization <strong>analysis</strong> <strong>of</strong> keratinocyte growth factor gene ampli®cation <strong>and</strong> dispersion in evolution<strong>of</strong> great apes <strong>and</strong> <strong>human</strong>s. Proc. Natl Acad. Sci. USA 94, 11461±11465 (1997).231. van Geel, M. et al. The FSHD region on <strong>human</strong> chromosome 4q35 contains potential coding regionsamong pseudogenes <strong>and</strong> a high density <strong>of</strong> repeat elements. Genomics 61, 55±65 (1999).232. Horvath, J. E. et al. Molecular structure <strong>and</strong> evolution <strong>of</strong> an alpha satellite/non-alpha satellitejunction at 16p11. Hum. Mol. Genet. 9, 113±123 (2000).233. Guy, J. et al. Genomic sequence <strong>and</strong> transcriptional pro®le <strong>of</strong> <strong>the</strong> boundary between pericentromericsatellites <strong>and</strong> genes on <strong>human</strong> chromosome arm 10q. Hum. Mol. Genet. 9, 2029±2042 (2000).234. Reiter, L. T., Murakami, T., Koeuth, T., Gibbs, R. A. & Lupski, J. R. The <strong>human</strong> COX10 gene isdisrupted during homologous recombination between <strong>the</strong> 24 kb proximal <strong>and</strong> distal CMT1A-REPs.Hum. Mol. Genet. 6, 1595±1603 (1997).235. Amos-L<strong>and</strong>graf, J. M. et al. Chromosome breakage in <strong>the</strong> Prader-Willi <strong>and</strong> Angelman syndromesinvolves recombination between large, transcribed repeats at proximal <strong>and</strong> distal breakpoints. Am. J.Hum. Genet. 65, 370±386 (1999).236. Christian, S. L., Fantes, J. A., Mewborn, S. K., Huang, B. & Ledbetter, D. H. Large genomic dupliconsmap to sites <strong>of</strong> instability in <strong>the</strong> Prader-Willi/Angelman syndrome chromosome region (15q11-q13). Hum. Mol. Genet. 8, 1025±1037 (1999).237. Edelmann, L., P<strong>and</strong>ita, R. K. & Morrow, B. E. Low-copy repeats mediate <strong>the</strong> common 3-Mb deletionin patients with velo-cardio-facial syndrome. Am. J. Hum. Genet. 64, 1076±1086 (1999).238. Shaikh, T. H. et al. Chromosome 22-speci®c low copy repeats <strong>and</strong> <strong>the</strong> 22q11.2 deletion syndrome:genomic organization <strong>and</strong> deletion endpoint <strong>analysis</strong>. Hum. Mol. Genet. 9, 489±501 (2000).239. Francke, U. Williams-Beuren syndrome: genes <strong>and</strong> mechanisms. Hum. Mol. Genet. 8, 1947±1954(1999).240. Peoples, R. et al. A physical map, including a BAC/PAC clone contig, <strong>of</strong> <strong>the</strong> Williams-Beurensyndrome-deletion region at 7q11.23. Am. J. Hum. Genet. 66, 47±68 (2000).241. Eichler, E. E., Archidiacono, N. & Rocchi, M. CAGGG repeats <strong>and</strong> <strong>the</strong> pericentromeric duplication<strong>of</strong> <strong>the</strong> hominoid <strong>genome</strong>. Genome Res. 9, 1048±1058 (1999).242. O'Keefe, C. & Eichler, E. in Comparative Genomics: Empirical <strong>and</strong> Analytical Approaches to GeneOrder Dynamics, Map Alignment <strong>and</strong> <strong>the</strong> Evolution <strong>of</strong> Gene Families (eds Sank<strong>of</strong>f, D. & Nadeau, J.)29±46 (Kluwer Academic, Dordrecht, 2000).243. L<strong>and</strong>er, E. S. The new genomics: Global views <strong>of</strong> biology. Science 274, 536±539 (1996).244. Eddy, S. R. Noncoding RNA genes. Curr. Op. Genet. Dev. 9, 695±699 (1999).245. Ban, N., Nissen, P., Hansen, J., Moore, P. B. & Steitz, T. A. The complete atomic structure <strong>of</strong> <strong>the</strong> largeribosomal subunit at 2.4 angstrom resolution. Science 289, 905±920 (2000).246. Nissen, P., Hansen, J., Ban, N., Moore, P. B. & Steitz, T. A. The structural basis <strong>of</strong> ribosome activity inpeptide bond syn<strong>the</strong>sis. Science 289, 920±930 (2000).247. Weinstein, L. B. & Steitz, J. A. Guided tours: from precursor snoRNA to functional snoRNP. Curr.Opin. Cell Biol. 11, 378±384 (1999).248. Bachellerie, J.-P. & Cavaille, J. in Modi®cation <strong>and</strong> Editing <strong>of</strong> RNA (ed. Benne, H. G. a. R.) 255±272(ASM, Washington DC, 1998).249. Burge, C. & Sharp, P. A. Classi®cation <strong>of</strong> introns: U2-type or U12-type. Cell 91, 875±879 (1997).250. Brown, C. J. et al. The Human Xist geneÐ<strong>analysis</strong> <strong>of</strong> a 17 kb inactive X-speci®c RNA that containsconserved repeats <strong>and</strong> is highly localized within <strong>the</strong> nucleus. Cell 71, 527±542 (1992).251. Kickhoefer, V. A., Vasu, S. K. & Rome, L. H. Vaults are <strong>the</strong> answer, what is <strong>the</strong> question? Trends CellBiol. 6, 174±178 (1996).252. Hatlen, L. & Attardi, G. Proportion <strong>of</strong> <strong>the</strong> HeLa cell <strong>genome</strong> complementary to <strong>the</strong> transfer RNA <strong>and</strong>5S RNA. J. Mol. Biol. 56, 535±553 (1971).253. Sprinzl, M., Horn, C., Brown, M., Ioudovitch, A. & Steinberg, S. Compilation <strong>of</strong> tRNA sequences<strong>and</strong> sequences <strong>of</strong> tRNA genes. Nucleic Acids Res. 26, 148±153 (1998).254. Long, E. O. & Dawid, I. B. Repeated genes in eukaryotes. Annu. Rev. Biochem. 49, 727±764 (1980).255. Crick, F. H. Codon±anticodon pairing: <strong>the</strong> wobble hypo<strong>the</strong>sis. J. Mol. Biol. 19, 548±555 (1966).256. Guthrie, C. & Abelson, J. in The Molecular Biology <strong>of</strong> <strong>the</strong> Yeast Saccharomyces: Metabolism <strong>and</strong> GeneExpression (eds Stra<strong>the</strong>rn, J. & Broach J.) 487±528 (Cold Spring Harbor Laboratory Press,Cold Spring Harbor, New York, 1982).257. Soll, D. & RajBh<strong>and</strong>ary, U. (eds) tRNA: Structure, Biosyn<strong>the</strong>sis, <strong>and</strong> Function (ASM, Washington DC,1995).258. Ikemura, T. Codon usage <strong>and</strong> tRNA content in unicellular <strong>and</strong> multicellular organisms. Mol. Biol.Evol. 2, 13±34 (1985).259. Bulmer, M. Coevolution <strong>of</strong> codon usage <strong>and</strong> transfer-RNA abundance. Nature 325, 728±730 (1987).260. Duret, L. tRNA gene number <strong>and</strong> codon usage in <strong>the</strong> C. elegans <strong>genome</strong> are co-adapted for optimaltranslation <strong>of</strong> highly expressed genes. Trends Genet. 16, 287±289 (2000).261. Sharp, P. M. & Matassi, G. Codon usage <strong>and</strong> <strong>genome</strong> evolution. Curr. Opin. Genet. Dev. 4, 851±860(1994).262. Buckl<strong>and</strong>, R. A. A primate transfer-RNA gene cluster <strong>and</strong> <strong>the</strong> evolution <strong>of</strong> <strong>human</strong> chromosome 1.Cytogenet. Cell Genet. 61, 1±4 (1992).263. Gonos, E. S. & Goddard, J. P. Human tRNA-Glu genes: <strong>the</strong>ir copy number <strong>and</strong> organization. FEBSLett. 276, 138±142 (1990).264. Sylvester, J. E. et al. The <strong>human</strong> ribosomal RNA genes: structure <strong>and</strong> organization <strong>of</strong> <strong>the</strong> completerepeating unit. Hum. Genet. 73, 193±198 (1986).NATURE | VOL 409 | 15 FEBRUARY 2001 | www.nature.com 917© 2001 Macmillan Magazines Ltd
articles265. Sorensen, P. D. & Frederiksen, S. Characterization <strong>of</strong> <strong>human</strong> 5S ribosomal RNA genes. Nucleic AcidsRes. 19, 4147±4151 (1991).266. Tim<strong>of</strong>eeva, M. et al. [Organization <strong>of</strong> a 5S ribosomal RNA gene cluster in <strong>the</strong> <strong>human</strong> <strong>genome</strong>].Mol. Biol. (Mosk.) 27, 861±868 (1993).267. Little, R. D. & Braaten, D. C. Genomic organization <strong>of</strong> <strong>human</strong> 5S rDNA <strong>and</strong> sequence <strong>of</strong> one t<strong>and</strong>emrepeat. Genomics 4, 376±383 (1989).268. Maden, B. E. H. The numerous modi®ed nucleotides in eukaryotic ribosomal RNA. Prog. NucleicAcid Res. Mol. Biol. 39, 241±303 (1990).269. Tycowski, K. T., You, Z. H., Graham, P. J. & Steitz, J. A. Modi®cation <strong>of</strong> U6 spliceosomal RNA isguided by o<strong>the</strong>r small RNAs. Mol. Cell 2, 629±638 (1998).270. Pavelitz, T., Liao, D. Q. & Weiner, A. M. Concerted evolution <strong>of</strong> <strong>the</strong> t<strong>and</strong>em array encoding primateU2 snRNA (<strong>the</strong> RNU2 locus) is accompanied by dramatic remodeling <strong>of</strong> <strong>the</strong> junctions with ¯ankingchromosomal sequences. EMBO J. 18, 3783±3792 (1999).271. Lindgren, V., Ares, A., Weiner, A. M. & Francke, U. Human genes for U2 small nuclear RNA map to amajor adenovirus 12 modi®cation site on chromosome 17. Nature 314, 115±116 (1985).272. Van Arsdell, S. W. & Weiner, A. M. Human genes for U2 small nuclear RNA are t<strong>and</strong>emly repeated.Mol. Cell. Biol. 4, 492±499 (1984).273. Gao, L. I., Frey, M. R. & Matera, A. G. Human genes encoding U3 snRNA associate with coiledbodies in interphase cells <strong>and</strong> are clustered on chromosome 17p11. 2 in a complex inverted repeatstructure. Nucleic Acids Res. 25, 4740±4747 (1997).274. Hawkins, J. D. A survey on intron <strong>and</strong> exon lengths. Nucleic Acids Res. 16, 9893±9908 (1988).275. Burge, C. & Karlin, S. Prediction <strong>of</strong> complete gene structures in <strong>human</strong> genomic DNA. J. Mol. Biol.268, 78±94 (1997).276. Labeit, S. & Kolmerer, B. Titins: giant proteins in charge <strong>of</strong> muscle ultrastructure <strong>and</strong> elasticity.Science 270, 293±296 (1995).277. Sterner, D. A., Carlo, T. & Berget, S. M. Architectural limits on split genes. Proc. Natl Acad. Sci. USA93, 15081±15085 (1996).278. Sun, Q., Mayeda, A., Hampson, R. K., Krainer, A. R. & Rottman, F. M. General splicing factor SF2/ASF promotes alternative splicing by binding to an exonic splicing enhancer. Genes Dev. 7, 2598±2608 (1993).279. Tanaka, K., Watakabe, A. & Shimura, Y. Polypurine sequences within a downstream exon function asa splicing enhancer. Mol. Cell. Biol. 14, 1347±1354 (1994).280. Carlo, T., Sterner, D. A. & Berget, S. M. An intron splicing enhancer containing a G-rich repeatfacilitates inclusion <strong>of</strong> a vertebrate micro-exon. RNA 2, 342±353 (1996).281. Burset, M., Seledtsov, I. A. & Solovyev, V. V. Analysis <strong>of</strong> canonical <strong>and</strong> non-canonical splice sites inmammalian <strong>genome</strong>s. Nucleic Acids Res. 28, 4364±4375 (2000).282. Burge, C. B., Padgett, R. A. & Sharp, P. A. Evolutionary fates <strong>and</strong> origins <strong>of</strong> U12-type introns.Mol. Cell 2, 773±785 (1998).283. Mironov, A. A., Fickett, J. W. & Gelf<strong>and</strong>, M. S. Frequent alternative splicing <strong>of</strong> <strong>human</strong> genes. GenomeRes. 9, 1288±1293 (1999).284. Hanke, J. et al. Alternative splicing <strong>of</strong> <strong>human</strong> genes: more <strong>the</strong> rule than <strong>the</strong> exception? Trends Genet.15, 389±390 (1999).285. Brett, D. et al. EST comparison indicates 38% <strong>of</strong> <strong>human</strong> mRNAs contain possible alternative spliceforms. FEBS Lett. 474, 83±86 (2000).286. Dunham, I. The gene guessing game. Yeast 17, 218±224 (2000).287. Lewin, B. Gene Expression (Wiley, New York, 1980).288. Lewin, B. Genes IV 466±481 (Oxford Univ. Press, Oxford, 1990).289. Smaglik, P. Researchers take a gamble on <strong>the</strong> <strong>human</strong> <strong>genome</strong>. Nature 405, 264 (2000).290. Fields, C., Adams, M. D., White, O. & Venter, J. C. How many genes in <strong>the</strong> <strong>human</strong> <strong>genome</strong>? NatureGenet. 7, 345±346 (1994).291. Liang, F. et al. Gene index <strong>analysis</strong> <strong>of</strong> <strong>the</strong> <strong>human</strong> <strong>genome</strong> estimates approximately 120,000 genes.Nature Genet. 25, 239±240 (2000).292. Roest Crollius, H. et al. Estimate <strong>of</strong> <strong>human</strong> gene number provided by <strong>genome</strong>-wide <strong>analysis</strong> usingTetraodon nigroviridis DNA sequence. Nature Genet. 25, 235±238 (2000).293. The C. elegans Sequencing Consortium. Genome sequence <strong>of</strong> <strong>the</strong> nematode C. elegans: A platformfor investigating biology. Science 282, 2012±2018 (1998).294. Rubin, G. M. et al. Comparative genomics <strong>of</strong> <strong>the</strong> eukaryotes. Science 287, 2204±2215 (2000).295. Green, P. et al. Ancient conserved regions in new gene sequences <strong>and</strong> <strong>the</strong> protein databases. Science259, 1711±1716 (1993).296. Fraser, A. G. et al. Functional genomic <strong>analysis</strong> <strong>of</strong> C. elegans chromosome I by systematic RNAinterference. Nature 408, 325±330 (2000).297. Mott, R. EST_GENOME: a program to align spliced DNA sequences to unspliced genomic DNA.Comput. Appl. Biosci. 13, 477±478 (1997).298. Florea, L., Hartzell, G., Zhang, Z., Rubin, G. M. & Miller, W. A computer program for aligning acDNA sequence with a genomic DNA sequence. Genome Res. 8, 967±974 (1998).299. Bailey, L. C. Jr, Searls, D. B. & Overton, G. C. Analysis <strong>of</strong> EST-driven gene annotation in <strong>human</strong>genomic sequence. Genome Res. 8, 362±376 (1998).300. Birney, E., Thompson, J. D. & Gibson, T. J. PairWise <strong>and</strong> SearchWise: ®nding <strong>the</strong> optimal alignmentin a simultaneous comparison <strong>of</strong> a protein pro®le against all DNA translation frames. Nucleic AcidsRes. 24, 2730±2739 (1996).301. Gelf<strong>and</strong>, M. S., Mironov, A. A. & Pevzner, P. A. Gene recognition via spliced sequence alignment.Proc. Natl Acad. Sci. USA 93, 9061±9066 (1996).302. Kulp, D., Haussler, D., Reese, M. G. & Eeckman, F. H. A generalized hidden Markov model for <strong>the</strong>recognition <strong>of</strong> <strong>human</strong> genes in DNA. ISMB 4, 134±142 (1996).303. Reese, M. G., Kulp, D., Tammana, H. & Haussler, D. GenieÐgene ®nding in Drosophilamelanogaster. Genome Res. 10, 529±538 (2000).304. Solovyev, V. & Salamov, A. The Gene-Finder computer tools for <strong>analysis</strong> <strong>of</strong> <strong>human</strong> <strong>and</strong> modelorganisms <strong>genome</strong> sequences. ISMB 5, 294±302 (1997).305. Guigo, R., Agarwal, P., Abril, J. F., Burset, M. & Fickett, J. W. An assessment <strong>of</strong> gene predictionaccuracy in large DNA sequences. Genome Res. 10, 1631±1642 (2000).306. Hubbard, T. & Birney, E. Open annotation <strong>of</strong>fers a democratic solution to <strong>genome</strong> <strong>sequencing</strong>.Nature 403, 825 (2000).307. Bateman, A. et al. The Pfam protein families database. Nucleic Acids Res. 28, 263±266 (2000).308. Birney, E. & Durbin, R. Using GeneWise in <strong>the</strong> Drosophila annotation experiment. Genome Res. 10,547±548 (2000).309. The RIKEN Genome Exploration Research Group Phase II Team <strong>and</strong> <strong>the</strong> FANTOM Consortium.Functional annotation <strong>of</strong> a full-length mouse cDNA collection. Nature 409, 685±690 (2001).310. Basrai, M. A., Hieter, P. & Boeke, J. D. Small open reading frames: beautiful needles in <strong>the</strong> haystack.Genome Res. 7, 768±771 (1997).311. Janin, J. & Chothia, C. Domains in proteins: de®nitions, location, <strong>and</strong> structural principles. MethodsEnzymol. 115, 420±430 (1985).312. Ponting, C. P., Schultz, J., Copley, R. R., Andrade, M. A. & Bork, P. Evolution <strong>of</strong> domain families.Adv. Protein Chem. 54, 185±244 (2000).313. Doolittle, R. F. The multiplicity <strong>of</strong> domains in proteins. Annu. Rev. Biochem. 64, 287±314 (1995).314. Bateman, A. & Birney, E. Searching databases to ®nd protein domain organization. Adv. ProteinChem. 54, 137±157 (2000).315. Futreal, P. A. et al. Cancer <strong>and</strong> genomics. Nature 409, 850±852 (2001).316. Nestler, E. J. & L<strong>and</strong>sman, D. Learning about addiction from <strong>the</strong> <strong>human</strong> draft <strong>genome</strong>. Nature 409,834±835 (2001).317. Tupler, R., Perini, G. & Green, M. R. Expressing <strong>the</strong> <strong>human</strong> <strong>genome</strong>. Nature 409, 832±835 (2001).318. Fahrer, A. M., Bazan, J. F., Papathanasiou, P., Nelms, K. A. & Goodnow, C. C. A genomic view <strong>of</strong>immunology. Nature 409, 836±838 (2001).319. Li, W. -H., Gu, Z., Wang, H. & Nekrutenko, A. Evolutionary analyses <strong>of</strong> <strong>the</strong> <strong>human</strong> <strong>genome</strong>. Nature409, 847±849 (2001).320. Bock, J. B., Matern, H. T., Peden, A. A. & Scheller, R. H. A genomic perspective on membranecompartment organization. Nature 409, 839±841 (2001).321. Pollard, T. D. Genomics, <strong>the</strong> cytoskeleton <strong>and</strong> motility. Nature 409, 842±843 (2001).322. Murray, A. W. & Marks, D. Can <strong>sequencing</strong> shed light on cell cycling? Nature 409, 844±846 (2001).323. Clayton, J. D., Kyriacou, C. P. & Reppert, S. M. Keeping time with <strong>the</strong> <strong>human</strong> <strong>genome</strong>. Nature 409,829±831 (2001).324. Chervitz, S. A. et al. Comparison <strong>of</strong> <strong>the</strong> complete protein sets <strong>of</strong> worm <strong>and</strong> yeast: orthology <strong>and</strong>divergence. Science 282, 2022±2028 (1998).325. Aravind, L. & Subramanian, G. Origin <strong>of</strong> multicellular eukaryotesÐinsights from proteomecomparisons. Curr. Opin. Genet. Dev. 9, 688±694 (1999).326. Attwood, T. K. et al. PRINTS-S: <strong>the</strong> database formerly known as PRINTS. Nucleic Acids Res. 28, 225±227 (2000).327. H<strong>of</strong>mann, K., Bucher, P., Falquet, L. & Bairoch, A. The PROSITE database, its status in 1999. NucleicAcids Res. 27, 215±219 (1999).328. Altschul, S. F. et al. Gapped BLAST <strong>and</strong> PSI-BLAST: a new generation <strong>of</strong> protein database searchprograms. Nucleic Acids Res. 25, 3389±3402 (1997).329. Wolf, Y. I., Kondrashov, F. A. & Koonin, E. V. No footprints <strong>of</strong> primordial introns in a eukaryotic<strong>genome</strong>. Trends Genet. 16, 333±334 (2000).330. Brunner, H. G., Nelen, M., Breake®eld, X. O., Ropers, H. H. & van Oost, B. B. A. Abnormal behaviorassociated with a point mutation in <strong>the</strong> structural gene for monoamine oxidase A. Science 262, 578±580 (1993).331. Cases, O. et al. Aggressive behavior <strong>and</strong> altered amounts <strong>of</strong> brain serotonin <strong>and</strong> norepinephrine inmice lacking MAOA. Science 268, 1763±1766 (1995).332. Brunner, H. G. et al. X-linked borderline mental retardation with prominent behavioral disturbance:phenotype, genetic localization, <strong>and</strong> evidence for disturbed monoamine metabolism. Am. J. Hum.Genet. 52, 1032±1039 (1993).333. Deckert, J. et al. Excess <strong>of</strong> high activity monoamine oxidase A gene promoter alleles in femalepatients with panic disorder. Hum. Mol. Genet. 8, 621±624 (1999).334. Smith, T. F. & Waterman, M. S. Identi®cation <strong>of</strong> common molecular subsequences. J. Mol. Biol. 147,195±197 (1981).335. Tatusov, R. L., Koonin, E. V. & Lipman, D. J. A genomic perspective on protein families. Science 278,631±637 (1997).336. Ponting, C. P., Aravind, L., Schultz, J., Bork, P. & Koonin, E. V. Eukaryotic signalling domainhomologues in archaea <strong>and</strong> bacteria. Ancient ancestry <strong>and</strong> horizontal gene transfer. J. Mol. Biol. 289,729±745 (1999).337. Zhang, J., Dyer, K. D. & Rosenberg, H. F. Evolution <strong>of</strong> <strong>the</strong> rodent eosinophil-associated Rnase genefamily by rapid gene sorting <strong>and</strong> positive selection. Proc. Natl Acad. Sci. USA 97, 4701±4706 (2000).338. Shashoua, V. E. Ependymin, a brain extracellular glycoprotein, <strong>and</strong> CNS plasticity. Ann. NY Acad.Sci. 627, 94±114 (1991).339. Schultz, J., Copley, R. R., Doerks, T., Ponting, C. P. & Bork, P. SMART: a web-based tool for <strong>the</strong> study<strong>of</strong> genetically mobile domains. Nucleic Acids Res. 28, 231±234 (2000).340. Koonin, E. V., Aravind, L. & Kondrashov, A. S. The impact <strong>of</strong> comparative genomics on ourunderst<strong>and</strong>ing <strong>of</strong> evolution. Cell 101, 573±576 (2000).341. Bateman, A., Eddy, S. R. & Chothia, C. Members <strong>of</strong> <strong>the</strong> immunoglobulin superfamily in bacteria.Protein Sci. 5, 1939±1941 (1996).342. Su<strong>the</strong>rl<strong>and</strong>, D., Samakovlis, C. & Krasnow, M. A. Branchless encodes a Drosophila FGF homologthat controls tracheal cell migration <strong>and</strong> <strong>the</strong> pattern <strong>of</strong> branching. Cell 87, 1091±1101 (1996).343. Warburton, D. et al. The molecular basis <strong>of</strong> lung morphogenesis. Mech. Dev. 92, 55±81 (2000).344. Fuchs, T., Glusman, G., Horn-Saban, S., Lancet, D. & Pilpel, Y. The <strong>human</strong> olfactory sub<strong>genome</strong>:from sequence to structure to evolution. Hum. Genet. 108, 1±13 (2001).345. Glusman, G. et al. The olfactory receptor gene family: data mining, classi®cation <strong>and</strong> nomenclature.Mamm. Genome 11, 1016±1023 (2000).346. Rouquier, S. et al. Distribution <strong>of</strong> olfactory receptor genes in <strong>the</strong> <strong>human</strong> <strong>genome</strong>. Nature Genet. 18,243±250 (1998).347. Sharon, D. et al. Primate evolution <strong>of</strong> an olfactory receptor cluster: Diversi®cation by geneconversion <strong>and</strong> recent emergence <strong>of</strong> a pseudogene. Genomics 61, 24±36 (1999).348. Gilad, Y. et al. Dichotomy <strong>of</strong> single-nucleotide polymorphism haplotypes in olfactory receptor genes<strong>and</strong> pseudogenes. Nature Genet. 26, 221±224 (2000).349. Gearhart, J. & Kirschner, M. Cells, Embryos, <strong>and</strong> Evolution (Blackwell Science, Malden, Massachusetts,1997).350. Barbazuk, W. B. et al. The syntenic relationship <strong>of</strong> <strong>the</strong> zebra®sh <strong>and</strong> <strong>human</strong> <strong>genome</strong>s. Genome Res.10, 1351±1358 (2000).351. McLysaght, A., Enright, A. J., Skrabanek, L. & Wolfe, K. H. Estimation <strong>of</strong> synteny conservation <strong>and</strong><strong>genome</strong> compaction between puffer®sh (Fugu) <strong>and</strong> <strong>human</strong>. Yeast 17, 22±36 (2000).352. Trachtulec, Z. et al. Linkage <strong>of</strong> TATA-binding protein <strong>and</strong> proteasome subunit C5 genes in mice <strong>and</strong><strong>human</strong>s reveals synteny conserved between mammals <strong>and</strong> invertebrates. Genomics 44, 1±7 (1997).918 NATURE | VOL 409 | 15 FEBRUARY 2001 | www.nature.com© 2001 Macmillan Magazines Ltd
articles353. Nadeau, J. H. Maps <strong>of</strong> linkage <strong>and</strong> synteny homologies between mouse <strong>and</strong> man. Trends Genet. 5,82±86 (1989).354. Nadeau, J. H. & Taylor, B. A. Lengths <strong>of</strong> chromosomal segments conserved since divergence <strong>of</strong> man<strong>and</strong> mouse. Proc. Natl Acad. Sci. USA 81, 814±818 (1984).355. Copel<strong>and</strong>, N. G. et al. A genetic linkage map <strong>of</strong> <strong>the</strong> mouse: current applications <strong>and</strong> future prospects.Science 262, 57±66 (1993).356. DeBry, R. W. & Seldin, M. F. Human/mouse homology relationships. Genomics 33, 337±351 (1996).357. Nadeau, J. H. & Sank<strong>of</strong>f, D. The lengths <strong>of</strong> undiscovered conserved segments in comparative maps.Mamm. Genome 9, 491±495 (1998).358. Thomas, J. W. et al. Comparative <strong>genome</strong> mapping in <strong>the</strong> sequence-based era: early experience with<strong>human</strong> chromosome 7. Genome Res. 10, 624±633 (2000).359. Pletcher, M. T. et al. Chromosome evolution: The junction <strong>of</strong> mammalian chromosomes in <strong>the</strong>formation <strong>of</strong> mouse chromosome 10. Genome Res. 10, 1463±1467 (2000).360. Novacek, M. J. Mammalian phylogeny: shaking <strong>the</strong> tree. Nature 356, 121±125 (1992).361. O'Brien, S. J. et al. Genome maps 10. Comparative genomics. Mammalian radiations. Wall chart.Science 286, 463±478 (1999).362. Romer, A. S. Vertebrate Paleontology (Univ. Chicago Press, Chicago <strong>and</strong> New York, 1966).363. Paterson, A. H. et al. Toward a uni®ed genetic map <strong>of</strong> higher plants, transcending <strong>the</strong> monocot-dicotdivergence. Nature Genet. 14, 380±382 (1996).364. Jenczewski, E., Prosperi, J. M. & Ronfort, J. Differentiation between natural <strong>and</strong> cultivatedpopulations <strong>of</strong> Medicago sativa (Leguminosae) from Spain: <strong>analysis</strong> with r<strong>and</strong>om ampli®edpolymorphic DNA (RAPD) markers <strong>and</strong> comparison to allozymes. Mol. Ecol. 8, 1317±1330 (1999).365. Ohno, S. Evolution by Gene Duplication (George Allen <strong>and</strong> Unwin, London, 1970).366. Wolfe, K. H. & Shields, D. C. Molecular evidence for an ancient duplication <strong>of</strong> <strong>the</strong> entire yeast<strong>genome</strong>. Nature 387, 708±713 (1997).367. Blanc, G., Barakat, A., Guyot, R., Cooke, R. & Delseny, M. Extensive duplication <strong>and</strong> reshuf¯ing in<strong>the</strong> arabidopsis <strong>genome</strong>. Plant Cell 12, 1093±1102 (2000).368. Paterson, A. H. et al. Comparative genomics <strong>of</strong> plant chromosomes. Plant Cell 12, 1523±1540 (2000).369. Vision, T., Brown, D. & Tanksley, S. The origins <strong>of</strong> <strong>genome</strong> duplications in Arabidopsis. Science 290,2114±2117 (2000).370. Sidow, A. & Bowman, B. H. Molecular phylogeny. Curr. Opin. Genet. Dev. 1, 451±456 (1991).371. Sidow, A. & Thomas, W. K. A molecular evolutionary framework for eukaryotic model organisms.Curr. Biol. 4, 596±603 (1994).372. Sidow, A. Gen(om)e duplications in <strong>the</strong> evolution <strong>of</strong> early vertebrates. Curr. Opin. Genet. Dev. 6,715±722 (1996).373. Spring, J. Vertebrate evolution by interspeci®c hybridisationÐare we polyploid? FEBS Lett. 400, 2±8(1997).374. Skrabanek, L. & Wolfe, K. H. Eukaryote <strong>genome</strong> duplicationÐwhere's <strong>the</strong> evidence? Curr. Opin.Genet. Dev. 8, 694±700 (1998).375. Hughes, A. L. Phylogenies <strong>of</strong> developmentally important proteins do not support <strong>the</strong> hypo<strong>the</strong>sis <strong>of</strong>two rounds <strong>of</strong> <strong>genome</strong> duplication early in vertebrate history. J. Mol. Evol. 48, 565±576 (1999).376. L<strong>and</strong>er, E. S. & Schork, N. J. Genetic dissection <strong>of</strong> complex traits. Science 265, 2037±2048 (1994).377. Horikawa, Y. et al. Genetic variability in <strong>the</strong> gene encoding calpain-10 is associated with type 2diabetes mellitus. Nature Genet. 26, 163±175 (2000).378. Hastbacka, J. et al. The diastrophic dysplasia gene encodes a novel sulfate transporter: positionalcloning by ®ne-structure linkage disequilibrium mapping. Cell 78, 1073±1087 (1994).379. Tischk<strong>of</strong>f, S. A. et al. Global patterns <strong>of</strong> linkage disequilibrium at <strong>the</strong> CD4 locus <strong>and</strong> modern <strong>human</strong>origins. Science 271, 1380±1387 (1996).380. Kidd, J. R. et al. Haplotypes <strong>and</strong> linkage disequilibrium at <strong>the</strong> phenylalanine hydroxylase locus PAH,in a global representation <strong>of</strong> populations. Am. J. Hum. Genet. 63, 1882±1899 (2000).381. Mateu, E. et al. Worldwide genetic <strong>analysis</strong> <strong>of</strong> <strong>the</strong> CFTR region. Am. J. Hum. Genet. 68, 103±117(2001).382. Abecasis, G. R. et al. Extent <strong>and</strong> distribution <strong>of</strong> linkage disequilibrium in three genomic regions.Am. J. Hum. Genet. 68, 191±197 (2001).383. Taillon-Miller, P. et al. Juxtaposed regions <strong>of</strong> extensive <strong>and</strong> minimal linkage disequilibrium in Xq25<strong>and</strong> Xq28. Nature Genet. 25, 324±328 (2000).384. Martin, E. R. et al. SNPing away at complex diseases: <strong>analysis</strong> <strong>of</strong> single-nucleotide polymorphismsaround APOE in Alzheimer disease. Am. J. Hum. Genet. 67, 383±394 (2000).385. Collins, A., Lonjou, C. & Morton, N. E. Genetic epidemiology <strong>of</strong> single-nucleotide polymorphisms.Proc. Natl Acad. Sci. USA 96, 15173±15177 (1999).386. Dunning, A. M. et al. The extent <strong>of</strong> linkage disequilibrium in four populations with distinctdemographic histories. Am. J. Hum. Genet. 67, 1544±1554 (2000).387. Rieder, M. J., Taylor, S. L., Clark, A. G. & Nickerson, D. A. Sequence variation in <strong>the</strong> <strong>human</strong>angiotensin converting enzyme. Nature Genet. 22, 59±62 (1999).388. Collins, F. S. Positional cloning moves from perditional to traditional. Nature Genet. 9, 347±350(1995).389. Nagamine, K. et al. Positional cloning <strong>of</strong> <strong>the</strong> APECED gene. Nature Genet. 17, 393±398 (1997).390. Reuber, B. E. et al. Mutations in PEX1 are <strong>the</strong> most common cause <strong>of</strong> peroxisome biogenesisdisorders. Nature Genet. 17, 445±448 (1997).391. Portsteffen, H. et al. Human PEX1 is mutated in complementation group 1 <strong>of</strong> <strong>the</strong> peroxisomebiogenesis disorders. Nature Genet. 17, 449±452 (1997).392. Everett, L. A. et al. Pendred syndrome is caused by mutations in a putative sulphate transporter gene(PDS). Nature Genet. 17, 411±422 (1997).393. C<strong>of</strong>fey, A. J. et al. Host response to EBV infection in X-linked lymphoproliferative disease resultsfrom mutations in an SH2-domain encoding gene. Nature Genet. 20, 129±135 (1998).394. Van Laer, L. et al. Nonsyndromic hearing impairment is associated with a mutation in DFNA5.Nature Genet. 20, 194±197 (1998).395. Sakuntabhai, A. et al. Mutations in ATP2A2, encoding a Ca2+ pump, cause Darier disease. NatureGenet. 21, 271±277 (1999).396. Gedeon, A. K. et al. Identi®cation <strong>of</strong> <strong>the</strong> gene (SEDL) causing X-linked spondyloepiphysealdysplasia tarda. Nature Genet. 22, 400±404 (1999).397. Hurvitz, J. R. et al. Mutations in <strong>the</strong> CCN gene family member WISP3 cause progressivepseudorheumatoid dysplasia. Nature Genet. 23, 94±98 (1999).398. Laberge-le Couteulx, S. et al. Truncating mutations in CCM1, encoding KRIT1, cause hereditarycavernous angiomas. Nature Genet. 23, 189±193 (1999).399. Sahoo, T. et al. Mutations in <strong>the</strong> gene encoding KRIT1, a Krev-1/rap1a binding protein, causecerebral cavernous malformations (CCM1). Hum. Mol. Genet. 8, 2325±2333 (1999).400. McGuirt, W. T. et al. Mutations in COL11A2 cause non-syndromic hearing loss (DFNA13). NatureGenet. 23, 413±419 (1999).401. Moreira, E. S. et al. Limb-girdle muscular dystrophy type 2G is caused by mutations in <strong>the</strong> geneencoding <strong>the</strong> sarcomeric protein telethonin. Nature Genet. 24, 163±166 (2000).402. Ruiz-Perez, V. L. et al. Mutations in a new gene in Ellis-van Creveld syndrome <strong>and</strong> Weyers acrodentaldysostosis. Nature Genet. 24, 283±286 (2000).403. Kaplan, J. M. et al. Mutations in ACTN4, encoding alpha-actinin-4, cause familial focal segmentalglomerulosclerosis. Nature Genet. 24, 251±256 (2000).404. Escayg, A. et al. Mutations <strong>of</strong> SCN1A, encoding a neuronal sodium channel, in two families withGEFS+2. Nature Genet. 24, 343±345 (2000).405. Sacksteder, K. A. et al. Identi®cation <strong>of</strong> <strong>the</strong> alpha-aminoadipic semialdehyde synthase gene, which isdefective in familial hyperlysinemia. Am. J. Hum. Genet. 66, 1736±1743 (2000).406. Kalaydjieva, L. et al. N-myc downstream-regulated gene 1 is mutated in hereditary motor <strong>and</strong>sensory neuropathy-Lom. Am. J. Hum. Genet. 67, 47±58 (2000).407. Sundin, O. H. et al. Genetic basis <strong>of</strong> total colourblindness among <strong>the</strong> Pingelapese isl<strong>and</strong>ers. NatureGenet. 25, 289±293 (2000).408. Kohl, S. et al. Mutations in <strong>the</strong> CNGB3 gene encoding <strong>the</strong> beta-subunit <strong>of</strong> <strong>the</strong> cone photoreceptorcGMP-gated channel are responsible for achromatopsia (ACHM3) linked to chromosome 8q21.Hum. Mol. Genet. 9, 2107±2116 (2000).409. Avela, K. et al. Gene encoding a new RING-B-box-coiled-coil protein is mutated in mulibreynanism. Nature Genet. 25, 298±301 (2000).410. Verpy, E. et al. A defect in harmonin, a PDZ domain-containing protein expressed in <strong>the</strong> inner earsensory hair cells, underlies usher syndrome type 1C. Nature Genet. 26, 51±55 (2000).411. Bitner-Glindzicz, M. et al. A recessive contiguous gene deletion causing infantile hyperinsulinism,enteropathy <strong>and</strong> deafness identi®es <strong>the</strong> usher type 1C gene. Nature Genet. 26, 56±60 (2000).412. The May-Hegglin/Fetchner Syndrome Consortium. Mutations in MYH9 result in <strong>the</strong> May-Hegglinanomaly, <strong>and</strong> Fechtner <strong>and</strong> Sebastian syndromes. Nature Genet. 26, 103±105 (2000).413. Kelley, M. J., Jawien, W., Ortel, T. L. & Korczak, J. F. Mutation <strong>of</strong> MYH9, encoding non-musclemyosin heavy chain A, in May-Hegglin anomaly. Nature Genet. 26, 106±108 (2000).414. Kirschner, L. S. et al. Mutations <strong>of</strong> <strong>the</strong> gene encoding <strong>the</strong> protein kinase A type I-a regulatorysubunit in patients with <strong>the</strong> Carney complex. Nature Genet. 26, 89±92 (2000).415. Lalwani, A. K. et al. Human nonsyndromic hereditary deafness DFNA17 is due to a mutation innon-muscle myosin MYH9. Am. J. Hum. Genet. 67, 1121±1128 (2000).416. Matsuura, T. et al. Large expansion <strong>of</strong> <strong>the</strong> ATTCT pentanucleotide repeat in spinocerebellar ataxiatype 10. Nature Genet. 26, 191±194 (2000).417. Delettre, C. et al. Nuclear gene OPA1, encoding a mitochondrial dynamin-related protein, ismutated in dominant optic atrophy. Nature Genet. 26, 207±210 (2000).418. Pusch, C. M. et al. The complete form <strong>of</strong> X-linked congenital stationary night blindness is caused bymutations in a gene encoding a leucine-rich repeat protein. Nature Genet. 26, 324±327 (2000).419. The ADHR Consortium. Autosomal dominant hypophosphataemic rickets is associated withmutations in FGF23. Nature Genet. 26, 345±348 (2000).420. Bomont, P. et al. The gene encoding gigaxonin, a new member <strong>of</strong> <strong>the</strong> cytoskeletal BTB/kelch repeatfamily, is mutated in giant axonal neuropathy. Nature Genet. 26, 370±374 (2000).421. Tullio-Pelet, A. et al. Mutant WD-repeat protein in triple-A syndrome. Nature Genet. 26, 332±335(2000).422. Nicole, S. et al. Perlecan, <strong>the</strong> major proteoglycan <strong>of</strong> basement membranes, is altered in patients withSchwartz-Jampel syndrome (chondrodystrophic myotonia). Nature Genet. 26, 480±483 (2000).423. Rogaev, E. I. et al. Familial Alzheimer's disease in kindreds with missense mutations in a gene onchromosome 1 related to <strong>the</strong> Alzheimer's disease type 3 gene. Nature 376, 775±778 (1995).424. Sherrington, R. et al. Cloning <strong>of</strong> a gene bearing missense mutations in early-onset familialAlzheimer's disease. Nature 375, 754±760 (1995).425. Olivieri, N. F. & Wea<strong>the</strong>rall, D. J. The <strong>the</strong>rapeutic reactivation <strong>of</strong> fetal haemoglobin. Hum. Mol.Genet. 7, 1655±1658 (1998).426. Drews, J. Research & development. Basic science <strong>and</strong> pharmaceutical innovation. Nature Biotechnol.17, 406 (1999).427. Drews, J. Drug discovery: a historical perspective. Science 287, 1960±1964 (2000).428. Davies, P. A. et al. The 5-HT3B subunit is a major determinant <strong>of</strong> serotonin-receptor function.Nature 397, 359±363 (1999).429. Heise, C. E. et al. Characterization <strong>of</strong> <strong>the</strong> <strong>human</strong> cysteinyl leukotriene 2 receptor. J. Biol. Chem. 275,30531±30536 (2000).430. Fan, W. et al. BACE maps to chromosome 11 <strong>and</strong> a BACE homolog, BACE2, reside in <strong>the</strong> obligateDown Syndrome region <strong>of</strong> chromosome 21. Science 286, 1255a (1999).431. Saunders, A. J., Kim, T. -W. & Tanzi, R. E. BACE maps to chromosome 11 <strong>and</strong> a BACE homolog,BACE2, reside in <strong>the</strong> obligate Down Syndrome region <strong>of</strong> chromosome 21. Science 286, 1255a (1999).432. Firestein, S. The good taste <strong>of</strong> genomics. Nature 404, 552±553 (2000).433. Matsunami, H., Montmayeur, J. P. & Buck, L. B. A family <strong>of</strong> c<strong>and</strong>idate taste receptors in <strong>human</strong> <strong>and</strong>mouse. Nature 404, 601±604 (2000).434. Adler, E. et al. A novel family <strong>of</strong> mammalian taste receptors. Cell 100, 693±702 (2000).435. Ch<strong>and</strong>rashekar, J. et al. T2Rs function as bitter taste receptors. Cell 100, 703±711 (2000).436. Hardison, R. C. Conserved non-coding sequences are reliable guides to regulatory elements. TrendsGenet. 16, 369±372 (2000).437. Onyango, P. et al. Sequence <strong>and</strong> comparative <strong>analysis</strong> <strong>of</strong> <strong>the</strong> mouse 1-megabase region orthologousto <strong>the</strong> <strong>human</strong> 11p15 imprinted domain. Genome Res. 10, 1697±1710 (2000).438. Bouck, J. B., Metzker, M. L. & Gibbs, R. A. Shotgun sample sequence comparisons between mouse<strong>and</strong> <strong>human</strong> <strong>genome</strong>s. Nature Genet. 25, 31±33 (2000).439. Marshall, E. Public-private project to deliver mouse <strong>genome</strong> in 6 months. Science 290, 242±243 (2000).440. Wasserman, W. W., Palumbo, M., Thompson, W., Fickett, J. W. & Lawrence, C. E. Human-mouse<strong>genome</strong> comparisons to locate regulatory sites. Nature Genet. 26, 225±228 (2000).441. Tagle, D. A. et al. Embryonic epsilon <strong>and</strong> gamma globin genes <strong>of</strong> a prosimian primate (Galagocrassicaudatus). Nucleotide <strong>and</strong> amino acid sequences, developmental regulation <strong>and</strong> phylogeneticfootprints. J. Mol. Biol. 203, 439±455 (1988).442. McGuire, A. M., Hughes, J. D. & Church, G. M. Conservation <strong>of</strong> DNA regulatory motifs <strong>and</strong>discovery <strong>of</strong> new motifs in microbial <strong>genome</strong>s. Genome Res. 10, 744±757 (2000).NATURE | VOL 409 | 15 FEBRUARY 2001 | www.nature.com 919© 2001 Macmillan Magazines Ltd
articles443. Roth, F. P., Hughes, J. D., Estep, P. W. & Church, G. M. Finding DNA regulatory motifs withinunaligned noncoding sequences clustered by whole-<strong>genome</strong> mRNA quantitation. Nature Biotechnol.16, 939±945 (1998).444. Cheng, Y. & Church, G. M. Biclustering <strong>of</strong> expression data. ISMB 8, 93±103 (2000).445. Cohen, B. A., Mitra, R. D., Hughes, J. D. & Church, G. M. A computational <strong>analysis</strong> <strong>of</strong> whole<strong>genome</strong>expression data reveals chromosomal domains <strong>of</strong> gene expression. Nature Genet. 26, 183±186 (2000).446. Feil, R. & Khosla, S. Genomic imprinting in mammals: an interplay between chromatin <strong>and</strong> DNAmethylation? Trends Genet. 15, 431±434 (1999).447. Robertson, K. D. & Wolffe, A. P. DNA methylation in health <strong>and</strong> disease. Nature Rev. Genet. 1, 11±19(2000).448. Beck, S., Olek, A. & Walter, J. From genomics to epigenomics: a l<strong>of</strong>tier view <strong>of</strong> life. Nature Biotechnol.17, 1144±1144 (1999).449. Hagmann, M. Mapping a subtext in our genetic book. Science 288, 945±946 (2000).450. Eliot, T. S. in T. S. Eliot. Collected Poems 1909±1962 (Harcourt Brace, New York, 1963).451. Soderl<strong>and</strong>, C., Longden, I. & Mott, R. FPC: a system for building contigs from restriction®ngerprinted clones. Comput. Appl. Biosci. 13, 523±535 (1997).452. Mott, R. & Tribe, R. Approximate statistics <strong>of</strong> gapped alignments. J. Comp. Biol. 6, 91±112 (1999).Supplementary Information is available on Nature's World-Wide Web site(http://www.nature.com) or as paper copy from <strong>the</strong> London editorial <strong>of</strong>®ce <strong>of</strong> Nature.AcknowledgementsBeyond <strong>the</strong> authors, many people contributed to <strong>the</strong> success <strong>of</strong> this work. E. Jordanprovided helpful advice throughout <strong>the</strong> <strong>sequencing</strong> effort. We thank D. Leja <strong>and</strong>J. Shehadeh for <strong>the</strong>ir expert assistance on <strong>the</strong> artwork in this paper, especially <strong>the</strong> foldout®gure; K. Jegalian for editorial assistance; J. Schloss, E. Green <strong>and</strong> M. Seldin for commentson an earlier version <strong>of</strong> <strong>the</strong> manuscript; P. Green <strong>and</strong> F. Ouelette for critiques <strong>of</strong> <strong>the</strong>submitted version; C. Caulcott, A. Iglesias, S. Renfrey, B. Skene <strong>and</strong> J. Stewart <strong>of</strong> <strong>the</strong>Wellcome Trust, P. Whittington <strong>and</strong> T. Dougans <strong>of</strong> NHGRI <strong>and</strong> M. Meugnier <strong>of</strong>Genoscope for staff support for meetings <strong>of</strong> <strong>the</strong> international consortium; <strong>and</strong> <strong>the</strong>University <strong>of</strong> Pennsylvania for facilities for a meeting <strong>of</strong> <strong>the</strong> <strong>genome</strong> <strong>analysis</strong> group.We thank Compaq Computer Corporations's High Performance Technical ComputingGroup for providing a Compaq Biocluster (a 27 node con®guration <strong>of</strong> AlphaServer ES40s,containing 108 CPUs, serving as compute nodes <strong>and</strong> a ®le server with one terabyte <strong>of</strong>secondary storage) to assist in <strong>the</strong> annotation <strong>and</strong> <strong>analysis</strong>. Compaq provided <strong>the</strong> systems<strong>and</strong> implementation services to set up <strong>and</strong> manage <strong>the</strong> cluster for continuous use bymembers <strong>of</strong> <strong>the</strong> <strong>sequencing</strong> consortium. Platform Computing Ltd. provided its LSFscheduling <strong>and</strong> loadsharing s<strong>of</strong>tware without license fee.In addition to <strong>the</strong> data produced by <strong>the</strong> members <strong>of</strong> <strong>the</strong> International Human GenomeSequencing Consortium, <strong>the</strong> draft <strong>genome</strong> sequence includes published <strong>and</strong> unpublished<strong>human</strong> genomic sequence data from many o<strong>the</strong>r groups, all <strong>of</strong> whom gave permission toinclude <strong>the</strong>ir unpublished data. Four <strong>of</strong> <strong>the</strong> groups that contributed particularly signi®cantamounts <strong>of</strong> data were: M. Adams et al. <strong>of</strong> <strong>the</strong> Institute for Genomic Research;E. Chen et al. <strong>of</strong> <strong>the</strong> Center for Genetic Medicine <strong>and</strong> Applied Biosystems; S.-F. Tsai <strong>of</strong>National Yang-Ming University, Institute <strong>of</strong> Genetics, Taipei, Taiwan, Republic <strong>of</strong> China; <strong>and</strong>Y. Nakamura, K. Koyama et al. <strong>of</strong> <strong>the</strong> Institute <strong>of</strong> Medical Science, University <strong>of</strong> Tokyo,Human Genome Center, Laboratory <strong>of</strong> Molecular Medicine, Minato-ku, Tokyo, Japan.Many o<strong>the</strong>r groups provided smaller numbers <strong>of</strong> database entries. We thank <strong>the</strong>m all; a fulllist <strong>of</strong> <strong>the</strong> contributors <strong>of</strong> unpublished sequence is available as Supplementary Information.This work was supported in part by <strong>the</strong> National Human Genome Research Institute <strong>of</strong><strong>the</strong> US NIH; The Wellcome Trust; <strong>the</strong> US Department <strong>of</strong> Energy, Of®ce <strong>of</strong> Biological <strong>and</strong>Environmental Research, Human Genome Program; <strong>the</strong> UK MRC; <strong>the</strong> Human GenomeSequencing Project from <strong>the</strong> Science <strong>and</strong> Technology Agency (STA) Japan; <strong>the</strong> Ministry <strong>of</strong>Education, Science, Sport <strong>and</strong> Culture, Japan; <strong>the</strong> French Ministry <strong>of</strong> Research; <strong>the</strong> FederalGerman Ministry <strong>of</strong> Education, Research <strong>and</strong> Technology (BMBF) through ProjekttraÈgerDLR, in <strong>the</strong> framework <strong>of</strong> <strong>the</strong> German Human Genome Project; BEO, ProjekttraÈgerBiologie, Energie, Umwelt des BMBF und BMWT; <strong>the</strong> Max-Planck-Society; DFGÐDeutsche Forschungsgemeinschaft; TMWFK, ThuÈringer Ministerium fuÈr Wissenschaft,Forschung und Kunst; EC BIOMED2ÐEuropean Commission, Directorate Science,Research <strong>and</strong> Development; Chinese Academy <strong>of</strong> Sciences (CAS), Ministry <strong>of</strong> Science <strong>and</strong>Technology (MOST), National Natural Science Foundation <strong>of</strong> China (NSFC); US NationalScience Foundation EPSCoR <strong>and</strong> The SNP Consortium Ltd. Additional support formembers <strong>of</strong> <strong>the</strong> Genome Analysis group came, in part, from an ARCS FoundationScholarship to T.S.F., a Burroughs Wellcome Foundation grant to C.B.B. <strong>and</strong> P.A.S., a DFGgrant to P.B., DOE grants to D.H., E.E.E. <strong>and</strong> T.S.F., an EU grant to P.B., a Marie-CurieFellowship to L.C., an NIH-NHGRI grant to S.R.E., an NIH grant to E.E.E., an NIH SBIR toD.K., an NSF grant to D.H., a Swiss National Science Foundation grant to L.C., <strong>the</strong> David<strong>and</strong> Lucille Packard Foundation, <strong>the</strong> Howard Hughes Medical Institute, <strong>the</strong> University <strong>of</strong>California at Santa Cruz <strong>and</strong> <strong>the</strong> W. M. Keck Foundation.Correspondence <strong>and</strong> requests for materials should be addressed to E. S. L<strong>and</strong>er (e-mail:l<strong>and</strong>er@<strong>genome</strong>.wi.mit.edu), R. H. Waterston (e-mail: bwaterst@watson.wustl.edu),J. Sulston (e-mail: jes@sanger.ac.uk) or F. S. Collins (e-mail: fc23a@nih.gov).Af®liations for authors: 1, Whitehead Institute for Biomedical Research, Center forGenome Research, Nine Cambridge Center, Cambridge, Massachusetts 02142,USA; 2, The Sanger Centre, The Wellcome Trust Genome Campus, Hinxton,Cambridgeshire CB10 1RQ, United Kingdom; 3, Washington University GenomeSequencing Center, Box 8501, 4444 Forest Park Avenue, St. Louis, Missouri 63108,USA; 4, US DOE Joint Genome Institute, 2800 Mitchell Drive, Walnut Creek,California 94598, USA; 5, Baylor College <strong>of</strong> Medicine Human GenomeSequencing Center, Department <strong>of</strong> Molecular <strong>and</strong> Human Genetics, One BaylorPlaza, Houston, Texas 77030, USA; 6, Department <strong>of</strong> Cellular <strong>and</strong> StructuralBiology, The University <strong>of</strong> Texas Health Science Center at San Antonio, 7703 FloydCurl Drive, San Antonio, Texas 78229-3900, USA; 7, Department <strong>of</strong> MolecularGenetics, Albert Einstein College <strong>of</strong> Medicine, 1635 Poplar Street, Bronx, New York10461, USA; 8, Baylor College <strong>of</strong> Medicine Human Genome Sequencing Center<strong>and</strong> <strong>the</strong> Department <strong>of</strong> Microbiology & Molecular Genetics, University <strong>of</strong> TexasMedical School, PO Box 20708, Houston, Texas 77225, USA; 9, RIKEN GenomicSciences Center, 1-7-22 Suehiro-cho, Tsurumi-ku Yokohama-city, Kanagawa230-0045, Japan; 10, Genoscope <strong>and</strong> CNRS UMR-8030, 2 Rue Gaston Cremieux,CP 5706, 91057 Evry Cedex, France; 11, GTC Sequencing Center, GenomeTherapeutics Corporation, 100 Beaver Street, Waltham, Massachusetts02453-8443, USA; 12, Department <strong>of</strong> Genome Analysis, Institute <strong>of</strong> MolecularBiotechnology, Beutenbergstrasse 11, D-07745 Jena, Germany; 13, BeijingGenomics Institute/Human Genome Center, Institute <strong>of</strong> Genetics, ChineseAcademy <strong>of</strong> Sciences, Beijing 100101, China; 14, Sou<strong>the</strong>rn China NationalHuman Genome Research Center, Shanghai 201203, China; 15, Nor<strong>the</strong>rn ChinaNational Human Genome Research Center, Beijing 100176, China; 16,Multimegabase Sequencing Center, The Institute for Systems Biology,4225 Roosevelt Way, NE Suite 200, Seattle, Washington 98105, USA; 17, StanfordGenome Technology Center, 855 California Avenue, Palo Alto, California 94304,USA; 18, Stanford Human Genome Center <strong>and</strong> Department <strong>of</strong> Genetics, StanfordUniversity School <strong>of</strong> Medicine, Stanford, California 94305-5120, USA;19, University <strong>of</strong> Washington Genome Center, 225 Fluke Hall on Mason Road,Seattle, Washington 98195, USA; 20, Department <strong>of</strong> Molecular Biology,Keio University School <strong>of</strong> Medicine, 35 Shinanomachi, Shinjuku-ku, Tokyo160-8582, Japan; 21, University <strong>of</strong> Texas Southwestern Medical Center at Dallas,6000 Harry Hines Blvd., Dallas, Texas 75235-8591, USA; 22, University <strong>of</strong>Oklahoma's Advanced Center for Genome Technology, Dept. <strong>of</strong> Chemistry <strong>and</strong>Biochemistry, University <strong>of</strong> Oklahoma, 620 Parrington Oval, Rm 311, Norman,Oklahoma 73019, USA; 23, Max Planck Institute for Molecular Genetics,Ihnestrasse 73, 14195 Berlin, Germany; 24, Cold Spring Harbor Laboratory, LitaAnnenberg Hazen Genome Center, 1 Bungtown Road, Cold Spring Harbor, NewYork 11724, USA; 25, GBF - German Research Centre for Biotechnology,Mascheroder Weg 1, D-38124 Braunschweig, Germany; 26, National Center forBiotechnology Information, National Library <strong>of</strong> Medicine, National Institutes <strong>of</strong>Health, Bldg. 38A, 8600 Rockville Pike, Be<strong>the</strong>sda, Maryl<strong>and</strong> 20894, USA; 27,Department <strong>of</strong> Genetics, Case Western Reserve School <strong>of</strong> Medicine <strong>and</strong> UniversityHospitals <strong>of</strong> Clevel<strong>and</strong>, BRB 720, 10900 Euclid Ave., Clevel<strong>and</strong>, Ohio 44106, USA;28, EMBL European Bioinformatics Institute, Wellcome Trust Genome Campus,Hinxton, Cambridge CB10 1SD, United Kingdom; 29, Max DelbruÈck Center forMolecular Medicine, Robert-Rossle-Strasse 10, 13125 Berlin-Buch, Germany;30, EMBL, Meyerh<strong>of</strong>strasse 1, 69012 Heidelberg, Germany; 31, Dept. <strong>of</strong> Biology,Massachusetts Institute <strong>of</strong> Technology, 77 Massachusetts Ave., Cambridge,Massachusetts 02139-4307, USA; 32, Howard Hughes Medical Institute,Dept. <strong>of</strong> Genetics, Washington University School <strong>of</strong> Medicine, Saint Louis,Missouri 63110, USA; 33, Dept. <strong>of</strong> Computer Science, University <strong>of</strong> California atSanta Cruz, Santa Cruz, California 95064, USA; 34, Affymetrix, Inc., 2612 8th St,Berkeley, California 94710, USA; 35, Genome Exploration Research Group,Genomic Sciences Center, RIKEN Yokohama Institute, 1-7-22 Suehiro-cho,Tsurumi-ku, Yokohama, Kanagawa 230-0045, Japan; 36, Howard HughesMedical Institute, Department <strong>of</strong> Computer Science, University <strong>of</strong> California atSanta Cruz, California 95064, USA; 37, University <strong>of</strong> Dublin, Trinity College,Department <strong>of</strong> Genetics, Smur®t Institute, Dublin 2, Irel<strong>and</strong>; 38, CambridgeResearch Laboratory, Compaq Computer Corporation <strong>and</strong> MIT Genome Center,1 Cambridge Center, Cambridge, Massachusetts 02142, USA; 39, Dept. <strong>of</strong>Ma<strong>the</strong>matics, University <strong>of</strong> California at Santa Cruz, Santa Cruz, California95064, USA; 40, Dept. <strong>of</strong> Biology, University <strong>of</strong> California at Santa Cruz, SantaCruz, California 95064, USA; 41, Crown Human Genetics Center <strong>and</strong>Department <strong>of</strong> Molecular Genetics, The Weizmann Institute <strong>of</strong> Science, Rehovot71600, Israel; 42, Dept. <strong>of</strong> Genetics, Stanford University School <strong>of</strong> Medicine,Stanford, California 94305, USA; 43, The University <strong>of</strong> Michigan Medical School,Departments <strong>of</strong> Human Genetics <strong>and</strong> Internal Medicine, Ann Arbor, Michigan920 © 2001 Macmillan Magazines Ltd NATURE | VOL 409 | 15 FEBRUARY 2001 | www.nature.com
articles48109, USA; 44, MRC Functional Genetics Unit, Department <strong>of</strong> Human Anatomy<strong>and</strong> Genetics, University <strong>of</strong> Oxford, South Parks Road, Oxford OX1 3QX, UK; 45,Institute for Systems Biology, 4225 Roosevelt Way NE, Seattle, WA 98105, USA;46, National Human Genome Research Institute, US National Institutes <strong>of</strong>Health, 31 Center Drive, Be<strong>the</strong>sda, Maryl<strong>and</strong> 20892, USA; 47, Of®ce <strong>of</strong> Science,US Department <strong>of</strong> Energy, 19901 Germantown Road, Germantown, Maryl<strong>and</strong>20874, USA; 48, The Wellcome Trust, 183 Euston Road, London, NW1 2BE, UK.² Present addresses: Genome Sequencing Project, Egea Biosciences, Inc., 4178Sorrento Valley Blvd., Suite F, San Diego, CA 92121, USA (G.A.E.); INRA, Stationd'AmeÂlioration des Plantes, 63039 Clermont-Ferr<strong>and</strong> Cedex 2, France (L.C.).DNA sequence databasesGenBank, National Center for Biotechnology Information, National Library <strong>of</strong>Medicine, National Institutes <strong>of</strong> Health, Bldg. 38A, 8600 Rockville Pike, Be<strong>the</strong>sda,Maryl<strong>and</strong> 20894, USAEMBL, European Bioinformatics Institute, Wellcome Trust Genome Campus,Hinxton, Cambridge CB10 1SD, UKDNA Data Bank <strong>of</strong> Japan, Center for Information Biology, National Institute <strong>of</strong>Genetics, 1111 Yata, Mishima-shi, Shizuoka-ken 411-8540, JapanNATURE | VOL 409 | 15 FEBRUARY 2001 | www.nature.com © 2001 Macmillan Magazines Ltd921