Calculation and Use of First-Order Rate Constants for Monitored ...
Calculation and Use of First-Order Rate Constants for Monitored ...
Calculation and Use of First-Order Rate Constants for Monitored ...

Create successful ePaper yourself
Turn your PDF publications into a flip-book with our unique Google optimized e-Paper software.
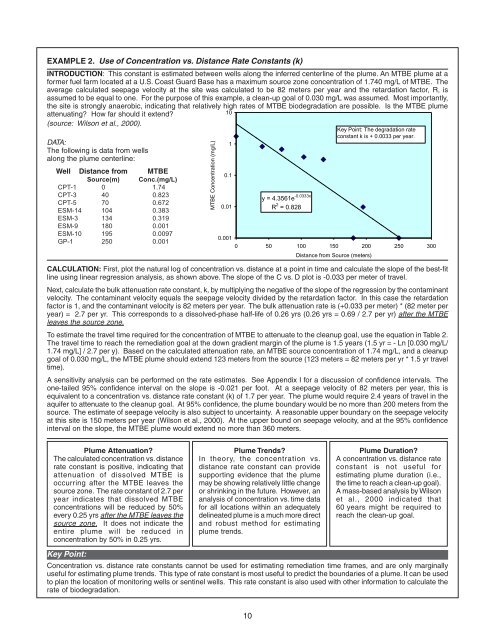
EXAMPLE 2. <strong>Use</strong> <strong>of</strong> Concentration vs. Distance <strong>Rate</strong> <strong>Constants</strong> (k)INTRODUCTION: This constant is estimated between wells along the inferred centerline <strong>of</strong> the plume. An MTBE plume at a<strong>for</strong>mer fuel farm located at a U.S. Coast Guard Base has a maximum source zone concentration <strong>of</strong> 1.740 mg/L <strong>of</strong> MTBE. Theaverage calculated seepage velocity at the site was calculated to be 82 meters per year <strong>and</strong> the retardation factor, R, isassumed to be equal to one. For the purpose <strong>of</strong> this example, a clean-up goal <strong>of</strong> 0.030 mg/L was assumed. Most importantly,the site is strongly anaerobic, indicating that relatively high rates <strong>of</strong> MTBE biodegradation are possible. Is the MTBE plumeattenuating? How far should it extend?10(source: Wilson et al., 2000).DATA:The following is data from wellsalong the plume centerline:Well Distance from MTBESource(m) Conc.(mg/L)CPT-1 0 1.74CPT-3 40 0.823CPT-5 70 0.672ESM-14 104 0.383ESM-3 134 0.319ESM-9 180 0.001ESM-10 195 0.0097GP-1 250 0.001MTBE Concentration (mg/L)10.10.01y = 4.3561e -0.0333xR 2 = 0.828Key Point: The degradation rateconstant k is + 0.0033 per year.0.0010 50 100 150 200 250 300Distance from Source (meters)CALCULATION: <strong>First</strong>, plot the natural log <strong>of</strong> concentration vs. distance at a point in time <strong>and</strong> calculate the slope <strong>of</strong> the best-fitline using linear regression analysis, as shown above. The slope <strong>of</strong> the C vs. D plot is -0.033 per meter <strong>of</strong> travel.Next, calculate the bulk attenuation rate constant, k, by multiplying the negative <strong>of</strong> the slope <strong>of</strong> the regression by the contaminantvelocity. The contaminant velocity equals the seepage velocity divided by the retardation factor. In this case the retardationfactor is 1, <strong>and</strong> the contaminant velocity is 82 meters per year. The bulk attenuation rate is (+0.033 per meter) * (82 meter peryear) = 2.7 per yr. This corresponds to a dissolved-phase half-life <strong>of</strong> 0.26 yrs (0.26 yrs = 0.69 / 2.7 per yr) after the MTBEleaves the source zone.To estimate the travel time required <strong>for</strong> the concentration <strong>of</strong> MTBE to attenuate to the cleanup goal, use the equation in Table 2.The travel time to reach the remediation goal at the down gradient margin <strong>of</strong> the plume is 1.5 years (1.5 yr = - Ln [0.030 mg/L/1.74 mg/L] / 2.7 per y). Based on the calculated attenuation rate, an MTBE source concentration <strong>of</strong> 1.74 mg/L, <strong>and</strong> a cleanupgoal <strong>of</strong> 0.030 mg/L, the MTBE plume should extend 123 meters from the source (123 meters = 82 meters per yr * 1.5 yr traveltime).A sensitivity analysis can be per<strong>for</strong>med on the rate estimates. See Appendix I <strong>for</strong> a discussion <strong>of</strong> confidence intervals. Theone-tailed 95% confidence interval on the slope is -0.021 per foot. At a seepage velocity <strong>of</strong> 82 meters per year, this isequivalent to a concentration vs. distance rate constant (k) <strong>of</strong> 1.7 per year. The plume would require 2.4 years <strong>of</strong> travel in theaquifer to attenuate to the cleanup goal. At 95% confidence, the plume boundary would be no more than 200 meters from thesource. The estimate <strong>of</strong> seepage velocity is also subject to uncertainty. A reasonable upper boundary on the seepage velocityat this site is 150 meters per year (Wilson et al., 2000). At the upper bound on seepage velocity, <strong>and</strong> at the 95% confidenceinterval on the slope, the MTBE plume would extend no more than 360 meters.Plume Attenuation?The calculated concentration vs. distancerate constant is positive, indicating thatattenuation <strong>of</strong> dissolved MTBE isoccurring after the MTBE leaves thesource zone. The rate constant <strong>of</strong> 2.7 peryear indicates that dissolved MTBEconcentrations will be reduced by 50%every 0.25 yrs after the MTBE leaves thesource zone. It does not indicate theentire plume will be reduced inconcentration by 50% in 0.25 yrs.Plume Trends?In theor y, the concentration vs.distance rate constant can providesupporting evidence that the plumemay be showing relatively little changeor shrinking in the future. However, ananalysis <strong>of</strong> concentration vs. time data<strong>for</strong> all locations within an adequatelydelineated plume is a much more direct<strong>and</strong> robust method <strong>for</strong> estimatingplume trends.Plume Duration?A concentration vs. distance rateconstant is not useful <strong>for</strong>estimating plume duration (i.e.,the time to reach a clean-up goal).A mass-based analysis by Wilsonet al., 2000 indicated that60 years might be required toreach the clean-up goal.Key Point:Concentration vs. distance rate constants cannot be used <strong>for</strong> estimating remediation time frames, <strong>and</strong> are only marginallyuseful <strong>for</strong> estimating plume trends. This type <strong>of</strong> rate constant is most useful to predict the boundaries <strong>of</strong> a plume. It can be usedto plan the location <strong>of</strong> monitoring wells or sentinel wells. This rate constant is also used with other in<strong>for</strong>mation to calculate therate <strong>of</strong> biodegradation.10