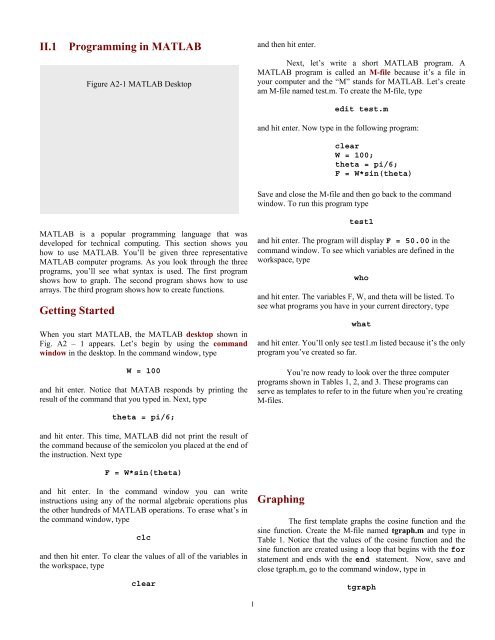
II.1 Programming in MATLAB Getting Started Graphing
II.1 Programming in MATLAB Getting Started Graphing
II.1 Programming in MATLAB Getting Started Graphing

You also want an ePaper? Increase the reach of your titles
YUMPU automatically turns print PDFs into web optimized ePapers that Google loves.
%% tgraph.m%% This m-file is a template for creat<strong>in</strong>g graphs of functions. It conta<strong>in</strong>s many of the% commands that are commonly used <strong>in</strong> graph<strong>in</strong>g.%% In this template, the graphs of the s<strong>in</strong>e function and the cos<strong>in</strong>e function are created% <strong>in</strong> one figure w<strong>in</strong>dow.%% This template shows:%% - several ways of plott<strong>in</strong>g% - how to create a grid <strong>in</strong> a figure w<strong>in</strong>dow% - how to label axes% - how to create a title for a figure w<strong>in</strong>dow% - how to create a legend when more than one plot is drawn <strong>in</strong> a figure w<strong>in</strong>dow%clear% Optional Feature. This sets all values to zero.for i = 1:361:1% This is the beg<strong>in</strong>n<strong>in</strong>g of a loop. The <strong>in</strong>dex i <strong>in</strong>creases% from 1 to 361 <strong>in</strong> <strong>in</strong>crements of 1 each time through the% loop. More compact ways of do<strong>in</strong>g loops is shown <strong>in</strong>% the template called tarray.%for i = 1:361 % The default <strong>in</strong>crement is 1.theta(i) = (i-1)*2*pi/360; % theta is an array. theta varies from 0 to 2*pi radians.f(i) = s<strong>in</strong>(theta(i));% f is an array. The i-th entry of f is the s<strong>in</strong>e function% evaluated at the i-th value of theta.p(i) = cos(theta(i));% p is an array. The i-th entry of p is the cos<strong>in</strong>e% function evaluated at the i-th value of theta.end% This is the end of the loop.figuregrid onaxis([0 7 -1 1])hold%plot(theta,f)%plot(f)plot(theta,f,'r')plot(theta,p,'g')%plot(theta,p,'--')%plot(theta,p,':')%plot(theta,p,'r.')title('force and position')xlabel('t-axis')ylabel('force or positon')legend('force','position')% This opens a new figure w<strong>in</strong>dow.% Optional Feature. This creates a grid on your graph.% Optional Feature. This specifies the axis limits% ([theta-m<strong>in</strong> theta-max f-m<strong>in</strong> f-max]).% Optional Feature. This holds the figure w<strong>in</strong>dow for more% graphs.% This plots the array f versus theta (<strong>in</strong> radians).% This plots the array f versus the <strong>in</strong>dex (from 1 to% 361).% This plots the array f versus theta <strong>in</strong> red. The 'r'% <strong>in</strong>dicates the color red.% This plots the array p versus theta <strong>in</strong> green. The 'g'% <strong>in</strong>dicates the color green.% This plots the array p versus theta <strong>in</strong> large dashes.% This plots the array p versus theta <strong>in</strong> small dashes.% This plots the array p versus theta <strong>in</strong> red <strong>in</strong> small% red dots (zoom <strong>in</strong> to see them).% Optional Feature. This creates a title for the figure% w<strong>in</strong>dow.% Optional Feature. This creates a label for the% horizontal axis.% Optional Feature. This creates a label for the vertical% axis.% Optional Feature. This creates a legend for the first% and second graphs <strong>in</strong> the figure w<strong>in</strong>dow.Table 1: Template for Graph<strong>in</strong>g3
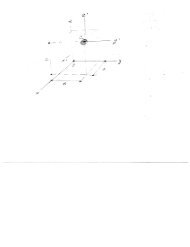
ArraysNext, look over the second template shown <strong>in</strong> Table 2.This program determ<strong>in</strong>es the force reactions act<strong>in</strong>g on the barshown <strong>in</strong> Fig. A2 – 2. The reactions are found by solv<strong>in</strong>g a setof three l<strong>in</strong>ear algebraic equations. The unknowns <strong>in</strong> thisproblem are⎛ F ⎞⎜ ⎟x =⎜N A⎟,⎝ N B ⎠where F is the friction force at A, N A is the normal force at A,and N B is the normal force at B. Create the M-file namedtarray.m and type <strong>in</strong> Table 2. Notice how the program def<strong>in</strong>eselements of vectors and matrices (arrays). Also notice howthese arrays are manipulated us<strong>in</strong>g vector algebra. In thisprogram, a set of l<strong>in</strong>ear algebraic equations of the form Ax = bis solved by first calculat<strong>in</strong>g A -1 and then by calculat<strong>in</strong>g thesolution x = A -1 b.Next, save and close tarray.m, go to the commandw<strong>in</strong>dow, typetarrayand hit return. The command w<strong>in</strong>dow diplays b, A, and thesolution x. You’ll see that F = 31.6987 lb, N A = 68.3013 lb, andN B = 44.8288 lb.4
%% tarray.m%% This m-file is a template for creat<strong>in</strong>g arrays. It conta<strong>in</strong>s many of the% commands that are commonly used for arrays.%% In this template, a set of l<strong>in</strong>ear algebraic equations is solved.%% This template shows:%% - several ways to <strong>in</strong>put a vector% - how to transpose a vector and a matrix% - how to <strong>in</strong>vert a matrix% - how to swap a column <strong>in</strong> a vector with another column vector% - how to multiply vectors and matrices% - how to perform a for-end loop more efficiently%clearW = 100;L = 2;theta = pi/4;beta = pi/6;b = [W,0,W*L/2*cos(beta)]'% An array is def<strong>in</strong>ed by enclos<strong>in</strong>g the elements <strong>in</strong>% brackets, separat<strong>in</strong>g them by commas.% This creates a row vector. The prime follow<strong>in</strong>g the% right bracket transposes the row vector, mak<strong>in</strong>g it a% column vector.%% b = [W;0;W*L/2*cos(beta)] % This is another way to def<strong>in</strong>e a column vector. Each row% (the rows are one element long) is separated by a% semicolon.A = [0,1,cos(theta);1,0,-s<strong>in</strong>(theta);0,0,L*cos(theta-beta)] %A matrix is def<strong>in</strong>ed by% list<strong>in</strong>g its elements row by row. Each% row is separated by a semicolon.a<strong>in</strong>v = <strong>in</strong>v(A);% <strong>in</strong>v <strong>in</strong>verts a matrix.% detofA = det(A) % det takes the determ<strong>in</strong>ant of a matrix.% Atranspose = A' % a prime after a matrix transposes the matrix.% A(:,2) = [10,10,10]' % Us<strong>in</strong>g the colon, the second row of A is replaced with% the column vector [10,10,10]'.x = a<strong>in</strong>v*b%time1 = [0:1:2*pi]% multiplication/addition of vectors and matrices uses% the same syntax that is used for scalars.% Instead of us<strong>in</strong>g a for-end loop. The follow<strong>in</strong>g syntax%can be used. This <strong>in</strong>struction creates a row vector of% values start<strong>in</strong>g from 0, stepp<strong>in</strong>g <strong>in</strong> <strong>in</strong>crements of% 1,end<strong>in</strong>g just before 2pi. The loop is created us<strong>in</strong>g the% brackets.%time2 = [0:2*pi] % The default <strong>in</strong>crement is 1.%c = cos(time1) % Creates a row vector called c. The array is created% us<strong>in</strong>g the parentheses, <strong>in</strong>side which the array time1% appears.Table 2: Template for Arrays5
To try out a few other vector operations, type <strong>in</strong>cleara = [1, 2, 3]b = [2, 3, 4]and then type <strong>in</strong> each of the follow<strong>in</strong>g quantities and hit enter:a*b’ a’*b dot(a,b)dot(a,b’) cross(a,b) cross(a’,b’)Notice that the dot function does not dist<strong>in</strong>guish betweencolumn vectors and row vectors but that the other operationsdo.FunctionsThe third and f<strong>in</strong>al template shows you how to createfunctions. This will help you become more efficient <strong>in</strong>programm<strong>in</strong>g. Create the M-file called tfunction.m and type <strong>in</strong>Table 3. The M-file tfunction.m turns the force reactions <strong>in</strong> thesecond template <strong>in</strong>to a function of beta and theta. In thecommand w<strong>in</strong>dow, type <strong>in</strong>[F,NA]=tfunction(pi/6,pi/4)and hit enter. The reactions F and N A are displayed.6
function [F,NA] = tfunction(beta,theta)%% tfunction.m%% This m-file is a template for a function.%% In this template, the function tfunction f<strong>in</strong>ds the friction force F and the normal% force NA.% The <strong>in</strong>puts to the function are the variables beta (the angle of the bar) and theta% (the angle of the <strong>in</strong>cl<strong>in</strong>e). These two <strong>in</strong>puts are <strong>in</strong> radians.% The outputs to the function are F and NA.% Notice the syntax for the function. The output variables are surrounded by brackets,% the <strong>in</strong>put variables are surrounded by parentheses, and the name of the function is% the same as the name of the file.%% This template shows:%% - the syntax for a function%W = 100;L = 2;b = [W,0,W*L/2*cos(beta)]';A = [0,1,cos(theta);1,0,-s<strong>in</strong>(theta);0,0,L*cos(theta-beta)];a<strong>in</strong>v = <strong>in</strong>v(A);x = a<strong>in</strong>v*b;F = x(1);NA = x(2);Table 3: Template for FunctionsThe M-file tfunction.m can also be called from with<strong>in</strong>another program. So can the M-files test1 and test2. Toillustrate this, create the M-file named test2.m and type <strong>in</strong>Table 4. This program determ<strong>in</strong>es the critical angle beta of thebar for which the bar rema<strong>in</strong>s <strong>in</strong> static equilibrium but belowwhich the bar slides (See Fig. A2 – 2). The program test2.mcalls the function tfunction.m <strong>in</strong> a loop, sweep<strong>in</strong>g over a rangeof values of beta between 0 and theta. Each time the function iscalled, the program compares the value of the friction forcewith the maximum allowable level of friction, F max = µN A , tosee if it’s been exceeded. To run test2.m, go to the commandw<strong>in</strong>dow, type <strong>in</strong>test2and hit enter. The command w<strong>in</strong>dow displaysbetacritical = 26.55, which is the critical angle beta<strong>in</strong> degrees, and a figure w<strong>in</strong>dow appears show<strong>in</strong>g two graphs.One graph is of the friction force F versus beta and the secondgraph is of the maximum friction force (above which the barslides) versus beta.Figure A2 – 2: A bar rests on a rough surface at oneend and on a smooth <strong>in</strong>cl<strong>in</strong>ed surface at the other end.7
clearmu = 0.5;theta = pi/4;error = 100;betamax = 0;for i = 1:101beta = (i-1)*theta/100;[F,NA]=tfunction(beta,theta);x(i) = beta*180/pi;y(i) = F;FMAX(i)=mu*NA;er = abs(F-FMAX(i));% The function tfunction is called.% Notice that x <strong>in</strong> test2.m is% different than x <strong>in</strong> tfunction.m.% Quantities are not passed% between programs.endif er
Key Commandsclc, clear, edit, what, whoReview Questions1. What is the <strong>MATLAB</strong> desktop?2. Describe the purpose of a semicolon placed at the end of an<strong>in</strong>struction.3. What command erases what’s <strong>in</strong> the command w<strong>in</strong>dow?4. What command clears all of the variables <strong>in</strong> the workspace?5. Describe the purpose of the commands who and what.ProblemsA2 – 1A W = 50 lb block rests on a rough surface when the frictionforce F act<strong>in</strong>g on the block is less than µN, <strong>in</strong> which N denotesthe normal force act<strong>in</strong>g on the block by the surface and µ = 0.5is the static friction coefficient. When F exceeds 0.5N, theblock beg<strong>in</strong>s to slide. The friction force F and the normal forceN depend on the <strong>in</strong>cl<strong>in</strong>e angle θ by F = 50cosθ and N = 50s<strong>in</strong>θ.Plot the functions F(θ) and µN(θ) on the same graph lett<strong>in</strong>g θrange between 0 and 90 ○ . Determ<strong>in</strong>e from the graph the largestangle θ max for which the block rema<strong>in</strong>s at rest.Answer: θ max = 26.6 ○ (Note that θ max can also be foundanalytically.)A2 – 2A triangular truss is acted upon by a P = 500 lb load, as shown.The load causes a tensile force of F AB = P/s<strong>in</strong>θ <strong>in</strong> member ABand a compressive force of F AC = Pcosθ /s<strong>in</strong>θ <strong>in</strong> member AC.Plot F AB + F AC versus θ. For what angle θ is F AB + F ACm<strong>in</strong>imal?Answer: θ m<strong>in</strong> = 60 ○ (Note that θ m<strong>in</strong> can also be foundanalytically.)9
A2 – 3A L = 15 foot <strong>in</strong>extensible cord is tensioned by a spr<strong>in</strong>g hav<strong>in</strong>ga spr<strong>in</strong>g constant of k = 1000 pounds per foot and anunstretched length of a = 0.25 feet. A W = 20 pound weighthangs from po<strong>in</strong>t A, as shown. After some analysis, the tensionT <strong>in</strong> the cord (<strong>in</strong> pounds), the angle θ of the spr<strong>in</strong>g, and thestretch u of the spr<strong>in</strong>g were found to be related to each other bythe three equationsa = ( a + u) cosθ,W = ku s<strong>in</strong>θ,T = ku cosθ.It was determ<strong>in</strong>ed from these equations that the angle θ of thespr<strong>in</strong>g is constra<strong>in</strong>ed by the equation0 = f(θ) = a – [a + W/(ks<strong>in</strong>θ)]cosθTo f<strong>in</strong>d the angle θ, plot f(θ) over the range of θ between 0 and90 ○ and locate from the graph where f(θ) = 0. Then, f<strong>in</strong>d thetension T <strong>in</strong> the cord and the stretch u <strong>in</strong> the spr<strong>in</strong>g.Answer: θ = 30.321 ○ , T = 34.2 pounds, u = 0.475 <strong>in</strong>ches.A2 – 5A bridge is supported by cables that are suspended from acircular arch, as shown. The number of cables is 2n + 1. Thecables are tensioned to equal tensions T. After some analysis, <strong>in</strong>order to support a 100 kilo-pound weight, it has beendeterm<strong>in</strong>ed that the tension <strong>in</strong> the cables isT =1+2n∑Ws<strong>in</strong> kθ2k = 1 [cos kθ−1/(n + 1)] +s<strong>in</strong>2( kθ)πwhere θ = . Graph the tension T versus n for a range of2 ( n + 1)n between 1 and 10.Answer:T = 34.3, 23.1, 17.7, 14.4, 12.2 ,10.5, 9.27, 8.29, 7.50, 6.84 kilo - pounA2 – 4After analyz<strong>in</strong>g the triangular truss given <strong>in</strong> problem A2 – 2, itwas determ<strong>in</strong>ed that the unknown <strong>in</strong>ternal forces F AB and F ACand the unknown reactions at B and C, denoted by R Bx , R By , andR Cx , are related to each other by the five equations−FFFABAB− F− Fcosθ+ FAC= 0,s<strong>in</strong>θ= 500cosθ+ RBx= 0,s<strong>in</strong>θ+ RBy= 0,+ R = 0ABABACCx<strong>in</strong> which θ = 60 ○ . Plac<strong>in</strong>g the unknowns <strong>in</strong> the column vector x= [F AB F AC R Bx R By R Cx ] T , write these equations <strong>in</strong> matrix-vectorform as Ax = b. Then write a short program, f<strong>in</strong>d A -1 and then x= A -1 b.Answer: F AB = 577 lb, F AC = 289 lb, R Bx = -289 lb, R By = 500 lb,R Cx = 289 lb.10
A2 – 6A stone ornamental bridge be<strong>in</strong>g considered as a gateway to aEuropean city comb<strong>in</strong>es Greek and gothic elements. The cablesare not just ornamental. They also pull together beam A andpillars B. The cables are tensioned to the same tension to pulldown on the beam with a force of 2,500 pounds. The number ofcables is 2n. After some analysis, it has been determ<strong>in</strong>ed thatthe tension <strong>in</strong> the cables isT =2Hn∑250022 2k = 1 L [2 − k /( n + 1)] + H [ k /( n +kwhere L = 7 feet and H = 25 feet. Graph the tension T versus nfor a range of n between 5 and 10.Answer: T = 361, 303, 261, 229, 205, 185 pounds.1)]211