Confidence Factors and Structural Reliability - ReLUIS
Confidence Factors and Structural Reliability - ReLUIS
Confidence Factors and Structural Reliability - ReLUIS

Create successful ePaper yourself
Turn your PDF publications into a flip-book with our unique Google optimized e-Paper software.
to what the CF would signify <strong>and</strong> would guarantee in terms of the structural seismic reliability[Jalayer et al. 2008, Franchin et al. 2008]. This would not be possible without a thoroughcharacterization of the uncertainties in the structural modeling parameters [Monti <strong>and</strong>Aless<strong>and</strong>ri 2008 <strong>and</strong> Jalayer et al. 2008]. Another issue regards the definition of the KL. Thecurrent code definition in Table 1 leaves a lot of room for interpretation; it is independent ofthe spatial configuration <strong>and</strong> the outcome of the test results. Moreover, the logical connectionbetween the numerical values for the confidence factors <strong>and</strong> the onset of the knowledge levelsis not clear.An alternative probabilistic <strong>and</strong> performance-based approach is adopted in theAmerican Department of Energy Guidelines DOE-1020 <strong>and</strong> in SAC-FEMA guidelines. Thissimplified approach leads to an analytic <strong>and</strong> closed-form solution which compares thefactored dem<strong>and</strong> against factored capacity. The factored dem<strong>and</strong> <strong>and</strong> capacity are respectivelyequal to median dem<strong>and</strong> <strong>and</strong> capacity multiplied by some factors. The magnifying dem<strong>and</strong>factors <strong>and</strong> the de-magnifying capacity factors take into account all sources of uncertainty,such as record-to-record variability, structural modeling uncertainty <strong>and</strong> the uncertainty in thecapacities. This approach that is recently known as the Dem<strong>and</strong> Capacity Factor Design(DCFD) [Cornell et al., 2002] takes into account the overall effect of the various types ofuncertainties on a global structural performance parameter. Therefore, in the case of existingbuildings, there is a need for a method that can evaluate the global parameters reflecting theoverall effect of structural modeling uncertainties.The Bayesian framework for probabilistic inference seems to be a perfect basis fortaking into account the results of tests <strong>and</strong> inspection in updating the structural model. Theauthors in a previous work [Jalayer et al. 2008] have demonstrated how the advancedsimulation methods based on Bayesian updating can be used to both update the structuralreliability <strong>and</strong> also the probability distribution for the modeling parameters, in the presence oftest <strong>and</strong> inspection results. However, the application of the advanced simulation schemesrequires a large number of structural analyses <strong>and</strong> there seems to be a need for lesscomputationally intensive methods for updating the structural model <strong>and</strong> structural reliability.The authors [Jalayer et al., 2009] have employed an efficient Bayesian simulation-basedmethod for robust estimation of structural reliability. This method exploits a relatively smallnumber of structural analyses in order to yield the robust reliability for the structure inquestion. The term robust herein refers to the fact that the reliability is calculated taking intoaccount all possible structural models <strong>and</strong> their relative plausibilities.The <strong>Structural</strong> Performance ParameterThe structural performance parameter in the context of this work is a particular kind ofdem<strong>and</strong> to capacity ratio. This parameter which denoted as Y, assumes the value of unity onthe verge of the limit state LS. In the case of static analyses, the capacity spectrum method[Fajfar, 1990] is used to obtain the global dem<strong>and</strong> to capacity ratio. In the case of dynamicanalyses, the cut-set concept in reliability theory is employed to find the critical componentdem<strong>and</strong> to capacity ratio that takes the structure closer to the onset of the limit state LS. Thiscritical dem<strong>and</strong> to capacity ratio corresponds to the strongest component of the weakeststructural mechanism [Jalayer et al., 2007].The SAC-FEMA-type FormulationIn the case of static analyses, the SAC-FEMA formulation reduces to the following:η ⋅ eY1 2β Y2≤ 1Eq. 1
P(Y ( θ ) >⎛ y⎜ log⎜ ηYy)= 1− Φ⎜ βY⎜⎝⎞⎟⎟⎟⎟⎠Eq. 7Where Y is the structural performance index <strong>and</strong> η Y <strong>and</strong> β Y are the median <strong>and</strong> the st<strong>and</strong>arddeviation (of the logarithm) for the probability distribution of the structural performanceindex. Using Bayesian inference, the posterior probability distribution for median <strong>and</strong>st<strong>and</strong>ard deviation based on data Y can be written as [Box <strong>and</strong> Tiao, 1999]:P(η , β | Y ) = kβYY−(n+1)Yνsexp( −ν / 22+ n(logη− logY)2βY2YEq. 82n−1⎛νs⎞k = Γ(ν / 2)2π⎜2⎟⎝ ⎠where Y={Y 1 , …, Y n } is the vector of n different realizations of the structural performanceindex, ν=n-1, logY (overbar) is the mean value for logY <strong>and</strong> ns 2 is sum of the squares of thedeviations from the mean value. The expected value <strong>and</strong> the st<strong>and</strong>ard deviation for theprobability of failure can be calculated from Equations 5 <strong>and</strong> 6 based on the posteriorprobability distribution p(η Y , β Y |Y) in Equation 8. Otherwise, the best-estimate values for themedian <strong>and</strong> st<strong>and</strong>ard deviation can be calculated either as the maximum likelihood pair for theposterior probability distribution function or based on a given (e.g., 84%) confidence.The structural reliability in the presence of modeling uncertainties <strong>and</strong> uncertainties in therepresentation of the ground motion can be calculated from the following LogNormal CDF:⎛ log y − logηP(Y ( θ ) > y | Sa) = 1− Φ⎜⎝ βUTβ2UT= β2Y|Sa+ β2UCY|Sa⎞⎟⎠Eq. 9where η Y|Sa is the median for the probability distribution of the structural performance index<strong>and</strong> β UT is the st<strong>and</strong>ard deviation for the probability distribution of the structural performanceindex. The terms β Y|Sa <strong>and</strong> β UC represent the effect of the uncertainty in the ground motionrepresentation, the uncertainty in the material properties <strong>and</strong> the structural details,respectively. It should be noted that Equation 9 yields the structural fragility; after integratingit with the hazard function for the spectral acceleration, the hazard function for the structuralperformance variable Y can be obtained.Suppose that a selection of n ground motion records are used to represent the effect of groundmotion uncertainty on the structural performance index. Let S a,i <strong>and</strong> Y i represent the spectralacceleration <strong>and</strong> the performance index for the ground motion record i, respectively. Theposterior probability distribution for st<strong>and</strong>ard deviation can be calculated as:2ν / 22−1⎛νs⎞ −(ν + 1) −νsP( βEq. 10UT| Y ) = Γ(ν / 2)⎜exp( )2⎟ βUT2⎝ ⎠2βUTThe data pairs (Y, Sa) are gathered by calculating the structural performance measure for theset of n ground motion records applied at the structural model generated by different2)
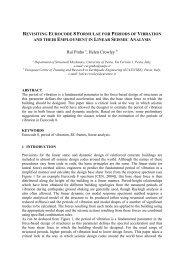
P(θ | Y,Sa⎛ n ⎞Γ⎜⎟=⎝ 2k⎠⎡ ( θ − ˆ) θ) = k⎢1+⎣n∑log S2a,i2− (∑2 ⎛ 1 ⎞ ⎛ n ⎞νsΓ⎜⎟ Γ⎜−1⎟⎝ 2 ⎠ ⎝ 2 ⎠TTX X ( θ −2νslog Sa,iˆ) θ ⎤⎥⎦)2ν + 1−2Figure 4(a) The tri-dimensional view of the scholastic building 4(b) The central frame of thecase-study buildingIn Figure 4a, the tri-dimensional view of the structure is illustrated; it can be observed that thebuilding is highly irregular both in plane <strong>and</strong> elevation. In order to reduce the computational
effort, the main central frame in the structure is extracted <strong>and</strong> used as the structural model(Figure 4b). The columns have rectangular section with the following dimensions: firststorey: 40x55cm 2 , second storey 40x45cm 2 , third storey: 40x40cm 2 , <strong>and</strong> forth storey: 30x40cm 2 . The beams, also with rectangular section, have the following dimensions: 40x70cm 2 atfirst <strong>and</strong> second storey, <strong>and</strong> 30x50 cm 2 for the ultimate two floors. It can be inferred from theoriginal design notes that the steel re-bar is of the type Aq40 <strong>and</strong> the concrete has a minimumresistance equal to 180 kg/ cm 2 [DL1939]. The finite element model of the frame isconstructed assuming that the non-linear behavior in the structure is concentrated in plastichinges.The structural performance indexWhen only the structural modeling uncertainties are considered, the definition ofstructural capacity in this work is based on the limit state of severe damage as proposed by theItalian Code. That is, the onset of critical behavior in the first element, characterized bymember chord rotations larger than 3/4th of the corresponding ultimate chord rotationcapacity. The structural dem<strong>and</strong> is characterized by the intersection of the code-basedinelastic design spectrum <strong>and</strong> the static pushover curve transformed into that of the equivalentSDOF system. As an index for the global structural performance, the ratio of structuraldem<strong>and</strong> to capacity is used. The component shear failure dem<strong>and</strong> to capacity ratios are alsoconsidered; they are combined with the CSM dem<strong>and</strong> to capacity using the cut set theory (seebelow).When the ground motion uncertainty together with the modeling uncertainties aretaken into account, the structural performance index is characterized based on the concept ofcut-sets in structural reliability. A structural cut-set is defined as a set of structuralcomponents that, once all of them have failed, they can transform the whole structure or partof it into a mechanism. Among the set of all possible cut-sets, the critical cut-set is the onethat first forms a global mechanism. Therefore, the performance index is taken as the dem<strong>and</strong>to capacity ratio of the strongest component of the weakest cut-set. In the current work, threetypes of global mechanism are considered: (a) ultimate rotation capacity in the columns (b)formation of soft stories (c) shear failure in the columns. The component yield rotation,ultimate rotation <strong>and</strong> shear capacities are calculated according to the new Italian Unified Code(MIN.LL.PP 2008a,b). It should be noted that the structural performance in both cases signalsfailure when it is great than unity <strong>and</strong> signals no structural failure when it is less than or equalto unity.Calculating the structural Fragility: CSMThe structural fragility based on the capacity spectrum method is estimated employing theefficient Bayesian method described above based on the structural performance parameter fora set of 20 Monte Carlo (MC) realizations of the structural model. These realizations take intoaccount the uncertainties in the material properties <strong>and</strong> the structural defects. The probabilitydistributions for the uncertain parameters are updated according to the increasing knowledgelevels KL o , KL 1 , KL 2 <strong>and</strong> KL 3 . As stated before, these knowledge levels are achieved basedon the EC8 specifications tabulated in Table 1. Thus, for each knowledge level, the 20realizations of the structural model are generated from the (updated) probability distributionscorresponding to the KL’s <strong>and</strong> based on the results of tests <strong>and</strong> inspections. Since the resultsof tests <strong>and</strong> inspections available for the structure in question did not exactly match the EC8criteria, the test results used herein are simulated assuming that all the inspections performedverify the original design values. Figure 5 demonstrates the robust fragility curves (theprobability of failure for a given value of Y) obtained using Equations 5, 7 <strong>and</strong> 8 forknowledge levels KL 1 , KL 2 <strong>and</strong> KL 3 .
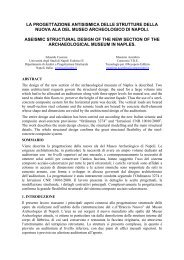
Figure 5 The structural fragility curves for the knowledge levels KL o , KL 1 , KL 2 <strong>and</strong> KL 3 .It can be observed that the upon increasing knowledge levels the dispersion in the fragilitycurves (β Y in Equation 1) decreases but the median η Y remains unchanged as the test resultsall verify the nominal values. However, it can be seen that the structure does not verify theSAF-FEMA criteria in Equation 1 in none of the knowledge levels. That is, because themedian η Y is very close to unity.Mapping out the CF into <strong>Structural</strong> Fragility: Dynamic AnalysesIt is shown previously in this work how the CF can be viewed in an approximate wayfrom the st<strong>and</strong>-point of structural reliability using the non-linear static analyses. In a similarway, it can be shown how the CF can be viewed in the dynamic case. A set of 7 records arechosen compatible with the code-specified spectrum [EC8]. For each CF specified in thecode, the structural performance variable for the set of records is calculated for a structuralmodel (without defects) with material properties divided by that CF. The structuralperformance variable is related to the spectral acceleration using linear regression withparameters η Y|Sa <strong>and</strong> β Y|Sa . The structural fragility is calculated from Equation 9 setting β UCequal to zero. Finally, the structural fragility is integrated with hazard in order to calculate theprobability of failure. Figure 6a illustrates the fragility curve at Y=1 for CF={1,1.2,1.35} Itcan be observed that with increasing values of CF, the probability of failure (Y>1) increases.The resulting hazard curves corresponding to different values of CF is plotted in red in Figure7. It should be noted that dispersion in these hazard curves reflects only the record-to-recordvariability. In a way, similar to Figure 3 for the static case, using increasing values of CF isequivalent to taking into account the structural modeling uncertainties by taking hazard curves(including only the ground motion uncertainty) corresponding to higher confidence levels.Calculating the <strong>Structural</strong> <strong>Reliability</strong>: The Dynamic MethodThe structural hazard curve for increasing levels of knowledge is calculated in this stage byintegrating the robust fragilities <strong>and</strong> the spectral acceleration hazard curve at the site of thestructure (extracted from the site of INGV). For each level of knowledge, the robust fragilityis calculated from Equations 5, 9, 10 <strong>and</strong> 11 using a set of 30 MC realization of the structural
model. The set of MC realizations for each KL are generated based on the corresponding(updated) probability distributions.1Fragility Curve0.90.80.7P(Y>1|S a(T 1))0.60.50.40.30.20.1FC=1FC=1.2FC=1.3500 0.5 1 1.5 2 2.5 3 3.5 4S a(T 1)Figure 6. The Fragility curves corresponding to each CF value, the code-compatible dynamicmethod10 0 Hazard Curve10 −110 −2λ D/C10 −310 −410 −5KL0KL1KL2KL3FC=1FC=1.2FC=1.3510 −610 0D/CFigure 7. The Hazard curves corresponding to different values of CF <strong>and</strong> to different knowledgelevels.The resulting hazard curves are plotted (in black) in Figure 7. It can be observed thatthe with increasing the knowledge level KL, the mean annual frequency of exceeding thestructural performance parameter Y decreases. It can be shown (Jalayer <strong>and</strong> Cornell 2008)that calculating the left-h<strong>and</strong> side of Equation 2 for a given acceptable probability P o isequivalent to finding the value corresponding to P o from the hazard curve for structuralperformance parameter. For example for an acceptable probability of P o =0.002 or 10% in 50
years, the structure does not verify for none of the KL. However, following the CF approach,the structure barely verifies for CF < 1.2.Some Perspectives for EC8 in Light of the Italian ExperienceIn this section, the observations made in this work <strong>and</strong> the previous ones by the authors isused to offer some perspectives for EC8 in the light of this case-study.The knowledge levels (KL) defined by the code leave a lot of room for interpretation. In otherwords, the code-based definition for KL does not lead to a unique configuration of tests <strong>and</strong>inspections. Moreover, it is not clear what level of structural reliability does the application ofthe confidence factors guarantee. Hence, with the emerging of performance-based design <strong>and</strong>life-cycle cost analysis in earthquake engineering, there seems to be a need for a code-basedmethod that bridges the different knowledge levels to structural reliability <strong>and</strong> probabilisticstructural performance assessment. A proper evaluation of the structural performance needs totake into account directly the uncertainties in the structural modeling parameters. Thus, thesuitable approach for assessment of existing buildings is the probabilistic one which accountsfor all the uncertainties. In this sense, the approach of CF can be seen as a deterministic wayof dealing with a probabilistic problem.Intuitively speaking, the relation between the confidence factors <strong>and</strong> the knowledgelevels seems to be highly dependent on the results of in-situ tests <strong>and</strong> inspections. Therefore,it is necessary to adopt a general probabilistic framework for updating the probabilitydistribution for the uncertain parameters based on the test results. The Bayesian frameworkfor inference seems to be perfectly suitable for this end; as it can sequentially incorporate theincoming tests <strong>and</strong> inspection results without discarding any prior information available.There seems to be a need for simple <strong>and</strong> approachable probabilistic performancebasedalternatives to the CF method. These methods can be incorporated in increasing levelsof sophistication depending on the importance of building under assessment. The simplifiedsafety-checking format adopted by the American SAC/FEMA guidelines for the assessment<strong>and</strong> retrofit of existing buildings seems to be an interesting example. This simplified methodtakes into account the effect of all sources of uncertainty (GN, structural modeling) in theglobal performance of the structure. This format is expressed as a function the statisticalparameters of the structural performance parameter.In the context of a simple performance-based assessment approach, different classes ofexisting buildings can be identified <strong>and</strong> analyzed. The prior probability distributions for thestructural modeling uncertainties can be classified <strong>and</strong> tabulated based on the surveys ofexpert opinion <strong>and</strong> experience. It is important to identify those uncertain parameters thataffect the structural response in a dominant way (e.g., the material properties, the distancebetween the shear reinforcement). These prior probability distributions are going to beupdated based on the results of tests <strong>and</strong> inspections. The updated probability distributions areconstructed for various KL’s, based on special cases of tests <strong>and</strong> inspection results. Finally,for different classes of structures <strong>and</strong> different levels of knowledge (<strong>and</strong> a few special cases ofinspection results), the best-estimate values for the parameters defining the adopted safetycheckingformat/structural fragility can be tabulated. In the case of strategic buildings, itwould be useful to recommend some relatively simple <strong>and</strong> approachable methods suitable forcase-specific estimation of the parameters defining the safety checking format <strong>and</strong>/orstructural fragility. This work is a preliminary effort in classifying (for different levels of
analysis sophistication) different methods suitable for the performance-based assessment ofexisting buildings.ReferencesCornell, C. A., Jalayer, F., Hamburger, R. O., <strong>and</strong> Foutch, D. A., (2002), The probabilistic basis for the2000 SAC/FEMA steel moment frame guidelines, ASCE Journal of <strong>Structural</strong> Engineering, Vol.128, No.4, pp. 526-533.Box, G.E.P. <strong>and</strong> Tiao, G.C., Bayesian Inference in Statistical Analysis, Wiley Interscience, 1992.Department of Energy (DOE), 1994. Natural Phenomena Hazards Design <strong>and</strong> Evaluation Criteria forDepartment of Energy Facilities, DOE-STD-1020-94, U.S. Department of Energy, Washington,D.C.EC8 Eurocodice 8 – Parte 3 ENV 1998 1-1. Design of structures for earthquake resistance. 2004.Fajfar, P. Capacity spectrum method based on inelastic dem<strong>and</strong> spectra, Earthquake Engineering <strong>and</strong><strong>Structural</strong> Dynamics; 28:979–93, 1999.Federal Emergency Management Agency (FEMA), 2000. Recommended Seismic Design Criteria forNew Steel Moment-Frame Buildings, FEMA-350, SAC Joint Venture, Washington, D.C.Federal Emergency Management Agency (FEMA), 2000. Recommended Seismic Evaluation <strong>and</strong>Upgrade Criteria for Existing Welded Steel Moment-Frame Buildings, FEMA-351, SAC JointVenture, Washington, D.C.Federal Emergency Management Agency (FEMA), 2000. Recommended Post-Earthquake Evaluation<strong>and</strong> Repair Criteria for Welded Steel Moment-Frame Buildings, FEMA-352, SAC Joint Venture,Washington, D.C.Federal Emergency Management Agency (FEMA), 2000. Pre-St<strong>and</strong>ard <strong>and</strong> Commentary for theSeismic Rehabilitation of Buildings. FEMA 356, Washington, D.C.Franchin P., Pinto P. E., Pathmanathan R., Assessing the adequacy of a single confidence factor inaccounting for epistemic uncertainty, Convegno RELUIS “Valutazione e riduzione dellavulnerabilità sismica di edifici esistenti in cemento armato”, Roma 29-30 maggio 2008.Jalayer, F., <strong>and</strong> Cornell, C. A. (2008), “Alternative Nonlinear Dem<strong>and</strong> Estimation Methodsfor Probability-Based Seismic Assessments”, Early View Earthquake Engineering <strong>and</strong><strong>Structural</strong> Dynamics, 2008.Jalayer F., Iervolino I., Manfredi G., “<strong>Structural</strong> modeling uncertainties <strong>and</strong> their influence on seismicassessment of existing RC structures”, submitted to <strong>Structural</strong> Safety, 2008.Jalayer F., L. Elefante, Iervolino I., Manfredi G., “Small-Sample Bayesian Inference for Estimation of<strong>Structural</strong> Modeling Uncertainty Parameters in Seismic Assessment of Existing RC Buildings”,submitted to ICOSSAR09 Conference, 2009.Monti G., Aless<strong>and</strong>ri S., <strong>Confidence</strong> factors for concrete <strong>and</strong> steel strength, Convegno RELUIS“Valutazione e riduzione della vulnerabilità sismica di edifici esistenti in cemento armato”, Roma29-30 maggio 2008.
MIN.LL.PP, DM 14 gennaio, Norme Techniche per le Costruzioni. Gazzetta Ufficiale della RepubblicaItaliana, 29, 2008a (in Italian).MIN.LL.PP, DM 14 gennaio, Istruzioni per l'applicazione delle Norme Techniche delle costruzioni.Ministero della Infrastruttura, 29, 2008b (in Italian).Ordinanza del Presidente del Consiglio dei Ministri (OPCM) n. 3431, Ulteriori modifiche edintegrazioni all'ordinanza del Presidente del Consiglio dei Ministri n. 3274 del 20 marzo 2003.Gazzetta Ufficiale della Repubblica Italiana n. 107 del 10-5-2005 (Suppl. Ordinario n.85), 2005.Ordinanza del Presidente del Consiglio dei Ministri (OPCM) n. 3519. Criteri per l’individuazionedelle zone sismiche e la formazione e l’aggiornamento degli elenchi delle medesime zone. GazzettaUfficiale della Repubblica Italiana n. 108, 2006.Regio Decreto Legge (R.D.L.) 2229. Norme per l’esecuzione delle opere in conglomerato cementiziosemplice o armato, 1939.Verderame, G.M., Manfredi, G., Frunzio G., Le proprietà meccaniche dei calcestruzzi impiegati nellestrutture in cemento armato realizzate negli anni ’60, X Congresso Nazionale “L’ingegneriaSismica in Italia”, Potenza-Matera 9-13 settembre 2001a.Verderame, G.M., Stella, A., Cosenza, E., Le proprietà meccaniche degli acciai impiegati nellestrutture in cemento armato realizzate negli anni ’60, X Convegno Nazionale “L'IngegneriaSismica in Italia”, Potenza e Matera 9-13 Settembre 2001b.