ELAC Strategic Plan - East Los Angeles College
ELAC Strategic Plan - East Los Angeles College
ELAC Strategic Plan - East Los Angeles College
- No tags were found...

You also want an ePaper? Increase the reach of your titles
YUMPU automatically turns print PDFs into web optimized ePapers that Google loves.
EAST LOS ANGELES COLLEGE2O11STRATEGIC PLAN2O17
EAST LOS ANGELES COLLEGEADMINISTRATIONErnest H. Moreno, PresidentRenee D. Martinez, Vice President of Workforce Education and Economic DevelopmentDr. Richard Moyer, Vice President of Academic AffairsOscar Valeriano, Vice President of Student Services/Special ProgramsTom Furukawa, Vice President of Administrative ServicesJeremy Allred, Dean of Admissions and RecordsGayle Brosseau, Dean of Academic AffairsSelina Chi, Dean of Resource Development/Community RelationsDr. Ryan Cornner, Dean of Institutional EffectivenessKaren Daar, Dean of Academic AffairsDanelle Fallert, Dean of Student ServicesSonia Lopez, Dean of Student Services/ActivitiesVi Ly, Dean of Academic AffairsKerrin McMahan, Dean of Academic AffairsDr. Adrienne Anne Mullen, Dean of Continuing EducationLaura M. Ramirez, Dean of Academic AffairsAl Rios, Dean of Academic Affairs/South GateDr. John Rude, Associate Dean of Resource DevelopmentAngelica Toledo, Associate Dean of CalWORKsMartha Ermias, Assistant Dean of Grants ManagementCLASSIFIED MANAGEMENTErlinda De Ocampo, Associate Vice President of Administrative ServicesGonzalo Mendoza, Manager, <strong>College</strong> Information SystemsKaren Rapp, Director of Vincent Price Art Museum
LOS ANGELES COMMUNITY COLLEGE DISTRICTBOARD OF TRUSTEESMiguel Santiago, PresidentTina Park, First Vice PresidentNancy Pearlman, Second Vice PresidentKelly CandaeleMona FieldScott SvonkinSteve VeresAmber I. Barrero, Student TrusteeADMINISTRATIONDr. Daniel J. LaVista, ChancellorDr. Adriana D. Barrera, Deputy ChancellorDr. Yasmin Delahoussaye, Interim Vice Chancellor for Educational Programs and Institutional EffectivenessFelicito Cajayon, Vice Chancellor for Economic and Workforce DevelopmentThomas Hall, Interim, Executive Director, Facilities <strong>Plan</strong>ning and DevelopmentCamille A. Goulet, General CounselJeanette Gordeon, Chief Financial Officer/Treasurer
TABLE OF CONTENTSCOLLEGE HISTORY……………………………………………………………………………………………………………………. 2Community Support and Enrollment Growth..………………………………………………………………… 2Campus Transportation…………………………………………………………………………………………………… 3COLLEGE STRUCTURE………………………………………………………………………………………………………………. 4EXTERNAL PLANNING INITIATIVES…………………………………………………………………………………………… 10Community Data…………………………………………………………………………………………………………….. 10INTERNAL SCAN………………………………………………………………………………………………………………………. 16<strong>College</strong> Profile…………………………………………………………………………………………………………………. 16Student Preparation and Basic Skills……………………………………………………………………………….. 20Success Indicators…………………………………………………………………………………………………………… 22<strong>Plan</strong>ning Outcomes…………………………………………………………………………………………………………. 23Employee Survey…………………………………………………………………………………………………………….. 29<strong>ELAC</strong>’S STRENGTHS………………………………………………………………………………………………………………….. 30Access and the Benefits of Community <strong>College</strong> Education………………………………………………. 30Community Value of Education………………………………………………………………………………………. 31Persistence of <strong>ELAC</strong> Students………………………………………………………………………………………….. 32Availability of Technology……………………………………………………………………………………………….. 32Student‐Centered Education…………………………………………………………………………………………… 32Dedicated Faculty, Staff and Administration…………………………………………………………………… 33Focus on Accountability………………………………………………………………………………………………….. 33Academic and Support Services Programs………………………………………………………………………. 34<strong>ELAC</strong>’S WEAKNESSES……………………………………………………………………………………………………………….. 35Educational Completions………………………………………………………………………………………………… 35Equity in Student Outcomes…………………………………………………………………………………………… 36Student Preparation……………………………………………………………………………………………………….. 42Campus Involvement………………………………………………………………………………………………………. 44Campus Communication…………………………………………………………………………………………………. 45Fiscal Crisis……………………………………………………………………………………………………………………… 46PLANNING FOR THE FUTURE……………………………………………………………………………………………………. 46EVALUATION…………………………………………………………………………………………………………………………… 48<strong>East</strong> <strong>Los</strong> <strong>Angeles</strong> <strong>College</strong> | <strong>Strategic</strong> <strong>Plan</strong> 2011‐2017 1
COLLEGE HISTORY<strong>East</strong> <strong>Los</strong> <strong>Angeles</strong> <strong>College</strong> (<strong>ELAC</strong>) is a large urban college which serves more Latino students annually thanany other community college in the California Community <strong>College</strong> System. <strong>ELAC</strong> serves an importantrole in its community through its academic, career‐technical, noncredit, student support service andPublic Service Academy programs. These offerings serve as gateways to a better life for many in thecommunity and as a primary access point to higher education for a population that has traditionallybeen underrepresented in post‐secondary education. <strong>ELAC</strong>’s primarily Hispanic/Latino and Asianstudent body reflects its service area population and is indicative of the college’s dedication toincreasing access and success in higher education for underrepresented populations. The college offersa full spectrum of degree programs, career certificate programs, and transfer curriculum that allowsstudents to successfully complete their educational goals. In addition, the college offers the opportunityfor students to engage in an educational plan that promotes individual personal development. In thismanner, <strong>ELAC</strong> represents the promise of new opportunities to the community and a gateway to successfor many students.<strong>East</strong> <strong>Los</strong> <strong>Angeles</strong> Junior <strong>College</strong> was established in June 1945 by the <strong>Los</strong> <strong>Angeles</strong> City Board of Education.The college opened its doors for the Fall 1945 semester in September in a wing of Garfield High School,boasting 19 faculty members and 117 students, many of whom were World War II veterans.The college quickly outgrew the borrowed high school facilities. In 1947, the Board of Education wasable to purchase 82 acres of agricultural land in what was then <strong>East</strong> <strong>Los</strong> <strong>Angeles</strong>, thanks to funding froma bond issue. Two years later, in January 1949, classes began at the college’s present location inwooden bungalows moved to the campus from the Santa Ana Army Base. More than 1,700 studentsenrolled that year.An evening program that began in 1947 was expanded and offered at many locations. By 1954, thepopular program offered classes at 25 different locations. The Civic Center program alone enrolled over1,900 students that year.In 1948 a name change was proposed. <strong>Angeles</strong> Bella Vista <strong>College</strong>, Ramona Hills <strong>College</strong> and Hillview<strong>College</strong> were considered. The following year “Junior” was dropped and the name <strong>East</strong> <strong>Los</strong> <strong>Angeles</strong><strong>College</strong> (<strong>ELAC</strong>) was firmly established.Permanent buildings were constructed to accommodate growing enrollment. In 1951 the stadium andauditorium were built. More classrooms, an administration building, a library, a planetarium, men’s andwomen’s gyms, a swim stadium, a theater, and an art gallery followed.Community Support and Enrollment GrowthToday’s Vincent Price Art Museum began with a gift from Vincent Price —noted actor and art collector—who donated 90 pieces from his collection to establish the first “teaching art collection” in 1957. Overthe years, the collection has grown to more than 8,000 pieces including works on paper, paintings and<strong>East</strong> <strong>Los</strong> <strong>Angeles</strong> <strong>College</strong> | <strong>Strategic</strong> <strong>Plan</strong> 2011‐2017 2
three‐dimensional art work. This collection provides an extraordinary and unique resource for studentsto see original art firsthand in order to supplement courses in art history and art appreciation.During the 1960s and 1970s, buildings were added to campus to house the nursing program, a newlibrary and later the automobile technology center. Many of the original bungalows were still used asclassrooms until 2007 when they were finally demolished to make way for new campus structures.In 1969, the California State Legislature clearly defined higher education in the state and designated the(then) eight community colleges of the <strong>Los</strong> <strong>Angeles</strong> Unified School District as the <strong>Los</strong> <strong>Angeles</strong>Community <strong>College</strong> District (LACCD). A seven‐member Board of Trustees was elected to govern the newdistrict. Today, the <strong>ELAC</strong> service area, home to more than 1.5 million people, includes the communitiesof Alhambra, Bell, Bell Gardens, City of Commerce, Cudahy, <strong>East</strong> <strong>Los</strong> <strong>Angeles</strong>, Huntington Park, <strong>Los</strong><strong>Angeles</strong>, Maywood, Montebello, Monterey Park, Rosemead, San Gabriel, South San Gabriel, South Gate,and Vernon.In 1972, the City of Monterey Park annexed the <strong>College</strong> and surrounding neighborhood, officiallychanging the main campus address. <strong>ELAC</strong> began growing, adding faculty members, programs and classesas demand for higher education increased.During the 1984 Olympic Summer Games, <strong>ELAC</strong> hosted swimming and field hockey events, welcomingthousands of spectators to campus and increasing the international visibility of the <strong>College</strong>. Despitefunding challenges that limited growth during the 1980s, <strong>ELAC</strong> continued to offer a variety of vocationaland transfer programs.Campus TransformationDuring the 1990s <strong>ELAC</strong> experienced unprecedented growth and change. Enrollment grew from 13,000to approximately 30,000 students and the number of permanent faculty almost doubled. Outreachprograms were located throughout the service area for the convenience of students who could noteasily travel to the main campus. In August 1997, the full‐service South Gate Educational Center wasestablished in the southern part of the service area so that students could complete a transfercurriculum and several career programs without attending the main campus. In 2007, a third site wasopened in Rosemead to serve students in the northeastern portion of <strong>ELAC</strong>’s service area.Growth during the first decade of the 21 st century was not limited to increasing enrollment. Anemphasis on student‐centered education and on providing support that engendered student successincreased <strong>ELAC</strong>’s graduation numbers. Between 2000 and 2005, <strong>East</strong> <strong>Los</strong> <strong>Angeles</strong> <strong>College</strong> graduated thehighest number of Latinos in California.In 2000, two bond issues, Propositions A and AA, initiated by the LACCD, were approved by voters.Funding of over $281 million allowed <strong>ELAC</strong> to begin the most ambitious building program in its history tosubstantially improve the <strong>College</strong>’s infrastructure. In the fall of 2004, a state‐of‐the‐art technology<strong>East</strong> <strong>Los</strong> <strong>Angeles</strong> <strong>College</strong> | <strong>Strategic</strong> <strong>Plan</strong> 2011‐2017 3
uilding opened that was started with state funds and completed with bond money. This building wasthe first of many buildings and improvements that are planned or under construction.By the spring of 2011, after almost a decade of planning and construction, more than 240,000 squarefeet of classroom, student services and administrative space were added to the <strong>College</strong> facilities. Inaddition to buildings, a 1,800 space parking structure was constructed to provide access to the heart ofthe campus. The Baum Center, located on the east side of the college’s new entry plaza, wasremodeled to be a comprehensive facility for administrative services, complete with a six‐room facultyconference center. Across the entry plaza is the newly completed Student Services Center that housesadmissions, testing, counseling, and financial services under one roof to maximize student access toenrollment services.The Visual and Performing Arts Center, a $65 million, three‐building complex located at the easterngateway to the campus, is anchored by a 77,000 square feet two‐story building that is now home to theDance, Music, and Visual Arts disciplines. The Theater Department is housed separately in a two‐storybuilding that includes a traditional proscenium stage theater and a flexible black box performing space.The facility also includes workshops for costuming and stage design as well as classrooms to allow forinstruction to occur simultaneously with performance preparation. The Vincent Price Art Museum, thethird building in the center, is equipped with seven galleries, the Thomas Silliman Vault for storing thecollection, and a 129‐seat “smart” lecture hall to accommodate art history classes and guest lectures.Currently, construction continues on a replacement classroom building, the renovation of the BaileyLibrary, a second parking structure located on the northeast corner of the campus, a Transit Mall, andmodernization of the sports stadiums and playing fields. In addition, an off‐campus building in nearbyCorporate Center has been purchased and is undergoing renovation to serve as the Health CareersCenter.Funding from a third bond approved in 2008 will continue campus transformation into the comingdecade. The South Gate Educational Center acquired a 19‐acre site across the street from its currentlocation. The new site, which is projected to open in 2015, will be developed into a campus completewith a parking structure, a new classroom building and a retrofitted space that will accommodatevarious student services.On the main campus, plans for a Math and Science Building, Student Success Center, bookstore andgardens, plazas, and additional classrooms are moving towards approval and construction. With theseenhancements, <strong>East</strong> <strong>Los</strong> <strong>Angeles</strong> <strong>College</strong> will be positioned to provide the highest quality education andservices to its students and community for decades to come.COLLEGE STRUCTUREThe strategic planning structure at <strong>ELAC</strong> reflects the college’s commitment to shared governance and toobtaining campus‐wide and community input on college goals and objectives that will shape the<strong>East</strong> <strong>Los</strong> <strong>Angeles</strong> <strong>College</strong> | <strong>Strategic</strong> <strong>Plan</strong> 2011‐2017 4
college’s future. The <strong>ELAC</strong> Shared Governance Council (ESGC) serves as the central governing body forall planning decisions and makes recommendations directly to the college president as part of theshared governance process. In addition to the ESGC, the <strong>Strategic</strong> <strong>Plan</strong>ning Committee (SPC),Educational <strong>Plan</strong>ning Subcommittee (EPSC), Facilities <strong>Plan</strong>ning Subcommittee (FPSC), Technology<strong>Plan</strong>ning Subcommittee (TPSC), Program Review and Viability Committee (PRVC), and the BudgetCommittee also play key roles in the development and implementation of the college planning agenda.The Office of Institutional Effectiveness facilitates the development of the college planning documentsand assists in the implementation and evaluation of the planning agenda.Academic Senate<strong>ELAC</strong> Shared Governance CouncilBudgetCommittee<strong>Strategic</strong> <strong>Plan</strong>ningCommitteeEducational<strong>Plan</strong>ningSubcommitteeFacilities <strong>Plan</strong>ningSubcommitteeTechnology<strong>Plan</strong>ningSubcommitteeProgram Reviewand ViabililityCommitteeDistanceEducationCommitteeEnrollmentManagementCommitteeMatriculationAdvisoryCommitteeOff‐SiteCommitteeSLO CommitteeStudent SuccessCommitteeTransferCommitteeAll college planning agendas are created through data‐driven processes that include national, state,local, and campus‐level data. The Office of Institutional Effectiveness provides comprehensive collegedata on student outcomes and college core indicators of success. The college is also guided by theobjectives set forth in the District <strong>Strategic</strong> <strong>Plan</strong>. Through the use of quantitative and qualitative data,and the direction of the District <strong>Strategic</strong> <strong>Plan</strong>, the college regularly reviews its own strategic andplanning objectives. In addition, the Program Review process is used to substantiate the efforts madeby departments to improve student learning and to identify the needs of <strong>ELAC</strong> students and thesurrounding community. The Program Review and Viability Committee reviews and updates thecollege’s Program Review <strong>Plan</strong> every six years. This plan includes the schedule for conductingComprehensive Program Review and Annual Update <strong>Plan</strong>s. The Comprehensive Program ReviewQuestionnaire focuses on the manner in which each program is supporting the agenda items listed inthe <strong>Strategic</strong> <strong>Plan</strong>. In addition, the Comprehensive Program Review and Annual Update <strong>Plan</strong>s utilizeStudent Learning Outcomes to assess the degree to which departments and programs are working toimprove the student learning process and creating improvements in student outcomes. Annual Update<strong>Plan</strong>s are completed in between comprehensive reviews to determine the progress made in respondingto Comprehensive Program Review recommendations and the program or department’s own unit goals.The Annual Update <strong>Plan</strong>s serve as the basis for resource allocation decisions, such as hiring of newfaculty and staff, purchase of new equipment, and increases or decreases to a unit’s base budget. TheComprehensive Program Review and Annual Update <strong>Plan</strong>s provide essential data in the development,implementation, and evaluative planning processes.<strong>East</strong> <strong>Los</strong> <strong>Angeles</strong> <strong>College</strong> | <strong>Strategic</strong> <strong>Plan</strong> 2011‐2017 5
All college planning is conducted using evaluation cycles focused on continuous quality improvement forall instruction, student services, and administrative programs. <strong>ELAC</strong> enters into six‐year planning cyclesin which the college progresses through phases of <strong>Plan</strong>ning, Implementation, and Evaluation (PIE). Byincorporating formative evaluations into operational decision‐making, <strong>ELAC</strong> ensures that these annualprocesses are subject to self‐reflective examination on an ongoing basis and that lessons learnedcontribute to improvements in these processes. Data‐driven measures and formative evaluationscontribute to a summative evaluation of the strategic plan implementation at the end of its six‐yearcycle. The link between the formative evaluations and summative evaluation ensures that continuousquality improvement is ongoing and is the driving force for revisions to the strategic plan. Through thismodel, the college ensures that all programs, as well as the college’s governing and decision‐makingprocesses, are regularly and thoroughly evaluated.The <strong>Strategic</strong> <strong>Plan</strong>ning Committee (SPC) is a standing committee that serves to regularly review andrevise the <strong>College</strong>’s Mission, Vision, and strategic goals as needed. Membership on this committeeensures representation from all vital constituent groups and those with the requisite knowledge toformulate the college planning agenda. The SPC is responsible for overseeing the implementationprocess of the strategic and master plans and reviewing ongoing formative evaluations. The committeeis convened every six years for a formal review of the college’s current planning agendas and relevantdata in order to determine if revisions are needed and, should it be determined to be warranted,construct a revised <strong>College</strong> Mission and <strong>Strategic</strong> <strong>Plan</strong>. The committee works to ensure that there is athorough evaluation of the current planning agendas and that the <strong>Strategic</strong> <strong>Plan</strong> includes a review of allrelevant data. To this end, the committee reviews a standard set of vital data elements and meets toselect additional elements that are deemed needed for the college’s planning efforts. The standard dataelements include:1. District and state strategic plans2. The formative evaluations and implementation history of the previous strategic plan3. The college external scan, internal scan, college profile, and core indicators4. Student surveys5. Comprehensive program review and annual update results6. Program student learning outcomes and college core competencies to institutional learningoutcomes7. Any additional information relevant to the revision of the strategic planThe goals developed for the <strong>Strategic</strong> <strong>Plan</strong> serve as broad objectives that all areas of the institutionshould strive to meet. In this manner, these goals serve as guidance in the development of specificcollege plans as well as those actions planned through the departmental or unit specific efforts. Eachplanning subcommittee (Educational, Technology and Facilities) creates objectives or planned actionsthat will lead to the fulfillment of the <strong>Strategic</strong> <strong>Plan</strong>ning goals.Efforts to develop the college’s 2011‐2017 <strong>Strategic</strong> <strong>Plan</strong> began with a meeting in the summer of 2010.The <strong>Strategic</strong> <strong>Plan</strong>ning Committee met and reviewed available data and the previous planning agendasof the college, district and state. Based on these data, the committee was guided through a process todevelop additional data elements thought necessary in determining the needs of the college and itsfuture direction. The following table describes the elements determined by the committee to be neededfor the data‐driven planning process.<strong>East</strong> <strong>Los</strong> <strong>Angeles</strong> <strong>College</strong> | <strong>Strategic</strong> <strong>Plan</strong> 2011‐2017 6
Category <strong>Plan</strong>ning Question Data <strong>Plan</strong>ning UseExternal Scan ‐CommunityData<strong>College</strong>‐LevelDataWhat does our community look like?What will be the impact of the Cal Stateproficiency testing?Are we the cultural center of the community?What are the growth fields in the community?Are there successful practices in California that wecan apply to how we teach those with the lowestsuccess rates?What is the academic preparation of thecommunity?What does our general student body look like?How do we know that students are actuallylearning as a result of the efforts to providestudent‐centered instruction?How is sustainability integrated into our generalstudent population?What is the size of the college?How successful are we?To what extent does the background of studentsimpact success (language and demographics)?Are we providing access to underrepresentedpopulations?EMSI ‐ demographics (<strong>ELAC</strong>,South Gate, Rosemead)Qualitative review of the policyand its relationship to thecollege policies and studentpopulationUnknown ‐ need input from SPC(potential list of other culturaloutlets in the community)EMSI ‐ business growth areas byneeded educationCalifornia benchmarking,literature reviewMadrid study; High SchoolAcademic Performance Index(API) and California High SchoolExit Examination (CHSEE) resultsDemographics; assessment andplacement; residence, StudentSurvey 2007, 2009, 2010Student Learning OutcomesUnknown<strong>College</strong> enrollment, Full‐TimeEquivalent Students (FTES)ARCC, district Indicators, collegecore indicators<strong>College</strong> core indicators<strong>College</strong> core indicators, districtcore indicatorsDetermine whether current programming meetsthe needs of the communityDetermine whether the current studentpopulation is representative of the communityDetermine future needs of the student bodypopulation and the communityComplete the current strategic priority anddetermine its applicabilityDetermine need in career‐technical areasDetermine alternative successful practicesDeterminate need for basic skills programmingand other support servicesDetermine student populationDetermine validity of measures and overallstudent successDetermine applicability of college strategicprioritiesDetermine factors related to college successDetermine the progress made in current plan andbenchmark a starting point for future plansDetermine factors related to college successDetermine the progress made in current plan andbenchmark a starting point for future plans<strong>East</strong> <strong>Los</strong> <strong>Angeles</strong> <strong>College</strong> | <strong>Strategic</strong> <strong>Plan</strong> 2011‐2017 7
Category <strong>Plan</strong>ning Question Data <strong>Plan</strong>ning UseWhich programs have greater rates of student<strong>College</strong> database, facultysuccess; what have been the trends in thoseDetermine successful techniques used on campusinterviewareas?Program‐LevelData<strong>College</strong><strong>Plan</strong>ningAre there different demographic representationsacross departments?<strong>College</strong> databaseDetermine student equity and diversity amongdepartments<strong>College</strong> database ‐ high schoolHow successful is high school outreach?Determine success of programto collegeHow many noncredit students continue into credit <strong>College</strong> database ‐ noncredit toDetermine success of programand to which classes?creditWhat is the success rate of online education? <strong>College</strong> database Determine success of programStudent Survey 2010,Does receiving counseling impact studentintegration of multiple data Determine success of programsuccess?systemsWhat is the use of the various support services?Effectiveness?How would prerequisites of English impact overallstudent success?How do Personal Development courses impactsuccess?Is it possible to deliver services and courses in away to discourage students from taking generalcourses prior to basic skills?Does taking basic skills improve overall successrates?Could we identify the revenue and cost ofdifferent programs and services and align that toeffectiveness?How are we doing and how can we improvebudget and planning processes?What is the current understanding of the collegeplanning structure and the manner in which theplanning agenda is developed?How successful have we been in completing ourplans?Student Survey 2010,integration of multiple datasystems<strong>College</strong> database ‐ comparisongroups<strong>College</strong> database ‐ comparisongroupsQualitative analysis<strong>College</strong> database ‐ comparisongroups, Melguizo report<strong>College</strong> database, SAPEmployee surveyEmployee surveyFormative evaluations,employee survey, quantitativereportingDetermine success of programDetermine factors related to college successDetermine factors related to college successDetermine factors related to college successDetermine factors related to college successDetermine factors related to college success andcost efficiencyDetermine college needs and planningimplementationDetermine college needs and planningimplementationDetermine college needs and planningimplementation<strong>East</strong> <strong>Los</strong> <strong>Angeles</strong> <strong>College</strong> | <strong>Strategic</strong> <strong>Plan</strong> 2011‐2017 8
Category <strong>Plan</strong>ning Question Data <strong>Plan</strong>ning UseWhat is the possibility of offering noncreditDetermine college needs and planningQualitative analysisclasses and workshops related to basic skills?implementationStudentSuccessWhat has the enforcement of prerequisites doneto impact student success?What percentage of our students want onlineeducation?Is the college fostering a community of experts inteaching and learning?<strong>College</strong> database (numbers maynot be large enough forstatistical analysis)Student enrollment and surveysEmployee survey, professionaldevelopment recordsDetermine factors related to college successDetermine college needs and planningimplementationDetermine factors related to college success andsuccess of college planning agendas<strong>East</strong> <strong>Los</strong> <strong>Angeles</strong> <strong>College</strong> | <strong>Strategic</strong> <strong>Plan</strong> 2011‐2017 9
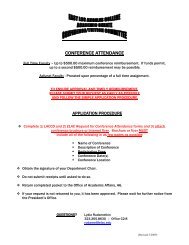
The requested data were compiled and provided to the committee in the comprehensive <strong>Strategic</strong><strong>Plan</strong>ning Data Report. This report is also available to the college community and public to aid in makingdecisions and allow other groups to better understand the needs of the college and its community.Given the extensive nature of the data created for the planning committees, a brief summary of themost vital aspects of this data set is provided below to inform the reader of the process through whichthe college determined its strategic planning goals.EXTERNAL PLANNING INITIATIVESAs part of a multi‐college district, <strong>East</strong> <strong>Los</strong> <strong>Angeles</strong> <strong>College</strong> is guided by the strategic planning agendaprovided by the District Office. The first formal <strong>Strategic</strong> <strong>Plan</strong> in the history of the <strong>Los</strong> <strong>Angeles</strong>Community <strong>College</strong> District was adopted by the Board of Trustees on January 24, 2007. The result of ayear‐long district‐wide effort, the plan sets priorities that will guide district actions and initiatives duringthe next five years. It also serves to align district goals and priorities with those established in theCalifornia Community <strong>College</strong> System <strong>Strategic</strong> <strong>Plan</strong>. The <strong>Strategic</strong> <strong>Plan</strong> outlines five overarching goalsand 33 related objectives for the nine LACCD colleges and the District Office. The District <strong>Plan</strong>ningCommittee (DPC) oversees the plan's implementation and works to coordinate the future planningefforts of all nine district colleges. As the District embarks on its review of the District <strong>Strategic</strong> <strong>Plan</strong>,<strong>ELAC</strong> will continue to work to provide information and evidence relevant to college‐specific needs. Inthis manner, the college will work to ensure a thorough integration between college and districtplanning. As a standing committee, the <strong>Strategic</strong> <strong>Plan</strong>ning Committee will meet to review any changes inthe District <strong>Strategic</strong> <strong>Plan</strong> that occur mid‐cycle and determine whether adjustments are needed in orderto best align with District planning objectives. The current major planning goals for the <strong>Los</strong> <strong>Angeles</strong>Community <strong>College</strong> District are:I. Access: Expand Educational Opportunity and AccessII. Success: Enhance All Measures of Student SuccessIII. Excellence: Support Student Learning and Educational ExcellenceIV. Accountability: Foster a District‐wide Culture of Service and AccountabilityV. Collaboration and Resources: Explore New Resources and External PartnershipsCommunity Data<strong>East</strong> <strong>Los</strong> <strong>Angeles</strong> <strong>College</strong> provides educational programming to the communities surrounding its mainMonterey Park campus and satellite campuses in South Gate and Rosemead. Additional populations arereached through course offerings held at local high schools, and these offerings have expanded thecollege’s sphere of influence even further. The LACCD‐defined service area is shown below and gives anidea of the communities that <strong>ELAC</strong> serves. However, the actual sphere of influence of the collegereaches beyond those communities and shows the manner in which the college has sought to reach outto new communities and provide essential educational programming to the diverse communities itserves. The college’s service area has a population of over 1.5 million people and is expected to grow ata rate faster than the district, county, state, and the nation. In addition, current population estimatesreport that over 43% of <strong>ELAC</strong>’s service area population is under the age of 25. The combined growth andage data support a robust population in need of academic and career‐technical training.<strong>East</strong> <strong>Los</strong> <strong>Angeles</strong> <strong>College</strong> | <strong>Strategic</strong> <strong>Plan</strong> 2011‐2017 10
District‐defined <strong>ELAC</strong> Service Area<strong>ELAC</strong> Sphere of InfluenceThe demographic profile of the college service area indicates that <strong>ELAC</strong> serves a large minoritypopulation, with Hispanic/Latino residents representing the largest demographic group. The college isrepresentative of this population, and it is one of the largest Hispanic‐serving institutions in the nationand is nationally ranked for the number of degrees conferred to Latino students. The ethniccharacteristics of the student population have remained stable during the last five years with only smallchanges in the ratios for each ethnic group.The data can be further disaggregated to demonstrate the differences in the college’s main service areaand that of its South Gate Educational Center. The following table indicates that there is a greaterproportion of Hispanics/Latinos in the South Gate population. In addition, the South Gate population isyounger than the general service area.Service Area Population by Ethnicity2010 Estimated Population<strong>ELAC</strong>South GateEthnicityN % N %African‐American 36,518 2.4% 61,827 6.90%Asian 213,851 14.0% 10,635 1.19%Caucasian 95,198 6.2% 25,454 2.84%Hispanic/Latino 1,161,566 76.0% 787,589 87.86%Others 21,810 1.4% 10,935 1.22%Total 1,528,943 100% 896,440 100 %Source: Economic Modeling Specialists Inc. (EMSI) Complete Employment – 1 st Quarter 2010 Totals for demographic figures may not be equal due to rounding error. EMSI accessed on 6/9/2010 and data are subject to change thereafter.<strong>East</strong> <strong>Los</strong> <strong>Angeles</strong> <strong>College</strong> | <strong>Strategic</strong> <strong>Plan</strong> 2011‐2017 11
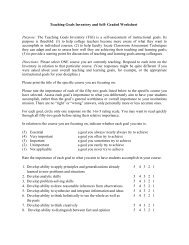
<strong>ELAC</strong>’s service area includes more than 50,000 households below the poverty line (based on the 2000Census). Conditions created by poverty require the college to increase support to students throughancillary services while they are working toward their educational goals. This support includes increasingthe accessibility of student services, such as financial aid. In addition, the college serves a densepopulation. The following graph depicts the results of the Madrid study, an external scan contracted bythe district, it shows the density with which poverty exists throughout the <strong>ELAC</strong> service area. Thecombination of a dense, traditionally underrepresented, young and impoverished service areapopulation is indicative of the strong need for the college to provide robust academic and careertechnicalprograms.Data on the educational attainment of <strong>Los</strong> <strong>Angeles</strong> County residents further exemplify the need forhigher education in the <strong>ELAC</strong> service area. Approximately 22.3% of <strong>Los</strong> <strong>Angeles</strong> County residents overthe age of 25 never received a high school diploma, and an additional 41.3% report completing highschool diploma as their highest level of degree attainment. Furthermore, the data more specificallyshow that 41.5% of Hispanic/Latino <strong>Los</strong> <strong>Angeles</strong> County residents over the age of 25 have never receiveda high school diploma.<strong>East</strong> <strong>Los</strong> <strong>Angeles</strong> <strong>College</strong> | <strong>Strategic</strong> <strong>Plan</strong> 2011‐2017 12
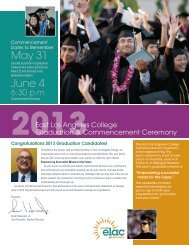
<strong>Los</strong> <strong>Angeles</strong> County Educational Attainment by Ethnicity100%80%60%34.21%58.78% 53.25%15.67%42.81%35.91%<strong>College</strong> Degree40%20%0%54.61%29.42% 40.54%11.18% 11.79% 6.21%41.52%51.73%12.37%High School DiplomaLess Than High SchoolSource: Economic Modeling Specialists Inc. (EMSI) Complete Employment – 3 rd Quarter 2010 This data only includes population over the age of 25. EMSI accessed on 11/24/2010 and data are subject to change thereafter.Although utilizing a separate methodology and data set, there are some data available related toeducational attainment within the <strong>ELAC</strong> service area. The Madrid study indicates that the educationalattainment within <strong>ELAC</strong>’s “extended service area” (calculated as a result of analysis of studentenrollment) is much lower than that of the County. Given the high proportion of Hispanics/Latinos in the<strong>ELAC</strong> service area, the Madrid data are reflective of the overall <strong>Los</strong> <strong>Angeles</strong> County data, whichdemonstrate a gap in educational attainment between Hispanics/Latinos and other ethnic groups. Asone of the largest Hispanic/Latino serving institutions in the state, <strong>ELAC</strong> serves an important role inaddressing the educational needs of this population and in working to diminish the inequity of degreeattainment in <strong>Los</strong> <strong>Angeles</strong> County.Education Attainment Within <strong>ELAC</strong>’s Service AreaEducational Attainment N %Less than 9th Grade 421,764 28.59%Some High School, No Diploma 287,509 19.49%High School Diploma (Includes Equivalency) 280,199 18.99%Some <strong>College</strong>, No Degree 217,868 14.77%Associate’s Degree 70,553 4.78%Bachelor’s Degree 132,551 8.98%Master's Degree 39,553 2.68%Professional School 18,399 1.25%Doctorate 6,919 0.47%<strong>East</strong> <strong>Los</strong> <strong>Angeles</strong> <strong>College</strong> | <strong>Strategic</strong> <strong>Plan</strong> 2011‐2017 13
The following table lists the top feeder high schools for the main <strong>ELAC</strong> campus and the Rosemead andSouth Gate Educational Center satellite campuses. All top feeder schools have a majority of studentswho are socioeconomically disadvantaged, with some schools having over 90% of their student bodyfitting this category. There are also indications that students arriving from local feeder schools may needadditional basic skills curriculum to succeed at the college level. The API presented for each school is anumeric index (or scale) based on state standardized scores that range from a low of 200 to a high of1000. Any score over 800 is considered passing by the federal No Child Left Behind Act. In addition, thestatewide list of API scores is divided into ten equal groups (deciles) ranked from highest (10) to lowest(1). Half of the major feeder schools rank among the lowest in the state. These API scores and ranks areindicative of the lack of preparation of students entering <strong>ELAC</strong>. As a result, the college has maintained acontinued focus on basic skills programming as a venue to enhance student success regardless ofcollegiate preparation.Rank<strong>ELAC</strong> Service Area High School API ScoresNumberofSocioeconomicallyStudentsHigh SchoolDisadvantagedIncludedStudents (%)in the2009 API2009BaseAPI2009StatewideAPI Rank1 Garfield (James A.) Senior High 3,210 98.4% 593 12 Roosevelt (Theodore) Senior High 3,224 90.0% 576 13 Huntington Park Senior High 2,991 98.3% 568 14 George Miller Schurr High 2,439 74.0% 707 45 Bell Senior High 3,112 96.2% 640 26 South Gate Senior High 2,360 83.6% 640 27 Montebello High 2,376 82.0% 659 38 Mark Keppel High 1,661 63.9% 829 99 Alhambra High 2,264 69.6% 751 610 Wilson (Woodrow) Senior High 1,758 80.5% 600 111 Bell Gardens High 2,363 93.4% 650 212 San Gabriel High 1,770 85.4% 748 613 Lincoln (Abraham) Senior High 1,910 91.2% 588 114 Fremont (John C.) Senior High 3,131 87.7% 524 115 Bravo (Francisco) Medical Magnet High 1,305 86.5% 815 916 Lynwood Senior High 2,002 91.9% 591 117 El Rancho High 2,333 62.1% 695 418 Jefferson (Thomas) Senior High 1,361 98.6% 514 119 Jordan (David Starr) Senior High 948 89.2% 559 120 South <strong>East</strong> High 1,918 89.6% 590 1Source: California Department of Education (CDE) – Academic Performance Index (API), http://www.cde.ca.gov/ta/ac/arCDE – API Reports and Data Files accessed on 7/13/2010 and data are subject to change thereafter.Notes: High School ranks are based on 2009 Fall Term headcount figures for <strong>East</strong> <strong>Los</strong> <strong>Angeles</strong> <strong>College</strong>. “SocioeconomicallyDisadvantaged Students” is a referent for students that were included in the 2009 API.<strong>East</strong> <strong>Los</strong> <strong>Angeles</strong> <strong>College</strong> | <strong>Strategic</strong> <strong>Plan</strong> 2011‐2017 14
Workforce education represents a large portion of <strong>ELAC</strong>’s educational programming. In order tomaintain appropriate programs that lead to economic advancement, career‐technical departments willcollect data related to the availability of jobs and career opportunities throughout the state. Theseobjectives are achieved at a department level through the collection of labor reports, use of advisorygroups and the development of employer surveys. The following data represent one of the larger‐scalereports available to these departments and the college at large. This report provides data on the topoccupations in the <strong>ELAC</strong> service area. These data provide information relevant to the training needs ofthe community and the manner in which programs can be developed to meet the needs of the businesscommunity and <strong>ELAC</strong> students. The median pay rate provides evidence of the ability to train students tooccupy jobs that serve the community and provide a venue for economic advancement.Number of Jobs/Occupations: <strong>ELAC</strong>CurrentDescription2010 2019Median∆ ∆%Jobs JobsHourlyEarningsHealthcare support occupations 117,007 146,470 29,463 25% $12.78Healthcare practitioners and technicaloccupations223,877 268,846 44,969 20% $35.97Life, physical, and social science occupations 51,360 61,209 9,849 19% $26.57Business and financial operations occupations 313,980 367,540 53,560 17% $24.84Computer and mathematical science occupations 107,914 124,762 16,848 16% $33.12Arts, design, entertainment, sports, and mediaoccupations333,853 382,593 48,740 15% $19.63Education, training, and library occupations 324,184 372,134 47,950 15% $29.08Sales and related occupations 739,663 842,231 102,568 14% $14.53Community and social services occupations 68,268 77,869 9,601 14% $18.87Legal occupations 60,043 68,474 8,431 14% $44.64Construction and extraction occupations 188,478 212,933 24,455 13% $22.28Protective service occupations 110,733 124,580 13,847 13% $19.96Management occupations 414,917 463,891 48,974 12% $34.41Building and grounds cleaning and maintenanceoccupations249,445 279,625 30,180 12% $10.03Personal care and service occupations 257,287 282,667 25,380 10% $10.96Transportation and material moving occupations 338,764 369,458 30,694 9% $14.45Office and administrative support occupations 861,644 930,346 68,702 8% $15.78Installation, maintenance, and repair occupations 161,765 174,101 12,336 8% $19.83Architecture and engineering occupations 81,547 85,948 4,401 5% $37.64Food preparation and serving‐related occupations 336,214 348,234 12,020 4% $9.66Farming, fishing, and forestry occupations 7,023 7,264 241 3% $11.28Military occupations 18,373 18,243 ‐130 ‐1% $11.54Production occupations 307,558 298,867 ‐8,691 ‐3% $13.45Source: EMSI Complete Employment, 1 st Quarter 2010, Accessed on 6/09/10<strong>East</strong> <strong>Los</strong> <strong>Angeles</strong> <strong>College</strong> | <strong>Strategic</strong> <strong>Plan</strong> 2011‐2017 15
The data indicate positive trends in job fields related to healthcare and social services, education,business, computer science, construction related occupations, protective and legal fields and media.Additional breakdowns are available at more specific levels when needed in determining programmaticplanning. Additionally, it should be noted that the data are compiled from federal and state data thatare cleaned by EMSI. As a result, the data are approximately 18 months behind the actual or currenteconomic conditions. Regular review of the data can indicate trends in the data and whether anysignificant changes need to be reported to the campus community at large.INTERNAL SCAN<strong>College</strong> Profile<strong>East</strong> <strong>Los</strong> <strong>Angeles</strong> <strong>College</strong> has grown tremendously over the last five years and now enrolls more than28,000 credit students each semester, not including its Public Service Academies.Through the years of growth, the student body population has remained largely unchanged with amajority of students being Hispanic/Latino or Asian/Pacific Islander. The age of the students attending<strong>ELAC</strong> has become younger with significant gains in the 18‐21 category. In addition to the basicdemographics, there are several subpopulations in the college of note. Among these include 1,186 AB540 students, 919 foreign students, and 407 veterans of which 97 are female. The following charts andtables describe the basic profile of <strong>ELAC</strong>’s credit students.<strong>East</strong> <strong>Los</strong> <strong>Angeles</strong> <strong>College</strong> | <strong>Strategic</strong> <strong>Plan</strong> 2011‐2017 16
0% 1%2%Fall 2009 Ethnicity0% 2%17% 2%2%74%African AmericanAsian Pacific IslanderCaucasianDecline to StateHispanic/LatinoMulti‐EthnicNative AmericanOther Non‐white WUnknownAge 2004 2005 2006 2007 2008 2009Under 18 4.54% 5.53% 4.28% 5.91% 8.80% 8.50%18‐21 35.65% 35.95% 37.85% 38.40% 38.43% 39.22%22‐25 21.66% 21.44% 21.67% 20.56% 19.91% 20.37%26‐30 14.00% 13.35% 12.93% 12.81% 12.42% 12.46%31‐35 8.74% 8.10% 7.98% 7.35% 6.93% 6.78%36‐40 5.62% 5.80% 5.51% 5.34% 4.75% 4.55%41‐50 6.76% 6.82% 6.63% 6.43% 5.72% 5.33%Older than 50 3.03% 3.01% 3.15% 3.19% 3.04% 2.79%Total 100% 100% 100% 100% 100% 100%Gender 2004 2005 2006 2007 2008 2009Female 63.52% 62.83% 62.72% 62.03% 61.12% 59.98%Male 36.48% 37.17% 37.28% 37.97% 38.88% 40.02%Total 100% 100% 100% 100 % 100% 100%Primary Language 2004 2005 2006 2007 2008 2009Armenian 0.37% 0.38% 0.27% 0.35% 0.32% 0.27%Chinese 8.98% 9.11% 9.08% 9.70% 8.76% 8.33%English 59.46% 59.46% 59.56% 60.21% 62.23% 64.91%Farsi 0.05% 0.04% 0.06% 0.06% 0.05% 0.08%Filipino 0.40% 0.50% 0.45% 0.41% 0.37% 0.29%Japanese 0.18% 0.13% 0.16% 0.15% 0.14% 0.13%Korean 0.23% 0.27% 0.25% 0.22% 0.27% 0.27%<strong>East</strong> <strong>Los</strong> <strong>Angeles</strong> <strong>College</strong> | <strong>Strategic</strong> <strong>Plan</strong> 2011‐2017 17
Primary Language 2004 2005 2006 2007 2008 2009Other 1.36% 1.31% 1.40% 1.33% 1.19% 1.09%Russian 0.12% 0.09% 0.08% 0.08% 0.06% 0.07%Spanish 27.06% 27.09% 26.44% 25.41% 24.50% 22.76%Unknown 0.36% 0.30% 0.85% 0.38% 0.29% 0.24%Vietnamese 1.42% 1.31% 1.40% 1.69% 1.83% 1.57%Total 100% 100% 100% 100% 100% 100%Educational Objective 2004 2005 2006 2007 2008 2009Associate’s Degree 5.46% 5.60% 5.81% 5.51% 5.70% 5.63%Basic Skills 2.40% 2.36% 2.36% 2.47% 2.32% 1.90%Career/Job Advancement 28.72% 28.94% 29.09% 26.67% 25.06% 23.82%GED 2.99% 3.04% 2.86% 3.48% 3.61% 3.80%Maintain Licensure 2.45% 2.63% 2.69% 2.47% 2.31% 2.20%Personal Development 3.90% 3.67% 3.56% 3.44% 3.96% 3.82%Transfer 30.00% 29.56% 30.05% 32.72% 33.08% 33.92%UC/CSU Student 0.00% 0.00% 0.00% 0.60% 1.06% 1.51%Undecided 20.17% 20.21% 19.69% 18.69% 18.70% 18.50%Unknown 1.57% 1.64% 1.59% 1.61% 1.90% 2.60%Vocational Certificate 0.84% 0.80% 0.89% 0.92% 0.99% 1.00%Vocational Degree 1.50% 1.54% 1.40% 1.44% 1.32% 1.30%Total 100 % 100% 100% 100% 100% 100%Fall 2009 Student Unit Load28%36%36%Less than 6 units6 to 11 units12 or more (Full‐time)<strong>East</strong> <strong>Los</strong> <strong>Angeles</strong> <strong>College</strong> | <strong>Strategic</strong> <strong>Plan</strong> 2011‐2017 18
In addition to the demographics of the overall student population, a cohort study was developed todetermine the characteristics of new entering students. For these groups, the Office of InstitutionalEffectiveness selected all students reporting to be first‐time college students and then cleaned the databased on enrollment records and self‐reports of completed units to ensure that the cohorts are truefirst‐time students.Cohort Not A Recent Grad Recent GradYear N % N %Total2004 1,753 57.48% 1,297 42.52% 3,0502005 1,550 50.37% 1,527 49.63% 3,0772006 1,329 45.30% 1,605 54.70% 2,9342007 1,533 48.25% 1,644 51.75% 3,1772008 1,917 51.02% 1,840 48.98% 3,7572009 1,938 49.38% 1,987 50.62% 3,925The entering cohorts have come increasingly from recent high school graduates. In 2004, only 42.5% ofstudents were coming directly from high schools. In 2009, 50.6% of students came directly from highschool. This is indicative of the increase in younger students at <strong>ELAC</strong>.In an ongoing effort to develop multiple sources of data, the college participated in a district‐widesurvey to determine additional factors related to the student population. Some measures overlap withthose presented through traditional means of collection using the student information system. In eachcase, the information will be discussed in order to give the needed information to determine which dataset best meets the planning needs of the college.The LACCD Student Survey was conducted during the Fall 2009 semester at all nine LACCD colleges. Thesurvey was administered in class to a randomly selected group of classes at each college. More than4,500 students at <strong>ELAC</strong> completed this survey. For the most part, the sample of students whocompleted this survey was demographically similar to the general <strong>ELAC</strong> student population in terms ofgender, age, ethnicity, and educational background.Approximately 75% of the students who were surveyed indicated that they are attending <strong>ELAC</strong> fortransfer preparation. This figure is higher than what is typically reported by the general population of<strong>ELAC</strong> students on their admissions applications, where approximately one‐third of students indicate thatthey are attending <strong>ELAC</strong> for transfer preparation. The higher figure reported in the LACCD studentsurvey may be due to the fact that 79% of the students who were surveyed completed the survey in atransfer‐level course or may be indicative of a problem in which few students are aware of their goalsupon completing the admissions process.In addition, according to the LACCD student survey, approximately 32.2% of students report that theywere not born in the United States, 47.3% were born in the U.S. but both of their parents were not, and19.5% have at least one parent who was born in the U.S. These results indicate a need to assist studentswho may lack awareness of the college system.Also, according to the survey result for students who reported data for both of their parents’ attainmentlevels, approximately 85.1% of the survey respondents are first‐generation college students (defined as<strong>East</strong> <strong>Los</strong> <strong>Angeles</strong> <strong>College</strong> | <strong>Strategic</strong> <strong>Plan</strong> 2011‐2017 19
oth parents holding less than a Bachelor’s degree). Given the relatively high percentages of studentswho did not report on their parents’ educational attainment levels, however, it is possible that thispercentage may be significantly higher or lower. Out of the students who responded about theirsiblings’ highest education level, 39.2% had siblings that have earned a two‐year college degree orhigher. This figure is indicative of the high degree of importance placed on higher education in thesestudents’ families.In terms of family income, nearly half of survey respondents (49.4%) reported an annual family incomeof less than $24,000, and only 11.2% of students reported an annual family income of over $49,000.According to the 2009 Federal Poverty Guidelines, for a family of four the poverty level is $22,050, andfor a family of five it is $25,790. Indeed, further analyses revealed that 51.7% of the survey respondentsare considered to be living at or below the poverty level for their family size. Thus, a significant numberof <strong>ELAC</strong> students are living in poverty or are low income students, highlighting the importance offinancial assistance for students.Student Preparation and Basic SkillsThe academic preparation of the students at <strong>ELAC</strong> can be described in part by the results of assessmenttesting. Although not all students participate in the matriculation process, the scores give a guide to theneed for basic skills programming and also highlight the enrollment patterns in Math and Englishsequences that may represent barriers to student completion. Only 5% of students test into transferlevelMath, indicating that 95% of students will need at least one semester of Math prior to being ableto take their transfer requirements. Eighty‐five percent will need to take at least one course prior toreaching their graduation requirement, and a majority of students place into two or more levels belowthe college’s graduation requirement. As a result, most students will need a minimum of threesemesters of Math to graduate and four to transfer. Given the unit loads of the required Math courses,this will slow students’ progress towards completion even when they complete each level in thesequence in consecutive semesters.Math Placements% of Testers60.00%51.06%40.00%20.00%10.22%4.64%18.01%10.97%5.10%0.00%<strong>East</strong> <strong>Los</strong> <strong>Angeles</strong> <strong>College</strong> | <strong>Strategic</strong> <strong>Plan</strong> 2011‐2017 20
Similar results are seen in English, with only 12% of students testing at college level. A majority ofstudents test two or more levels below transfer and will require three or more semesters of Englishprior to graduation or transfer. Taken together with the Math results, a majority of our <strong>ELAC</strong> studentswill need to take at least 16 units of Math and English basic skills courses prior to reaching <strong>College</strong>Reading and Composition and Intermediate Algebra.English Placements% of Testers20.00%15.00%10.00%5.00%0.00%3.50%15.07% 13.85%17.32% 18.54% 19.84% 11.88%% of TestersBasic skills sequences are often noted as potential barriers for student success. Given that more than85% of <strong>ELAC</strong> students place into basic skills levels in English and Math, an analysis of these sequences isimportant. The District has provided data that indicate that there is substantial drop off as studentsprogress through English and Math sequences. Similar concerns are noted by Hern (2010), who statesthat when success and persistence rates are considered, exponential attrition occurs in which studentsfail to complete the appropriate sequence. Her study suggests that the longer the basic skills sequenceis, the less likely students are to complete the sequence. Her suggestion is to create acceleratedsequences. These differ from some efforts conducted at <strong>ELAC</strong>, which would be best described ascompressed. Whereas a compressed sequence attempts to offer the same courses short‐term,acceleration actually condenses the number of courses in the sequence and makes curriculum changesto accelerate the pace of student completion.<strong>East</strong> <strong>Los</strong> <strong>Angeles</strong> <strong>College</strong> | <strong>Strategic</strong> <strong>Plan</strong> 2011‐2017 21
Success Indicators<strong>East</strong> <strong>Los</strong> <strong>Angeles</strong> <strong>College</strong> is dedicated to reviewing and evaluating multiple measures of student success.The college is regularly presented with statewide measures of success through annual ARCC reports(Accountability Reporting for the Community <strong>College</strong>s, an annual evaluation of community collegesperformance in meeting statewide educational outcome priorities). The following informationdemonstrates <strong>ELAC</strong>’s outcomes on multiple measures calculated by the state Chancellor’s Office. Thesemeasures of broad outcomes are meant to be indicative of the overall performance of the college.Following the presentation of these data, this report will discuss college measures that may addadditional detail to an analysis of the college’s efforts to improve student success.The data suggest that <strong>ELAC</strong> is performing below its peer group average on Student Progress andAchievement, Percent of Students Who Earned at Least 30 Units, Persistence, and in Basic Skills and ESLimprovement rates. The college is more successful than its peer group average on measures of CreditVocational Course Success. Using these measures as a guide, this report will work to provide detailedanalysis of student success. This evaluation will begin with course‐level measures and expand out tocollege‐level completion in order to demonstrate a complete trajectory of <strong>ELAC</strong> student success.<strong>East</strong> <strong>Los</strong> <strong>Angeles</strong> <strong>College</strong> | <strong>Strategic</strong> <strong>Plan</strong> 2011‐2017 22
<strong>Plan</strong>ning OutcomesThe college has developed core indicators of success to determine the overall impact of thecollege’s planning efforts. Although information throughout this report has been related tothese indicators, the following information represents the dashboard version of the college’score indicators of success.Goal 1: <strong>East</strong> <strong>Los</strong> <strong>Angeles</strong> <strong>College</strong> will increase awareness of the educational opportunities available andexpand access to vocational, transfer, basic skills and lifelong learning programs among all populationsin the service area, including those that have been traditionally under‐served by institutions of highereducation.1. Number of first‐time college students who have recently graduated (within the past year) from highschool for use as a measure of <strong>ELAC</strong>’s outreach efforts to local high schools and middle schools.Ethnicity 2004 2005 2006 2007 2008 2009African‐American 17 28 30 20 8 21Asian/Pacific Islander 159 140 146 196 157 160Caucasian 10 19 16 9 25 13Decline to State 23 30 29 38 40 4Hispanic/Latino 1,079 1,296 1,372 1,362 1,587 1,684Multi‐Ethnic 1 6Native American 1 2 1 2 2 3Other Non‐Caucasian 5 6 5 10 6 2Unknown 3 6 5 7 15 94Total 1,297 1,527 1,605 1,644 1,840 1,987<strong>East</strong> <strong>Los</strong> <strong>Angeles</strong> <strong>College</strong> | <strong>Strategic</strong> <strong>Plan</strong> 2011‐2017 23
2. Number of first‐time students who have not recently graduated high school.Ethnicity 2004 2005 2006 2007 2008 2009African‐American 42 50 28 39 60 52Asian/Pacific Islander 368 373 259 395 465 294Caucasian 25 31 36 25 36 36Decline to State 46 49 38 37 45 11Hispanic/Latino 1,255 1,025 942 1,014 1,288 1,448Multi‐Ethnic 1 1 1 13Native American 10 7 11 5 3 3Other Non‐Caucasian 1 6 7 4 7Unknown 5 8 8 13 13 81Total 1,753 1,550 1,329 1,533 1,917 1,9383. The total number and percent change of African‐American and Hispanic/Latino males enrolled duringthe fall semester. These two groups are typically underrepresented in institutions of higher education.Year/GenderAfrican‐AmericanAsian/PacificIslanderCaucasianDeclinetoStateHispanic/LatinoMulti‐EthnicNativeAmericanOtherNon‐CaucasianUnknown2004 466 3,798 438 518 15,416 10 53 85 63Female 313 2,211 247 293 10,061 6 26 44 40Male 153 1,587 191 225 5,355 4 27 41 232005 472 3,831 430 565 15,278 6 62 85 77Female 311 2,230 246 328 9,820 5 35 50 48Male 161 1,601 184 237 5,458 1 27 35 292006 465 3,761 418 552 15,167 2 63 78 80Female 294 2,177 232 304 9,781 2 32 39 50Male 171 1,584 186 248 5,386 31 39 302007 439 4,222 444 616 15,967 11 60 93 122Female 265 2,435 256 370 10,132 7 42 42 81Male 174 1,787 188 246 5,835 4 18 51 412008 478 4,658 487 718 18,646 7 60 110 200Female 298 2,661 277 392 11,652 7 42 57 117Male 180 1,997 210 326 6,994 18 53 832009 567 4,779 582 599 21,054 52 68 77 615Female 341 2,697 312 341 12,901 28 40 40 329Male 226 2,082 270 258 8,153 24 28 37 286Goal 2: <strong>East</strong> <strong>Los</strong> <strong>Angeles</strong> <strong>College</strong> will place student learning at the center of all endeavors by creating avibrant learning community that offers challenging, student‐centered courses and programs taught in avariety of “state‐of‐the‐art” modes and means of delivery. Engaged, professional faculty and staff, who<strong>East</strong> <strong>Los</strong> <strong>Angeles</strong> <strong>College</strong> | <strong>Strategic</strong> <strong>Plan</strong> 2011‐2017 24
expect the best from themselves and from their students, will work together to identify and eliminatebarriers to student success and enhance critical thinking, student engagement, persistence, and goalattainment—including transfer to four‐year institutions, job and career preparation and placement,basic skills improvement, and lifelong learning.4. Success RatesThe following information depicts the success and retention rates for <strong>ELAC</strong>. Both success and retentionhave remained fairly consistent across the last six years. The results indicate that approximately 15% ofstudents fail to complete the course and that an additional 20% remain in the course to completion, butfail to be successful. The following table illustrates success rates from Fall 2004‐Fall 2009. For thecampus as a whole, success rates varied between 62% and 65% over the six year period, but they did notshow an increase that corresponded to the increase in retention rates. The success rate was highest inFall 2004, and decreased between 2005‐2007, followed by an increase in 2008 and a slight decreaseagain in 2009. As with retention, success rates varied by ethnicity. On average, Asian/Pacific Islandershad the highest success rates, followed by Caucasians. In contrast, Hispanics/Latinos and African‐Americans had relatively lower success rates. The rates indicate inequities in the course‐level outcomesacross ethnicities.EthnicitySuccess Rates by EthnicityFall Fall Fall2004 2005 2006Fall2007Fall2008Fall2009African‐American 63.14% 58.12% 66.02% 58.35% 63.68% 57.35%Asian/Pacific Islander 75.66% 76.11% 76.96% 77.03% 78.43% 78.23%Caucasian 74.18% 71.33% 74.69% 72.70% 69.04% 70.69%Hispanic/Latino 62.14% 60.39% 59.81% 58.67% 60.07% 60.38%Overall 65.07% 63.65% 63.45% 62.66% 64.11% 63.79%5. Retention RatesThe table below illustrates retention rates by ethnicity from Fall 2004 to Fall 2009. For the campus as awhole, retention rates varied between 83% and 86% over the six year period and have shown a positivetrend between 2004‐2009. On average, Asian/Pacific Islanders had the highest retention rates, followedby Caucasians, African‐Americans, and then Hispanics/Latinos. The retention rates for students were farmore consistent across ethnicity than were success rates.Retention Rates by EthnicityEthnicity Fall 2004 Fall2005Fall2006Fall2007Fall2008Fall2009African‐American 85.65% 83.57% 87.53% 85.19% 85.57% 85.68%Asian/Pacific 87.10% 87.95% 88.41% 89.44% 89.81% 89.69%IslanderCaucasian 85.71% 87.14% 88.49% 88.52% 86.51% 89.16%Hispanic/Latino 82.88% 83.85% 82.74% 83.30% 83.65% 84.32%Overall 83.84% 84.74% 83.99% 84.71% 85.06% 85.42%<strong>East</strong> <strong>Los</strong> <strong>Angeles</strong> <strong>College</strong> | <strong>Strategic</strong> <strong>Plan</strong> 2011‐2017 25
6. Persistence RatePersistence rates were also calculated for the first‐time student cohorts. Using first‐time studentsensures that the rates calculated are not weighed down by students who may have completed theireducational objectives. These rates differ from the District rates in that the presented rates include allfirst‐time students. Other measures often limit the cohort to those students taking a minimum numberof units or a specific type of course. The college data was also disaggregated by ethnicity to analyzedifferences in persistence between ethnic groups. Asian/Pacific Islander students have much higherpersistence rates for both spring and fall. In addition, data analyses found that male students had lowerpersistence rates than female students and that students coming directly from high school had a higherpersistence rate than other first‐time students.Cohort Year Fall to Spring Fall to Fall2004 63.93% 51.67%2005 65.55% 54.53%2006 67.18% 53.14%2007 64.37% 54.39%2008 64.73% 53.47%2009 65.40% N/A2004 2005 2006 2007 2008 2009Fall toSpringFall toFallFall toSpringFall toFallFall toSpringFall toFallFall toSpringFall toFallFall toSpringFall toFallFall toSpringAfrican‐American50.85% 25.42% 56.41% 37.18% 44.83% 29.31% 35.59% 27.12% 47.06% 29.41% 45.21%Asian/ PacificIslander70.40% 59.77% 71.15% 61.40% 73.58% 61.48% 71.91% 63.11% 73.79% 63.50% 78.41%Caucasian 71.43% 54.29% 60.00% 48.00% 57.69% 42.31% 44.12% 26.47% 55.74% 44.26% 48.98%Decline toState53.62% 44.93% 67.09% 46.84% 58.21% 41.79% 60.00% 45.33% 57.65% 47.06% 60.00%Hispanic/Latino 62.98% 50.64% 64.84% 53.94% 67.50% 53.03% 63.51% 53.41% 63.44% 52.03% 64.46%Multi‐Ethnic 100.00% 0.00% 0.00% 0.00% 0.00% 0.00% 0.00% 0.00% 60.00% 60.00% 47.37%NativeAmerican72.73% 54.55% 44.44% 55.56% 33.33% 50.00% 100.00% 57.14% N/A N/A 33.33%Other Non‐Caucasian50.00% 50.00% 58.33% 66.67% 41.67% 33.33% 57.14% 50.00% 61.54% 38.46% 100.00%Unknown 62.50% 62.50% 64.29% 57.14% 53.85% 46.15% 75.00% 80.00% 82.14% 82.14% 64.57%Total 63.93% 51.67% 65.55% 54.53% 67.18% 53.14% 64.37% 54.39% 64.73% 53.47% 65.40%7. Transfer numbers and rates (as allowable) using a cohort and six‐year completion limit.Transfer rates are calculated using multiple methods and thus vary based on how cohorts and “transferstudents” are defined. Although some of the transfer rate data suggest a more dire situation thanothers, it is clear that there is room for institutional improvement regardless of how transfer rate iscalculated. Furthermore, ethnic disparities are seen in transfer rates.<strong>East</strong> <strong>Los</strong> <strong>Angeles</strong> <strong>College</strong> | <strong>Strategic</strong> <strong>Plan</strong> 2011‐2017 26
Total Annual Transfers2004‐2005 2005‐2006 2006‐2007 2007‐2008 2008‐2009891 946 905 923 912Fall 2009 Transfers by EthnicityEthnicity Transfers %Asian/Pacific Islander 157 27.50%African‐American 7 1.23%Filipino 1 0.18%Latino 311 54.47%Native American 1 0.18%Other 3 0.53%Caucasian 7 1.23%Non‐Resident Alien 56 9.81%No Response 28 4.90%Total 571 100%CCC Chancellor’s Office Data(cohort = first‐time collegestudents who completed 12units and attempted transferlevelMath or English within 6years of initial enrollment)Student Right‐to‐Know Data(cohort = first‐time students whoenrolled full‐time in their first fallsemester; note: students who areconsidered “completers” are notincluded in the calculation of thetransfer rate)Divided We Fail in LAData (cohort =students who enrolledin more than 6 units intheir first year)36.4% (6 year) 10.7% (3 year) 17% (6 year)8. Degree completion numbers and rates using a cohort and six‐year completion limit.The following data present graduation and certificate numbers. While these data are not rates ofgraduation, they do indicate the trends in completions throughout the college. Of note is that thecompletions have remained flat over the past several years. This is troubling given the increasedenrollment experienced at the college. Changes in graduation requirements may be one potential causeof recent graduation numbers. The changes in certificates may also be related to statewide changes inthe definition of certificates.Academic Year AA AS2005‐2006 1,036 1612006‐2007 1,042 1812007‐2008 1,036 1742008‐2009 1,121 1852009‐2010* 656 161*Not all data for the 2009‐2010 academic year wascompleted at the time of data collection<strong>East</strong> <strong>Los</strong> <strong>Angeles</strong> <strong>College</strong> | <strong>Strategic</strong> <strong>Plan</strong> 2011‐2017 27
EthnicityDegreeRate2004 Cohort 11.41%African‐American 3.39%Asian/Pacific Islander 18.41%Caucasian 2.86%Decline to State 7.25%Hispanic/Latino 10.33%Multi‐Ethnic 0.00%Native American 9.09%Other Non‐Caucasian 16.67%Unknown 0.00%9. Certificate completion numbers and rates using a cohort and six‐year completion limit.Academic Year Certificates Skill Certificates2005‐2006 197 1,1742006‐2007 231 2,3102007‐2008 209 1,7962008‐2009 619 1,2842009‐2010* 884 1,344*Not all data for the 2009‐2010 academic year was completed at thetime of data collectionEthnicityCertificateRate2004 Cohort 14.03%African‐American 5.08%Asian/Pacific Islander 21.06%Caucasian 14.29%Decline to State 10.14%Hispanic/Latino 12.81%Multi‐Ethnic 0.00%Native American 9.09%Other Non‐Caucasian 16.67%Unknown 12.50%Goal 3: <strong>East</strong> <strong>Los</strong> <strong>Angeles</strong> <strong>College</strong> will foster a culture of planning and accountability by establishing clearstrategic goals, assessing the effectiveness of efforts to meet these goals and reporting of results tointernal constituencies, the District, the Board of Trustees and to the community on a regular basis. Thecollege will provide high quality, reliable and relevant college data to use as a basis for informedprogram, department, division, and college‐level decision‐making. The college will improve<strong>East</strong> <strong>Los</strong> <strong>Angeles</strong> <strong>College</strong> | <strong>Strategic</strong> <strong>Plan</strong> 2011‐2017 28
administrative systems and customer service through the establishment of more streamlined proceduresand through improved access to information.10. Percent 2010 SLOsCourse‐LevelProgram‐LevelDefined Assessed Used Defined Assessed Used79% 20% 12% 14% 7% 0%11. Percent of completed Program Reviews and Annual Updates2005‐2009 Program Review 2011‐2012 Annual Update100% 94%12. Cost efficiency (per FTES)Instructional Efficiency ‐ Cost per FTES<strong>College</strong> 2003‐04 2004‐05 2005‐06 2006‐07 2007‐08<strong>East</strong> Total Expenses $52,038,478 $57,635,886 $68,246,438 $79,688,119 $88,936,989Annual FTES 17,289 18,752 19,759 22,670 22,695Cost per FTES $3,010 $3,074 $3,454 $3,515 $3,919District Total Expenses $313,200,537 $330,350,948 $367,820,379 $403,780,703 $438,216,775Annual FTES 93,310 96,288 93,556 101,816 104,174Cost per FTES $3,357 $3,431 $3,932 $3,966 $4,207Employee SurveyIn the Fall 2010 semester, <strong>ELAC</strong> faculty and staff were emailed a link to an online survey that assessedtheir opinions on the college planning process and to gain recommendations on which improvementsshould be undertaken in the future. Faculty responded to a survey that consisted of 83 Likert‐scalequestions and five open‐ended questions. Staff responded to a survey that consisted of 71 Likert‐scalequestions and five open‐ended questions. A total of 103 faculty and 27 staff responded to the respectivesurveys. For faculty, data were disaggregated by faculty type. Of the 103 who responded to the facultysurvey, 66 were full‐time faculty, 21 were adjunct faculty, 7 were department chairs, and 9 wereadministrators.Faculty and staff responded to statements about <strong>ELAC</strong>’s standing in the community as a cultural center.In general, they neither agreed nor disagreed that <strong>ELAC</strong> is currently a cultural center in the community,but they believed that <strong>ELAC</strong> should work to attain this status. Faculty and staff agreed that theintegration of sustainability into the college planning is an important goal. On average, respondents<strong>East</strong> <strong>Los</strong> <strong>Angeles</strong> <strong>College</strong> | <strong>Strategic</strong> <strong>Plan</strong> 2011‐2017 29
indicated that they do not believe that the current budget and planning processes meet the needs of the<strong>College</strong>, nor do faculty and staff have a strong awareness of how funds are prioritized and distributed.Given the current state of the economy, it is not known whether the process itself is being noted as aproblem, or that the result of this process, given the current budget cuts, is problematic. Surveyresponses regarding the shared governance process at <strong>ELAC</strong> indicate that faculty and staff are familiarwith the shared governance process and that they know how to get involved in it. On average, facultyand staff report being familiar with the <strong>College</strong>’s planning structure and processes. Faculty and staff alsoindicated that they would like to become more involved in college planning processes.<strong>ELAC</strong>’S STRENGTHSBased on a comprehensive review of the college data, the <strong>Strategic</strong> <strong>Plan</strong>ning Committee assessed thestrengths and weaknesses of the college. The following sections summarize and discuss these strengthsand weaknesses.Access and the Benefits of Community <strong>College</strong> EducationOne goal of the community college system is to provide a quality education to any and all individualsseeking higher education. Data show that significant numbers of students are indeed matriculatingthrough the California Community <strong>College</strong> (CCC) system and through <strong>ELAC</strong> in particular. The CCC systemis comprised of over 100 community colleges across the state, and it enrolled almost 1.8 millionstudents in the fall of 2009. In fact, according to the 2010 ARCC, almost 90 out of every 1,000 people(ages 18 to 65) in the state enrolled in a CCC and one‐fourth of all 20‐ to 24‐year olds in Californiaenrolled in a CCC in 2008‐2009. Locally, <strong>ELAC</strong> has consistently increased the number of studentsreceiving educational services in its programs and has increased its numbers on all core indicatorsrelated to providing access to its community.Providing Californians access to institutions of higher education has served, and continues to serve,important economic and societal functions. According to the 2010 ARCC report, community collegestudents who earned a vocational degree or certificate in 2003‐2004 saw their wages jump from amedian income of $25,856 in 2002 to $57,594 three years after earning their degree or certificate (in2007), an increase of over 100%. For students who earned a vocational degree or certificate in 2002‐2003, their median income in 2007 was $60,880. Community colleges have also proven to be animportant stepping stone for students wishing to attend four‐year institutions. In 2008‐2009, the CCCsystem transferred 99,583 students to four‐year institutions (public, private, in‐state and out‐of‐state).The California State University (CSU) system continues to be the most frequent transfer destination forcommunity college students with an enrollment of 49,770 students from the community colleges. Inaddition, over 14,000 community college students enrolled in the University of California (UC) system,the state’s most selective public higher education system. This figure continues a four‐year trend ofincreasing transfers from community colleges to the UC system. Furthermore, 45.4% of studentsgraduating with a Bachelor’s degree from a CSU or UC in 2008‐2009 had attended a CCC.<strong>ELAC</strong> is a prominent college in the CCC system, as it enrolled the second highest number of students inthe state in the fall of 2009 and has grown tremendously during the last five years in the number ofstudents it serves. Each semester, <strong>ELAC</strong> enrolls over 30,000 students including career‐technical, liberalarts, noncredit, and Public Service Academy students. A central strength of <strong>ELAC</strong> is its ability to provideaccess to Latino students, a population that has traditionally been underrepresented in higher<strong>East</strong> <strong>Los</strong> <strong>Angeles</strong> <strong>College</strong> | <strong>Strategic</strong> <strong>Plan</strong> 2011‐2017 30
education. In fact, <strong>ELAC</strong> has enrolled more Latino students than any other college in the state for thepast five years.<strong>ELAC</strong> has also had success in increasing the number of first‐time students that it serves. From the fall of2004 to the fall of 2006, <strong>ELAC</strong> enrolled about 3,000 students each fall term; however, over the past fewyears the number of entering students has been increasing, and in the fall of 2009 the entering studentcohort was nearly 4,000 students. Part of this growth may be attributed to successful high schooloutreach efforts, as the number and ratio of high school graduates in entering <strong>ELAC</strong> cohorts have beenincreasing over the past five years. For instance, only 42.5% of entering students were coming directlyfrom high schools in 2004, but, in 2009, 50.6% of students came to <strong>ELAC</strong> directly from high school. <strong>ELAC</strong>has also been successful in improving its male‐to‐female ratio to be more reflective of the communitiesit serves. While <strong>ELAC</strong>’s service area has consistently been comprised of about 49.5% males and 50.5%females, only recently have entering cohorts approached this same gender distribution. For example, inthe fall of 2004, the entering cohort was 40.5% male, whereas in the fall of 2009 the entering cohort was48.4% male. This pattern may also be related to recent high school graduate enrollment, as thepercentage of recent high school graduates entering <strong>ELAC</strong> that are male has increased from 44.3% in thefall of 2004 to 48.7% in the fall of 2009.<strong>ELAC</strong> also continues to be successful in providing educational opportunity and access to a large numberof first‐generation students. According to the results of the 2009 LACCD district‐wide student survey,approximately 85.1% of <strong>ELAC</strong> students are first‐generation college students (defined as both parentsholding less than a Bachelor’s degree). Furthermore, approximately 32.2% of <strong>ELAC</strong> students were notborn in the United States, and another 47.3% of students reported being the first‐generation born in theUnited States. These data on entering cohorts and first‐generation students demonstrate that <strong>ELAC</strong> issucceeding in its goals to increase awareness of the available educational opportunities at <strong>ELAC</strong> and toexpand access to all populations in its service area.Community Value of Education<strong>ELAC</strong> is fortunate to have a student body in which students place a high value on education and arehighly motivated to achieve their educational goals. In the district‐wide student survey, 94.3% of <strong>ELAC</strong>students reported that they find a great deal of personal meaning in going to college. Furthermore, themajority of <strong>ELAC</strong> students indicated their disagreement with statements that they “would not go tocollege if they had another way to achieve their goals” or that they “would not have enrolled in college ifthey had a better alternative.” In fact, out of all nine colleges in the District, <strong>ELAC</strong> had the largestproportion of students who disagreed with these two sentiments. This demonstrates that <strong>ELAC</strong>students have a particularly strong commitment to learning and that they are in college for the purposeof learning for learning’s sake, not just as a means to an end. In addition, <strong>ELAC</strong> students reported in thesurvey that they felt well supported by their families in their educational pursuits, as most studentsreported that going to college is highly valued by their families (86.0% of students) and that theirfamilies would be disappointed if they did not go to college (69.6% of students).The high value that students place on their <strong>ELAC</strong> education is reflected in their dedication to the college,to their coursework, and to their educational goals. For example, ninety‐one percent of student surveyrespondents indicated that they would encourage others to attend <strong>ELAC</strong>. Additionally, 85% of <strong>ELAC</strong>students who are enrolled in courses past the census date stay in those courses, and this retention ratehas remained fairly consistent over the past six years. In addition to high retention rates, <strong>ELAC</strong>’s creditvocational courses have consistently evidenced particularly high annual successful course completion<strong>East</strong> <strong>Los</strong> <strong>Angeles</strong> <strong>College</strong> | <strong>Strategic</strong> <strong>Plan</strong> 2011‐2017 31
ates, with 88.8% of course completers achieving passing grades in 2008‐2009 (2010 ARCC report). Thiscontinued success in career‐technical programming highlights <strong>ELAC</strong>’s ability to provide the community itserves with coursework that allows students to reach their educational and vocational goals.Persistence of <strong>ELAC</strong> StudentsPersistence rates at <strong>ELAC</strong> are also a notable strength of the college. For example, out of the ninecommunity colleges in the District, <strong>ELAC</strong> has consistently ranked among the top two colleges in terms offall‐to‐fall persistence rates in the years 2001‐2006 (the last years for which data are available). Morespecifically, in 2006, <strong>ELAC</strong>’s fall‐to‐fall persistence rate was 63.1% (the second highest in the District).Here, persistent students are defined as new students taking six or more units in the fall semester whothen attempt any units in the following fall semester at the same college. Thus, 63.1% of new studentswho were at least half‐time students at <strong>ELAC</strong> in the fall of 2005 returned to take coursework at <strong>ELAC</strong> inthe fall of 2006. When considering all new <strong>ELAC</strong> students in the fall of 2005 (not just the ones taking sixor more units), 54.5% returned to take coursework at <strong>ELAC</strong> in the fall of 2006. Also, out of the ninecommunity colleges in the District, <strong>ELAC</strong> has consistently ranked among the top two colleges in terms offall‐to‐spring persistence rates in the years 2001‐2007 (the last years for which data are available). Ofnew <strong>ELAC</strong> students taking six or more units in the fall of 2006, 75.4% then attempted units at <strong>ELAC</strong> in thespring of 2007. Of new <strong>ELAC</strong> students taking any units in the fall of 2006, 67.2% then attempted units at<strong>ELAC</strong> in the spring of 2007. Taken together, these data show that over two‐thirds of all new <strong>ELAC</strong>students in the fall term also take courses in the spring term, and that over half of new students takingcourses in the fall return to take courses the next fall. Clearly, <strong>ELAC</strong> students are dedicated to theireducation and have confidence that <strong>ELAC</strong> will fulfill their educational needs.Availability of TechnologyIn addition to its highly‐motivated student population, another of <strong>ELAC</strong>’s strengths is its ability to offercutting‐edge technology to students, faculty and staff. For instance, a state‐of‐the‐art technologybuilding opened in the fall of 2004. In addition, many of <strong>ELAC</strong>’s classrooms are equipped withmodernized “Smart Classrooms,” which allow instructors to teach using a wide variety of media. In arecent survey administered in the fall of 2010 to faculty and staff, faculty indicated that they have beenexpanding the use of technology in their courses and reported that they feel the <strong>College</strong>’s technologicalresources are up‐to‐date and support student learning. Students are clearly benefiting from this, as83.8% of students who completed the 2009 student survey reported that their ability to use computersand other information technology has been improved via their experiences at <strong>ELAC</strong>. It is important thatstudents develop technological competency and enhance their technological skills, as a vast majority of<strong>ELAC</strong> students interact with technology on a regular basis. Indeed, over 88% of surveyed studentsreported that they use a computer at home to do schoolwork and over 85% reported using the Internetto get information about school assignments and for enrollment‐related purposes. The technologicalskills students acquire while at <strong>ELAC</strong> will continue to benefit them long after they leave <strong>ELAC</strong>, astechnology will increasingly affect all aspects of students’ lives and careers.Student‐Centered EducationIndicative of a student‐centered education is the importance of self‐reflective learning and criticalthinking. Indeed, students at <strong>ELAC</strong> have reported acquiring critical thinking skills, independent learningskills, and self understanding. According to responses on the 2009 student survey, the top three abilitiesthat students reported as having been helped/improved via their experiences at <strong>ELAC</strong> (with over 70% of<strong>East</strong> <strong>Los</strong> <strong>Angeles</strong> <strong>College</strong> | <strong>Strategic</strong> <strong>Plan</strong> 2011‐2017 32
students responding ‘Very much’ or ‘Quite a bit’) include, “learn effectively on your own,” “understandyourself,” and “think critically and analytically.” Students also reported taking an active role in their ownlearning. For instance, the majority of students indicated that they ‘Often’ or ‘Sometimes’ “askquestions or participate in class discussions” (80.6% of students), “work with other students in groupsduring class” (76.9% of students), “discuss ideas from class with others outside of class” (67.9% ofstudents), and “give a presentation or performance in class” (57.5% of students). This high level ofparticipation reported by students is indicative of <strong>ELAC</strong>’s continued focus on a student‐centered modelof instruction, which calls for student engagement, immersion, and personal responsibility. Thus itappears that <strong>ELAC</strong>’s student‐centered approach to instruction is indeed fostering “each student’sdevelopment as a global citizen and lifelong learner” (2008‐2011 <strong>ELAC</strong> <strong>Strategic</strong> <strong>Plan</strong>) by teaching themskills that will aid them beyond their time at <strong>ELAC</strong>.Dedicated Faculty, Staff and AdministrationTo meet the goals of the college and provide first‐rate instruction and services to students, <strong>ELAC</strong> hasassembled a quality staff and faculty capable of meeting the unique needs of its students andcommunity. <strong>ELAC</strong> has a large faculty base, with nearly 300 full‐time instructional faculty and nearly 600part‐time instructional faculty. Also, according to students’ responses in the 2009 student survey, <strong>ELAC</strong>students are generally in agreement that the educational practices at <strong>ELAC</strong> are useful and fair, with atleast 87.5% of the survey respondents agreeing or strongly agreeing with each of the survey’sstatements regarding educational practices at <strong>ELAC</strong>. These practices included statements like,“Textbooks and reading materials are useful for the courses” (with 91.4% of students in agreement),“Grading practices in the courses are fair” (with 88.7% of students in agreement), and “<strong>College</strong>publications clearly and adequately reflect the college’s policies and procedures (catalog, schedule ofclasses, website)” (with 88.9% of students in agreement).Focus on AccountabilityAnother institutional characteristic that is a strength of <strong>ELAC</strong> is its dedication to institutionaleffectiveness and accountability. In the fall of 2009, <strong>ELAC</strong> released the first edition of its SharedGovernance and Decision‐Making Policy handbook. This handbook describes <strong>ELAC</strong>’s thoroughlydeveloped shared governance structure. The intent of this publication was to document and explain thepolicies and practices of how decision‐making processes at <strong>ELAC</strong> integrate into the overall planning,implementation, and evaluation cycle of the college, and it serves as a resource for students, faculty,staff, and administrators who wish to be, or are already, involved in college planning and other campuswidedecisions. A second edition of this handbook has now been released that has been revised andupdated based on additional campus feedback. Importantly, respondents to the 2010 faculty and staffsurvey generally agreed that the Shared Governance and Decision‐Making Policy handbook is a usefulresource, and administrators and faculty also reported feeling knowledgeable about <strong>ELAC</strong>’s sharedgovernance processes and how to become involved in them.In further support of <strong>ELAC</strong>’s commitment to institutional effectiveness and accountability, all collegeplanning at <strong>ELAC</strong> is conducted using evaluation cycles focused on continuous quality improvement for allinstructional, student services, and administrative programs. Each academic, student service, andadministrative service department/unit conducts a Comprehensive Program Review once during a sixyearplanning cycle to assess the degree to which each unit is contributing to the <strong>College</strong>‘s plans. TheComprehensive Program Review is a detailed investigation of the trends in the discipline, courses, andservices offered by the unit; faculty and staff activities that support the unit‘s goals; and the extent to<strong>East</strong> <strong>Los</strong> <strong>Angeles</strong> <strong>College</strong> | <strong>Strategic</strong> <strong>Plan</strong> 2011‐2017 33
which the unit is meeting the needs of students and/or staff. The evidence that is gathered enablesfaculty, staff and administrators to identify strengths and opportunities for improvement within thedepartment/unit. In addition, Annual Update <strong>Plan</strong>s are completed in between comprehensive reviewsto determine the progress made in responding to Comprehensive Program Review recommendationsand the department‘s/unit’s own goals, and they serve as the basis for resource allocation decisions,such as hiring of new faculty and staff, purchase of new equipment, and increases or decreases to adepartment‘s/unit‘s base budget. Additionally, the Comprehensive Program Review and Annual Update<strong>Plan</strong>s utilize Student Learning Outcomes (SLOs) to assess the degree to which departments/units areworking to improve the student learning process and create improvements in student outcomes. <strong>ELAC</strong>has recently had tremendous success in completing these reviews – in its latest cycle of evaluations,<strong>ELAC</strong> achieved 100% completion of Comprehensive Program Reviews and 94% completion of AnnualUpdate <strong>Plan</strong>s. As a final indicator of <strong>ELAC</strong>’s effectiveness, <strong>ELAC</strong> continues to be the most cost effectivecollege in the District, according to one of the District’s measures of institutional efficiency based oncost per FTES.Academic and Support Service ProgramsLastly, another of <strong>ELAC</strong>’s strengths is its many academic and support service programs geared towardhelping its student population and the communities it serves. Some of the student services on campusinclude Admissions and Records, Career and Job services, the Child Development Center, Counseling,the Disabled Student Program and Services (DSPS), the Extended Opportunity Program and Services(EOPS), Financial Aid, International Student Services, Matriculation/Assessment, Student Activities, theStudent Health Center, and the Transfer Center. In the spring of 2010, a random sample of <strong>ELAC</strong>students were administered a student services survey that contained questions pertaining to each ofthese services. For students who had used these services, the survey results indicated that, in general,the majority of students were either satisfied or very satisfied with each service.Additionally, a couple of new student support services have also been established at <strong>ELAC</strong> that focus onfaculty as an important resource for students. These programs are part of the various well‐receivedprofessional development opportunities offered on campus. First, the New Faculty Institute invites newfaculty to participate in a series of comprehensive ongoing professional development activitiesthroughout their first year at <strong>ELAC</strong> that focus on student learning. This institute also provides newfaculty members with a venue to create a community of practice across disciplines. In addition, theFaculty Transfer Advisor Program is an innovative series of professional development courses that linkcounseling faculty with academic faculty in order to provide detailed transfer information and additionalsupport to students. Other unique student services at <strong>ELAC</strong> include Escalante, Adelante, the HonorsProgram, the Math Engineering Science Achievement (MESA) Program, MenTe, Puente, and SummerBoot Camps. Taken together, these valuable programs and services aim to increase student success byutilizing innovative teaching, tutoring, and guidance so that students can excel academically andultimately achieve their educational, vocational, and/or transfer‐related goals while at <strong>ELAC</strong>.<strong>East</strong> <strong>Los</strong> <strong>Angeles</strong> <strong>College</strong> | <strong>Strategic</strong> <strong>Plan</strong> 2011‐2017 34
<strong>ELAC</strong>’S WEAKNESSESEducational CompletionsTwo indicators that are often used to assess the effectiveness of a community college are (1) thenumber of students who graduate with an Associate’s Degree and (2) the number of students whotransfer to a four‐year university. Compared to the state averages for community colleges, <strong>ELAC</strong> hasfairly low graduation and transfer rates.The following table displays the number of degrees and certificates awarded from 2005‐2010. Whilethese data are not rates of graduation, they do indicate the trends in completions throughout thecollege. Of note is that the completions have remained flat over the past several years. This is troublinggiven the increased enrollment experienced at the college. Changes in graduation requirements may beone potential cause of recent graduation numbers. The changes in certificates may also be related tostatewide changes in the definition of certificates. A more detailed discussion of graduation rates isincluded in the equity section that follows.Academic Year AA AS C CS Total2005‐2006 1,036 161 197 1,174 2,5682006‐2007 1,042 181 231 2,310 3,7642007‐2008 1,036 174 209 1,796 3,2152008‐2009 1,121 185 619 1,284 3,2092009‐2010* 656 161 884 1,344 3,045*Not all data for the 2009‐2010 academic year was completed at the time of data collectionOne way that transfer rates are calculated is by using an official methodology developed in 2001 by theChancellor's Office in consultation with constituent groups and adopted by the Transfer Data TechnicalWorkgroup (TDTW). According to this method, the transfer cohorts are first‐time college students who,within six years of initial enrollment, have completed twelve credit units and attempted transfer‐levelMath or English. Students are assigned a cohort year according to the academic year in which they firstenroll at a California Community <strong>College</strong>. Students with multiple college enrollments are reported asmembers of the transfer cohort for each college attended. The outcome is transfer to a four‐yearinstitution. Dividing the number of students with enrollments at a four‐year institution by the total sizeof the transfer cohort yields the transfer rate. Each student's transfer outcome is calculated for a varietyof time frames (e.g., three years after initial enrollment, six years after initial enrollment, etc.) Whentransfer rates are calculated in this manner, it becomes evident that <strong>ELAC</strong> underperforms relative to the<strong>Los</strong> <strong>Angeles</strong> Community <strong>College</strong> District.<strong>East</strong> <strong>Los</strong> <strong>Angeles</strong> <strong>College</strong> | <strong>Strategic</strong> <strong>Plan</strong> 2011‐2017 35
Transfer Rate100.0%90.0%80.0%70.0%60.0%50.0%40.0%30.0%20.0%10.0%0.0%<strong>ELAC</strong> vs. LACCD 2003‐2004 Cohort Overall Transfer Rates2 Years 3 Years 4 Years 5 Years 6 YearsYears After Initial Enrollment<strong>ELAC</strong>LACCDOne external factor to keep in mind when considering <strong>ELAC</strong>’s transfer rate is that the CSU and UCschools have been accepting fewer transfer students overall. Thus, the <strong>ELAC</strong> transfer rate is influencedby both the sending and the receiving institution. California State University, <strong>Los</strong> <strong>Angeles</strong> (CSULA) is thenumber one transfer destination for <strong>ELAC</strong> students, and since it is accepting fewer transfer studentsthan it has in the past, <strong>ELAC</strong>’s transfer rate has declined. A more detailed discussion of the transfer rateat <strong>ELAC</strong> is below in the equity section.Equity in Student Outcomes<strong>ELAC</strong> is one of the most diverse community colleges in the state of California. As noted earlier, in Fall2009, the <strong>ELAC</strong> student population was 74.15% Hispanic/Latino, 18.36% Asian/Pacific Islander, 1.92%Caucasian, and 1.88% African‐American. It is thus reasonable to expect that student performanceindicators would mirror these percentages. For example, since approximately 74% of students at <strong>ELAC</strong>are Hispanic/Latino, we would assume that approximately 74% of students who transfer from <strong>ELAC</strong> toUniversity of California schools would also be Hispanic/Latino. This would be considered transfer equity.However, indicators of student performance (including transfer rates) vary according to ethnicity inpatterns that differ greatly from the overall ethnic makeup of the campus. Thus, although <strong>ELAC</strong> isconsidered an ethnically diverse campus when compared to other community colleges, it is notnecessarily considered an ethnically equitable campus. This issue of equity includes gender‐relatedoutcomes, in addition to ethnic‐related ones, which will each be discussed in turn.These equity gaps begin with the courses in which students choose to enroll. Between 2004‐2009, therewere many disciplines in which student enrollment mirrored the ethnic makeup of the campus at large.However, there were also some notable deviations. Accounting, Asian Studies, Chemistry, Chinese,Economics, International Business, Japanese, Microbiology, Law, Physics, and Respiratory Therapy allhad an overrepresentation of Asian/Pacific Islanders compared to the entire campus, on average. Incontrast, American Sign Language, Administration of Justice, Astronomy, Chicano Studies, Child<strong>East</strong> <strong>Los</strong> <strong>Angeles</strong> <strong>College</strong> | <strong>Strategic</strong> <strong>Plan</strong> 2011‐2017 36
Development, Earth Science, Education, Emergency Medical Technician, Italian, Logistics, PersonalDevelopment, and Spanish had an overrepresentation of Hispanic/Latino students. African‐Americanstudents were overrepresented in African‐American Studies, Health Information Technology, Nursing,Physical Education, Respiratory Therapy, and Transportation <strong>Plan</strong>ning. Caucasian students wereoverrepresented in Engineering Support, Civil Engineering, Respiratory Therapy, and Transportation<strong>Plan</strong>ning.Student enrollment also varied by gender. On the campus as a whole, 59.98% of students were female,and 40.02% of students were male in Fall 2009. Enrollment in some disciplines, however, differedgreatly from these average numbers. Between 2004‐2009, female students were the mostoverrepresented in Child Development, Dance Techniques, Family & Consumer Studies, HealthInformation Technology, and Nursing. These disciplines were between 77% and 90% female. Malestudents were the most overrepresented in Animation, Automotive Technology, Electronics,Engineering, Fire Technology, and Manufacturing and Industrial Technology. These disciplines werebetween 78% and 95% male.Once students are enrolled in their courses, their likelihood of staying in the course to the end of theterm (retention), as well as their likelihood of receiving a passing grade (success) are also related to theirgender and ethnicity. The tables below illustrate these trends.On average, Asian/Pacific Islanders had the highest retention rates, followed by Caucasians, African‐Americans, and then Hispanics/Latinos.Retention Rates by EthnicityEthnicityFall Fall Fall Fall Fall Fall2004 2005 2006 2007 2008 2009African‐American 85.65% 83.57% 87.53% 85.19% 85.57% 85.68%Asian/Pacific Islander 87.10% 87.95% 88.41% 89.44% 89.81% 89.69%Caucasian 85.71% 87.14% 88.49% 88.52% 86.51% 89.16%Hispanic/Latino 82.88% 83.85% 82.74% 83.30% 83.65% 84.32%Overall 83.84% 84.74% 83.99% 84.71% 85.06% 85.42%Success rates followed a similar pattern. Asian/Pacific Islanders had the highest average success rates,followed by Caucasians, Hispanics/Latinos and then African‐Americans.Success Rates by EthnicityEthnicityFall2004Fall2005Fall2006Fall2007Fall2008Fall2009African‐American 63.14% 58.12% 66.02% 58.35% 63.68% 57.35%Asian/Pacific Islander 75.66% 76.11% 76.96% 77.03% 78.43% 78.23%Caucasian 74.18% 71.33% 74.69% 72.70% 69.04% 70.69%Hispanic/Latino 62.14% 60.39% 59.81% 58.67% 60.07% 60.38%Overall 65.07% 63.65% 63.45% 62.66% 64.11% 63.79%<strong>East</strong> <strong>Los</strong> <strong>Angeles</strong> <strong>College</strong> | <strong>Strategic</strong> <strong>Plan</strong> 2011‐2017 37
These rates also varied by gender. Between 2004‐2009, females had higher average retention andsuccess rates than males.Retention Rates by GenderGenderFall Fall Fall Fall Fall Fall2004 2005 2006 2007 2008 2009TotalFemale 84.30% 85.07% 84.53% 84.92% 84.97% 85.53% 84.92%Male 83.06% 84.19% 83.13% 84.41% 85.20% 85.25% 84.33%Success Rates by GenderGenderFall Fall Fall Fall Fall Fall2004 2005 2006 2007 2008 2009TotalFemale 66.43% 64.69% 64.88% 63.63% 64.56% 64.68% 64.79%Male 62.80% 61.96% 61.19% 61.19% 63.47% 62.54% 62.25%In sum, when the retention and success figures are taken together with the enrollment figures, acomplex pattern begins to emerge, whereby certain ethnic groups cluster into certain departments andhave varying levels of retention and success. To further complicate the issue, students of each genderalso differentially cluster into various departments and also have varying levels of retention and success.Thus, efforts to improve student retention and success may have a stronger impact if they arethoughtfully targeted at specific areas, rather than being broadly aimed at the entire campus.Equity gaps are also apparent when taking a broader view of student performance than just at thecourse level. Specifically, persistence, graduation, and transfer rates vary in patterns that are differentthan would be expected from the ethnic and gender makeup of the campus at large.The persistence rate, for instance, varies by both ethnicity and gender. Between 2004‐2009, the overallfall‐to‐spring persistence rate varied, on average, between 63% and 67%. The fall‐to‐fall persistence ratevaried, on average, between 51% and 55%. However, the fall‐to‐spring and fall‐to‐fall rates forAsian/Pacific Islanders were as high as 78%, and 63%, respectively. In contrast, the rates for African‐Americans were as low as 35%, and 25%, respectively. Hispanic/Latino and Caucasian students had ratesthat fell in between these two extremes (see Table below). In addition, persistence rates varied bygender. Female students had persistence rates that were 3% to 6% higher than male students,depending on the year.<strong>East</strong> <strong>Los</strong> <strong>Angeles</strong> <strong>College</strong> | <strong>Strategic</strong> <strong>Plan</strong> 2011‐2017 38
Persistence Rate2004 2005 2006 2007 2008 2009Fall toSpringFall toFallFall toSpringFall toFallFall toSpringFall toFallFall toSpringFall toFallFall toSpringFall toFallFall toSpringAfrican‐American50.85% 25.42% 56.41% 37.18% 44.83% 29.31% 35.59% 27.12% 47.06% 29.41% 45.21%Asian/Pacific 70.40% 59.77% 71.15% 61.40% 73.58% 61.48% 71.91% 63.11% 73.79% 63.50% 78.41%IslanderCaucasian 71.43% 54.29% 60.00% 48.00% 57.69% 42.31% 44.12% 26.47% 55.74% 44.26% 48.98%Hispanic/Latino62.98% 50.64% 64.84% 53.94% 67.50% 53.03% 63.51% 53.41% 63.44% 52.03% 64.46%Multi‐Ethnic100.00% 0.00% 0.00% 0.00% 0.00% 0.00% 0.00% 0.00% 60.00% 60.00% 47.37%NativeAmerican72.73% 54.55% 44.44% 55.56% 33.33% 50.00% 100.00% 57.14% N/A N/A 33.33%OtherNon‐ 50.00% 50.00% 58.33% 66.67% 41.67% 33.33% 57.14% 50.00% 61.54% 38.46% 100.00%CaucasianDeclineto State53.62% 44.93% 67.09% 46.84% 58.21% 41.79% 60.00% 45.33% 57.65% 47.06% 60.00%Unknown 62.50% 62.50% 64.29% 57.14% 53.85% 46.15% 75.00% 80.00% 82.14% 82.14% 64.57%Total 63.93% 51.67% 65.55% 54.53% 67.18% 53.14% 64.37% 54.39% 64.73% 53.47% 65.40%Persistence RateFemaleMaleCohortYearFall toSpringFall toFallFall toSpringFall toFall2004 65.66% 53.75% 61.41% 48.62%2005 68.07% 56.76% 62.38% 51.73%2006 69.22% 55.30% 64.52% 50.31%2007 66.40% 56.08% 61.96% 52.38%2008 65.78% 55.25% 63.48% 51.37%2009 67.39% N/A 63.28% N/ASimilar ethnicity‐ and gender‐related patterns were found in the graduation rate. Graduation rates canbe measured over different lengths of time. "Normal time" is the typical amount of time it takes fulltimestudents to complete their program. For example, the "normal" amount of time for manyassociate's degree programs is two years. Not all students complete within the normal time, sograduation rates are measured by other lengths of time as well, including "150% of normal time" (e.g.,three years for a two‐year program). The overall graduation rate is also known as the "Student‐Right‐to‐Know" or Integrated Post Secondary Data System (IPEDS) graduation rate. It tracks the progress ofstudents who began their studies as full‐time, first‐time degree‐ or certificate‐seeking students to see ifthey complete a degree or other award such as a certificate within 150% of "normal time" for<strong>East</strong> <strong>Los</strong> <strong>Angeles</strong> <strong>College</strong> | <strong>Strategic</strong> <strong>Plan</strong> 2011‐2017 39
completing the program in which they are enrolled. Note that not all students at the institution aretracked for these rates. Students who have already attended another postsecondary institution, or whobegan their studies on a part‐time basis, are not tracked for this rate. At <strong>ELAC</strong>, only 18% of enteringstudents were counted as "full‐time, first‐time" in 2009.When using this metric to examine students who began at <strong>ELAC</strong> in Fall 2006, non‐resident alien studentshave the highest graduation rate, followed by Asian/Pacific Islanders, Caucasians, African‐Americans,and then Hispanics/Latinos. It should also be noted that the vast majority of non‐resident alien studentsat <strong>ELAC</strong> are international students from Asian countries. Thus, Asians make up the two groups with thehighest graduation rates. It is troubling, however, that Hispanics/Latinos have the lowest graduationrate of any ethnic group on campus since the majority of students on campus are of Hispanic/Latinoorigin. More work needs to be done to understand why this is the case and also how to increasegraduation rates among the various groups on campus.OVERALL GRADUATION RATE BY RACE/ETHNICITYPercentage of Full‐time, First‐time Students Who Began Their Studies in Fall 2006 and Graduated Within 150% of"Normal Time" to Completion for Their ProgramWhen graduation rates are examined with regard to gender, males have a slightly higher graduation ratethan females. Beginning in 2006 and within three years of beginning their studies, only 18% of femalesgraduated and only 20% of males graduated.OVERALL GRADUATION RATE BY GENDERPercentage of Full‐time, First‐time Students Who Began Their Studies in Fall 2006 and Graduated Within 150% of"Normal Time" to Completion for Their Program<strong>East</strong> <strong>Los</strong> <strong>Angeles</strong> <strong>College</strong> | <strong>Strategic</strong> <strong>Plan</strong> 2011‐2017 40
Transfer rates also vary between ethnic groups and the two genders in similar patterns. When transferrates are calculated locally, at three years from their initial enrollment for a cohort beginning in Fall2003, Asian/Pacific Islanders have the highest transfer rate (23.8%), followed by African‐Americans(12.0%), Caucasians (11.8%), and then Hispanics/Latinos (8.6%). In addition, Hispanics/Latinos make up74% of the student population, yet they only make up 54.47% of all transfers. Given thatHispanics/Latinos make up the largest ethnic group on the <strong>ELAC</strong> campus, it is worrisome that they havethe lowest transfer rate. It should also be noted that the small number of African‐Americans included inthe transfer rate calculation may have resulted in an inflated rate. Only 25 African‐Americans were inthe cohort from the beginning, and only three transferred by the third year.In addition to the general transfer rate, students of different ethnic groups transfer to differentinstitutions. For example, Hispanic/Latino students made up 58.9% of all transfers from <strong>ELAC</strong> toCalifornia State Universities in 2009. Asian/Pacific Islanders, however, only accounted for 23.9% of <strong>ELAC</strong>transfers to California State University schools. In contrast, Asian/Pacific Islanders made up 56% of alltransfers from <strong>ELAC</strong> to University of California schools, whereas Hispanics/Latinos only accounted for36.2% of transfers from <strong>ELAC</strong> to University of California schools. Thus, Asian/Pacific Islanders are morelikely to transfer to the more selective University of California schools, whereas Hispanic/Latino studentsare more likely to transfer to the less selective California State University schools.Fall 2009 Transfers by EthnicityEthnicityTransfers% ofTransfersAsian/Pacific Islander 157 27.50%African‐American 7 1.23%Filipino 1 0.18%Hispanic/Latino 311 54.47%Native American 1 0.18%Other 3 0.53%Caucasian 7 1.23%Non‐Resident Alien 56 9.81%No Response 28 4.90%Totals 571 100%When analyzing transfer rates with respect to gender, males have slightly higher transfer rates thanfemales. Using the same transfer calculation described previously, 14.7% of males transfer within threeyears, and 12.3% of females transfer within three years.In sum, there are ethnic and gender differences that run the gamut from course enrollment tograduation and transfer rates. These differences point to a need for an increased focus on studentoutcomes for students who conform to certain demographic patterns. Large‐scale, general interventionslikely will have a smaller influence on improving student outcomes than specific, targeted strategies thataim to influence specific outcomes in specific groups. Using the data presented above, interested partiesare able to identify groups that are at risk for poor outcomes and are then able to design programs andstrategies to improve upon those outcomes.<strong>East</strong> <strong>Los</strong> <strong>Angeles</strong> <strong>College</strong> | <strong>Strategic</strong> <strong>Plan</strong> 2011‐2017 41
Student Preparation<strong>ELAC</strong> is an open‐access community college. This means that admission to the college is open to anyperson over the age of 18, regardless of their prior schooling or training. Due to the absence of stringentadmissions criteria, students begin their studies at <strong>ELAC</strong> with widely varying educational backgrounds.However, a large proportion of students do possess a high school diploma upon admission. It should benoted, though, that many of the major feeder high schools in the <strong>ELAC</strong> service area have averagestandardized test scores that rank among the lowest in the state. For these reasons, many students whobegin their college studies at <strong>ELAC</strong> are placed in basic‐skills‐level courses in English and Math.Completing the basic skills course sequence often takes multiple semesters, which delays graduationand/or transfer. Further, persistence through the entire basic skills sequence is often low. This meansthat while students are in basic‐skills‐level courses in English and Math, they are also enrolled in collegelevelcourses in other disciplines without possessing college‐level English and Math skills. Due to thecombination of these factors, <strong>ELAC</strong> faces a unique challenge in educating students.As noted earlier, the local area high schools which feed students into <strong>ELAC</strong> face a number of challenges.All of the top feeder schools have a majority of students who are socioeconomically disadvantaged, withsome schools having over 90% of their student body fitting this category. In addition, nearly all of theseschools have very low average standardized test scores with approximately half scoring in the bottomdecile of the state.This is evidence that a majority of students who enter <strong>ELAC</strong> from local feeder high schools may lackmany of the academic skills necessary to succeed in college. This can be further demonstrated whenexamining the results of entering students’ Math and English placement test scores. In Fall 2009, only5% of students tested into transfer‐level Math. This means that 95% of students need to take at leastone semester of Math before reaching transfer requirements. Further, a majority of students place twoor more levels below the Associate degree graduation requirement. As a result, these students will needa minimum of three semesters of Math to graduate and four to transfer. In addition to Math, a majorityof students test into English courses that are two or more levels below transfer requirements. Only 12%of students test into college‐level English. Taken together with the Math placement results, this meansthat a large majority of <strong>ELAC</strong> students will need to take at least 16 units of Math and English basic skillscourses prior to enrolling in English 101 or Math 125. In addition, anecdotal evidence suggests thatstudents who get high grades in underperforming schools may receive a shock to their self‐esteem whenthey test into low‐level English and Math courses at <strong>ELAC</strong>. The unexpected realization that they willneed to spend multiple semesters taking these courses may reduce their motivation to graduate and/ortransfer.Persistence rates in basic skills course sequences seem to bear this proposition out. As indicatedpreviously, students who are placed in basic‐skills‐level Math and/or English have a low probability ofpassing college‐level English or Math. Only 7% of basic‐skills Math students pass college‐level Math and17% percent of basic‐skills English students pass college‐level English within three years. It appears thatat each subsequent step of the sequence, fewer and fewer students are successful. For example, only39% of students who are placed into a basic‐skills English course pass that course in their first year at<strong>ELAC</strong>. Only 28% of the original cohort then go on to pass the subsequent English course in the sequence.Similar patterns are seen for the Math sequence as well. These findings indicate that a large majority ofthe <strong>ELAC</strong> students that are placed into a basic‐skills course sequence have a minimal chance of successat college‐level Math and English. Similar findings at other colleges have spurred discussions among<strong>East</strong> <strong>Los</strong> <strong>Angeles</strong> <strong>College</strong> | <strong>Strategic</strong> <strong>Plan</strong> 2011‐2017 42
esearchers about how to combat this problem. These various options should be considered closelywhen examining ways to improve sequence completion.These English and Math deficiencies impact students in a broad spectrum of classes outside of theEnglish and Math departments. As a preliminary effort to investigate this issue, student assessmentresults and course enrollments were collected analyzed for the Fall 2009 semester. In this manner, thecourse enrollments and placement levels could be compared. The data indicate strong differences insuccess based on English and Math preparation levels. Focusing on one semester limits the total numberof students in the analysis and the total enrollments (N) are listed for each course. The low enrollmentsin some categories raises concerns about the implications of the success rate trends. It is recommendedthat additional and broader data be collected in order to assist the Educational <strong>Plan</strong>ning Subcommitteein developing action plans for improving basic skills preparation.Fall 2009 Success Rates by English PlacementEnglish CoursesESL/English80'sReading 20 English 21 English 26 English 28 English 101CO SCI201 0.82 (N = 28) 0.47 (N = 17) 0.68 (N = 25) 0.71 (N = 17) 0.77 (N = 26) 0.56 (N = 9)CO SCI291 0.75 (N = 28) 0.65 (N = 17) 0.80 (N = 20) 0.87 (N = 15) 0.62 (N = 26) 0.56 (N = 9)HEALTH008 0.67 (N = 3) 0.42 (N = 31) 0.49 (N = 59) 0.67 (N = 45) 0.61 (N = 44) 0.67 (N = 12)HEALTH011 0.82 (N = 22) 0.58 (N = 58) 0.59 (N = 87) 0.72 (N = 54) 0.66 (N = 74) 0.86 (N = 22)MATH110 0.39 (N = 33) 0.41 (N=125) 0.42 (N=125) 0.58 (N=120) 0.56 (N = 84) 0.50 (N = 12)MATH115 0.83 (N = 24) 0.62 (N = 13) 0.46 (N = 48) 0.55 (N = 58) 0.63 (N = 96) 0.67 (N = 49)MATH125 0.77 (N = 39) 0.55 (N = 11) 0.70 (N = 27) 0.55 (N = 20) 0.60 (N = 50) 0.72 (N = 39)PERSDEV001 1.00 (N = 1) 0.64 (N = 45) 0.88 (N = 26) 0.90 (N = 30) 0.98 (N = 61) 0.73 (N = 11)PHYS ED726 0.89 (N = 9) 0.69 (N = 35) .070 ( N = 10) 0.64 (N = 11) 1.00 (N = 10) ‐POL SCI001 0.63 (N = 8) 0.31 (N = 26) 0.43 (N = 60) 0.52 (N = 62) 0.57 (N = 77) 0.77 (N = 47)PSYCH001 0.57 (N = 7) 0.57 (N = 23) 0.57 (N = 49) 0.59 (N = 44) 0.78 (N = 80) 0.76 (N = 38)SPEECH101 ‐ 0.28 (N = 40) 0.62 (N = 45) 0.58 (N = 53) 0.61 (N = 76) 0.74 (N = 50)SPEECH113 0.87 (N = 31) 1.00 (N = 2) 1.00 (N = 5) 1.00 (N = 1) ‐ 1.00 (N = 1)<strong>East</strong> <strong>Los</strong> <strong>Angeles</strong> <strong>College</strong> | <strong>Strategic</strong> <strong>Plan</strong> 2011‐2017 43
Fall 2009 Success Rates by Math PlacementMath CoursesMath 105 Math 110 Math 112 Math 115Math Transfer120/125 LevelCH DEV001 0.67 (N = 6) 0.62 (N = 78) 0.89 (N = 18) 0.70 (N = 20) 0.83 (N = 12) 1.00 (N = 2)CO SCI201 0.00 (N = 2) 0.60 (N = 10) 0.60 (N = 10) 0.67 (N = 15) 0.88 (N = 26) 0.85 (N = 26)CO SCI291 0.00 (N = 2) 0.60 (N = 10) 0.60 (N = 10) 0.73 (N = 15) 0.81 (N = 26) 0.88 (N = 26)ENGLISH021 0.75 (N = 4) 0.65 (N=128) 0.79 (N = 14) 0.64 (N = 45) 0.76 (N = 21) 0.67 (N = 6)ENGLISH057 1.00 (N = 4) 0.64 (N = 78) 0.63 (N = 24) 0.79 (N = 38) 0.46 (N = 13) 0.89 (N = 9)ENGLISH065 1.00 (N = 1) 0.63 (N = 54) 0.58 (N = 24) 0.80 (N = 49) 0.65 (N = 20) 1.00 (N = 6)ENGLISH086 ‐ 0.60 (N = 10) 0.50 (N = 8) 1.00 (N = 11) 0.90 (N = 21) 0.93 (N = 46)ENGLISH101 0.00 (N = 1) 0.56 (N = 25) 0.58 (N = 19) 0.67 (N = 51) 0.67 (N = 43) 0.50 (N = 18)HEALTH008 0.71 (N = 7) 0.51 (N=117) 0.72 (N = 18) 0.52 (N = 31) 0.70 (N = 10) 1.00 (N = 1)HEALTH011 0.50 (N =10) 0.58 (N=144) 0.71 (N = 28) 0.74 (N = 65) 0.74 (N = 34) 0.88 (N = 17)MUSIC101 ‐ 0.14 (N = 7) 0.33 (N = 3) 0.38 (N = 16) 0.69 (N = 16) 0.83 (N = 29)PHYS ED726 0.75 (N = 8) 0.75 (N = 51) 0.80 (N = 5) 0.75 (N = 4) 1.00 (N = 3) 0.00 (N = 1)POL SCI001 0.40 (N = 5) 0.43 (N = 97) 0.38 (N = 34) 0.58 (N = 67) 0.71 (N = 38) 1.00 (N = 17)PSYCH001 0.60 (N = 5) 0.58 (N = 86) 0.63 (N = 27) 0.67 (N = 48) 0.85 (N = 39) 1.00 (N = 7)READING020 0.43 (N = 7) 0.56 (N = 93) 0.50 (N = 6) 1.00 (N = 3) 0.67 (N = 3) 1.00 (N = 1)SPEECH101 0.33 (N = 6) 0.52 (N = 86) 0.53 (N = 30) 0.64 (N = 74) 0.65 (N = 49) 0.73 (N = 11)One final issue that impacts student preparation and success is the effectiveness of counseling andadvising services on campus. In an ideal world, counselors would meet regularly with students early intheir academic careers at <strong>ELAC</strong> to discuss basic‐skills sequences, graduation and transfer requirements,and a variety of other issues related to student success. However, it appears that the current situation at<strong>ELAC</strong> is far from ideal. In the student survey mentioned previously, approximately 48.9% of studentsstated that they do not have a formal educational plan designed by a counselor. As a result, there is alarge population of students on campus taking classes without receiving much guidance or advising. Thislikely has an impact on student progress through the basic skills sequence because students may nothave an understanding of what is needed to graduate/transfer, or the time frame that is necessary tomeet these goals. Counseling services at <strong>ELAC</strong> are currently being evaluated by a Faculty Inquiry Groupand by various campus committees in an effort to improve student success.Campus InvolvementOne apparent issue on campus is the lack of student involvement in campus activities. According to thestudent survey, 75.6% of students indicated that they were not involved in <strong>ELAC</strong>‐related activities. Theseactivities included attending sporting events, art and theater performances, and participating in clubsand organizations on campus. In addition, faculty and staff reported that students do not participateenough in the shared governance process on campus. These findings may be due, in part, to theenrollment patterns at <strong>ELAC</strong>. Given that many students attend part‐time and that many have jobs, itmay be that the <strong>ELAC</strong> student population simply does not have the time to become involved in campusactivities. It may be beneficial to reach out to these students, however, to try to get them moreinvolved, as a number of studies have shown that students who are more involved on campus havehigher retention and success rates. Furthermore, by increasing their involvement in the shared<strong>East</strong> <strong>Los</strong> <strong>Angeles</strong> <strong>College</strong> | <strong>Strategic</strong> <strong>Plan</strong> 2011‐2017 44
governance process, students could be better assured that their voices are heard when long‐termplanning decisions are made.Campus CommunicationAnother area that faculty and staff have raised concern about is the lack of campus‐wide awareness andcommunication in a number of areas. This issue appears to affect all campus constituencies, fromstudents to campus administrators. For instance, a number of students appear to be unaware of thevarious student services that are on campus. In a survey of 2,810 students in spring 2010 that assesseddifferent aspects of student services, a large percentage of students indicated that they had very littlefamiliarity with the various student services on campus. This is particularly worrisome for those studentservices which many would think are essential to student success. For instance, approximately 40% ofstudents indicated that they are either not at all or slightly familiar with counseling services. Further,approximately 35% of students indicated that they are either not at all or slightly familiar with thefinancial aid office. In light of the low socioeconomic status of many <strong>ELAC</strong> students and the surroundingcommunity, more work needs to be done to increase awareness of financial aid services on campus.All RespondentsHow familiar are you with the followingstudent services and programs at <strong>ELAC</strong>?Not at all Slightly Moderately Substantially ExtremelyAdmissions and Records 12.37% 22.78% 28.83% 21.02% 15.00%Career and Job Services 3.95% 15.86% 45.83% 27.63% 6.73%Child Development Center 58.75% 17.81% 12.40% 5.79% 5.26%Counseling 20.26% 19.51% 23.18% 20.22% 16.82%Disabled student Programs and Services 65.01% 15.97% 9.21% 4.55% 5.26%Extended Opportunity Programs and Services 46.36% 18.02% 13.72% 9.65% 12.25%Financial Aid 19.86% 15.02% 20.50% 19.56% 25.05%International Student Services 64.01% 14.31% 9.92% 5.86% 5.90%Matriculation/Assessment 42.03% 21.52% 18.36% 10.86% 7.24%Student Activities 38.08% 23.95% 20.83% 10.62% 6.52%Student Health Center 46.77% 21.44% 16.22% 9.38% 6.20%Transfer Center 40.19% 23.40% 17.62% 11.06% 7.74%Campus communication issues do not just affect students. In the faculty and staff survey mentionedearlier, the majority of respondents indicated that there needs to be more dialog regarding budgetingprocesses. Specifically, the majority of faculty stated that they did not understand the process for funddistribution and prioritization, and many stated the need for more transparency regarding budgetingprocesses. This may be due, in part, to the large statewide budget cuts. Faculty may either be upset withthe education budget in general, or it may be that they would like more information on how budgetdecisions are made on campus. Regardless of the specific reason, it seems that there is a need todisseminate accurate budget information to faculty, as well as the decisions and processes that weremade to arrive at that information.Another area which has been raised by faculty is that they would like more campus‐wide dialog onstudent‐centered instruction. In response to accreditation standards, <strong>ELAC</strong> has shifted its pedagogical<strong>East</strong> <strong>Los</strong> <strong>Angeles</strong> <strong>College</strong> | <strong>Strategic</strong> <strong>Plan</strong> 2011‐2017 45
focus towards this type of instruction. However, it appears that faculty may need some direction on howto successfully implement these new teaching strategies. According to the faculty survey, it appears thatmany faculty have implemented these strategies in the classroom, and that these strategies have beensuccessful. However, it may be necessary to have faculty workshops and/or information sessions whereinstructors can exchange ideas and learn what specific aspects of student‐centered instruction work wellwith the <strong>ELAC</strong> student population and which aspects do not.Another area where more campus‐wide dialog may be necessary is in regard to Student LearningOutcomes (SLOs). Currently, <strong>ELAC</strong> has not reached the level of SLO proficiency prescribed by theAccrediting Commission for Community and Junior <strong>College</strong>s (ACCJC). According to the faculty surveyresponses, a majority of faculty believe that their participation in the development of SLOs will lead toincreased student success. However, it may be that faculty need more guidance regarding the ACCJC’sexpectations for completion of the SLO process.Fiscal CrisisAs is well known by nearly all faculty, staff, and administrators in California, the state is going through amajor fiscal crisis. As a result, <strong>ELAC</strong> has had to adjust its course offerings, faculty/staff hires, and anumber of other processes to deal with a much smaller budget. The state is also suffering fromdevastating unemployment. The statewide unemployment rate is 12.0%(http://www.calmis.ca.gov/file/lfmonth/countyur‐400c.pdf), which means that there are over 2 millionunemployed persons in California. <strong>Los</strong> <strong>Angeles</strong> County’s rate is slightly higher at 12.5%, which equatesto more than 600,000 unemployed individuals. The Bureau of Labor and Statistics reports thatunemployment rates tend to be more pronounced for those aged 16 to 24(http://www.bls.gov/lau/table14full09.pdf). <strong>ELAC</strong>’s service area consists largely of a low‐income,ethnically‐diverse population, which has been especially hard hit by the economic crisis. As a result, thevarious campus constituencies must consider economic issues when deciding what courses andprograms <strong>ELAC</strong> should offer, the days and times courses should be offered, as well as the pedagogicalapproach that faculty take to the classroom.PLANNING FOR THE FUTUREThe <strong>Strategic</strong> <strong>Plan</strong>ning Committee used its thorough review of the <strong>Strategic</strong> <strong>Plan</strong> Data Report and theaccompanying strengths and weaknesses as a platform for reviewing the <strong>College</strong> Mission. Among thefindings were that the <strong>College</strong> Mission did not provide an adequate focus on student achievement. Inaddition, the Committee sought to revise the mission in a way that could provide a more concise focusthat could serve to inspire both students and employees. Through collegial discussions the <strong>College</strong>Mission was revised to:<strong>East</strong> <strong>Los</strong> <strong>Angeles</strong> <strong>College</strong> empowers students to achieve their educational goals, to expand theirindividual potential, and to successfully pursue their aspirations for a better future for themselves,their community and the world.In order to fulfill this <strong>College</strong> Mission, the college has developed four goals. These goals serve as thebroad planning objectives through which all other college planning documents and departmental planswill be based. Together these goals provide a foundation for building a true agenda of student success.<strong>East</strong> <strong>Los</strong> <strong>Angeles</strong> <strong>College</strong> | <strong>Strategic</strong> <strong>Plan</strong> 2011‐2017 46
Goal 1: Increasing student success and academic excellence through student‐centered instruction,student‐centered support services, and dynamic technologies.The college’s most singular focus is the ongoing improvement in student success. As indicated in the<strong>College</strong> Mission, the college seeks to empower students to succeed. The college works toward this goalby providing both academic programming and student services that are focused on the needs ofstudents and that help students reach their individual goals. To this end, the college expects to improveits in‐course retention and success and the rate with which students transfer and complete degrees andcertificates. Indicative of these efforts is the need to improve the rate at which students progressthrough the basic skills sequence. Improvements in the areas of basic skills will remove a significantbarrier to many of <strong>ELAC</strong>’s students and accelerate the completion of student goals.Goal 2: Increasing equity in successful outcomes by analyzing gaps in student achievement and usingthis, to identify and implement effective models and programming to remedy these gaps.The college believes that all students should have the opportunity to succeed regardless of theirsocioeconomic status. Unfortunately, the data portrays a reality in which the promise of opportunity hasnot led to equitable outcomes. Specifically, the outcomes for Hispanic/Latino students, the college’slargest demographic group, have lagged behind those of Asian/Pacific Islander students, the college’ssecond largest demographic group. As one of the largest Hispanic‐serving community colleges, <strong>ELAC</strong> iscommitted to improving the outcomes for its Hispanic/Latino students and to diminishing the gap insuccessful outcomes at the course and program completion levels. To accomplish this goal, the collegewill continue to investigate achievement gaps to determine and eliminate barriers to student successthat have impeded the progress of <strong>ELAC</strong> students.Goal 3: Sustaining community‐centered access, participation, and preparation that improves thecollege's presence in the community, maximizes access to higher education and provides outlets forartistic, civic, cultural, scientific and social expression as well as environmental awareness.As an open access institution of higher education, <strong>ELAC</strong> is dedicated to serving its community and toproviding access to residents. Included in the provision of access is a commitment to developingresources that ensure that students are successful in their academic pursuits. These efforts include thedevelopment of partnerships with feeder schools and programs that can improve the basic preparationof students prior to entrance into higher education. In addition, the college seeks to increase itsprominence in the community and to become a venue through which its students and the communitymembers at large can learn to express themselves and become active contributors to their community.Goal 4: Ensuring institutional effectiveness and accountability through data‐driven decision‐making aswell as evaluation and improvement of all college programs and governance structures.<strong>ELAC</strong> has a profound understanding that providing a thorough system of accountability is part of itsresponsibility to the community it serves and leads to a more effective institution. This goal outlines the<strong>East</strong> <strong>Los</strong> <strong>Angeles</strong> <strong>College</strong> | <strong>Strategic</strong> <strong>Plan</strong> 2011‐2017 47
college’s commitment to collecting, developing, and analyzing data in a manner that informs all collegewidedecisions. The college will seek to evaluate its programs and governance structures and makeimprovements based on these results. In addition, the college will use data and its planning structures toensure that budget decisions are based on the goals of the college.Through the accomplishment of these goals the college will achieve its vision:Through our emerging focus on student‐centered instruction, student‐centered services, andintegrated learning, <strong>East</strong> <strong>Los</strong> <strong>Angeles</strong> <strong>College</strong> will be an exemplary model for student academicachievement, skill development, and artistic expression.The vision of the college is reflective of the commitment by faculty, staff, and administration to make<strong>ELAC</strong> a premier educational institution that will be the first choice in education for its community andalso a beacon of efficiency and effectiveness. <strong>ELAC</strong> believes that it has the capacity and will to become amodel of excellence and that the goals developed in this <strong>Strategic</strong> <strong>Plan</strong> will place it in a position to liveup to its mission and meet its vision for the future.EVALUATIONAs described in the Shared Governance and Decision‐Making Policy Handbook, <strong>ELAC</strong> follows a PIE(<strong>Plan</strong>ning, Implementation, and Evaluation) cycle. The completion of this <strong>Strategic</strong> <strong>Plan</strong> serves as thetransition from the <strong>Plan</strong>ning stage to the Implementation stage. Each of the college’s planningsubcommittees will use the goals developed in the <strong>Strategic</strong> <strong>Plan</strong> to create objectives and action itemsthat will lead to the successful achievement of the <strong>Strategic</strong> <strong>Plan</strong>ning goals. In addition, each goal hasbeen linked to measurable outcomes with improvement targets for the next six years. Each of thesemeasures will also serve as guidance for the development of objectives and action items by thesubcommittees. Each objective and action item will be linked not only to the <strong>Strategic</strong> <strong>Plan</strong> goal, but alsoto one or more of the measurable outcomes. In this manner, the college will ensure that each planneditem is geared toward the strategic improvement of the college and the success of its students.The development of college targets was based on college dialog on the improvement of studentoutcomes and institutional effectiveness. The targets represent a shared understanding of targetedimprovements that the college believes are both attainable and challenging. Given the flat trend instudent outcomes over the past six years, these targets represent the college’s data‐driven expectationfor enhancing student outcomes and institutional effectiveness over the next six years.<strong>East</strong> <strong>Los</strong> <strong>Angeles</strong> <strong>College</strong> | <strong>Strategic</strong> <strong>Plan</strong> 2011‐2017 48
Based on the current goals, the <strong>Strategic</strong> <strong>Plan</strong>ning Committee has identified the following measures:Goal Measurement Baseline TargetIn‐course retention 85.42% 90%In‐course success 63.79% 70%Goal 1: Increasing studentFirst‐year persistence 53.47% 59%success and academic excellenceCertificate rate 4.82% 6%Graduation ratethrough student‐centered11.41% 15%Transfer rate 17.00% 25%instruction, student‐centeredStudent Right to Know (SRTK)support services, and dynamiccompletion/transfer rates 19.12%/8.15% 21%/9%technologies.ARCC student progress and achievement 43.30% 48%Math improvement rate 11.31% 25%English improvement rate 20.11% 40%ESL improvement rate 37.09% 45%Goal 2: Increasing equity insuccessful outcomes by analyzinggaps in student achievement andusing this, to identify andimplement effective models andprogramming to remedy thesegaps.Goal 3: Sustaining communitycenteredaccess, participation,and preparation that improvesthe college's presence in thecommunity, maximizes access tohigher education and providesoutlets for artistic, civic, cultural,scientific and social expression aswell as environmental awareness.Goal 4: Ensuring institutionaleffectiveness and accountabilitythrough data‐driven decisionmakingas well as evaluation andimprovement of all collegeprograms and governancestructures.Hispanic/Latino in‐course retention 84.32% 90%Hispanic/Latino in‐course success 60.38% 70%Hispanic/Latino first‐year persistence 52.03% 59%Hispanic/Latino certificate rate 3.62% 6%Hispanic/Latino graduation rate 10.33% 15%Hispanic/Latino transfer rate 11.00% 25%Hispanic/Latino Math improvement rate 11.31% 25%Hispanic/Latino English improvement rate 18.48% 40%Hispanic/Latino ESL improvement rate 21.48% 45%Size of entering cohort 3,925 4,318English preparation ‐ % college‐ready 12.00% 25%Math preparation ‐ % college‐ready 5.00% 15%Size of summer bridge program 228 1,000Number of high schools involved in formalpartnerships via grants or other specialagreements and/or programs (not regularoutreach activities) 25 30Entering students will have a positiveperception of <strong>ELAC</strong> as a center for academicexcellence and community involvement No Baseline 65.00%49.3% agree theBudget linked to missionbudget is linked tothe college mission 75.00%46.48% agree thatData use and awarenessdata is availableand usable 75.00%% Completion of program review 100% 100%Number of courses that incorporatedchanges as a result of SLO assessments 170 600Number of programs of study and programsof service that have incorporated changesas a result of SLO assessments 0 30<strong>East</strong> <strong>Los</strong> <strong>Angeles</strong> <strong>College</strong> | <strong>Strategic</strong> <strong>Plan</strong> 2011‐2017 49
Each of these measures will be completed annually and will be reported to the <strong>Strategic</strong> <strong>Plan</strong>ningCommittee and its subcommittees in each fall semester. The results of these measures will be discussedannually in order to determine the relative success of the planned actions and make adjustments asneeded in order to improve student outcomes and institutional efficiency. Each committee will have theability to initiate additional program‐specific evaluations in order to determine which interventions havethe most impact on student outcomes and to analyze the potential for scalability. At the end of theplanning sequence, a historical report will be compiled that will report trend data on each of thesemeasures along with information on the most successful initiatives and the barriers that the collegefaced in the implementation of its <strong>Strategic</strong> <strong>Plan</strong>. This information will be shared with the public toinform them of the college’s successes and challenges and will be used in the development of a revised<strong>Strategic</strong> <strong>Plan</strong> in 2016.<strong>East</strong> <strong>Los</strong> <strong>Angeles</strong> <strong>College</strong> | <strong>Strategic</strong> <strong>Plan</strong> 2011‐2017 50