Users Guide - the Virginia Modeling, Analysis and Simulation Center
Users Guide - the Virginia Modeling, Analysis and Simulation Center Users Guide - the Virginia Modeling, Analysis and Simulation Center
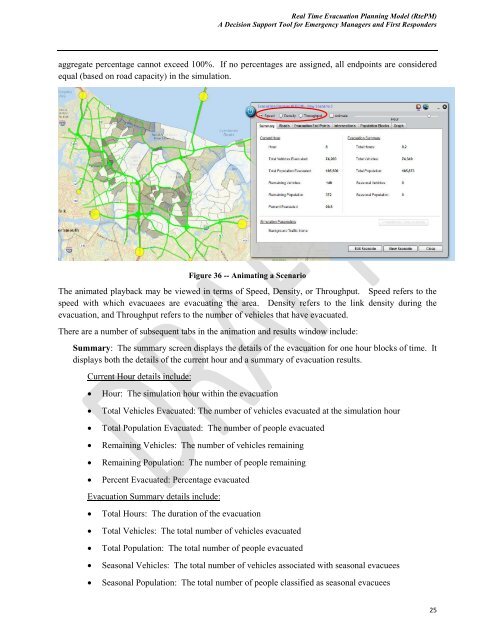
Real Time Evacuation Planning Model (RtePM)A Decision Support Tool for Emergency Managers and First Respondersaggregate percentage cannot exceed 100%. If no percentages are assigned, all endpoints are consideredequal (based on road capacity) in the simulation.Figure 36 -- Animating a ScenarioThe animated playback may be viewed in terms of Speed, Density, or Throughput. Speed refers to thespeed with which evacuaees are evacuating the area. Density refers to the link density during theevacuation, and Throughput refers to the number of vehicles that have evacuated.There are a number of subsequent tabs in the animation and results window include:Summary: The summary screen displays the details of the evacuation for one hour blocks of time. Itdisplays both the details of the current hour and a summary of evacuation results.Current Hour details include:Hour: The simulation hour within the evacuationTotal Vehicles Evacuated: The number of vehicles evacuated at the simulation hourTotal Population Evacuated: The number of people evacuatedRemaining Vehicles: The number of vehicles remainingRemaining Population: The number of people remainingPercent Evacuated: Percentage evacuatedEvacuation Summary details include:Total Hours: The duration of the evacuationTotal Vehicles: The total number of vehicles evacuatedTotal Population: The total number of people evacuatedSeasonal Vehicles: The total number of vehicles associated with seasonal evacueesSeasonal Population: The total number of people classified as seasonal evacuees25
Real Time Evacuation Planning Model (RtePM)A Decision Support Tool for Emergency Managers and First RespondersRoads: A snapshot of the road data during the evacuation including speed, delay, traffic density, andvehicle throughput. Roads are displayed when the “Show Layer” check box is selected on the RoadsTab.Evacuation End Points: A description of how many vehicles, population, and percentage that went toa specified end point. End points are displayed when the “Show Layer” check box is selected on theEvacuation End Points tab.Intersections: Identifies the total delay at specific intersections. Intersections are displayed when the“Show Layer” check box is selected on the Intersections tab. Population Blocks: Describes how many and the percentage of vehicles remaining within anevacuation zone duuring the evacuation. Population blocks are displayed when the “Show Layer”check box is selected on the Population Blocks tab.Graph: A plot of time in hours on the X axis versus % Evacuated on the Y axisCommon ErrorsIf you accidentally close your file without saving, it will show as locked when you try to reopen it.RtePM will automatically release the file in five minutes.RtePM Map FunctionsRtePM also provides a variety of Map functions including the ability to view a map in terms of a streetview (Figure 37), aerial view (Figure 38), or topographic view (Figure 39). You can choose which viewis preferred by selecting one of the buttons at the top right of the screen. (Circled in red below)Figure 37 – Streets View26
- Page 1: Real Time Evacuation Planning Model
- Page 5 and 6: Real Time Evacuation Planning Model
- Page 7 and 8: Real Time Evacuation Planning Model
- Page 9 and 10: Real Time Evacuation Planning Model
- Page 11 and 12: Real Time Evacuation Planning Model
- Page 13 and 14: Real Time Evacuation Planning Model
- Page 15 and 16: Real Time Evacuation Planning Model
- Page 17 and 18: Real Time Evacuation Planning Model
- Page 19 and 20: Real Time Evacuation Planning Model
- Page 21 and 22: Real Time Evacuation Planning Model
- Page 23 and 24: Real Time Evacuation Planning Model
- Page 25 and 26: Real Time Evacuation Planning Model
- Page 27 and 28: Real Time Evacuation Planning Model
- Page 29: Real Time Evacuation Planning Model
- Page 33 and 34: Real Time Evacuation Planning Model
- Page 35 and 36: Real Time Evacuation Planning Model
- Page 37 and 38: Real Time Evacuation Planning Model
Real Time Evacuation Planning Model (RtePM)A Decision Support Tool for Emergency Managers <strong>and</strong> First Respondersaggregate percentage cannot exceed 100%. If no percentages are assigned, all endpoints are consideredequal (based on road capacity) in <strong>the</strong> simulation.Figure 36 -- Animating a ScenarioThe animated playback may be viewed in terms of Speed, Density, or Throughput. Speed refers to <strong>the</strong>speed with which evacuaees are evacuating <strong>the</strong> area. Density refers to <strong>the</strong> link density during <strong>the</strong>evacuation, <strong>and</strong> Throughput refers to <strong>the</strong> number of vehicles that have evacuated.There are a number of subsequent tabs in <strong>the</strong> animation <strong>and</strong> results window include:Summary: The summary screen displays <strong>the</strong> details of <strong>the</strong> evacuation for one hour blocks of time. Itdisplays both <strong>the</strong> details of <strong>the</strong> current hour <strong>and</strong> a summary of evacuation results.Current Hour details include:Hour: The simulation hour within <strong>the</strong> evacuationTotal Vehicles Evacuated: The number of vehicles evacuated at <strong>the</strong> simulation hourTotal Population Evacuated: The number of people evacuatedRemaining Vehicles: The number of vehicles remainingRemaining Population: The number of people remainingPercent Evacuated: Percentage evacuatedEvacuation Summary details include:Total Hours: The duration of <strong>the</strong> evacuationTotal Vehicles: The total number of vehicles evacuatedTotal Population: The total number of people evacuatedSeasonal Vehicles: The total number of vehicles associated with seasonal evacueesSeasonal Population: The total number of people classified as seasonal evacuees25


