THE ROLE OF DEFORMATION IN THE ... - Earth Science
THE ROLE OF DEFORMATION IN THE ... - Earth Science
THE ROLE OF DEFORMATION IN THE ... - Earth Science

Create successful ePaper yourself
Turn your PDF publications into a flip-book with our unique Google optimized e-Paper software.
TECTONICS, VOL. 10, NO. 2, PAGES 455-473, APRIL 1991<strong>THE</strong> <strong>ROLE</strong> <strong>OF</strong> <strong>DEFORMATION</strong> <strong>IN</strong> <strong>THE</strong> FORMATION<strong>OF</strong> METAMORPHIC GRADIENTS: RIDGESUBDUCTION BENEATH <strong>THE</strong> OMAN OPHIOLITEBradley R. HackerDepartment of Geology, Stanford University, Stanford,CaliforniaAbstract. Two tectonic scenarios have been proposed forgenesis and emplacement of the Oman ophiolite. One suggeststhat the ophiolite was generateda spreading center, theother suggests generation within an intraoceanic arc. Anintegrated thermal and kinematic model of the temperature,stress, rock type, and displacement fields during early stagesof the emplacement of the Oman ophiolite was developed totest these two possibilities. The thermal evolution wascalculated by a finite difference algorithm for heatconduction, considering heats of metamorphic reactions,deformational heating, heat advection by flowing rock,mantle heat flow, and radioactive heating. The stress anddisplacement fields were calculated by an analytical modelusing a velocity boundary condition, power law constitutiverelations, and a brittle frictional sliding relationship. Fieldobservations in Oman can be satisfied with the spreadingcenter model but not with the arc model. Moreover,simulations indicate that the ophiolite was probably
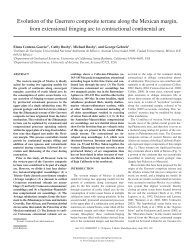
456 Hacker: Ridge Subduction Beneath the Oman Ophiolitesimulations of the early stages of the thermal and kinematichistory of the sole of the Oman ophiolite based specificallyon the ophiolite emplacement hypothesis of Lippard et al.[1986]. It was concluded that Lippard et al.'s [1986] model,which considers the Oman ophiolite to have formed in anintraoceanic arc, is unable to explain several significant fieldobservations in Oman. An alternative model wherein theOman ophiolite formed at a mid-ocean spreading center,presented by Coleman [1981], Boudier and Coleman [ 1981 ],Boudier et al. [1988] and Montigny et al. [1988], is consideredin this paper. For the purposes of this paper, a "metamorphicfield gradient" is a gradient of (peak) metamorphictemperatures recorded in rocks, and a "thermal gradient"refers to an instantaneous gradient of temperatures in <strong>Earth</strong> atany given time [Spear and Peacock, 1989].GEOLOGY <strong>OF</strong> TIlE OMAN OPHIOLITEMost Tethyan ophiolites were emplaced onto the Afro-Arabian platform in Cretaceous time and then furtherdeformed and metamorphosed during the continent-continentcollision that ended the Alpine orogeny [Lippard et al., 1986].The Oman ophiolite, however, was spared the continentcontinentcollision and constitutes a natural laboratory forinvestigating ophiolites. Diverse field studies of thiscomplex have been published, including five journal issues orvolumes dedicated to the Oman ophiolite [Glenniet al.,1974; Coleman and Hopson, 1981; Lippard et al., 1986;Boudier and Nicolas, 1988; Robertson et al., 1990b].The Oman Mountains comprise a southwest directedsystem of oceanic thrust sheets (Figure 1) that were thrustover a Precambrian to Cretaceous continental autochthon inCretaceous time and then overlapped by Maastrichtian andTertiary sedimentary rocks. The autochthon includescontinental shelf rocks of the Arabian platform resting onearly Paleozoic and possibly late Proterozoicratonal rocks[Glenniet al., 1974; Gass et al., 1990; Pallister et al., 1990].The thrust sheets are, from structurally lowest(southwesternmost) to structurally highest(northeasternmost),Sumeini Group, the HawasinaComplex, the Haybi Complex, the ophiolite, and the BatinahComplex. The Sumeini, Hawasina, and Haybi are continentalslope, slope-basin, and seamount rocks, respectively, depositedin a Middle Triassic to Late Cretaceous passive margin andocean basin northeast of the Arabian craton [Glenni et al.,1974; Woodcock and Robertson, 1982a; Lippard et al., 1986;Bdchennec et al., 1988; Robertson et al., 1990a]. The ophiolite,now disrupted into a number of relatively intact blocks,exposes a classic ophiolite pseudostratigraphy as recognizedby the Penrose Conference Participants [ 1972]. The BatinahComplex includes m61ange believed to have been derivedfrom beneath the ophiolite during late-stag extensionalfaulting and allochthonous thrust sheets of sedimentaryrocks that slid onto the ophiolite late in the emplacementhistory [Woodcock and Robertson, 1982b; Robertson andWoodcock, 1983a].The presently exposed ophiolite extends more than 600 kmnorth-south, and is up to 150 km wide and 5-10 km thick. It isinferred to have been 16-20 km thick (Figure 2) prior to itsdismemberment on the craton by extensional faulting. Theophiolite consists of a basal metamorphic sole (150-200 m),peridotite tectonite (8-12 km), igneous peridotite and gabbro(0.5-6.5 km), sheete dikes (1-1.5 km), lavas (0.5-2.0 km),and overlying pelagic sedimentary rocks (
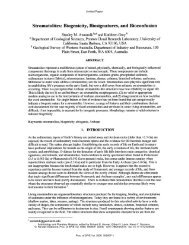
Hacker: Ridge Subduction Beneath the Oman Ophiolite 457ActualSheeted dikes.11.•.. • Pillow lavar.'.'.'r.'.'.'r.'.'.'r.*.*.*D ½,",:PlutonicperidotiteandgabbroPeridotRe•,,½,,,,• tectonitekm•Metamorph•c soleContinental marginand shelf sedimentsModelBasaltPeridotiteQuartziteFig. 2. A pseudostratigraphic section of the Oman ophioliteand underlying units and the simplified section used in themodel. Sections measured in the field have 0.5-2.0 km ofpillow lava, 1.0-1.5 km dikes, 0.5-6.5 km plutonicperidotire and gabbro, 8-12 km peridotite tectonite, and0-0.2 km of metamorphic rocks [Boudier and Coleman, 1981;Christensen and Smewing, 1981; Manghnani and Coleman,1981; Pallister and Hopson, 1981; Lippard et al., 1986]. Thepseudostratigraphic section is a composite reconstructionbased on numerous incomplete sections of variable thickness,and is inferred to representhe pseudostratigraphy of theophiolite before disruption.aforementioned thicknesses and temperatures implymetamorphic field gradients of >1000 K km -1. Theamphibolite- and greenschist-facies rocks (Figure 3) yield K-Ar ages of ~100-70 Ma [Alleman and Peters, 1972; Searle etal., 1980; Lanphere, 1981; Montigny et al., 1988].Two foliations have been mapped in the peridotite, (1) apervasive coarse porphyroclastic foliation, and (2) a finegrainedporphyroclastic to mylonitic foliation in the lower150-2000 m of the peridotire, which overprints the pervasivefoliation and increasesintensity downward toward themetamorphic sole [Searle et al., 1980; Nicolas et al., 1980;Boudier and Coleman, 1981; Boudier et al., 1988; Ceuleneer etal., 1988]. The pervasive foliation is inferred to have formedduring high-temperature, low-stress asthenospheric flow, andthe mylonitic foliation is inferred to have formed at lowertemperatures and higher stresses during emplacement of theophiolite [Boudier and Coleman, 1981]. Olivinemicrostinctures and two-pyroxene thermometry have beenused to infer temperatures of mylonitization of 750ø-1000øC[Boudier and Coleman, 1981; Lippard, et al., 1986; Ceuleneeret al., 1988].The peridotire tectonite, igneous peridotire and gabbro,sheetedikes, and lowermost lavas represent oceaniclithosphere of "normal" chemistry and thickness [Alabasteret al., 1982; Pallister and Gregory, 1983; Lippard et al., 1986;Ernewein et al., 1988]. Eleven 206pb-238U ages onplagiogranites in the intrusive sequence are in the range 95.4-93.5 Ma, although there are two that are slightly older (96.9and 97.3 Ma); all ages have estimated uncertainties of +0.5m.y. [Tilton et al., 1981]. The lowermost, oldest lavas may becogenetic with the underlying sheete dikes, whereas youngerlavas have trace element affinities with island arc tholeiites[Lippard et al., 1986; Ernewein et al., 1988]. Pearce et al.[1981] and Alabaster et al. [1982] suggesthat the youngerlavas erupted above a subduction zone. Ernewein et al. [1988],however, point out that pelagic, not volcaniclastic,sedimentary rocks are interbedded with the younger lavas andprefer the interpretation that the lavas inherited theirsubduction zone component from either a regional mantlechemical anomaly or from second-stage melting of theirmantle source. This is a critical difference because Pearce etal. [1981] and Lippard et al. [ 1986] interprethe Omanophiolite as part of an arc that formed above an intraoceanicsubduction zone, whereas Boudier and Coleman [1981],Coleman [1981], Ernewein et al. [1988], Montigny et al.[1988], Nicolas et al. [ 1988], Boudier et al. [1988], and Thomaset al. [1988] believe that the ophiolite was generated at a midoceanspreading center.Hacker [1990] reported simulations of the formation ofthe sole of the Oman ophiolite based on the "arc" modelproposed by Lippard et al. [1986]. The age of the ophiolitewas assumed to be 5 m.y. at the inception of subduction, andthe effects of subducting 5- to 100-m.y.-old lithospherebeneath the ophiolite were examined. The subduction zonewas assumed to dip 45 ø to a depth of~17 km, where the dipchanged to horizontal. None of the simulations was able toreproduc either the peak metamorphic temperatures inferredfor the Oman sole [Ghent and Stout, 1981; Searle, 1990], orthe wide range of K/Ar ages reported for the metamorphicsole [e.g., Montigny et al., 1988].One salient feature of the previous study [Hacker, 1990] isthat the accretion of metamorphic rocks at the base of theOman ophiolite can be explained with a transient, two-lllllllllllllllllllllllllllllll100 9o 8om.y. before present0 Amphibole Iß M. us.covite IFig. 3. K-Ar ages from the metamorphic sole of the Omanophiolite from Alleman and Peters [1972], Lanphere [1981],and Montigny et al. [1988]. Mean values and lc• standarddeviations (horizontal bars) are shown.
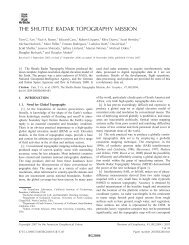
_458 Hacker: Ridge Subduction Beneath the Oman Ophiolitedimensional thermomechanical model using laboratorymeasurements of the thermal and mechanical properties ofrocks. Figure 4 illustrates the importance of thissynmetamorphic faulting, using a conceptually simplifiedone-dimensional approach for ease of illustration. It shows afault zone between two moving plates, the upper plateophiolite and the lower subducted plate. Consider a onedimensionalcolumn through both plates (Figure 4a). Theinitial thermal gradient is a sawtooth, and deformation occursat the base of the peridotite where the peridotite deforms bypower law creep at stresses lower than those required forfrictional sliding. As thermal conduction occurs, the thermal17 kmPeridotiteLower!!aPlatePeridotite.LowerPlateBasalt'deformation inperidotite at. base of upperplateTemperatureStressbdeformationnarrowerzoneinof peridotite atbase of upperplateTemperatureStresscdeformationchiefly inmetamorphosedbasalt attop of lowerplateTemperature StressFig. 4. One-dimensional cartoon of how conductive decay of a sawtooth-shaped thermal gradient canproduce localized deformationprogressively deeper levels, resultingaccretion of metamorphicrocks to the base of the ophiolite. (a)-(c) Steps in a time sequence. Note thathe simulations are not onedimensionalwith a sawtooth thermal gradient but are two dimensional and consider time-dependentevolution of temperature and faulting.
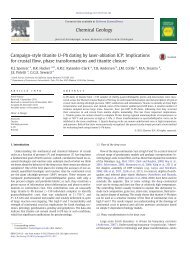
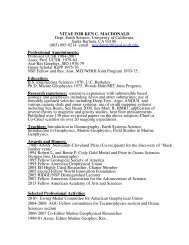
Hacker: Ridge Subduction Beneath the Oman Ophiolite 459gradient relaxes, and the upper portion of the lower platebasaltic layer is metamorphosed to greenschist facies (Figure4b). The stres supporteduring power law creep ofgreenschistgreater than the stress for frictional sliding, sodeformation continues only in the upper plate peridotire,although cooling of the upper plate causes the deformation tobe concentrated in a narrower band. At a later time the lowerplate reaches amphibolite-facies conditions and is then warmenough for power law creep to occur at stresses lower thanthose for frictional sliding and lower than those for powerlaw creep of peridotire (Figure 4c). In these three steps, thezone of deformation moved progressively downward into thewarming lower plate, and upper parts of the lower platebasaltic layer successively accreted to the base of theophiolite.This paper addresses the possibility that the Omanophiolite represents the northeast flank of a mid-oceanspreading center. The important differences between thisstudy and the previous one [Hacker, 1990] are that thepossibilities of subduction of very young crust andsubduction at a shallow angle (10 ø) are considered. Thesimulationsuccessfully reproduce both the peakmetamorphic temperatures inferred for the Oman sole and thewide range of K/Ar ages reported for the Oman sole. Theysuggest that the Oman ophiolite likely originated in oceaniclithosphere less than 2 m.y. old, and that shear stresses of-100 MPa were attained within the subduction zone.TECTONIC EVOLUTION <strong>OF</strong> <strong>THE</strong> OMAN OPHIOLITEThe field observations described above suggest thefollowing tectonic evolution of the Oman ophiolite. In LatePermian time a passive margin formed on the Arabianplatform [Blendinger et al., 1990]. Rifting of the basin andsubsequent creation of new oceanic lithosphere resulted interrigenous turbidire deposition succeeded by Middle Jurassiccalcareous turbidire and chert deposition [Robertson andSearle, 1990]. In Late Jurassic to Early Cretaceous time, slowpelagic sedimentation was dominant. Radical change occurredin Albian to Cenomanian time, when intraoceanic subductionwas initiated between -101 and 95 Ma. Metamorphism in theophiolite sole spanned Albian to Campanian time (101-70Ma); the amphibolite-facies metamorphism occurred between101 and 89 Ma, and the greenschist-facies rocks developedfrom 87 to 76 Ma. During this interval, the allochthonousplates were assembled and faulted onto the Arabiancontinental margin. By Maastrichtian time (70-65 Ma) allthe plates had been partially eroded and transgressed byshallow-water carbonate rocks. These parts of the ophiolitedevelopment are agreed upon by most authors [Lippard et al.,1986; Boudier and Nicolas, 1988]. However, as mentionedpreviously, there is disagreement regarding the petrogenesisand tectonic implications of the younger lavas. Lippard et al.[1986; p. 155] suggest that the ophiolitevolved on thesouthwest flank of a backarc spreading center above aSpreadingproto Om7n ophiolite:::::::::::::::::::::::::::::::::::::::::::::::::::::::::::::::::::::::::::::::::::::::::::::::::::::::::::::::::::::::::::::::....... -=================================================='•"":'"=•-.'•"• - _- _BCIntra-oceanic thrusting•-'-'-'.'-'-'-''-'.'.'.'.'-'.'-'-'' '-"' .•...•.•.•...............•..............•........•......•..........••...•.•...........•..................j "'_. - .... '"' '"'"'""""'"'"'"'"'t•========================================================================================================================:::::::::::::::::::::::::::::::::::::::::::::::::::::::::::::::::::::::::::::::::::::::::::::::::::::::::::::::::::::::::::::::::::::::::::::::::::::::::::::::::::::::::::::::::::::::::::::::::::::::::::::::::::::::::::-'"•.2'"" ....'•'""•:"'"••:.•-:.'.•.:.:.'.•87 to 76 Ma' Emplacement onto the cratonmetamorphic soleArabiancratonFig. 5. Hypothetical palinspastic reconstruction of the genesis and emplacement of the Oman ophiolite[after Boudier and Coleman, 1981; Boudier et al., 1988; Montigny et al., 1988]. (a) Prior to 101-95 Ma:Spreading is active in the ocean basin; the two plates of oceanicrust are shown in different shades. (b)95-87 Ma: The ophiolite is thrust over adjacent oceanicrustal rocks, which are accreted at amphibolitefaciesconditions to the base of the ophiolite, shown by a heavy line. (c) 87-76 Ma: The ophiolite isthrust over continental rocks, which are accreted at greenschist-facies conditions to the base of theophiolite.
460 Hacker: Ridge Subduction Beneath the Oman Ophiolitesubruction zone dipping away from the continent. Theypropose that the intraoceanic subruction initiated at thecontact between the young crust and the older (5-100 m.y.older) oceanic lithosphere into which it was intruded. Thispossibility was addressed in a previou study [Hacker, 1990].In contrast, Boudier and Coleman [1981], Montigny et al.[1988; p. 359], Emewein et al. [1988; p. 270], Nicolas et al.[1988; p. 51], Boudier et al. [1988; p.289], and Thomas et al.[1988; p. 318] suggest that the ophiolite originated on thenortheast flank of a mid-ocean spreading center and thatintraoceanic subruction was initiated at the ridge axis (Figure5). It is this "ridge" model that is addressed in the currentstudy.According to the Ernewein et al. [1988] model the absenceof arc rocks in the ophiolite seems to conflict with theinference that the ophiolite formed in an ocean basin with ahalf width of -450 km [B6chennec et al., 1988]. For theophiolite to have reached the craton, the 450 km of oceaniclithosphere must have been subducted beneath the ophiolite,surely enough material could have melted to form a magmaticarc. There are at least two ways to reconcile theseobservations. If the subruction occurred at a shallow angle,melting may have been inhibited or have produced liquidsunlike typical arc magmas [e.g., Lipman et al., 1971; Coney andReynolds, 1977]. Alternatively, the 450 km of oceaniclithosphere may have been duplicated by thrusting beforebeing subducted beneath the ophiolite, such that the eff•tivewidth of the subducted lithosphere was much less than 450km.The suggestion that the Oman ophiolite came from then9rtheastern side of a northwest-southeast spreading ridge isbased on the northeastward thickening taper of the slab[Lippard et al., 1986]. Other attempts to determine whichflank of a spreading center is represented in Oman, based ondike chilling directions [Pallister, 1981; Lippard et al., 1986,p. 99], the inclination of cumulus layering in plutonic rocks[Pallister and Hopson, 1981], and the shear sense recorded inthe mantle tectonite [Boudier and Coleman, 1981; Nicolas etal., 1988] yield equivocal results.Various structural indicators have been used to infer thethrusting direction during emplacement of the Omanophiolite. The structures are not uniform from one massif toanother but in general indicate ridge-parallel movement in themylonitic peridotire, and ridge-orthogonal movement in themetamorphic sole [Boudier et al., 1988; Thomas et al., 1988].Paleomagnetic data [Thomas et al., 1988] indicate that thevarious massifs of the Oman ophiolite have not rotatedsignificantly with respect to one another, so these variationsin thrusting direction represent spatial variation in theemplacement direction.Paleomagnetic data also allow Thomas et al. [1988] tosuggesthat the ophiolite was created at a northeastrendingspreading center, was rotated 75 ø counterclockwise soonthereafter and was then rotated 40 ø clockwise beforeemplacement onto the Arabian craton. Together with thepaleomagnetic data the vergence directions indicate that theOman ophiolite always moved toward the southwest: initialmovement recorded by the peridotire was parallel to the ridge(toward the southwest), and later movement recorded by themetamorphic sole was perpendicular to the ridge (alsotoward the southwest), following rotation of-75 øcounterclockwise [Thomas et al., 1988].MODELA thermomechanical model developed previously [Hacker,1990] to test part of the arc tectonic model proposed byLippard et al. [1986], is used in this study to test part of theridge tectonic model proposed by Boudier and Coleman[1981], Boudier et al. [1988] and Montigny et al. [1988]. Themodel predicts the stress field, temperature field, rock type,and displacement field histories during the early stages of theophiolite emplacement process, and these predictions are thenshown to compare favorably with field observations. Laterstages of the emplacement process, which may have involvedgravity sliding, are not modeled. Boudier et al. [1988] andMontigny et al. [1988] propose that spreading at a mid-oceanridge formed the Oman ophiolite (Figure 5a). Later, at ~101-95 Ma, subruction began along the spreading axis (Figure 5b).Basaltic rocks from the underthrust plate weremetamorphosed at amphibolite-facies conditions and accretedto the base of the ophiolite (Figure 5b) from 101 to 89 Ma,and then continental material was accreted to the sole atgreenschist-facies conditions from 87 to 76 Ma (Figure 5c).The convergence velocity was assumed to be 50 mm yr -1[Boudier et al., 1988, Figure 12], although the effects ofvariations in this rate were also investigated. The rate ofsubduction must have been at least 25 mm yr -1, because ~630km of oceanic and continentalithosphere were subductedbeneath the ophiolite in ~25 m.y. Convergence parallel andperpendicular to the ridge axis was tested. The total amountof oceanic lithosphere subducted beneath the ophiolite isestimated very roughly as -450 km by palinspasticreconstruction of basinal rocks [Glennie et al., 1974; Lippardet al., 1986; B6chennec et al., 1988; Cooper, 1988]. The totalamount of continentalithosphere subducted is estimated as180 km, from the width of the ophiolite outcrop on theArabian craton. The subducted oceanic lithosphere was a fewmillion years old at the time of subduction, and probablydeveloped at rates > 10-20 mm yr- 1 [Boudier et al., 1988],perhaps up to 50 mm yr-1 [Pallister and Hopson, 1981;Nicolas et al., 1988]. The convergence velocity was assumedto be 50 mm yr-1 in the simulations. The subductedcontinental lithosphere was ~720-760 m.y. old [Glennie etal., 1974; Gasset al., 1990; Pallister et al., 1990].The angle of subduction in the simulations (10 ø) was takento be constant with depth; note that this is different from thegeometry assumed by Hacker [1990], where the subductionoccurred at 45 ø to a depth of ~ 17 km, and then was horizontal.It has been suggested by Boudier et al. [1985; 1988] that thedip of the subduction zone can be inferred from the wedgeshape of the Oman ophiolite. Boudier et al. [1988] state thatfield observationsuggesthat the dip of the subduction zonewas 2o-3 ø , however, published cross sections do not concurwith this figure. The ophiolite slab thickens northeastwardfrom 2-4 km thick in Bahla to 10-12 km thick in Rustaq, 37-72 km away [Boudier et al., 1988], indicating a dip of 5ø-15 ø.In the Wadi Tayin massif a thickness change of 3.7 km occursover a distance of 28.6 km, indicating a taper of 7.4 ø [Boudierand Michard, 1981; Boudier et al., 1988; Figure 2a].
Hacker: Ridge Subduction Beneath the Oman Ophiolite 461Moreover, gravity modeling of Shelton [1990] shows awedge-shaped slab with an angle of-11 ø. Thus a subductionzone dip of 10 ø was chosen for the present study.Subduction zones formed in young oceanic lithosphere areexpected to be inclined at shallow angles because of the lowdensity of young lithosphere. Turcott et al. [1977]calculated that several hundred kilometers of oceaniclithosphere must be overridden by material of mantle densitybefore (steep) subduction can be initiated because of theflexural strength of the lithosphere. Sacks [1983] showedthat subducted lithosphere
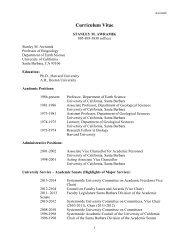
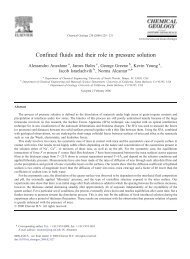
462 Hacker: Ridge Subduction Beneath the Oman OphioliteMechanical ParametersThe stress and displacement fields were calculated with ananalytical model using velocity boundary conditions,temperature-dependent power law constitutive relations, anda pressure-dependent brittle frictional sliding relationship.The horizontal velocity boundary condition specifies the rateat which material is subducted beneath the ophiolite. Thestress estimate is the result of the velocity boundarycondition and the rheology of the rocks. The displacementfield defines the advection and determines where thedeformation occurs.The strength of rock was computed as a function ofpressure, temperature, strain rate, and rock type. Three modesof deformation were considered: (1) brittle frictional sliding,(2) power law creep, and (3) transitional behavior (Figure 7).Whichever mode of deformation required the lowest stress ata given node (i.e., at a given pressure, temperature, and rocktype), was considered to be the only active mode ofdeformation at that node. At low temperatures and pressures,brittle failure occurs because power law creep strengths arelarge at low temperatures, whereas the brittle strength issmall at low pressures and assumed to be independent oftemperature. Fluid pressure was assumed to be hydrostatic.At high temperatures and pressures, power law creep occursbecause the brittle strength is large at high pressures, whereaspower law creep strengths are low at high temperatures andassumed to be independent of pressure. See Hacker [1990] fora discussion of the selection of these values, and an evaluationof the effects of their uncertainties.CalculationProceduresA time step of 0.01 m.y. was used to ensure stability of thethermal calculations. Each time step was composed of thefollowing'o20{]Differential Stress (MPa)5O 1000 -• .36Frictional Shdlng _'15000.24o{ß80gPower-Law Cree= A • n exp(-H/RT)oß0.61000200.8• ! 25o 25 50 75Shear Stress (MPa)Fig. 7. Strength was determined as a function of pressure, temperature, and rock type. At shallowdepths, low pressures, and low temperatures, frictional sliding occurs; the strength was determined by arelationship of the form: (•s = I,t an (l&) (pressures are shown on the vertical axis, and the strain rate is10 -12 s-l). At great depths, high pressures, and high temperatures, power law creep occurs; the strengthwas determined by a relationship of the form: [ = A (•n exp(-H/RT) or (• = ([/(A exp(-H/RT)))1/n(temperatures are shown on the vertical axis). A transitional regime occurs at intermediate depthswhere the frictional sliding and power law creep strengths exceed 200 MPa differential stress. 3•, porepressure fraction of total pressure; (•s, shear traction; g, friction; (•n, normal traction; [, strain rate; A,pre-exponential constant; (•, differential stress; n, stress exponent; H, activation enthalpy; R, gasconstant; T, absolute temperature. Thermobarometric gradient shown applies to oceanic lithosphere of-5 m.y. age.
Hacker: Ridge Subduction Beneath the Oman Ophiolite 4631. Determine where any metamorphic reactions occur.Change rock types as appropriate, and add or subtract heat.2. Allow heat to conduct.3. Calculate the differential stress in each column thatsustains the imposed horizontal velocity boundary condition.4. Compute the resultant vertical gradient in thehorizontal strain rate and displacement in each column.5. Determine the amount of heat generated bydeformational heating.6. Move material to reflect the displacement gradient ineach column.7. Return to step 1.The simulations were halted when 450 km of oceaniclithosphere and 180 km of continental lithosphere had beensubducted beneath the ophiolite. The small time step meansthat the calculations are implicitly self-consistent (e.g., thecorrect interplay between deformational heating and stress iseffectively maintained by iteration on a 0.01 m.y. time step).RESULTSMany simulations were conducted using the tectonichistory suggested by Boudier and Coleman [1981], Boudier etal. [ 1988] and Montigny et al. [1988]. The influence of modelparameters was evaluated by varying the value of eachparameter while holding all other parameters constant.Specifically, a range of values for lithosphere age, subductionvelocity, thermal conductivity, and maximum stress wereexamined. The effects of subduction parallel andperpendicular to the ridge axis were also considered.Two disparate models with different lithosphere age andmaximum stress are shown here. In both, subduction beginsat a spreading center; the axis of the spreading center is at theleft edge of Figures 8a and 9a. In Figure 8 the lithosphere is 2m.y. old and the maximum shear stress is limited to 100 MPa.In Figure 9 the lithosphere is 0.1 m.y. old and the maximumshear stress is limited to 50 MPa.Both simulations produce qualitatively similar results.Note that steady state is not achieved because the amount anddistribution of deformational heating are constantly changingand the age of the subducted lithosphere is steadily increasing.Although there initially is less heat in the 2-m.y.-oldlithosphere, the higher maximum stress produces moredeformational heating, leading to greater isotherm overturnand longer retention of heat. The lower panel in each figurecorresponds to when continentalithosphere begins to besubducted beneath the ophiolite.A useful test of these simulations is to compare theirpredicted pressure-temperature paths with pressures andtemperatures inferred from field studies in Oman. Figure 10shows the pressure-temperature paths for various nodes thatbegin within the uppermost part of the lower plate and finishaccreted to the base of the upper plate. Both figures showfour pressure-temperature paths. The paths labeled "0 m.y."correspond to material subducted at the initiation ofintraoceanic thrusting, whereas the "9 m.y." paths are formaterial subducted 9 m.y. after intraoceanic thrusting began.Because the subduction rate is 50 mm yr -1, these points wereinitially 450 km apart on the downgoing plate. The pathslabeled "deep accretion" show pressure-temperaturetrajectories for material accreted at the inferred maximumdepth exposed in the metamorphic sole in Oman; whereas the"shallow accretion" paths show pressure-temperaturetrajectories for material accreted at shallower depths. Manyother pressure-temperature paths are possible, but themaximum pressure may be constrained by the thickness of theophiolite slab, and the maximum temperature can not begreater than the "deep accretion" path shown becausematerial subducted to greater depths is not exposed in themetamorphic sole in Oman. The decompression and coolingpaths depend on the simulated uplift history. The uplifthistory is not critical in this study because the ophiolite waslifted up and exposed so rapidly that little thermaloverprinting of the sole rocks could have occurred; theophiolite was subaerially exposed within 5-10 m.y. after thegreenschist-facies metamorphism of the sole [Woodcock andRobertson, 1982b, p. 67]. Note that even higher pressuresmight have been attained if the upper plate were initiallythicker and has been stmcturally thinned during subduction assuggested by Casey and Dewey [ 1984].The box in Figure 10 shows the peak pressures andtemperatures reached during amphibolite-faciesmetamorphism at the base of the Oman ophiolite, as estimatedfrom thermobarometry [Ghent and Stout, 1981; Searle, 1990].These peak metamorphiconditions are achieved in thesimulation with 0.1-m.y. old li:thosphere and a limit on thedifferential stress of 100 MPa (Figure 10b). The inferredmetamorphic temperatures are almost reached in thesimulation with 2-m.y. old lithosphere and a 200 MPadifferential stress limit (Figure 10a). Simulations withlower limits on the stress or with older lithosphere reachlower peak temperatures. Figure 3 shows that most datedrocks in the Oman sole cooled through K/Ar hornblendeclosure temperatures [-525 ø + 25øC; Harrison, 1981] over aperiod of-7 m.y. Both the simulations presented here sustain525 ø + 25øC temperatures for -6-9 m.y. Note that none ofthe simulations using a different subduction geometrypresented in Hacker [1990] produced temperatures in accordwith thermobarometric estimates or temperatures >500øCfor >2-3 m.y., although, there too, the highestemperatureswere sustained longest in the younger subducted plate. Thesimulations presented here suggesthat very younglithosphere supporting differential stresses of the order of100 MPa are required to replicate field observations in Oman.Because of the inverse nature of the approach used in thisstudy, the predictions of the simulations are not necessarilyunique and variables or processes not considered may playimportant, unrecognized roles. We can, however, evaluate thesensitivity of the models to parameters other thanlithosphere age and maximum stress.Increasing the subduction velocity reduces the timerequired to subduct a given amount of material.Consequently, heat advection gains importance relative toheat conduction. Thus for a given amount of subduction thethermal gradient between the two plates is more extremewhen subduction is rapid and less so when subduction is slow.For a slow subduction velocity, heat in the upper plate istransferred more rapidly into the lower plate. Initially thiscauses more rapid metamorphism of the lower plate basalticmaterial and more rapid downward progression of the faultzone (i.e., accretion to form the sole). In the long term,however, thermal equilibration of the entire column causes -
464 Hacker: Ridge Subduction Beneath the Oman Ophiolite2-m.y.-old lithosphere• 100 km150450oC -••1050oc................... 150oC..,,++++ • •-'.';•-'.'•.'.'•-'.'•;.'.'•,.......... 50oC•._750 ø + + + + + +• 150øc+ + + + + + + + '/•/U450øC++++++++++++continentallithosphere9 m.y. i.... ,-'--;-;, 6-,:-, ".-".-".-.-"•'5 450øc -greenschist retrogradedto sub-greenschistamphiboliteretrograded togreenschistserpentinizedperidotireamphibolitegreenschistFig. 8. A time sequence illustrating the temporal and spatial changes in temperatures and rock typescalculated for 2-m.y.-old lithosphere (vertical exaggeration 2X). The maximum differential stress was200 MPa. All material above the fault zone (heavy line) is the ophiolite.
Hacker: Ridge Subduction Beneath the Oman Ophiolite 4650.1-m.y.-old lithosphere• 100 km ••'150oc'•250oc....................4-+ + o75øøct1050oc• z'.............. 150øC50øC:.:.:.:.:.:.:.:.:.:.:.:.:.:.:.:.:.:..........750øCFig. 9. A time sequence illustrating the temporal and spatial changes in temperatures and rock typescalculated for 0.1-m.y.-old lithosphere (vertical exaggeration 2X). The maximum differential stresswas 100 MPa. All material above the fault zone (heavy line) is the ophiolite.the fault zone to cool to temperatures too low fordislocation creep and resetting of hornblende K/Arsystematics. Deformational heating is reduced during slowersubduction, which also tends to reduce the lifetime of thesystem. For these reasons the peak temperatures obtainedduring slower subduction are lower than those during fastersubduction. Simulations with subduction rates of 50-100mm yr -1 produce peak temperatures compatible with thoseinferred from field studies [Ghent and Stout, 1981; Searle,1990], while simulations with subduction rates as slow as 25mm yr -1 do not.Increasing the thermal conductivity increases the rate of
466 Hacker: Ridge Subduction Beneath the Oman Ophiolitea0.60.40.22-m.y.-oldlithosphere.
Hacker: Ridge Subduction Beneath the Oman Ophiolite 467heat conduction. When the thermal conductivity is increased,the subducted plate heats up more rapidly, and the upper platecools more rapidly. Consequently, the subducted basalticrocks undergo prograde metamorphism more rapidly andsupport smaller stresses when deforming. This producesinteresting feedback among deformational heating, heatingthrough metamorphic reactions, and thermal conduction.Smaller stresses produce less deformational heating, andmore rapid prograde metamorphis means more rapidconsumption of heat by dehydration reactions, but in thesimulations this is nearly compensated by the increasedthermal conduction. These competing effects are so evenlybalanced that it is not possible to discriminate amongsimulations with conductivities varying from 2 to 4 J K -1m-1 s-1.In simple terms, increasing the transitional stress increasesthe number of nodes that deform by frictional sliding orcrystal plasticity. More importantly, a higher ceiling on thestress increases deformational heating, and this retards therate at which the upper plate cools and speeds the rate atwhich the lower plate is heated. In simulations where themaximum shear stress was limited to 50 MPa the peakmetamorphic temperatures estimated from field studies[Ghent and Stout, 1981; Searle, 1990] could only be obtainedin simulations with oceanic lithosphere
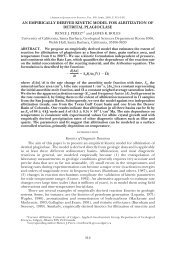
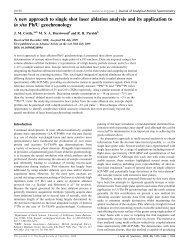
468 Hacker: Ridge Subduction Beneath the Oman OphioliteANo Accretionhanging wallsubducting plate•8rad initialientsTB Discontinuous Accretionhanging wallpeaksubducting platePcContinuous Accretionpeakhanging wallsubducting plateTFig. 11. Three end-member types of accretion in thrust zones. The cross sections (left) show a schematicsubduction zone soon after faulting has begun. PT diagrams (fight) illustrate PT evolution within thefault zone; gray lines delineate possible pressure-temperature paths, and black lines indicate initial andpeak thermobarometric arrays. White, gray, and black squares in left and fight frames correspond. (a)No accretion. Initial and peak gradients are identical, and an inverted metamorphic gradient does notdevelop. (b) Discontinuous accretion: the subduction fault jumps downward (from old to newposition), accreting a piece of the footwall to the hangingwall. (c) Continuous accretion: the subductionfault moves progressively downward (from old to new via a continuum of intermediate positions),accreting pieces of the footwall to the hangingwall.
Hacker: Ridge Subduction Beneath the Oman Ophiolitc 469Consequently, as each quantum of rock arrives at its finaldestination where it accretes, the temperature at the accretionlocation may have changed significantly because of theadditional time required to carry the quanta down the faultzone. Thus if cooling occurs, the inverted metamorphic fieldgradient is steeper than it would be if all the quanta accretedtogether (discontinuous accretion).The pressures recorded at the peak temperatures (notnecessarily the peak pressures) are distinctive for each type ofaccretion, as are the PT paths. For example, continuousaccretion produces PT paths that do not cross (Figure 1 lc),whereas discontinuous accretion produces crossing PT paths(Figure 1 lb).Tethyan-type ophiolites are an extreme example that ametamorphic field gradient need not reflect any particularthermal gradient that was present during the metamorphism[e.g., Spear and Selverstone, 1983]. This is true for regionalmetamorphic terranes because minerals in different portionsof the metamorphic field gradient may have formed atdifferent times. In Tethyan-type ophiolites, however,deformation plays an important role. The metamorphic fieldgradients in the metamorphic soles of Tethyan-typeophiolites are a sequence of rocks that were heated todifferent peak temperatures in disparate areas at differenttimes and were amalgamated into a single column duringsubduction.Thrust faulting is not the only type of faulting in whichextreme metamorphic field gradients can develop. Unusualmetamorphic field gradients could develop in the footwallsof normal fault zones where the heating hangingwall accretesto the uplifting, cooling footwall (the fault zone movesupward with time) (Figure 12). In such situations, absence ofaccretion preserves the initial metamorphic field gradient(Figure 12a), and discontinuous accretion leads tometamorphic field gradients that mimic the thermalgradients during the faulting, just like in thrust faults(Figure 12b). Continuous accretion, however, produces thereverseffect of thrust faults (Figure 12c). The metamorphicfield gradient produced by continuous accretion duringnormal faulting is less steep than the thermal gradient duringthe metamorphism. This is becauseach quantum of rockaccretes at a relatively higher temperature than it wouldduring discontinuous accretion because the time required forthe quantum to translate up the fault zone has allowed thehangingwall to reach higher temperatures.Some thermobarometric studies of ophiolites indicate thatthe peak metamorphic pressures and tempermums decreasedownward within the fault zone [e.g., Jamieson, 1986] (for analternative view see E1-Shazly and Coleman [1990]). Pavlis[1986] suggested that this downwardecrease implies thatthe thrust system was rapidly exhumed or erode duringdisplacement. It is clear from the present study that suchneed not be the case. The downward decreasing pressure andtemperature gradient can be formed by accretion of quanta ofmaterial from progressively shallower portions of thesubduction zone.IMPLICATIONSMany of the implications of this study are similar to thosereported for earlier simulations of the evolution of the Omanophiolite sole [Hacker, 1990, pp. 495 4906] based on the arctectonic model of Lippard et al. [1986]. Several key results ofthis study based on the ridge tectonic model of Boudier andColeman [1981] and Boudier et al. [1988] are different fromthe previou simulations and, furthermore, match the fieldobservations in Oman more closely. Moreover, based on thesimulations in this study, several predictions can be made thatcan be tested by further work in Oman.1. Peak metamorphic temperatures recorded in themetamorphic sole should be greater at the leading edge of theophiolite and lower at the trailing edge, because the entiresystem cooled with time and accretion began at the leadingedge. There are no systematic measurements of the spatialvariation in peak metamorphic temperatures in Oman. Auseful field study would be to unravel the PT histories ofrocks in the sole to determine the spatial distribution of peaktemperatures and the shapes of PT paths. If the spatialvariation predicted by the simulations can be found, then thisstudy provides an explanation of how it might havedeveloped. Furthermore, the spatial distribution of PT pathswithin the sole may yield clues about the geometry ofemplacement, such as the distribution of heat within thelithosphere subducted beneath the ophiolite and the evolutionof slab thicknesses.2. The amphibolite-facies rocks in the Oman ophiolite soleshould have been metamorphosed during a-6-9 m.y. interval,although the duration of this metamorphismrelated to theamount of oceanic lithosphere subducted beneath theophiolite. The greatest shortcoming of the earliersimulations [Hacker, 1990] was that they indicated that theamphibolite-facies rocks formed in -1-3 m.y., whereas theK/Ar ages indicate that the amphibolite-facies metamorphismin Oman spanned at least 7 m.y. [Alleman and Peters, 1972;Lanphere, 1981; Monfigny et al., 1988]. Our currentknowledge of the cooling ages of the sole comes solely fromK/Ar dates on samples that are distributed somewhaterratically across the ophiolite and from samples whosestructural and metamorphic relationships with surroundingrock units are incompletely documented. Moreover, themetamorphic petrogenesis of only a few of the dated sampleshave been thoroughly investigated. A major improvement inour current understanding would be to determine the coolingages of the metamorphic sole using an isotopic system moreinformative than K/Ar, such as 40Ar/39Ar. It is necessarythat the metamorphic petrogeneses of the dated samples andtheir structural and metamorphic relationships with nearbyrock units be carefully characterized. Comprehensive spatialdistribution of samples from across the ophiolite exposureare also required to test the predictions of the simulations inthis study.3. Deformation within the sole should have occurred atmaximum shear stresses of- 100 MPa. Molnar and England[1990] have made somewhat analogous calculations andconcluded that thrusting along the Main Central Thrust inthe Himalaya also occurred at shear stresses of-100 MPa.Although stress magnitudes at some stages of theemplacement of the Oman ophiolite could possibly beestimated through microstructural paleopiezometry, suchmeasurements have not yet been reported. Paleopiezometryof quartzite (present in the greenschist-facies portion of thesole) and dunite (present in the ultramafic tectonite) may
470 Hacker: Ridge Subduction Beneath the Oman OphioliteANo Accretionhanging walluplifting footwall'••andpeakgradientsB Discontinuous Accretionhanging walluplifting footwallinitialgra• gradientTcContinuous Accretionhanging walluplifting footwall/ •l'pea. k• gradientFig. 12. Three end-member types of accretion in normal fault zones. PT diagrams illustrate PTevolution within the fault zone. The cross sections (left) show a schematic normal fault zone soon afterfaulting has begun. PT diagrams (right) illustrate PT evolution within the fault zone; gray linesdefineate possible pressure-temperature paths, and black lines indicate initial and peak thermobarometricarrays. White, gray, and black squares in left and fight frames correspond. (A) No accretion. Initial andpeak gradients are identical. (B) Discontinuous accretion: the fault jumps upward (from old to newposition), accreting a piece of the hangingwall to the footwall. (C) Continuous accretion: thesubduction fault moves progressively upward (from old to new via a continuum of intermediatepositions), accreting pieces of the hangingwall to the footwall.
Hacker: Ridge Subduction Beneath the Oman Ophiolite 471provide some information about the stresses present duringemplacement. Paleopiezometry can be difficult [e.g., Hackeret al., 1990], but recent information about quartz [Pierce,1987; Pierce and Christie, 1987] and olivine [Karato, 1989]grain growth may assist in the interpretation.4. The oceanic lithosphere was very young, probably
472 Hacker: Ridge Subduction Beneath the Oman Ophiolitepatterns at an oceanic spreading center: The Omanperidotires record, Tectonophysics, 151, 1-26, 1988.Christensen, N. I., and J. D. Smewing, Geology and seismicstructure of the northern section of the Oman ophiolite, J.Geophys. Res., 86, 2545-2555, 1981.Coleman, R. G., Tectonic setting for ophiolite obduction inOman, J. Geophys. Res., 86, 2497-2508, 1981.Coleman, R. G. and C. A. Hopson, (Eds.), The OmanOphiolite, J. Geophys. Res., 86, 2495-2782, 1981.Coney, P. J., and S. J. Reynolds, Cordilleran Benioff zones,Nature, 270, 403-406, 1977.Cooper, D. J. W., Structure and sequence of thrustingdeepwatersediments during ophiolite emplacement in thesouth-central Oman Mountains, J. Struct. Geol., 10, 473-485, 1988.Dallmeyer, R. D., and H. Williams, 40Ar/39Ar ages for theBay of Islands metamorphic aureole: Their bearing on thetiming of Ordovician ophiolite obduction. Can. J. <strong>Earth</strong>Sci., 12, 1685-1690, 1975.Dunning, G. R., and T. E. Krogh, Geochronology of ophiolitesof the Newfoundland Appalachians. Can. J. <strong>Earth</strong> Sci., 22,1659-1670, 1985.E1-Shazly, A. K. and R. G. Coleman, Metamorphism in theOman Mountains in relation to the Semail ophioliteemplacement, Geol. Soc. Spec. Publ. London,, 49, 473-493, 1990.England, P. C. and A. B. Thompson, Pressure-temperaturetimepaths of regional metamorphism II. Their inferenceand interpretation using mineral assemblages inmetamorphic rocks, J. Petrol., 25, 929-955, 1984.Ernewein, M., C. Pflumio, and H. Whitechurch, The death ofan accretion zone as evidenced by the magmatic history ofthe Sumail ophiolite (Oman), Tectonophysics, 151,247-274, 1988.Gass, I. G., A. C. Ries, R. M. Shackleran, and J. D. Smewing,Tectonics, geochronology and geochemistry of thePrecambrian rocks of Oman., Geol. Soc. Spec. Publ.London, 49, 585-599, 1990.Ghent, E. D. and M. Z. Smut, Metamorphism at the base of theSamail ophiolite, southeastern Oman Mountains, J.Geophys. Res., 86, 2557-2571, 1981.Glennie, K. W., M. G. A. Boeuf, M. W. Hughes-Clark, M.Moody-Stuart, W. F. H. Pilar, and B. M. Reinhardt,Geology of the Oman Mountains, Verh. K. Ned. Geol.Mijnbouwkd. Genoot. Ged. Ser. 31,423, 1974.Hacker, B. R., Simulation of the metamorphic anddeformational history of the metamorphic sole of theOman ophiolite, J. Geophys. Res., 95, 4895-4907, 1990.Hacker, B. R., A. Yin, J. M. Christie, A. W. Snoke, Differentialstress, strain rate, and temperatures of mylonitization inthe Ruby Mountains, Nevada: Implications for the rate andduration of uplift. J. Geophys. Res., 95, 8569-8580, 1990.Harrison, T. M., Diffusion of 40Ar in hornblende, Contrib.Mineral. Petrol., 78, 324-331,1981.Jacobsen, S. B., and G. J. Wasserburg, Nd and Sr isotopic studyof the Bay of Islands ophiolite complex and the evolutionof the source of mid-ocean ridge basalts. J. Geophys. Res.,84, 7429-7445, 1979.Jamieson, R. A., P-T paths from high temperature shear zonesbeneath ophiolites. J. Metamorph. Geol., 4, 3-22, 1986.Karato, S., Grain growth kinetics in olivine aggregates,Tectonophysics, 168, 255-273, 1989.Kusznir, N.J., Thermal evolution of the oceanic crust; itsdependence on spreading rate and effect on crustalstructure, Geophys. J. R. Astron. Soc., 61,167-181, 1980.Lanphere, M. A. K-Ar ages of metamorphic rocks at the baseof the Semail ophiolite, Oman, J. Geophys. Res., 86, 2777-2782, 1981.Lipman, P. W., H. J. Protska, and R. L. Christiansen, Evolvingsubduction zones in the western United States, asinterpreted from igneous rocks, <strong>Science</strong>, 174, 821-825,1971.Lippard, S. J., A. W. Shelton, and I. G. Gass, The ophiolites ofnorthern Oman, Mere. Geol. Soc. London, 11, 1-178, 1986.Manghnani, M. H. and R. G. Coleman, Gravity profiles acrossthe Samail ophiolite, J. Geophys. Res., 86, 2509-2525,1981.Mattinson, J. M., Ages of zircons from the Bay of Islandsophiolite complex, western Newfoundland. Geology, 4,393-394, 1976.McCulloch, M. T., R. T. Gregory, G. J. Wasserburg, and H. P.Taylor, Jr., Sm-Nd, Rb-Sr, and 180/16 0 isotopicsystematics in an oceanic crustal section: Evidence fromthe Samall Ophiolite, J. Geophys. Res., 86, 2721-2735,1981.Molnar, P., and P. England, Temperatures, heat flux, andfrictional stress near major thrust faults, J. Geophys.Res., 95, 4833-4856, 1990.Montigny, R., O. Le Mer, R. Thuizat, and H. Whitechurch, K-Ar and 40Ar/39Ar study of the metamorphic rocksassociated with the Oman ophiolite, Tectonophysics, 151,345-362, 1988.Moores, E. M., Origin and emplacement of ophiolites, Rev.Geophys., 20, 735-760, 1982.Morgan, P., The thermal structure and thermal evolution ofthe continental lithosphere, Phys. Chem. <strong>Earth</strong>, 15, 107-193, 1984.Morton, J. L., and N.H. Sleep, A mid-ocean ridge thermalmodel: Constraintsthe volume of axial hydrothermalheat flux, J. Geophys. Res., 90, 11,345-11,353, 1985.Nicolas, A., F. Boudier, and J. L. Bouchez, Interpretation ofperidotire structures from ophiolitic and oceanicenvironments, Am. J. Sci., 280A, 192-210, 1980.Nicolas, A., G. Ceuleneer, F. Boudier, and M. Misseri,S•uctural mapping in the Oman ophiolites: Mantlediapirism along an oceanic ridge, Tectonophysics, 151, 27-55, 1988.Pallister, J. S., Structure of the sheetedike complex of theSamail ophiolite near Ibra, Oman. J. Geophys. Res., 86,2661-2672, 1981.Pallister, J. S., and R. T. Gregory, Composition of Samalloceani crust, Geology, 11,638-642, 1983.Pallister, J. S., and C. A. Hopson, Samail ophiolite plumnicsuite: Field relations, phase variation, cryptic variation andlayering, and a model of a spreading ridge magma chamber,J. Geophys. Res., 86, 2673-2645, 1981.Pallister, J. S., J. C. Cole, D. B. Stoesser, and J. E. Quick, Useand abuse of crustal accretion calculations, Geology, 18,35-39, 1990.Parsons, B. P., and J. G. Sclater, An analysis of the variation of
Hacker: Ridge Subduction Beneath the Oman Ophiolite 473ocean floor bathymetry and heat flow with age, J.Geophys. Res., 82,803-827, 1971.Pavlis, T.L., The role of strain heating in the evolution ofmegathrusts, J. Geophys. Res., 91, 12,407-12,422, 1986.Peacock, S. M., Creation and preservation of subductionrelatedinverted metamorphic gradients, J. Geophys. Res.,92, 12,763-12,781, 1987.Pearce, J. A., T. Alabaster, A. W. Shelton, and M.P. Searle,The Oman ophiolite as a Cretaceous arc-basin complex:Evidence and implications, Philos. Trans. R. Soc. London,Ser. A, 300, 299-317, 1981.Penrose Conference Participants, Penrose field conference onophiolites, Geotimes, 17, 24-25, 1972.Pierce, M. L., Kinetics of recovery and grain growth inhydrostatically annealed quartz aggregates, M. S. thesis,116 pp., Univ. of Calif., Los Angeles, 1987.Pierce, M. L., and J. M. Christie, Kinetics of grain growth inquartz aggregates, Eos Trans. AGU, 68, 422, 1987.Robertson, A. H. F. and M.P. Searle, The northern OmanTethyan continental margin: stratigraphy, structure,concepts and controversies. Geol. Soc. Spec. Publ.London, 49, 3-25, 1990.Robertson, A. H. F. and N.H. Woodcock, Genesis of theBatinah m61ange above the Semail ophiolite, Oman, J.Struct. Geol. 5, 1-17, 1983a.Robertson, A. H. F. and N.H. Woodcock, Zabyat Formation,Semail Nappe, Oman: Sedimentationto an emplacingophiolite, Sedimentology, 30, 105-116, 1983b.Robertson, A. H. F., C. D. Blome, D. W.J. Cooper, A. E. S.Kemp, and M.P. Searle, Evolution of the Arabiancontinental margin in the Dibba Zone, northern OmanMountains. Geol. Soc. Spec. Publ. London, 49, 251-284,1990a.Robertson, A. H. F., M.P. Searle, and A. C. Ries (Eds.), TheGeology and Tectonics of the Oman Region. Geol. Soc.Spec. Publ. London, 49, 845 pp., 1990b.Sacks, I. S., The subduction of young lithosphere, J. Geophys.Res., 88, 3355-3366, 1983.Searle, M.P., The Haybi complex, northern Oman Mountains:Evidence for subduction - obduction and thrustemplacement processes beneath the Semail ophiolite, paperpresented at Symposium on Ophiolite Genesis andEvolution of Oceanic Lithosphere, UNESCO-SultanQaboos University, Muscat, Oman, January 7-18, 1990.Searle, M.P., and J. Malpas, Structure and metamorphism ofrocks beneath the Semail ophiolite of Oman and theirsignificance in ophiolite obduction, Trans. R. Soc.Edinburgh <strong>Earth</strong> Sci., 71,247-262, 1980.Searle, M.P., and J. Malpas, Petrochemistry and origin of subophioliticmetamorphic and related rocks in the OmanMountins, J. Geol. Soc. London, 139, 235-248, 1982.Searle, M.P., S. J. Lippard, J. D. Smewing, and D.C. Rex,Volcanic rocks beneath the Semail ophiolite nappe in thenorthern Oman Mountains and their significance in theMesozoic evolution of the Tethys, J. Geol. Soc. London,137, 589-604, 1980.Shelton, A. W., The interpretation of gravity data in Oman:constraintsthe ophiolit emplacement mechanism.Geol. Soc. Spec. Publ. London, 49, 459-471, 1990.Spear, F. S., and S. M. Peacock, Metamorphic Pressure-Temperature-Time Paths. Short Course, 7, 102 pp., AGU,Washington, D.C., 1989.Spear, F. S. and J. Selverstone, Quantitative P-T paths fromzoned minerals: Theory and tectonic applications, Contrib.Mineral. Petrol., 83, 348-357, 1983.Thomas, V., J.P. Pozzi, and A. Nicolas, Paleomagnetic resultsfrom Oman ophiolites related to their emplacement,Tectonophysics, 151,297-321, 1988.Tilton, G. R., C. A. Hopson, and J. E. Wright, Uranium-leadisotopic ages of the Samail ophiolite, Oman, withapplications to Tethyan ocean ridge tectonics, J. Geophys.Res., 86, 2763-2775, 1981.Turcotte, D. L., W. F. Haxby, and J. R. Ockendon, Lithosphericinstabilities, Island Arcs Deep Sea Trenches and Back-Arc Basins, Maurice Ewing Ser., vol. 1, edited by M.Talwani and W. C. Pitman, AGU, Washington, D.C., 1977.Woodcock, N.H. and A. H. F. Robertson, The upper BatinahComplex, Oman: Allochthonous sediment sheets abovethe Semail ophiolite, Can. J. <strong>Earth</strong> Sci., 19, 1635-1656,1982a.Woodcock, N.H. and A. H. F. Robertson, Stratigraphy of theMesozoic rocks above the Semail ophiolite, Geol. Mag.,119, 67-76, 1982b.B. Hacker, Department of Geology, School of <strong>Earth</strong><strong>Science</strong>s, Stanford University, Stanford, CA 94305-2115.(Received August 31, 1990;revised December 4, 1990;accepted December 27, 1990.)