ARI Volume 2 Number 1.pdf - Zoo-unn.org
ARI Volume 2 Number 1.pdf - Zoo-unn.org
ARI Volume 2 Number 1.pdf - Zoo-unn.org
- No tags were found...

Create successful ePaper yourself
Turn your PDF publications into a flip-book with our unique Google optimized e-Paper software.
Animal ResearchInternational ®Animal Research International is an online Journalinaugurated in University of Nigeria to meet thegrowing need for an indigenous and authoritative<strong>org</strong>an for the dissemination of the results of scientificresearch into the fauna of Africa and the world atlarge. Concise contributions on investigations onfaunistics, zoogeography, wildlife management,genetics, animal breeding, entomology, parasitology,pest control, ecology, malacology, phytonematology,physiology, histopathology, biochemistry,bioinformatics, microbiology, pharmacy, veterinarymedicine, aquaculture, hydrobiology, fisheriesbiology, nutrition, immunology, pathology, anatomy,morphometrics, biometrics and any other researchinvolving the use of animals are invited forpublication. While the main objective is to provide aforum for papers describing the results of originalresearch, review articles are also welcomed. Articlessubmitted to the journal is peer reviewed to ensure ahigh standard.Editor:Professor F. C. OkaforAssociate Editor/SecretaryDr. Joseph E. EyoEditorial Advisory CommitteeProf. M. C. Eluwa Prof. A. O. AnyaDr. N. M. Inyang Prof. E. I. BraideDr. B. O. Mgbenka Dr. G. T. NdifonProf. Bato Okolo Dr. (Mrs.) R. S. KonyaProf. I B Igbinosa Prof. N. UmechueProf. A. A. Olatunde Prof. B. E. B. NwokeProf. O. A. Fabenro Prof. F. J. UdehProf. R. P. kingProf. A. A. AdebisiProf. E. Obiekezie Prof. W. S. RichardsProf. J. A. Adegoke Dr. W. A. MuseProf. D. N. Onah Prof. O. U. NjokuSubscription InformationAnimal Research International is published in April,August and December. One volume is issued eachyear. Subscription cost is US $200.00 a year (N1,400.00) including postage, packing and handling.Each issue of the journal is sent by surface delivery toall countries. Airmail rates are available uponrequest. Subscription orders are entered by calendaryear only (January - December) and should be sent toThe Editor, Animal Research International,Department of <strong>Zoo</strong>logy, P. O. Box 3146, University ofNigeria, Nsukka. All questions especially thoserelating to proofs, publication and reprints should bedirected to The Editor, Animal Research International,Department of <strong>Zoo</strong>logy, P. O. Box 3146, University ofNigeria, NsukkaChange of addressSubscribers should notify The Editor of any change inaddress, 90 days in advance.AdvertisementsApply to Animal Research International, Departmentof <strong>Zoo</strong>logy, P. O. Box 3146, University of Nigeria,Nsukka.Animal Research International ®Notice to ContributorsOriginal research papers, short communications andreview articles are published. Original papers shouldnot normally exceed 15 double spaced typewrittenpages including tables and figures. Shortcommunications should not normally exceed sixdouble spaced typewritten pages including tables andfigures. Manuscript in English should be submitted intriplicate including all illustrations to TheEditor/Associate Editor Animal Research International,Department of <strong>Zoo</strong>logy, P. O. Box 3146, University ofNigeria, Nsukka. Submission of research manuscriptto Animal Research International is understood toimply that it is not considered for publicationelsewhere. Animal Research International as a policywill immediately acknowledge receipt and process themanuscript for peer review. The act of submitting amanuscript to Animal Research International carrieswith it the right to publish the paper. A handlingcharge of US $ 20.00 or N500.00 per manuscriptshould be sent along with the manuscript to theEditor, Animal Research International. Publication willbe facilitated if the following suggestions are carefullyobserved:1. Manuscript should be typewritten in doublespacing on A4 paper using Microsoft Word.An electronic copy [1.44 MB floppy] shouldbe enclosed, or submit online atdivinelovejoe@yahoo.com.2. The title page should include title of thepaper, the name(s) of the author(s) andcorrespondence address (es).3. Key words of not more than 8 words shouldbe supplied.4. An abstract of not more than 5% of thelength of the article should be provided.5. Tables and figures should be kept to aminimum. Tables should be comprehensiblewithout reference to the text and numberedserially in Arabic numerals.6. Figures (graphs in Microsoft excel format,map in corel draw 10 format and pictures inphoto shop format) should becomprehensible without reference to the textand numbered serially in Arabic numerals.
7. Symbols and common abbreviations shouldbe used freely and should conform to theStyle Manual for Biological Journals; othersshould be kept to a minimum and be limitedto the tables where they can be explained infootnotes. The inventing of abbreviations isnot encouraged- if they are thoughtessential, their meaning should be spelt outat first use.8. References: Text references should give theauthor’s name with the year of publication inparentheses. If there are two authors, within thetest use ‘and’. Do not use the ampersand ‘&’.When references are made to a work by three ormore authors, the first name followed by et al.should always be used. If several papers by thesame author and from the same year are cited,a, b, c, etc., should be inserted after the yearpublication. Within parentheses, groups ofreferences should be cited in chronological order.Name/Title of all Journal and Proceeding shouldbe written in full. Reference should be listed inalphabetical order at the end of the paper in thefollowing form:EYO, J. E. (1997). Effects of in vivo Crude HumanChorionic Gonadotropin (cHCG) on Ovulationand Spawning of the African Catfish, Clariasgariepinus Burchell, 1822. Journal ofApplied Ichthyology, 13: 45-46.EYO, J. E. and MGBENKA, B. O. (1997). Methods ofFish Preservation in Rural Communities andBeyond. Pages 16-62. In: Ezenwaji, H.M.G.,Inyang, N.M. and Mgbenka B. O. (Eds.).Women in Fish Handling, Processing,Preservation, Storage and Marketing. Inomafrom January 13 -17, 1997.WILLIAM, W. D. (1983) Life inland waters. BlackwellScience, MelbourneManuscripts are copy edited for clarity, conciseness,and for conformity to journal style.ProofA marked copy of the proof will be sent to the authorwho must return the corrected proof to the Editorwith minimum delay. Major alterations to the textcannot be accepted.Page chargesA subvention of US $600.00 (N 5,000.00) is requestedper published article. The corresponding author willreceive five off-prints and a copy of the journal uponpayment of the page charges.AddressAnimal Research International, Department of<strong>Zoo</strong>logy, P. O. Box 3146, University of Nigeria,NsukkaPhone: 042-308030, 08043123344, 08054563188Website: www. zoo-<strong>unn</strong>.<strong>org</strong>Email: divinelovejoe@yahoo.comCATEGORYANNUAL SUBSCRIPTION RATETHREE NUMBERS PER VOLUMEDEVELOP-INGCOUNTRYDEVELOP-EDCOUNTRYNIGERIASTUDENT $ 200.00 $ 300.00 N1,400.00INDIVIDUALS $ 300.00 $ 350.00 N2,000.00INSTITUTION/LIBRARY$ 500.00 $ 600.00 N5,000.00COMPANIES $ 600.00 $ 750.00 N10,000.00Pay with bank draft from any of the followingbanks only. (a) Afribank (b) Citizens Bank (c)Intercontinental Bank (d) Standard Trust Bank(e) United Bank for Africa (f) Union Bank (g)Zenith Bank (h) First Bank Nig. PLC (i) WesternUnion Money Transfer.Addressed to The Editor/Associate Editor,Animal Research International, Department of<strong>Zoo</strong>logy, P. O. Box 3146, University of Nigeria,Nsukka.Alternatively, you may wish to send the bankdraft or pay cash directly to TheEditor/Associate Editor at Animal ResearchInternational Editorial Suite, 326 Jimbaz Building,University of Nigeria, Nsukka.For more details contact, The Secretary, AnimalResearch International, Department of <strong>Zoo</strong>logy,Editorial Suite Room 326, Faculty of BiologicalSciences Building (Jimbaz), University of Nigeria,Nsukka. Enugu State, Nigeria.
Influence of dietary protein content on gross protein:energy efficiency of Clarias gariepinus 213diet such as the type of dietary protein and theexperimental condition. This makes it difficult tocompare studies. The need to relate all reportsabout the dietary requirements and the nutritionalresponse studies of fish has been suggested byOgunji and Wirth (2001).Other studies (Jauncey, 1982; Wang etal., 1985; and Ogunji and Wirth, 2000) have alsoidentified the protein requirements of different fishspecies with varied results on the effect of proteinon growth rate, food conversion and bodycomposition. Variability in protein requirementscould possibly be due to the different effects of thefree amino acids supplied by the dietary proteinsand the consequent catabolism of tissue proteins.It has been reported that α-keto acids resultingfrom the catabolism of free amino acids are usedas a source of energy or carbon for fat synthesisor for glycogenesis (Kim et al., 1992). Theworkers also maintained that amino acid oxidationis principally influenced by the level of protein (oramino acid) or other energy sources in the diets.In addition, in the circulatory fluid of animalsincluding fish, most lipids form complexes withprotein (Gotto et al., 1986) in the form oflipoproteins, which are the major carriers of lipidsand other hydrophobic compounds (Ando andMori, 1993). It is therefore possible that a lack ofadequate protein may result in loss of serumlipoprotein thereby affecting the transport andstorage of lipids in C. gariepinus. Therefore, adeficiency of protein may impede physiologicalfunctions and further reiterates the need foroptimal dietary protein for effective fish rearing.This study investigated the influence of dietaryprotein content on gross efficiency of foodconversion and protein utilization of African catfish(C. gariepinus) fry and also studied other growthand nutritional parameters of the species that areaffected by dietary protein intake.MATERIAL AND METHODSExperimental Procedure: Four hundred andeighty (480) advanced fry (mean initial weight,1.60 ± 0.24 g) of C. gariepinus were randomlyallotted to 8 triplicate 25 L plastic baths at 20 fryper bath, replicated three times and allowed toacclimatize for 14 days in the Research Laboratoryof Ebonyi State University, Abakaliki, Nigeria. Thefish were fed for 56 days with eight diets, seven ofwhich were formulated to yield 28, 31, 34, 37, 40,43 and 46% crude protein content while the 8 thdiet comprised a 48.8% crude proteinmicroencapsulated whole egg diet (M). Grosscomponents of diets calculated with Pearson’ssquare method (De Silva and Anderson, 1995) isshown in Table 1. Temperature readings of waterwere taken thrice daily with a maximum andminimum thermometer while the pH was recordedwith a pH meter (model PH J – 201 L). The waterconductivity was measured with a conductivitymeter and dissolved oxygen was measured withHach test kit FF3.The fish were fed at four-hourly intervalstarting from 0800 h, at the rate of 5% (liveweight basis) of their total biomass per day inthree portions. Weekly weighing of the fish wascarried out with the aid of a Mettler balance(model P 1210) and the feed administered wasadjusted in accordance with the body weight offish. Owing to the fouling of water by faeces andother feed debris, the plastic baths were cleanedon weekly (7 days) basis and replenished withclean tap water.Analytical Procedure: The proximate compositionsof both the experimental diets and fish wereanalysed by methods described by Windham(1996). Crude protein was determined by microkjeldahl method, fat by soxhlet extraction method,fibre by the ceramic fibre filter method and ash bycombusting in muffle furnace at 600º C for 2 h.The digestible carbohydrate content was computedby obtaining the difference between the % crudeprotein + % fat + % fibre + % ash contents and100%. The amino acid concentrations of sampleswere determined by acid hydrolysis and highperformance liquid chromatography (HPLC)method as described by Ogungi and Writh (2001).Determination of Growth and NutrientParameters: The mean weight gain (MWG) offish was computed following Ishwata (1969)method. The daily rate of growth (DRG) wascalculated from the relationship between the meanincrease in weight per day and the body weight offish, thus: DRG = (mean increase in weight)/(bodyweight of fish). The daily rate of feeding (DRF)was obtained from the expression: DRF = (meanration per day)/(body weight of fish). While thegross efficiency of food conversion (GEFC) wascalculated from the relationship between the dailyrate of growth (DRG) and daily rate of feeding(DRF): GEF = DRG/DRF.The nitrogen metabolism (Nm) was derived usingthe method of Dabrowski (1977), thus:(0.549)(a + b)hNm = ,2where: a = initial weight of fish, b = final weightof fish, h = experimental duration in days.The net protein utilization (NPU) was estimatedaccording to Miller and Bender (1955) method,thus:b - No + NmNPU =,1b
MGBENKA, Bernard Obialo et al. 214Table 1: Gross composition (% dry matter) of experimental diets fed to Clarias gariepinus fryor 56 daysDiet(% crudeprotein indiet)1(28.00%)2(31.00%)3(34.00%)4(37.00%)5(40.00%)6(43.00%)7(46.00%)8(48.80%)YellowmaizeGroundnutCakeFishmealBloodmealFeed ingredientBrewers Oysterwaste shellAdvitSalt Palm1 oilBonemealEgg(M) 243.10 28.71 8.61 5.73 5.00 0.50 0.60 0.25 5.00 2.50 - 10036.70 32.97 9.89 6.59 5.00 0.50 0.60 0.25 5.00 2.50 - 10030.30 37.23 11.17 7.47 5.00 0.50 0.60 0.25 5.00 2.50 - 10029.92 41.49 12.45 8.30 5.00 0.50 0.60 0.25 5.00 2.50 - 10017.54 45.74 13.72 9.12 5.00 0.50 0.60 0.25 5.00 2.50 - 10011.14 50.03 15.03 9.95 5.00 0.50 0.60 0.25 5.00 2.50` - 1004.80 54.26 16.31 10.78 5.00 0.50 0.60 0.25 5.00 2.50 - 100- - - - - - - - - - 100 1001 Advit : Pfizer livestock feeds production supplying the following vitamins and minerals per grain of diet: A, 19823 IU; D3 , 1965I.U; B 12 , 10 g ton –1 ; Riboflavin, 41 mg; Niacin, 246 mg; Pantothenic acid, 98 mg; Folic acid, 19 mg; Manganese, 241 mg; Zinc,100 mg; Iodine, 20 mg; and Oxytetracycline hydrochloride, 20 g ton – 1 .2 M = Micro encapsulated whole egg diet.Table 2: Proximate composition of experimental diet for Clarias gariepinus fry% crudeproteindietsDrymatterCrudeproteinEtherextractProximate composition (% dry matter)Ash NFE 1 Crude ME 2 TDN 3 4 SE ME:Proteinfibre (KJ/kg)ratio(KJ/mg)28 86.57 27.86 10.24 12.96 40.93 8.01 12.98 80.44 75.36 10.2531 88.64 30.46 10.36 13.68 38.23 7.27 13.00 80.56 75.52 10.0534 90.71 33.68 10.72 14.72 33.78 7.10 13.03 80.84 75.61 9.1837 89.25 36.56 10.86 10.42 33.96 8.20 12.72 80.72 75.74 8.3040 88.92 38.68 11.24 10.68 32.33 7.07 12.59 80.96 75.60 7.6043 87.83 41.72 12.43 9.74 28.9 7.20 12.58 81.36 74.45 7.5646 91.45 43.46 13.85 9.63 26.64 7.02 12.57 81.45 72.92 7.5248.80 (M) - 48.80 43.36 - - - 89.47 - - 9.881 Nitrogen Free Extract = 100 – (% Ash + % crude fibre + % Fa t +% Protein).Metabolizable energy; 3 Total digestiblenutrient. 4 Starch equivalen t.Totalwhere: No = nitrogen content of fish before theexperiment, Nb = nitrogen content of fish after theexperiment, Nm = nitrogen metabolism, 1b =nitrogen content of experimental diet.Statistical Analysis: The analysis of variance totest for statistical difference among treatmentmeans (Steel and Torrie, 1980), and factorial andregression analyses of measured parameters weredone with the computer Statistical Package forSocial Sciences (Nie et al., 1972). Predictionequations for the growth and nutrient parameterswere derived to reflect the degree of linearrelationships (Y = a + bx) of the sets ofparameters.RESULTSThe results are shown in Tables 2 – 7. Tables 2and 3 showed the proximate compositions of theexperimental diets and the fish respectively. Table4 shows the selected amino acids composition ofthe experimental diets. The mean weight gain(MWG) of C. gariepinus fry fed the different dietsis shown in Table 5. Table 6 shows the correlationmatrix of nutrient parameters of the C. gariepinusfry. The mean water temperature was 28.0 ± 1.0ºC, the mean pH was 6.8 ± 0.1, the mean waterconductivity was 1.03 ± 0.10g S/cm and meandissolved oxygen was 5.55 ± 1.00 mg/L. Therewere relatively lower qualities of dietary proteins atthe lower CP levels (28% and 31%) (Table 2).These produced lower protein deposition in thebody of the fish fed the diets (Table 3) comparedto the higher protein deposition in fish fed thehigher dietary CP levels (37 % and 40 %).However, the fish also deposited relatively lowerprotein when fed higher CP diets of 43 % and46% than the 37% and 40% CP diets. Table 4also shows that there are satisfactory levels ofamino acids in the 37% and 40% CP levelscompared to lower CP levels. The amino acidlevels in 43% and 46% CP diets were however inmost cases higher than the lower CP levels.
MGBENKA, Bernard Obialo et al. 216Table 6: Correlation matrix of nutrient parameters of Clarias gariepinus fry fed differentdietary protein levels 1 DRG 2 DRF 3 GEFC 4 NM 5 MWG 6DRG 2 1.00 - - - -DRF 3 -0.43 1.00 - - -GEFC 4 0.12 0.18 1.00 - -NM 5 -0.13 -0.03 -0.07 1.00 -MWG 5 0.87* * -0.42 0.26 -0.17 1.001 For s t atistical signi f icance, ** = significant at 1% (P < 0.01); those figu r es without * or ** are not significantly correlated at1% (P < 0.05) or 1% (P < 0.01).Daily growth rate (g), 3 Daily rate of feeding (g), 4 Gross efficiency of food conversion (g).,5 Nitrogen metabolism, 6 Mean weight gain per week (g).Table 7: Prediction equations of nutrient parameters of Clarias gariepinus fry fed differentdietary protein levels 1DependentVariable yIndependentvariable xPredication equationy = a+ bx± S.EM r r 2 Significantlevel.Daily rate of feeding Daily rate of growth Y = 0.13 – 0.80x 0.03 0.43 0.27 n.s.NitrogenmetabolismProtein intake perweek Y = 0.47 + 13.49x 1.19 0.94 0.89 * *Gross efficiency offood conversionDaily rate of growthY = 0.02+ 2.26x 0.32 0.12 0.02 n.s.Mean weight gainper weekFeed per fish perweek Y = 0.12+ 0.08x 0.11 0.19 0.04 n.s.1 For the statistics, n.s. = not significant at 5% probability; ** = significant a t 1% probability; r = correlation coefficient; r=coefficient of determination; SEM = standard error of mean.gross efficiency of food conversion (r = 0.26), andthe nitrogen metabolism (r = 0.17) (Table 6).Whereas there was significant difference(P < 0.05) in the mean values of DRG of fish(Table 5), the mean values of DRF were notsignificantly different (P > 0.05) as the dietary CPincreased from 28 to 48.80%. For the DRG, thevalues were significantly the same from 28% to40% but significantly declined thereafter as the CPlevel approached 48.80% (P < 0.05). Both theDRF and the DRG were each not significantlycorrelated with GEFC and Nm (P > 0.05) (Table 6).While DRG was significantly correlated with MWG(P < 0.05), DRF was not significantly correlated (P> 0.05).Fish responses to the gross efficiency offood conversion (GEFC) showed no definite patternat the lower dietary CP levels (28 % to 38%)when compared to the responses at the higher CPlevels (43% to 48.8 %) where the GEFC decreasedwith the increase in dietary CP. The bestresponses of fish to GEFC was recorded between37 to 40 % CP diet (Table 5) and this wascorroborated by the higher estimates of proteincontents in the body of fish that were fed therespective diets (Table 3). The effect of theincrease in the dietary CP on GEFC wassignificantly correlated (P > 0.05) with Nm, DRF,and MWG respectively.Estimates of the nitrogen metabolism(Nm) and the net protein utilization (NPU) of fishshowed that both parameters increased as thedietary CP level increased except for the microencapsulated diet M (48.80 %), where Nm andNPU estimates were relatively low (Table 5). Theeffect of the dietary increase in CP on Nm and NPUwas significant (P < 0.05). The Nm of fish showednon-significant negative correlations with DRG,DRF, GEFC and MWG. The prediction equationsfor the growth and nutrient parameters are shownin Table 7.As expected the relatively lower qualitiesof dietary proteins at the lower CP levels (28 %and 31 %) (Table 2) produced lower proteindeposition in the body of the fish fed the diets(Table 3) compared to the higher proteindeposition in fish fed the higher dietary CP levels(37% and 40%). However, the fish depositedrelatively lower protein when fed diets of between37 % and 40 % CP levels even when the dietaryCP levels of the former were higher than those ofthe later. The fish responded more positively toweight increase (MWG) and daily growth (DRG) atthe 37 % and 40 % dietary CP levels than at the28 % and 31 % or 43 % and 48.80 % dietary CPlevels (Table 5). Nevertheless, the fish did notexhibit any definite pattern of response to theessential amino acids (EAA) profiles of theexperimental diets (Table 4) as the dietary CPlevels increased.DISCUSSIONThe increasing levels of dietary crude protein (CP)in this study seemed to affect the increase inweight and daily rate of growth of the young C.gariepinus up to 40 % CP (Table 5) but declined athigher CP level (48.80%) This result comparesfavorably with that of Faturoti et al. (1986) onjuvenile C. lazera, in which the optimum dietary
Influence of dietary protein content on gross protein:energy efficiency of Clarias gariepinus 217protein content that enhanced growth was 40%,while the micro encapsulated egg diet depressedgrowth. The 48.80 % CP in the diet used in thisstudy must have been in excess of the CP requiredby the fish to support efficient utilization ofavailable nutrients as was the case in Faturoti etal. (1986). From the present study, the relativelyhigher metabolizable energy:protein (ME:P) ratiorecorded for the 48.80% CP diet (9.88 kJ/mg) asagainst that of the 40% CP diet (7.6 kJ/mg) alsoagrees with the report of Cho (1981). The workerstipulated that a higher energy-protein ratio mayresult in inadequate protein intake and that theloss of most of the ingested nitrogen as ammoniamight retard the deposition of protein for tissueformation.Previous workers on other warm waterfishes have provided ME:P ratio that gave optimumgrowth with specified dietary protein levels.Jauncey (1982) reported an ME:P ratio of 27.81mg/kg for tilapia (Sarotherodon mossambius) fedwith 40% CP diet, while Mazid et al. (1979)estimated an ME:P ratio of 19.43 mg/kg for Tilapiazillii fed with 35% CP diet. Generally, it is obviousfrom various reports that ME:P ratio variessignificantly between fish species and withinspecies depending on the digestibility and aminoacid composition of the protein source, watertemperature (Hildalgo and Alliot, 1988) and theenvironmental parameters which affect theportioning of energy (De Silva and Anderson,1995). The lower values of DRG recorded at thehigher CP levels (43% to 48.80%) were in contrastwith the high DRG recorded at the lower CP levels(Table 5).This indicates that despite the nonsignificanteffect (P > 0.05) of the daily feedingrate (DRF) of fish among the test diets, thecontent of the diet, caused by the higher fibrecontents of some of the ingredients pronounced atthe higher CP levels. This must have also resultedin less protein being consumed for optimumgrowth. Dilution effect of bulk resulting from fibrehas been reported by Lovell (1989). The bestresponse of fish to the gross efficiency of foodconversion (GEFC) was within 37% and 40%dietary CP and this reflected the best weightincrease (MWG = 0.86 to 1.93 g); daily rate ofgrowth (DRG = 0.17 to 0.20 g) and nitrogenmetabolism (Nm = 12.62 to 13.43 g/100 g)obtained within the experimental period. The highNm and NPU (Table 5) recorded for 37 and 40%CP diets paralleled the relatively high proteincontents of the fish that were fed these diets(Table 3). It is hence obvious that the energycontent of the diets were optimum within this CPrange (37%- 40%) as to spare the protein fortissue formation. The decline in the GEFC of fishfed 43% to 48.80% diets conforms to the earlierThe decline in the GEFC of fish fed 43% to48.80% diets conforms to the earlier deductionsmade with respect to the diets. However, the netprotein utilization values for fish fed the 37 % to40 % CP diets were less than those fed at higherCP levels. This result varies from the results ofprevious worker such as Jauncey (1981) for tilapia(S. mossambicus); Ogino and Saito (1970) forcommon carp (Cyprinus carpio), and Mazid et al.(1979) for Tilapia zillii. These workers reported adecrease in NPU with increasing dietary proteinlevel. It could be that the C. gariepinus fry in thepresent study utilized protein at the higher CPlevels for other physiological processes than forprotein synthesis and growth. It is thereforeinferred that despite the apparently better utility ofprotein (NPU) by fish fed the higher CP diets,much of the ingested protein have been affectedby endogenous nitrogen losses resulting in itsunavailability for productive use by the fish.REFERENCESANDO, S. and MORI, Y. (1993). Characteristics ofSerum Lipoprotein features associatedwith Lipids level of muscle and liver fromfive species of fish. Nippon SuisanGakkaishi 59 (9): 1565 – 1571.BRETT, J. R. (1976). Scope for metabolism andgrowth of sockeye salmon,(Onyhorhynchus nerka) and some relatedenergetics. Journal of Fisheries ResearchBoard o f Canada 33: 30 7 – 313.DABROWSKI, K. (1977). Protein requirement ofcarp (Ctenopharyngodon idella Val)Aquaculture, 10: 63 – 73.CHO, C. Y. (1981) Microencapsulated egg diet forfish larvae. FAO, Rome, ItalyADCP/REP/80/11.DE SILVA, S. S. and ANDERSON, T. A (1995). Fishnutrient in aquaculture. Chapman and HallLondon. 319 pp.FATUROTI, E. O. BALOGON., A. M. and UGWU, L.L. C. (1986). Nutrient utilization andgrowth responses of Clarias, Clariaslazera fed different dietary protein levels.Nigeria Journal of Applied Fisheries andHydrobiology, 1: 41 - 45.GERKING, S. D. 1972. Influence of rate of feedingand body weights upon proteinmetabolism of bluegill sunfish.Physiological <strong>Zoo</strong>logy, 44: 1 - 14.GOTTO, G. O. POWNALL, H. J. and HAVEL, R. J.(1986). Introduction to PlasmaLipoproteins. Pages 3 - 41. In: SEGREST,J. P. and ALBERS, J. J. (Eds.). Plasmalipoproteins. Academic Press Inc. Orlando,Florida.HILDALGO, F and ALLIOT, E. (1988). Influence ofwater temperature on protein requirementand protein utilization in juvenile sea bass
MGBENKA, Bernard Obialo et al. 218(Dicentrarchus labra). Aquacultur e , 64:209 - 217.ISHWATA, N. (1969). Ecological studies on thefeeding of fishes VII. Frequency offeeding and growth. Bulletin of JapaneseSociety of Scientific Fisheries, 35: 985 -989.JAUNCEY, K, (1982). The effects of varyingdietary protein level on the growth, foodconversion, protein utilization and bodycomposition of juvenile tilapia(Sarotherodon mossambicus).Aquaculture,27: 43 - 54.KAUSHIK, S. J., DOUDET, T., MEDOLE, F.,AGUIRRE, P. and BLANK, D. (1995).Protein and energy needs for maintenanceand growth of Nile Tilapia (Oreochromisniloticus). Journal of Applied Ichthyology,11: 290 - 296.KIM, K. I., GRENSHOW, T. W, KAYES, T. B. andAMUNSO, C. H. (1992). Effects of fastingor feeding diets containing different levelsof protein and amino acid on the activitiesof the live amino acid-degrading enzymesand amino acid oxidation in rainbow trout(Onchorynchus mykis). Aquaculture,107: 89 – 105.LOVELL, T. (1989). Nutrition and feeding in fish.Van Nostrand, New York. 260 pp.MAZID, M. A., TANKA, Y., KATAYAMA, I.,RAHIMAN, M. A., SIMPSON, K. L. and CHICHESTER, O. C. (1979). Growth responsesof Tilapia zillii fingerlings fed iso-caloricdiets with variable protein levels.Aquaculture, 18: 115 -122.MILLER, B. and BENDER, A. (1955). Determinationof net utilization of protein by estimatedmethod. British Journal of Nutrition, 9:382 – 388.NEW, M. B. (1987). Feed and Feeding of Fish andShrimp – A Manual on the Preparation andPresentation of Compound Feeds forShrimp and Fish in Aquaculture.Aquaculture Development andCoordination Programme ADCP/REP/87/26. United Nations DevelopmentProgramme, FAO Rome. 275 pp.NIE, M.N., HULL, C. C. M. JENKIMS, J.G. TEIN-BRENNER, K. and BENT, D.H. (1975).Statistical package for social sciences: 2 nded. McGraw-Hill, New York. 155 pp.OGINO, C. and SAITO, K. (1970). Protein nutritionin fish 1. The utilization of dietary proteinby carp. Bulletin of Japanese Society o fScientific Fisheries, 39: 250 - 254.OGUNJI, J. O. and WIRTH, M. (2000). Effect ofdietary protein content on growth, foodconversion and body composition of tilapia(Oreochromis niloticus) fingerlings fedfishmeal diets. Journal of Aquaculture inthe Tropics , 15(4): 381 - 389.OGUNJI. J. O. and WIRTH, M. (2001). Alternativeprotein source as substitutes for fish mealin the diet of young tilapia (Oreochromisniloticus Linn.). Israeli Journal ofAquaculture, Bamidgeh, 43(1): 34 – 43.STEFFENS. W. (1989). Principles of fish nutrition.Euis Horwood, London. 384 pp.STEEL, R. G. D. and TORRIE, J. H. (1980).Principles and procedures of statistics: abiometrical approach. McGraw-Hill, NewYork, NY. 633 pp.UGWU, L. L. C., MGBENKA, B. O. NWAMBA, H. O.and ODO, B. I. (2001). NitrogenMetabolism and specific growth rate ofAfrica Catfish fry, Clarias gariepinus feddifferent dietary protein levels. Journal ofScience o f Agriculture Food Technologyand Environment, 1: 5 – 8.WANG, K TAKEUEHI, T. and WATANABE, T.(1985). Effect of dietary protein levels ongrowth of Tilapia niloticus . Bulletin ofJapanese Society of Scientific Fisheries,51: 133 – 140.WINDHAM, W. R. (1996). Animal feed. Pages 1 -38 (Chapter 4). In: C<strong>unn</strong>iff, P. (ed.).Official Methods of Analysis of Associationof Official Analytical ChemistsInternational (AOAC), 16 th edition Vol I,Gaithersburg, Maryland, USA.
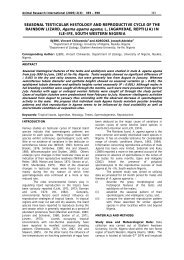
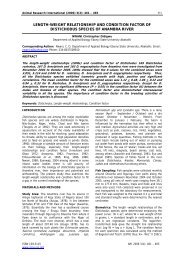
Animal Research International (2005) 2(1): 219 – 223 219THE EFFECTS OF SEASON AND DISTANCE ON THE PREVALENCE ANDINTENSITY RATES OF URINARY SCHISTOSOMIASIS IN AGULU-LAKE AREAOF ANAMBRA STATE, NIGERIAEKWUNIFE, Chinyelu AngelaDepartment of Biology, P.M.B 1734, Nwafor Orizu College of Education Nsugbe, Anambra State, NigeriaABSTRACTA survey of the effects of season, and distance to water source on the prevalence andintensity rates of Schistosoma haematobium infection in Agulu community of Anambra Statewas conducted using the primary schools in the town, using parasitological screeningapproach. Prevalence was similar in both the dry and rainy season months. Seven out of the15 Primary schools surveyed had pupils with infection. Prevalence in schools with infectionranged from 4.1- 55.2 % during the dry season to 3.3-55.6 % during the rainy season.Prevalence and geometric mean egg count were highest in the 10-14 years age group in allthe schools and in both dry and rainy seasons. Geometric mean of egg count / 10ml urine(intensity) decreased from 22.5 egg/10 ml in dry season to 10.7 egg/10 ml in wet season.Prevalence rates and intensity showed significant decrease with increase in the distance fromthe village to the lake. The implications of these are discussed.Keywords: Urinary schistosomiasis, Season, Distance, Prevalence rate, Intensity, Geometric meanINTRODUCTIONQuantitative urine examination techniques have inrecent years replaced qualitative procedures incommunity studies of schistosomiasis because ofthe useful information provided by quantization ofegg output. This is because the sensitivity of themethod could be tested and the results could beexpressed in terms that allow comparism withother studies e.g. geometric mean. The usefulnessof quantitative technique is now recognized bynational control programmes, which have achievedsignificant reduction on prevalence from double tosingle figures in large areas. The epidemiology ofS. haematobium in man has been described interm of age - specific prevalence and schoolchildren have often been studied. This is becausethey represent he age groups at greatest risk andwith greatest intensity of infections, thus providingconvenient baseline data for the whole population(Forsyth, 1969, Wilkins, 1977). Thus quantitativeurine examination using school children could helpto give useful information on the state of urinaryschistosomiasis in Agulu town during both rainyand dry season conditions. This shall help indisease control and shall allow comparison withother studies on urinary schistosomiasis fromdifferent regions.One of the important determinants of ahousehold’s choice of water source has beenreported to be distance (Blum et al 1987). Jones(1973) found the distance beyond which peoplehad negligible contact with lake Volta to be 5km.Appleton and Bruton (1979) also reported thatonly about 1/4 of the people who live within 5kmof lake Sibaya (South Africa) probably depend on itor its adjacent ponds for water and so havefrequent contact with these habitats. Theremaining 3/4’s they reported use streams or pansfor domestic purposes although some of thosepeople may have to use the lake or ponds duringwinter or dry years. There is a need for morestudies of that kind to evaluate the relationshipbetween distance to water sources in endemicareas and prevalence of schistosomiasis. Such aredeemed to be of great value in planning diseasecontrol programmes. The paper reports a study ofschistosomiasis infection in Agulu town ofAnambra State, Nigeria, where a lake implicated inthe transmission of the disease is situated.MATERIALS AND METHODThe Study Area: Agulu town (Figure 1) waspurposively selected for the study because ofprevious knowledge of the presence of S.haematobium infection in the town (Emejulu 1994,Emejulu et al, 1994). Agulu which is in AnaochaLocal Government Area is located between latitude6 o 06 / N and longitude 7 0 03 / E. Coming from theSouth, the land is generally a steep dive towardsthe lake. It enjoys tropical type of climate.Urine Collection and Analysis: Parasitologicalscreening of all the primary and attachedpreprimary school children in the 15 primaryschools in the town was carried out between 1999– 2000 in both dry and rainy seasons. Widemouthed screw cap containers with numbers foridentification were used to collect urine samplesfrom each pupil in the different schools onvisitation. Urine collection was made between10.00 and 14.00h. This is the period of greatestegg out put (Stimmel and Scott, 1956, Bradley,1963). This was done during the dry seasonmonths for 16 weeks (Nov.1999-Feb.2000) and
EKWUNIFE, Chinyelu Angela 220repeated during the rainy season months for 16weeks (May-August 2000). A simple centrifugalsedimentation procedure (5min at 5000rpm) of10ml aliquot urine drawn from each specimen wasused (Oliver and Uemura, 1973). S. haematobiumova in the sediment poured on a Macmaster slidewere counted under X10 microscope eyepiece.Calculation of geometric mean egg count wasdone using the method in WHO (1987). Distancefrom the centre of each village to the lake, thecrowflies was estimated and recorded.Data Analysis: Dry season age group InfectionRate = <strong>Number</strong> people Infection among age groupin affected school during the dry season/ Total<strong>Number</strong> of people in the age group X 100.Rainy season age group Infection Rate = <strong>Number</strong>people Infection among age group in affectedschool during the rainy season / Total <strong>Number</strong> ofpeople in the age group X 100.Total infection for each season = Total of allinfected in all school for that season / Total<strong>Number</strong> of people in all the school x 100. Agegroup GM = Geometric mean of all the infectedindividuals of an age group in all schools together.Total GM = Geometric mean of all the infectedindividuals in all the schools together. In all thecases descriptive statistics was employed toascertain the means and mean differencesbetween season and distance ascertain using t-test.RESULTSFigure 1: Map of Agulu townSeven schools out of fifteen had individuals thatexcreted S. haematobium ova during both the dryand rainy seasons (Table 1). The schools includeUmuowelle Primary School, Umuifite PrimarySchool, Umunowu Primary School, NneogidiPrimary School, Practicing Primary School, IfiteaniPrimary School and Obeagu Primary School. Fordry and rainy seasons, Umuowelle Primary Schoolrecorded the highest infection rates of 55.2% and56.6% respectively followed by Ugwuaba PrimarySchool with infection rates of 43.2% and 43.1%for both seasons. Obeagu Primary School recordedthe lowest infection rates of 4.1% and 33.3% forthe dry and rainy seasons respectively. Table 2shows that in Umuowelle Primary School, infectionrates of 29.4 %, 61.1 %, 70.1 % and 55.2 % wererecorded for 0-4, 5-9, 10-14 and 15-19 age groupsrespectively during the dry season while infectionrates of 34.1 %, 54.8 %, 73.3 % and 52.2 %respectively were recorded for same age groupsduring the rainy season. Infection rates for theother schools had similar patterns for both season.However, the geometric mean of egg count/10mlurine decreased during the rainy season for thedifferent ages in the different schools. UmuowellePrimary School recorded the geometric mean (GM)of egg output of 11.2, 29.9, 48.4 and 28.5 duringthe dry season for the age groups 0-4, 5-9, 10-14,15-19, respectively while during the rainy seasonthe GM were 8.1, 20.2, 36.4 and 29.9 for sameschool and same age groups. Overall geometricmean of egg count/10ml urine decreased from22.5 egg/10ml in dry season to 10.7 egg/10ml inwet season (Tables 2 and 3).The prevalence and intensity rate amongthe schools in Agulu with respect to distance isshown in Table 4. Agulu lake is situated at thenorthwest of the town. The infection rateincreased as one moved from south to north andfrom east to west. The number of positive cases ofurinary schistosomiasis decreased as one movedaway from the lake. Umuowelle Primary Schoolwhich is closest to the lake (200m) had the highestprevalence rate of 55.2% followed by UmuniftePrimary School at a distance of 300m which had aprevalence of 43.2%, while Obeagu PrimarySchool which is up to 2km had the lowestprevalence 4.1%. Other schools which are at adistance of 2.5km or more had 0%. Correlationanalysis confirm this to be significant (t=2.57,df=5) at 5% level. The intensity of infection alsodecreased as one moved away from the lake.Umuowelle Primary School nearest to the lake(200m) had 31.1 intensity while Obeagu PrimarySchool which is about 2km from the lake had anintensity of 8.9. The decrease in intensity ofinfection with increase in distance from the lake issignificantly correlated at 5% level (t=2.57,df=5).DISCUSSIONGenerally, Prevalence and egg output go together.The most significant association was with age.Both egg output and prevalence rose rapidly in theearly years to a peak level in the 10-14 yrs age
Prevalence and intensity rates of urinary schistosomiasis 221Table 1: Prevalence rates of urinary schistosomiasis in primary schools (P/S) in Agulu byseasonSchool Village located Dry season Rainy seasonNo.Exam.No.Infection%InfectionNo.Exam.No.Infection%InfectionAgunkwo P/S Amaorji 70 0 0 42 0 0Central ,, Odidama, Obe 200 0 0 192 0 0Chukwuka ,, Uhueme,Ukunu 241 0 0 243 0 0Community ,, Umunowu 219 76 34.7 216 74 34.3Ezeanyanwu ,, Odidama, Okpu 233 0 0 220 0 0Nwanchi ,, Nwanchi,NneohaAmaezike 110 0 0 90 0 0Obe ,, Obe 233 0 219 0 0 0Obeagu ,, Obeagu 169 7 4.1 151 5 3.3Onike ,, Okpu 140 0 0 112 0 0Practicing ,, Nkitaku, Umubiala,Okpuifite, Amatutu 532 128 24.1 506 119 23.5Udoka ,, Ukunu, Isimaigbo 189 0 0 180 0 0Ugwuaba ,, Umuifite 185 80 43.2 174 75 43.1Umuowelle ,, Umuowelle 201 111 55.2 189 105 55.6Ifiteani ,, Ifiteani 141 33 23.4 101 22 21.9Nneogidi ,, Nneogidi 186 55 29.6 172 50 29.1Total 3029 450 16.2 2807 450 16.1Table 2: Infection rate (%) and geometric mean (GM) egg count during dry and rainy seasonin the endemic villages among age groupsSchoolDry seasonRainy season0 – 4 5 – 9 10 – 14 5 – 19 0 – 4 5 – 9 10 – 14 5 – 19% GM % GM % GM % GM % GM % GM % GM % GM1. 29.4 11.2 61.1 29.9 70.1 48.4 55.2 28.5 34.1 8.0 54.8 20.2 73.3 36.4 52.2 24.92 0 0 33.8 19.4 51.2 39.9 42.4 24.5 0 0 36.5 14.0 52.5 30.3 32.3 20.23 10.0 11.5 32.4 16.9 50.0 36.7 27.5 23.5 16.7 8.2 30.0 12.4 48.7 22.5 27.5 15.54 0 0 22.9 14.7 47.1 31.5 18.8 20.2 0 0 19.1 11.2 47.0 24.2 20.0 13.75 0.7 5.0 24.1 10.7 41.3 28.0 32.0 20.0 0 0 22.4 8.2 41.6 21.7 31.9 12.96 0 0 14.3 14.7 33.3 19.4 22.2 11.0 0 0 13.3 11.0 33.3 5.2 14.3 7.07 0 0 1.9 8.3 8.9 14.8 5.3 14.0 0 0 4.2 8.0 5.9 12.2 0 01. Umuowelle Primary School 2. Ugwuaba Primary School 3. Community Primary School 4.Nneogidi Pr imary School 5 .Practicing Primary School 6 . Ifiteani Primary School 7. Obeagu Primary Schoolgroup and then declined. The infection ratesamong the various age groups in the differentschools were close for both dry and wet season.This could be due to the long life span of theworm (3 – 5 years), (Wilkins et al 1984, Fulford etal 1995), thus same infected individuals remaininfected during both seasons. However, theGeometric mean of egg output declinedremarkably in the rainy season. Though thepeople remain infected in the rainy season, thelow egg count during that period could be due to abreak in the transmission of disease during thewet season occasioned by non visit/reducedcontact with transmission sites at such times sincerain water can be collected from the home. Thiswould reduce re-infection as well as accumulatedworm load. Further, some worms may have died inthe infected individuals and because there wouldbe a reduction in rate of contact with thetransmission site, re-infection would not occur.Thus Blum et al (1987) in the study of the effectsof distance and season on the use of boreholes innortheastern Imo State, Nigeria reported that inwet season when the availability of water sourceswas much greater, rain water was the mainsources of 64% of households since it wascollected directly at home. In contrast however,McCullough and Bradley (1973) showed that eggoutput was stable in individuals for long period oftime. But then, their study was conducted inTanzania during the dry season months of 3different years. The egg out put in their studypopulation could have dropped during wet seasonand risen again during the dry season as a result
EKWUNIFE, Chinyelu Angela 222Table 3: Total seasonal infection rate and GM by ageAgeDry seasonRainy seasongroup Infection rate (%) GM Infection rate (%) GM0 – 4 6.4 6.7 8.3 2.35 – 9 26.7 16.8 26.2 10.110 – 14 44.0 31.2 44.5 21.215 – 19 30.9 20.3 28.0 12.3Total 30.0 22.5 29.6 10.7Table 4: The relationship between prevalence and intensity rates and distance of schools fromAgulu lakeGeographicalVillagesDistanceto lake (m and km)Schoolthey attend%PrevalenceIntensity(GM)locationWest Umuowelle ≤200m Umuowelle P/S 55.2 31West Umunifite .3km(300m) Ugwuaba ,, 43.2 20.9North Umunowu .45km(450m) Community ,, 34.7 20.0North Nneogidi .70km(700m) Nneogidi ,, 29.6 16.9West Umubiala 500m Practicing ,,West Amatutu 700m Practicing ,,West Okpuifite 1km(.93km) Practicing ,, 24.1 14.7West Nkitaku 1.5km Practicing ,,North Ifiteani 1.2km Ifiteani ,, 23.4 11.6South Obeagu 2km Obeagu ,, 4.1 8.9South Obe 2.5km Obe & Central , 0 0South Odidama 2.7km Central ,, 0 0East Ukunu 2.9km Udoka 0 0East Isiamaigbo 3.0km Chukwuka ,, 0 0East Amaorji 3.2km Agunkwo ,, 0 0East Uhueme 3.4km Agunkwo ,, 0 0South Nneoha 3.7km Ezeanyanwu ,, 0 0South Okpu 4.0km Ezeanyanwu ,, 0 0South Amaezike 4.2km Onike ,, 0 0South Nwanchi 4,5km Nwanchi ,, 0 0of re-infection. The high Geometric mean eggoutput recorded by Scott et al (1982) in lake VoltaGhana could also be as a result of dry season, onlyone small water contact site was recognized atAgulu lake during the rainy season. Usual sites onthe different arms were over grown by weeds andwere very bushy and lacked human activity duringthe rainy season.Prevalence and intensity of infectionsshowed a significance decrease with increasingdistance to the lake, which is the focus infection.This finding is a pointer to the important role ofdistance from focus of infection in the prevalenceof schistosomiasis in a location, which is portrayedby the fact that children who lived at aconsiderable distance from the lake had noinfection. It is also an indication of the relationshipbetween distance of water bodies fromcommunities and the extent of usage of eachwater body by the communities, pointing to thefact that communities rely on water sources whichare close to their location. Since frequency ofcontact with focus of infection diminishes withincrease in distance, prevalence of water bornedisease such as schistosomiasis would be expectedto decline with increase in distance from such fociof infection. Similarly, since the population relieson harvested rain water during the rainy season,the number of new cases or re-infected individualswould be expected to drop during the rainyseason. The findings of the present study conformto these expectations, and lend support to theobservation by Emejulu (1994) that mosthouseholds use water sources which are very closeto them and that very few use sources up to 2kmaway from home. Distance determines the timespent in collecting water and so affects traveltimes. Saving of time for other chores could beone of the reasons why the villagers resort tonearest water source. In this study however, fewpeople, who live at a distance of 1.2 km to 2 km ormore were found to be infected. This is probablybecause Agulu lake inspite of its distance fromsome villages holds sufficient attraction forchildren from such villages, and such children fromfar distance would still visit it for recreationalpurposes. Further, high temperatures in tropicalAfrica especially in the afternoon compel inhabitantof such tropical areas to look for a place to cool offand the people find such a place of comfort in thelake.The seasonal decrease on geometric meanegg output of individuals is very important in thecontext of control measures for the disease. Since
Prevalence and intensity rates of urinary schistosomiasis 223people do not go to the lake during the rainyseason, mass treatment of villagers around theschools identified with S. haematobium during therainy season would be beneficial in curtailingincidence of schistosomiasis. Such an approach willhave the effect of reducing the parasite load ofinfected numbers of the affected communities andthus reducing the chances of re-infecting the snailsin the water during the dry season. It is alsopossible that some infected snails would die duringthe lengthy period of the rainy season becauseBayne and Loker (1987) reported that infectionsignificantly reduced snail host survival ahappenstance that would further weaken thetransmission cycle and make the control measuremore effective.ACKNOWLEDGEMENTThe author wishes to thank Mr. John Emekwuluwho served as guide by taking me around both tovarious Primary schools and during the estimationof lake distance to the villages.REFERENCESAPPLETON, C. C. and BRUTON, M. N. (1979)Epidemiology of schistosmiasis in theVicinity of Lake Sibaya, with a Note onother Areas of Tonga land (Natal, SouthAfrica). Annals of Tropica l Medicine andParasitology, 73 (6): 316 – 516.BAYNE, C. J. and LOKER, E. S. (1987). Survivalwithin the Snail Host. Pages 321 – 346.In: ROLLINSON, D. and SIMPSON, J. A.(Eds). The Biology of Schistosomes fromGene to Latrines. Academic Press Ltd.London.BLUM, D., FEACHEM, R. G., HUTTY, S. R. A.,KIRKWOOD, B. R., and EMEH, R. N.(1987). The Effects of distance andseason on the use of boreholes innortheastern Imo State, Nigeria. Journalof Tropica l Medicine and Hygiene, 99: 45– 48.BRADLEY D. J. (1963). A Quantitative approach toBilharza. East African Medicine Journal, 49(5): 240 – 249.EMEJULU, C. A. (1994). Epidemiology of urinaryschistosomiasis in Agulu lake area ofAnambra State, Nigeria. MSc ThesisUniversity of Nigeria, Nsukka. 96 pp.FORSYTH, D. M. A. (1969). A longitudinal Study ofEndemic Urinary Schistosomiasis in aSmall East African Community. Bulletin ofWorld Health Organization, 40: 711 – 783.FULFORD, A. J., BUTTERWORTH, A. E., OUMA, J.H., STURROCK, R. F. (1995). A statisticalapproach to schistosome populationdynamics and estimation of the life-spanof Schistosoma mansoni in man.Parasitology, 110: 307 – 316.JONES, C. R. (1973). Health component in theVolta lake research project - Report onproject result, conclusion andrecommendations. WHO unpublishedmimeograph Document, AFR/SCHIST/27McCLUCCOUGH, F. S. and BRADLEY, D. J. (1973).Egg Output Stability and the Epidemiologyof Schistosoma heamotobuim. Part IVariation and Stability in Egg Counts.Transactions of the Royal Society ofTropical Medicine and Hygiene, 67(4): 475– 500.OLIVER, I. J, and UEMURA, K. (1973). TechniquesStatistical Methods and Recording Forms.Pages 620 – 748. In: ANS<strong>ARI</strong>, N. (Ed).Epidemiology and control ofschistosomasis. Karger Basel andUniversity Park Press, Baltimore.SCOTT, D., SENKER, K. and ENGLAND, E. C.(1982). Epidemiology of humanSchistosoma haematobium infectionaround Volta lake, Ghana (1973 – 75).Bulletin of World Health Organization, 60(1): 89 – 100.STIMMEL, C. M. and SCOTT, J. A. (1956). Theregularity of egg out put of Schistosomaheamatobuim. Texas Reports in Biologyand Medicine, 14: 440 – 458.WILKINS, H. A. (1977). Schistosoma haematobiumin a Gambian community I, The intensityand prevalence of infection. Annals o fTropical Medicine and Parasitology, 71: 53– 88.WILKINS, H. A., GOLL, P. H., Marshall, T. F. andMoore, P. J. (1984). Dynamics of S.haematobium Infection in a Gambiancommunity III, Acquisition and loss ofinfection. Transactions o f the RoyalSociety of Tropical Medicine and Hygiene,78: 227 – 232.WHO (1987). Basic Aspects of the Epidemiology ofHuman African Schistosomiasis. In:CHRISTENSEN. N. and FURU, P. (Eds).World Health Organization, CollaboratingCentre, Danish.
Animal Research International (2005) 2(1): 224 – 226 224THE EFFECT OF TRANSPORTATION STRESS ON HAEMATOCRIT LEVEL OFOreochromis niloticus LINNAEUSORJI, Raphael Christopher AgamadodaigweDepartment of Fisheries, Michael Okpara University of Agriculture, Umudike, Abia State, NigeriaABSTRACTTransportation stress was investigated in Oreochromis niloticus (Linnaeus) by transportingsamples in open rectangular iron tanks from Panyam fish farm, Plateau State of Nigeria toUniversi ty of Jos , Nigeria. All fish appeared more stressed with higher densities and increasingmedia salt employed in transportation. There was a significant difference between meanhaematocrit values of control (before transportation) and those of low, medium and highdensities (p < 0.05). Transportation under different saline concentrations showed significantdifference between means haematocrit value of control and varying media saline levels (p
Effect of transportation stress on Oreochromis niloticus haematocrit level 225Table 1: Mean haematocrit values of O. niloticus transported under different densitiesTreatment Mean total length (cm) Mean heamatocrit value (%)Control 12.00 ± 1.2 32.82 ± 1.5Low Density (40 fry/96) 11.35 ± 2.44 22.00 ± 2.69Medium density (40 fry/72) 11.22 ± 0.88 19.97 ± 2.84High Density (40 fry/48) 11.30 ± 2.70 15.45 ± 2.97Table 2: Mean haematocrit values of O. niloticus transported under different salineconcentrations, with and without aerationTreatment Mean total length (cm) Mean heamatocrit value (%)Control 12.29 ± 0.77 32.80 ± 1.200% Saline + 0 2 12.28 ± 1.43 28.90 ± 2.340.Saline + 0 2 13.17 ± 1.56 28.90 ± 2.911% Saline + 0 2 13.10 ± 1.46 31.90 ± 1.900% Saline - 0 2 12.81 ± 1.80 24.81 ± 1.900.6% Saline + 0 2 15.10 ± 1.56 25.50 ± 2.101% saline - 0 2 12.20 ± 1.21 26.20 ± 3.02Table 3: Instant and delayed mortalities ofO. niloticus transported under differentsaline concentrations with and withoutaerationsDate No %Treatmentsmortality1 st Day 8 8.8 0 Saline without 0 2“ 5 5.5 1 Saline without 0 2“ 3 3.3 0.6 Saline without 0 22 nd Day 17 18.8 1 Saline without 0 2“ 19 21.1 0 Saline without 0 2“ 7 7.7 0.6 Saline without 0 23 rd Day 2 2.2 0 Saline without 0 2“ 1 1.1 0.6 Saline without 0 2“ 1 1.1 1 Saline without 0 2Transportation under Different Densities: Thefollowing densities of Tilapia fry were maintainedper group (A-C).A – 40 fry per 48L, for high density; B – 40 fry per72L, for medium density and C – 40 fry per 96L forlow density, each group was replicated thrice.Transportation under Different SalineConditions: Sodium chloride (NaCl) levels of0.6% (25.29g/72L) 1% (113.22g/72L) and 0%(water without addition of saline) were obtainedby preparing slurry of the appropriate weights ofsalt in 200 mls of water thus,A – 40 fry in 0% saline (water without saline); B –40 fry in 0.6% saline and C – 40 fry in 1% saline.Blood Haematocrit Value: Blood was collectedinto heparinized micro haematocrit tubes from asevered caudal peduncle vessel, centrifuged understandard conditions at 2500 rpm for five minutes.The packed red blood cell volume was measureddirectly and expressed as percentage of the totalblood volume with a microhaematocrit meteraccording to Wedemeyer and Yasutake (1977).Determination of Dissolved Oxygen: Watersamples were collected with sampling bottles andanalysed for dissolved oxygen (DO), using HachFish Farmer’s water quality test kit (Model FFIA).Two way analysis of variance (ANOVA) wasemployed to test the significant levels of deviationmeans from control values. The analysis ofvariance was extended by use of LSD Test, forevaluating treatment means.RESULTSTransportation of O. niloticus under differentdensities (Table 1) showed that there wassignificant differences between the control meanand those of low, medium, and high densities(P
ORJI, Raphael Christopher Agamadodaigwe 226Mortality was high during the first day,increasing on the second day and decreased onthe third day, after transportation (Table 3).During pilot transportations, there was drasticreduction of dissolved oxygen content of the watersamples from 10.99mls per litre to 2.4 mls per litreand from 7.62 mls per litre to 2.69 mls per litrerespectively on two transportations. This drasticreduction in dissolved oxygen (DO) necessitatedthe use of aerator in subsequent transportations,which yielded better results in terms of higherhaematocrit value and lower mortality.DISCUSSIONThe overall results obtained so far on thephysiological indices of stress reveal thattransportation of Oreochromis niloticus let todecreased haematocrit. This decrease in the valueof haematocrit caused by stress conforms toresults obtained by (Soivio and Oikari 1976,Madden 1977, Hattingh 1976, Nomura andKawatsum 1977 and Sikoki, et al 1989), butdiffered from that of (Casillas and Smith 1977).The later observed an increase in haematocritvalue of fish when stressed. A possibleexplanation of this variation could be thathaematocrit value increases within the first 20-30minutes after stress inducement and later starts todecrease. This proposition is based on the factthat Casillas and Smith sampled their fish bloodwithin 20 minutes after stress inducement.Alternatively, it could be argued that Casillas andSmith sampled their fish blood in an aerobicenvironment. Since (Soivio and Nybols 1973)stated that haematocrit of Rainbow trout could bechanged invitro by placing the blood in an aerobicor anaerobic environments. An anaerobicenvironment could cause a decline of greater than10% of the original haematocrit value, whereas anaerobic condition could cause an increase of10-30% and this was the range recorded by Casillasand Smith. Be that as it may, it will be useful tocarry out a time-course study of the pattern of thehaematocrit stress response under varying mediaconditions in fish.REFERENCESBERKA, R. (1986). The transportation of live fish, areview, Fisheries Research Institute,Scientific information centre. EIFACTechnical Paper, 48: 1 – 48.CARMICHAEL, G. J. (1984). Long distant trucktransport of intensively reared largemonth bass. Progressive Fish Culturist,46(2): 111 – 115.CASILLAS, E. and SMITH, A. (1977). Effects ofstress on blood coagulation andhaematology in rainbow trout, Salmogairdneri. Journal of Fish Biology, 10: 481– 487.HATTINGH, J. (1976). Blood sugar as an indicatorof stress in fresh water Fish - Labeocapensis. Journal of Fish Biology, 10: 191– 195.MADDEN, J. A. (1976). Use of electroanaesthesiawith fresh water teleosts: somephysiological consequences in Salmogairdneri. Journal of Fish Biology, 9: 451 –467.MC-CRAREN, J. P. (1978). Manual o f fish culture –fish transportation. United State Fish andWild Life Services. pp 12 – 15.NOMURA, J. and KAWATSU, N. (1977). Variation ofhaematocrit value of rainbow trout bloodsamples incubated under differentconditions. Aquatic Society and FishAbstract, 43(3): 301 – 306.ORJI, R. C .A. (1998). Effect of transportation stresson hepatic glycogen of Oreochromisniloticus. Naga ICLARM, 21(3): 20 – 22.ORJI, R. C. A. (2003). Effect of transportation stresson interregnal cell nuclear size ofOreochromis niloticus, Journal o f Innovationof Life Science, 7: 32 – 36.SHARP, C. S., THOMSON, D. A., BLANKERSHIP, H. L.and SHRECK, C. B. (1998). Effect of routinetagging and handling procedures onphysiological stress responses in juvenileChinook salmon. Progressive Fish Culturist,60(2): 81 – 87.SHRECK, C. B. and LORZ, N. W. (1978). Stressresponse of coho salmon elicited byCadmium and Copper and potential use ofcortisol as an indicator of stress. Journal o fFishery Research Board Canada, 35: 1124 –1129.SOIVIO, A. and NYHLOS, K. (1973). Notes onrainbow trout – Salmo gaidneri. Aquaculture,2: 31 – 35.SOIVIO, A. and OIK<strong>ARI</strong>, A. (1976). Haematologicaleffects of handling stress on Esox lucius.Journal of Fish Biology, 8: 397 – 411.SIKOKI, F. D., CIROMA, A. I. and EJIKE, C. (1989).Haematological changes in Clariasgariepinus, following exposure to sub lethalconcentrations of Zinc, lead and Cadmium.Pages xx - zz. In: ONYIA, A. D and ASALA,G. N. (ed). Proceedings of the 7th AnnualConference of Fisheries Society of Nigeria,FISON, Bukuru, Nigeria. Held November 13– 17, 1989.SPECKER, J. L. and SHRECK, C. B. (1979).Anaesthetic and cortisol concentration inyearling Chinook salmon. Journal o f FisheryResearch Board Canada, 29: 178 – 183.WEDEMEYER, G. A. and YASUTAKE, W. T. (1977).Clinical methods for the assessment of theeffects of environmental stress on fishhealth. Pages 11 – 18. In: Technical Paperof the United States Fish and WildlifeServices, Washington D. C.
Animal Research International (2005) 2(1): 227 – 230 227EFFECTS OF PALM OIL ON SOME OXIDATIVE INDICES OF ALLOXANINDUCED DIABETIC RABBITSOGUGUA Victor Nwadiogbu and IKEJIAKU Chukwuemeka AfamDepartment of Biochemistry, University of Nigeria, Nsukka NigeriaCorresponding Author: Dr. OGUGUA V. N. Department of Biochemistry, University of Nigeria, NsukkaNigeriaABSTRACTThe effects of palm oil on oxidative indices of alloxan induced diabetic rabbits wereinvestigated. The result obtained showed that palm oil significantly decreased (P < 0.05), lipidperoxidation in diabetic treated animals. The vitamin C (antioxidant vitamin) level increasedsignif icantly (P < 0. 05) in the supplemented group but decreased signif icantly (P < 0.05) innon supplemented group. The glucose levels in both the diabetic supplemented group and nonsupplemented group were not significantly diff erent (P > 0. 05). The results indicate that palmoil supplementation decreased the level of lipid peroxidation but increased the level o fvitamin C, an indication that palm oil can attenuate oxidative stress generated in diabeticcondition. This result may suggest that supplementation of palm oil may be effective in themanagement of diabetes mellitus.Keywords: Red palm oil, Diabetes mellitus, Antioxidant, Oxidative stress, Lipid peroxidationINTRODUCTIONThe pathogenesis of many diseases involve freeradical – mediated lipid peroxidation of biologicalmembrane (Eze, et al., 1993; Eze, 1992; Ogugua,2000) Diabetes mellitus and its complications havebeen associated with oxidative stress (Okamoto,1981; Ogugua, 2000). It is reported that theoxidative destruction of the islets of Langerham ofthe pancreas by alloxan leads to diabetes mellitusand is free radical-mediated (Ofordile, 1987;Aruoma, et al., 1991; Ogugua, 2000; Galluzzo, etal., 1990). Membranes are prone to oxidation byreactive oxygen species (ROS) and because of thedevastating complications and health hazardassociated with diabetes mellitus, its managementhas continued to occupy researches in bothmedicine and related discipline (Eze, 1992;Ogugua, 2000; Aruoma, et al., 1991)Diabetes mellitus can only be managed orprevented but not cured. The role of antioxidantnutrients for the management of various diseasesassociated with oxidative stress has been welldocumented (Halliwell, et al., 1992, Gutheridge,1994.) Vitamins A, C, E and B carotene have beenfound useful (Muma, 1994; Ogugua, 1994;Gutheridge, 1994). Thus adequate dietary intakeof vitamin E, a major lipid soluble inhibitor ofperoxidation may be important in inhibiting thedevelopment of disease conditions includingdiabetes mellitus. Palm oil has been found tocontain a lot of vitamin E and other lipid solublevitamin nutrients (Atroshi, et al., 1992; Choo, etal., 1992; Packer, 1992; Gutheridge, 1994).Since this vegetable oil is very common,affordable and used by majority of people acrossthe globe especially in the tropics, its use asantidote to prevent some oxidative stress relateddiseases and complications is advocated. Asreported else where (Choo, et al., 1992; Atroshi, etal., 1992) that palm oil contains mainly vitamin E,a major chain-breaking antioxidant in themembrane, it is the thrust of this work to studythe effects of palm oil supplementation on someoxidative indices in alloxan induced diabeticrabbits. The outcome of the work may becomeuseful in the management of human diabetics.MATERIALS AND METHODSPalm oil was bought from Nsukka local market andused for the experiment. Twelve albino rabbitsweighing (2.5 kg on the average) were boughtfrom Chigbo rabbitary Research Centre AwkaAnambra State, Nigeria. The animals were kept fortwo weeks in laboratory to acclimatize with theenvironment. They were grouped into threegroups of four rabbits each namely group 1(normal rabbits), group 2 (diabetic rabbits but nottreated with palm oil) and group 3 (diabetic rabbitsbut treated with palm oil). Diabetes was inducedby administration of alloxan at 180 mg/kg bodyweight. The test diabetic animals (group 3) weregiven 5 ml of palm oil orally twice a day for twoweeks. Blood samples were collected from the earveins of the animals for the assay.Malondialdehyde (MDA) level wasestimated by the method of Albro et al (1986) andDas et al (1990). The thiobarbituric acid procedureemploys the reaction of thiobarbituric acid withmalondialdehyde to form a red chromogen whichabsorbs at 532nm. The concentration is
OGUGUA Victor Nwadiogbu and IKEJIAKU Chukwuemeka Afam228proportional to the level of peroxidation. VitaminC level was determined by the method of Tietz(1970). This involves the oxidation of ascorbicacid (vitamin C) in the presence of combinedcolour reagent. The hydrozone resulting from thisprocedure dissolves in strong sulfuric acid solutionto produce a red complex which absorbs at 500nm. Glucose level was estimated according to 0-Toluidine method of Cooper & McDaniel (1970) inwhich the glucose in the sample when heated withO-Toluidine regent gives a blue-green colouration,the intensity of which is proportional to glucoseconcentration.The results were analysed using analysisof variance (ANOVA) and expressed as mean ± SD.RESULTS AND DISCUSSIONTable 1 shows that glucose level increased indiabetic condition (DNT group 2) compared withboth the normal rabbits (group 1) and rabbitssupplemented with palm oil. It was observed thatpalm oil slightly decreased glucose level in group 3(DT).That glucose levels increase in diabeticcondition has been variously reported (Hamme, etal., 1991; Takuncu, et al., 1998; Sharpe, et al.,1998). Also, increase in glucose level has recentlybeen associated with oxidative stress (Atkinsonand Maclaren, 1990; Yadar, et al., 1997; Ogugua2000). Thus, the increased glucose level in group2 (diabetic not treated group) is a result of intrinsicoxidative stress in diabetic condition. The slightreduction in the glucose level which was notsignificantly different (P > 0.05) is a n indicationthat palm oil contains antioxidant which possiblycountered oxidative stress in the animals. Earlierreports (Atroshi, et al., 1992; Choo, et al., 1992)show that palm oil contains other antioxidantvitamins – A and B carotene besides high level ofvitamin E and, these might have actedsynergistically, to reduce blood glucose. Thisobservation lay credence to the report of Chung etal (1992) that these nutrients played protectiveroles against oxidative stress in alloxan induceddiabetic rats. The very slight increase in glucoselevel in the normal group as experimentprogressed could be due to increased oxidativestress resulting possibly from repetitive bleeding.These inferences corroborate a stipulation by Reyand Besedovsky (1989) that repetitive bleedingincreases oxidative stress and glucose level.Malondialdehyde (MDA) level increased indiabetic rabbits (group 2) compared with thenormal. This increase is significant (P < 0.05).Diabetic condition has been linked with oxidativestress (Elhadd, et al., 1999), and increased lipidperoxidation product (Ogugua, 2000), expressedas malondiadehyde level (MDA). Thus, the highlevel of MDA in group 2 – diabetic not treatedrabbits – could be explained on the basis ofoxidative stress mediated lipid peroxidation whilethe reduction in the level in group 3 (diabeticsupplemented group) could be a result of theantioxidant property of palm oil. This property isconferred to palm oil by its possession of high levelof a-tocopherol and other antioxidant vitamin(Packer, 1992; Atroshi, et al., 1992).Table 1: Effect of red palm oil on bloodglucose, lipid peroxidation and vitamin Clevels during the experimentGroup Glucose level mmol/L1 8.10 ± 0.306.40 ± 0.40 a ,7.66 ± 0.46 b231231213.68 ± 0.48*6.48 ± 0.28 a , 12.50 ± 0.35 b12.56 ± 0.36*6.65 ± 0.52 a , 14.20 ± 0.60 bLipid peroxidation levelmmol/ml plasma7.90 ± 0.2213.73 ± 0.41**9.95 ± 0.20**Vitamin C level mg/100m0.83 ± 0.180.62 ± 0.11**3 0.69 ± 0.13**Group 1 is the normal rabbits (non diabetic), Group 2 isdiabetic rabbits not supplemented with palm oil, Group 3 isthe diabetic rabbits supplemented with palm oil, a indicatesbasal blood glucose level b indicates blood glucose beforetreatment, *p> 0.05, **p
Palm oil effects on some oxidative indices of diabetic rabbits229system. It could be that vitamin E being helped byother antioxidant components in the palm oilprevented the generation of free radicals andsubsequent oxidation. Similar synergistic action ofantioxidant nutrient has been reported (Chiu, etal., 1982).The work in essence shows that palm oilcontains some nutrients possibly antioxidantscapable of suppressing oxidative stress. Researchelsewhere suggests that vitamin E is a majoringredient. The work thus suggests that palm oilmay be a good antioxidative nutrient as itssupplementation decreased lipid peroxidation butincreased vitamin C level. The effect on glucoselevel was not pronounced, suggesting that theeffect could be more on the complications ofdiabetes.In conclusion palm oil may help toattenuate diabetes mellitus and possibly diabetescomplications. Its use may then be suggested inthe management of diabetic condition and indiseases associated with oxidative stress.REFERENCESALBRO, P. W. CORBETT, J. T. and SCHROEDER, J.L. (1986). Application of the thiobarturicassay to the measurement of lipidperoxidation products in microsomes.Journal of Biochemistry. 261: 4889 –4894.ARUOMA, O. I., KAUR, H. and HALLIWELL, B.(1991). Oxygen free radicals and humandisease. Journal of Royal Society Health,8: 172 – 177.ATKINSON, M. A. and MODOREN, N. K. (1990).What causes Diabetes? ScientificAmerican, July: 42 – 47.ATROSHI, F., ANTILA, E., SANK<strong>ARI</strong>, S.,TREUTHARAT, J., GAPOR, A., SALONIEMI,H. and WEITER M. T. (1992). Palm oilvitamin effects in hypercholesterolemia.Pages 243 – 254. In: ONG, A. S. H. andPACKER, L. (Eds.). Lipid solubleantioxidants: biochemistry clinicalapplication. Birkhauser Verg, Boston.BETHESDA, M. D. (1991). Guidelines for thediagnosis and management of Asthma.National Institute of Health, USDepartment of Health and HumanServices Publications, 91: 30 – 31.CHOO, Y. M., YAP, S. C., OOI, C. K., ONG, A. S. H.and GOLE, S. H. (1992). Production ofpalm oil carotenoid concentrate and itspotential application in nutrition. Pages243 – 254. In: ONG, A. S. H. and PACKER,L. (Eds.). Lipid soluble antioxidants:biochemistry and clinical applications.Birkhauser Verg Boston.CHIU, D., VICHINSKY, E. Y. M., KLEMAN, K. andLUBIN, B. (1982). Peroxidation of vitaminE and sickle cell anaemia. Annals of NewYork Academy of Sciences, 239: 323 –335.CHUNG, Y. M. I., CHIU, P. M. M. and WONG, H. L.(1992). Modification of alloxan diabetes inrats by vitamin A status. Pages 265 – 273.In: ONG, A. S. H. and PACKER, L. (Eds.).Lipid soluble antioxidants: biochemistryclinical application. Birkhauser Verg,Boston.COOPER, G.R. and McDANIEL, V. (1970). Assaymethods. Pages 159 – 170. In:McDONALD, R. P. (Ed.). Standardmethods for clinical chemistry. John Wileyand Sons, New York.DAS, B. S. THURNHAM, D. I. PATNACK, J. K. DAS,D. B. SATPATHY, R., and BASE, T. K.(1990). Increased plasma lipidperoxidation in riboflavin deficient malaria– infected children. American JournalClinical Nutrition, 51: 859 – 863.DAS, B. S. and THURNHAM, D. I. (1992). Plasmalipid peroxidation in Plasmodiumfalciparium malaria. Pages 397 – 405. In:ONG, A. S. H. and PACKER, L. (Eds.).Lipid soluble antioxidants: biochemistryclinical application. Birkhauser Verg,Boston.ELHADD, T. A., KHAN, F., KIRK, G., MCLAREN, M.and NEWTON, R. W. (1999). Influence ofpoverty on endothelial dysfunction andoxidative stress in young patients withtype 1 diabetes. Diabetes Care, 21: 1990– 1996.EZE, M. O. (1991). Production of superoxide bymacrophages from Plasmodium chandandiinfected mice. Cytobios, 66: 93 – 104.EZE, M. O. (1992). Membrane fluidity, ROS andCell mediated immunity; implications innutrition and disease. MedicalHypotheses, 37: 220 – 224.FREI, B. (1991). Ascorbic acid protects lipid inhuman plasma and low density lipoproteinagainst oxidative damage AmericanJournal Clinical Nutrition, 54: 1113 –1118.GALLUZZO, A. GIORDANO, C. and BOMPIANA, G.D. (1990). Cell-mediated immunity indiabetic pregnancy. Pages 273 – 278. In:Immunology of normal and diabeticpregnancy. John Wiley and Sons NewYork.GUTHERIDGE, J. M. C. (1994). Reactivity ofhydroxyl and hydroxyl – like radicaldiscriminated by release of TBARS fromdeoxysitrose, dudeosides and Beuroate.Biochemistry, 224: 761 – 767.
OGUGUA Victor Nwadiogbu and IKEJIAKU Chukwuemeka Afam230HAMME, H. R. MARTINS, S. FEDERLIN, K.,GEISEN, K. and BROWNEE, M. (1991).Aminoguanidine treatment inhibits thedevelopment of experimental diabetesretinopathy. Proceedings of NationalAcademy o f Sciences, 88: 11555 – 11558.JACOBSON, J. M., MICHAEL, J. R., JAFRI M. H. andCUISTNER, G. H. (1990). Antioxidants andantioxidant enzymes protects againstpulmonary oxygen toxicity in the rabbit.Journal Applied Physiology, 68: 1252 –1259.MUMA, A. F. (1994). Lipid peroxidation in malariapatients. MSc Dissertations, Departmentof Biochemistry University of Nigeria,Nsukka. 145 pp.OFORDILE, P. M. (1987). Possible interaction ofexperimental diabetes with environmentaltoxins, biochemical and histopattiologicalevaluations. MSc Dissertation, Universityof Nigeria, Nsukka. 108 pp.OGUGUA, V. N. (1994). Lipid peroxidation andantioxidant status in sicklers carriers andnormal individuals. MSc Dissertation,Department of Biochemistry, University ofNigeria, Nsukka. 128 pp.OGUGUA, V. N. (2000). Assessment of someparameters o f oxidative stress in alloxaninduced diabetic rabbits. PhD Thesis,Department of Biochemistry, University ofNigeria, Nsukka. 205 pp.OKAMOTO, H. (1981). Molecular basis ofexperimental diabetes degeneration,oncogenesis and regeneration ofpancreatic Islets of Langerhams. Bioassay,2: 15 – 21.PACKER, L. (1992). New horizons in vitamin Eresearch – the vitamin E cycle,biochemistry, and clinical applications.Pages 1 – 16. In: ONG, A. S. H. andPACKER, L. (Eds.). Lipid solubleantioxidants: biochemistry and clinicalapplications. Birkhauser Verg, Boston.REY, A. D. and BESEDORSKY, H. (1989).Antidiabetic effects of interlukin.Proceedings of National Academy ofSciences, 86: 5943 – 5947.SHARPE, P. C., YUE, K. K. M., CATTERWOOD, M.A., McMARTER, D. and TRIBBLE, E. R.(1998). The effects of glucose inducedoxidative stress on growth andextracellular matrix gene expression ofvascular smooth muscle cells.Diabetologia, 41: 1210 – 1219.TAKUNCU, N. B., BCYRAKTAR, M. and VARLI, K.(1998). Reversal of defective nerveconductions with vitamin Esupplementation in type II diabetes.Diabetes Care, 21: 1915 – 1918.TIETZ, N. N. (1970). Carbohydrate. Pages 174 –176. In: Sauders, W. B. (Ed).Fundamental of Clinical Chemistry. W. B.Sauders Company, London.YADAR, P., SARKAR, S. and BHATNAGARD, D.(1997). Action of Capparis deciduasagainst alloxan induced oxidative stressand diabetes in rat tissue. PharmacologyResearch, 36(3): 221 – 228.
Animal Research International (2005) 2(1): 231 – 234 231EFFECT OF EXPOSURE TO SUBLETHAL CONCENTRATIONS OF GAMMALIN20 AND ACTELLIC 25 EC ON THE LIVER AND SERUM LACTATEDEHYDROGENASE ACTIVITY IN THE FISH Clarias albopunctatusOLUAH, Ndubuisi Stanley, EZIGBO, Joseph Chukwura and ANYA, Nnenna CatherineFisheries and Hydrobiology Research Unit, Department of <strong>Zoo</strong>logy, University of Nigeria, NsukkaCorresponding Author: OLUAH, N. S. Fisheries and Hydrobiology Research Unit, Department of <strong>Zoo</strong>logy,University of Nigeria, NsukkaABSTRACTOne hundred and eighty adult Clarias albopunctatus (mean weight 160±2.7g) were subjectedto sublethal concentrations of Gammalin 20 and Actellic 25 EC (0, 0.3;and 1.0 µg/l) in a staticbioassay renewal system for 18 days. The changes in the activities of the liver and serumlactate dehydrogenase (LDH) during the period of exposure were studied. The exposure of C.albopunctatus to these pesticides evoked significant increase (P< 0.05) in both the liver andserum LDH activities. There was a progressive increase in both the liver and serum LDHactivities following exposure to the pesticides. When compared with the control, the LDHactivities were significantly higher (p < 0.05) in the treatment groups. The LDH activities inboth the liver and the serum were higher in the fish exposed to Gammalin 20 than in the fishtreated with similar concentrations of Actellic 25 EC. The serum LDH activity in the groupexposed to a mixture of 0.3µg/l of Gammalin 20 and Actellic 25 EC was significantly higherthe activities in the fish exposed the either 0.3 µg/l Gammalin 20 or Actellic 25 EC. Theseobservations suggest that these pesticides affect the energy metabolism of the fish.Keywords: Clarias, Liver, Serum, Lactate dehydrogenase, Gammalin 20, Actellic 25 ECINTRODUCTIONActellic 25 EC is an <strong>org</strong>anophosphorous pesticidealso known as Primiphos-methyl. It is a broadspectrumpesticide against stored product pests(Worthing and Hance, 1991). On the other hand,Gammalin 20, a widely applied pesticide in Nigeria,is an <strong>org</strong>anochloride pesticide containing 20 %lindane. The application of pesticides, either foragricultural purposes or for the control of pests ofpublic health interests, contaminates theenvironment or hence endangers the non-target<strong>org</strong>anisms in both terrestrial and aquatic habitats.The value of tissue enzyme activities inthe diagnosis of the effects of pollutants is one ofthe emerging areas of interest in aquatictoxicology, monitoring and remediationprogrammes. Thirugnam and F<strong>org</strong>ash (1977)studied the anticholinesterase effect of chlorpyrifosto the fish Fundulus heteroclistis. Increasedglucose-6-phosphatase and glycogenphosphorylase activities were observed in Cyprinuscarpio exposed to paraquat (Simon et al., 1983).Also, Rashatwar and Ilyas (1983), noted thatBasalin, a herbicide affected the activities oflactate dehydrogenase, alkaline phosphatase aswell as glutamic pyruvate transaminase in thefreshwater fish Nemachelinus sp. Increasedactivities of alanine and aspartateaminotransferases were reported in Claraisalbopunctatus exposed to copper (Oluah andAmalu, 1998), zinc and mercury (Oluah, 1999).Verma et al. (1981) observed that pesticidesinhibited alkaline phosphatase and glucose-6-phosphatase activities in the fish Mytulus vittatus.The purpose of this study was toinvestigate the effect of the pesticides - Actellic 25EC and Gammalin 20, widely used in Nigeria, onthe activities of liver and serum lactatedehydrogenases in the catfish, Clariasalbopunctatus.MATERIALS AND METHODSThe one hundred and eighty fish (mean weight110 ± 2.6 g) used in the study was collected fromAnambra River at Otuocha, Anambra East LocalGovernment Area of Nigeria. The fish wastransported to our laboratory in a plastic containerand was acclimatized for two weeks in plasticaquaria before the commencement of the study.The fish were divided randomly into six(6) groups (1 – 6) of 30 fish per group. Eachgroup was further divided into three replicategroups of 10 fish per replicate. The fish in group Iwere exposed to tap water only as the controlwhile the fish in groups 2 and 3 were treated with0.3 µg/l and 1.0 µg/l of Actellic 25 EC,respectively. Groups 4 and 5 were exposed to 0.3µg/l and 1.0 µg/l Gammalin 20, respectively. The6 th group was exposed to a mixture of equalconcentrations (0.3 µg/l) of Actellic 25 EC and
OLUAH, Ndubuisi Stanley et al. 232Gammalin 20.The fish were exposed to thesesublethal concentrations of the pesticide in arenewal bioassay system in which the water andthe pesticides were changed every two days tomaintain the toxicant concentrations. The fishwere fed 30 % crude protein diet at 3% bodyweight daily at 8.00 h. The Experiment lasted for18 days and the lactate dehydrogenase activitywas assayed every six days.Tissue Collection and Enzyme Assay: Theblood samples were collected by both the cardiacpuncture method and the severance of the caudalpeduncle using the disposable hypodermic syringe(Oluah, 1999). The liver was excised and washedin distilled water to remove traces of blood. Theliver samples were macerated and homogenized asdescribed by Devi et al. (1993). The liver washomogenized in ice-cold 0.25 M sucrose. The liverhomogenate was centrifuged at 5000 rpm for 15minutes at 4 o C.The blood was similarly centrifugedfor 15 minutes at 1000 rpm to obtain the serum.The liver supernatant and serum were used for thelactate dehydrogenase (LDH) assay. The lactatedehydrogenase activity was calorimetricallydetermined at 445 nm using Sigma protocolnumber 500 (Sigma Chemical Company, St Louis,MO). The data from the replicate experimentswere averaged and the mean (± SD) presented.The analysis of variance (ANOVA) was used toanalyze the data for statistical significance (P
Effect of Gammalin 20 and Actellic 25 EC on lactate dehydrogenase activity of fish 233Table 1: Changes in the concentrations of liver lactate dehydrogenase of C. albopunctatusexposed to varying concentrations of Actellic 25 EC and Gammalin 20PesticideConcentration (µg/l)Duration of Exposure (days)6 12 18Enzyme concentration (U/mg)Control 0 49.21 ± 2.0 98.42 ± 1.6 98.42 ± 1.6Actellic 25 EC 0.3 98.42 ± 1.06 196.84 ± 2.0 319.87 ± 1.12Actellic 25 EC 1.0 246.05 ± 1.08 275.58 ± 1.1 442.89 ± 1.22Gammalin 20 0.3 147.63 ± 1.15 275.58 ± 1.3 393.68 ± 2.04Gammalin 20 1.0 246.06 ± 1.10 344.47 ± 1.7 738.15 ± 1.44Actellic 25 EC andGammalin 20 0.3/0.3 98.42 ± 1.6 113.18 ± 1.1 442.89 ± 1.06Values= (mean ± sd) of LDH activity in each group for 3 determinationsTable 2: Changes in the concentrations of the serum lactate dehydrogenase of C.albopunctatus exposed to varying concentrations of Actellic 25 EC and Gammalin 20PesticideConcentration (µg/l)Duration of Exposure (days)6 12 18Enzyme Concentration (U/l)Control 0.0 26.61 ± 2.4 24.6 ± 1.8 24.61 ± 2.8Actellic 25 EC 0.3 49.21 ± 1.36 96.42 ± 2.6 124.61 ± 1.8Actellic 25 EC 1.0 123.03 ± 2.12 196.84 ± 1.5 246.05 ± 3.04Gammalin 20 0.3 113.18 ± 1.76 147.63 ± 1.2 196.84 ± 2.8Gammalin 20 1.0 147.63 ± 1.8 240.05 ± 2.0 270.66 ± 1.06Actellic 25 EC andGammalin 20 0.3/0.3 260.81 ± 2.03 344.47 ± 1.8 590.52 ± 1.2Values= (mean ± sd) LDH activity in each group for 3 determinations(1985) reported that cadmium inhibited LDHactivity in the heart, liver and gills but not in theserum of the fish Mugil cephalus. Reduced LDHactivity was also observed in the hepatopancreasof the crab Uca pugilator (Devi et al., 1993). Theresult of this study is consistent with the reports ofthe effect of agrochemicals on LDH activity inmammals.Parathion was found to elicit increasedLDH activity in rats (GalloandLawryk, 1991).Similarly, Junge et al. (2001) reported a 2-foldincrease in liver myelopreoxidase activity in the ratexposed to lindane.Lactate dehydrogenase is known tocatalyse the biochemical process of convertingpyruvate to lactate with the attendant oxidation ofNADPH. Thus, the increased LDH activity in boththe liver and serum are indications of a shift in thecarbohydrate metabolism from the glucose andglycogen catabolism to lactate synthesis. This shiftin carbohydrate metabolism reflects the possibledependence of C. albopunctatus on anaerobicpathway during exposure to sublethal Actellic 25EC and Gammalin 20. This goes to confirm thereport of Omoregie et al. (1990) that theseinsecticides induce increased plasma lactateconcentration in Oreochromis niloticus. Thissituation would predispose the fish to lacticacidosis, which may impact adversely on thehealth of the fish.In conclusion, Actellic25 EC and Gammalin 20were found to elicit increased lactatedehydrogenase activity in the fish C. albopunctatuswith its attendant physiological stress.REFERENCESCASILLAS, E. and AMES, W. (1986). Hepatoxiceffects of carbon tetrachloride on theEnglish sole (Parophrys vitulus): possibleindicator of liver dysfunction. ComparativeBiochemistry Physiology, 84 c: 397 – 400.CHRISTENSEN, G., MUNT, E. and FIANDT, J.(1977). The effect of methyl mercuricchloride, cadmium chloride and leadnitrate on six biochemical factors of brooktrout (Salvelinus fontinalis).Toxicology andPharmacology, 42: 523 – 530.DA SILVA, H. C., MEDINA, H. S. G., FAQNTA, E.and BACILA, M. C. (1993). Sublethaleffects of the <strong>org</strong>anophosphate Folidol600 (Methyl Parathion) on Callichthyscallichthys (Pisces: Teleostei).Comparative Biochemistry Physiology, 105c: 197 – 201.DEVI, M., REDDY, P. S. and FINGERMAN, M.(1993). Effect of exposure on lactatedehydrogenase activity in thehepatopancreas and abdominal muscles ofthe Fiddler crab Uca pugilator.
OLUAH, Ndubuisi Stanley et al. 234Comparative Biochemistry Physiology,106c: 739 – 742.GALLO, M. A. and LAWRYK, V. J. (1991). Organicphosphorous pesticides studies. Williamsand Wilkins, Baltimore. 1123 pp.HILMY, A. M., SHABAMA, M. B. and DAABEES, A.Y. (1985). Effect of cadmium toxicity uponthe in vivo and in vitro activity of proteinsand five enzymes in the blood serum andtissue homogenates of Mugil cephalus.Comparative Biochemistry Physiology, 81c: 145 – 153.JUNGE, B., CARRION, Y., BASIO, C., GALLANO, M.,PRINTARNIO, S., TAPIA, G. and VIDELA,L. A. (2001). Effect of iron over load andlindane intoxication in relation to oxidationstress, kuffer cell function and liver injuryin the rat. Toxicology and AppliedPharmacology, 170: 23 – 28.OLUAH, N. S. and AMALU, C. C. (1998). The effectof heavy metals on the aminotranseraseactivity in the freshwater catfish Clariasalbopunctatus. Journal Aquatic Sciences13: 5 – 8.OLUAH, N. S. (1999). Plasma aspartateaminotrasferase activity in the catfishClarias albopunctatus exposed to sublethalzinc and mercury. Bulletin EnvironmentalContamination Toxicology, 63: 343 – 349.OMOREGIE, E., UFODIKE, E. B. C. and KEKE, I. R.(1990). Tissue Chemistry of Oreochromisniloticus exposed to sublethalconcentrations of Gammalin 20 andActellic 25 EC Journal Aquatic Sciences, 5:33 – 36.PHILIPS, J. A. WU, J. S., SUMMERFLET, H. andATCHISON, G. (2002). Acute toxicity andcholinesterase inhibition in larval and earlyjuvenile walleye exposed to chlopyrifos.Environmental Toxicology and Chemistry,21: 1469 – 1474.RASHATWAR, S. and ILYAS, R. (1983). The effectof chronic herbicide intoxication on in vivoactivities of certain enzymes of freshwaterfish Nemachelinus. Toxicological Letters,16: 249 – 252.REDDY, P. S., BHAGYALAKSHMI, A. andRAMASMENITHI, R. (1983). Chronicsumithion toxicity 1: Effect oncarbohydrate metabolism in the crabmuscle. Toxicological Letters, 15: 113 –117.SIMON, L. M., NEMOSOK, J. and BOROSS, L.(1985). Studies on the effect of paraquaton glycogen mobilization in the liver ofcommon carp (Cyprino carpio)Comparative Biochemistry Physiology, 75c: 167 – 169.THEBAULT, M. T. and DE C<strong>ARI</strong>S, F. X. (1983).Calcium ion ATPase inhibition in the troutgill microsome following in vitro and invivo treatment with 2, 4, 5-T.Comparative Biochemistry Physiology,75c: 369 – 372.THIRUGNANAM, M. and FORGASH, A .T. (1977).Environmental impact of mosquitopesticide toxicity and anticholinesteraseactivity of choryopyrifos to fish in a saltmarsh habitat. Archives EnvironmentalContamination and Tox cology, i 5: 415 –425.VERMA, S. R., RANI, S. and DALELA, R. C. (1981).Pesticide induced physiological alterationin certain tissues of a fish Mytulus vitatus.Toxicological Letters, 9: 327 – 332.WORTHING, C. R. and HANCE, R. J. (1991).Pesticide manual. 8 th edition. British CropProtection Council, Thomton Heath,London.
Animal Research International (2005) 2(1): 235 – 239 235EFFECT OF EFFLUENT FROM A VEGETABLE OIL FACTORY INSOUTHEASTERN NIGERIA ON THE MMIRIELE STREAMATAMA, Chinedu and MGBENKA, Bernard ObialoFish Nutrition, Aquaculture and Hydrobiology Unit, Department of <strong>Zoo</strong>logy, University of Nigeria Nsukka.Corresponding Author: Dr. MGBENKA, B. O. Fish Nutrition, Aquaculture and Hydrobiology Unit,Department of <strong>Zoo</strong>logy, University of Nigeria Nsukka. Email: bo_mgbenka@yahoo.co.uk.ABSTRACTEnvironmental monitoring of effluent discharged from a vegetable oil factory and route toreceiving Mmiriele stream, Nnewi Anambra State, Nigeria was conducted bi-weekly for 12months. The physicochemical parameters examined in the effluent assessment weredissolved oxygen (DO), biochemical oxygen demand (BOD), chemical oxygen demand (COD),total hardness, hydrogen ion concentration (pH),and ammonia-nitrogen. Others were copper(Cu), zinc (Zn), lead (Pb) and arsenic (As). Concentration of each of the parameters at thevarious sampled points indicated significant variation among the points (P < 0.05).Comparing the results to international effluent quality standards for municipal and industrialeffluents discharged into surface inland waters and the Federal Ministry of Environment(FMENV) standards for such effluents showed that the mean values of each of the parameterswas within acceptable limits except for very high distribution of lead recorded in all samples.Arsenic was notably not detected. The significance of the results is discussed.Keywords: Vegetable oil factory effluent, Physicochemical parameters, Dissolved metal pollutantsINTRODUCTIONIndustrial waste contains toxic substances thatdamage biological activity and kill desirable formsof life (Suter and Loar, 1992). One of such was asreported by Sandra (2000) and JØ<strong>org</strong>ensen andJohnsen (1989) for industrial waste waters. Verymany physicochemical parameters are associatedwith effluent assessment most of which wereconsidered.From human health perspective, highlevels of elements such as zinc, lead, arsenic andnitrogen are of great concern. For instance,nitrate may cause infant hemoglobinemia or bluebabysyndrome in which the oxygen-carryingcapacity is blocked, causing suffocation. Lead isparticularly toxic to young children and its hazardsinclude kidney damage, metabolic interference anddepressed biosynthesis of protein (Craun et al.,1981; Meybeck, 1982; Meybeck et al., 1989).Brown blood disease due to excessive nitritenitrogen has also been reported in fish (Lovell,1987).However, industrial pollutants are difficultto characterize and detailed inventories ofindustrial wastes are rare. In addition to <strong>org</strong>anicdecomposable matter of complex composition withhigh biological oxygen demand, the waste fromindustries usually contain traces or largerquantities of raw materials, intermediate products,final products, by-products and processingchemicals. From the above problems associatedwith industrial pollutants, there is need to monitorwaters in which industrial effluents are discharged.In Nigeria, the Federal EnvironmentProtection Agency (FEPA), now known as theFederal Ministry of Environment (FMENV) wascreated in 1988. It is charged with the statutoryresponsibility for overall protection of theenvironment. Among the guidelines of FMENV ismandatory provision of on-site or contractualindustrial pollution effluent monitoring facilitieswithin the set up of any industry (Ugochukwu andLeton, 2004). This law is often breeched. FMENVand State governments’ environmental protectionagencies (EPAs) are also charged withcrosschecking effluent characteristics fromfactories and companies to ascertain the degree ofcompliance with the law. Too often, this is notdone or is poorly done. The result is that theenvironment suffers from likely hazardouspollution with effluent discharged from factories.Against this background, the need for theassessment of a vegetable oil factory effluentwhich enters the Mmiriele stream, Nnewi, useddomestically by the people living around it cannotbe over-emphasized. There is little or no recordedinformation on the physicochemical parameters ofthis body of water. The present study wastherefore an independent study conducted todetermine the physicochemical parameters of thesection of the Mmiriele stream into which a
ATAMA, Chinedu and MGBENKA, Bernard Obialo 236vegetable oil factory discharges its effluent. Thisis to establish some baseline information for thisstream.MATERIALS AND METHODSEffluents from a vegetable oil factory wereproperly channeled into the receiving Mmirielesteam. Thus, the physicochemical parameters ofthe effluent that gets into the stream and thestream were monitored. Representative sampleswere collected from the effluent discharge route ofthe vegetable oil factory, Nnewi, Anambra States,Nigeria into the Mmiriele stream (Figure 1).N), hydrogen ion concentration (pH), and totalhardness. Other parameters studied include thefollowing heavy metals: copper (Cu), zinc (Zn),lead (Pb) and arsenic. All analyses for biochemicaloxygen demand, chemical oxygen demand, totalhardness, and heavy metals were done by usingthe standard methods described in APHA (1976,1980) and Owen (1974). Most of thecharacteristics were determined with unfilteredsamples except dissolved heavy metals in whichfiltered samples were used. Values obtained fromthe stream were compared with Federal Ministry ofEnvironment Standards (FEPA, 1988).Statistical Analysis: Means and standard errorof means of the physicochemical parameters of thedifferent sampled sites were calculated usingdescriptive statistics. The one way analysis ofvariance (ANOVA) was employed to test for anysignificance differences (P < 0.05) and the Fisher’sleast significant differences (F-LSD) and theDuncan’s Multiple Range Test were employed topartition the differences of sampled means (Steeland Torrie, 1980).RESULTSFigure 1: Effluent route from the RIMCOvegetable oil factory into the receivingmmiriele stream showing sampled points,namely; A station for collection of effluentimmediately in the oil/fat trap, B oildischarge point station, C station forcollection of effluent in the sedimentationtank, D station for collection of effluent inmmiriele, E 250 meters downstream ofmmiriele, represents effluent collectionstations indicated by letters, Arrowsrepresent direction of effluent flow.Additionally, representative samples were collectedfrom the point of entry of the effluent in thestream and from 250 m downstream. Clean dryone litre wide mouthed transparent glass bottleswith Teflon covers were used to collect thesamples. The glass bottles were appropriatelylabelled with sample location, date and time ofcollection. For dissolved oxygen determination,water from the bottle was siphoned through theWinkler dissolved oxygen determination bottle andthe water fixed in the field for the azidemodification of the Winkler’s method using theHach test kit (Model FF3, Hach Company, LovelandCo., USA). Triplicate sampling unit were used. Allsamples were preserved at low temperature in icechest, and analysed within 24 hours of collection.Sampling was done bi-weekly for a period of 12calendar months. The following physicochemicalparameters were determined: dissolved oxygen(DO), biochemical oxygen demand BOD), chemicaloxygen demand (COD), ammonia–nitrogen (NH 4 -The results of the mean physicochemicalparameter are shown in Table 1. Comparison ofphysicochemical parameters in the Mmirielestream, Nnewi with the Federal Ministry ofEnvironment Standards is presented in Figure 2.Table 1 showed that the highest mean COD of720.00 ± 5.94 mgl -1 was obtained in the fat trapand the least mean COD of 106.20 ± 2.62 mgl -1was obtained at 250 m down stream. These valueswere significantly different (P < 0.05). The valuesobtained within the stream were significantlydifferent (P < 0.05) from each other and from thevalues recorded in the fat trap, discharge pointand the sedimentation tank.The mean DO concentration ranged from1.81 ± 0.06 mgl -1 in the fat trap to 6.69 ± 0.07mgl -1 at 250 m downstream. There was significantdifference (P < 0.05) in the DO values recordedbetween the all the sampled sites with an upwardincrease in DO from the factory to downstream ofMmiriele.On the other hand, the concentration ofBOD varied from 0.97 ± 0.07 mgl -1 in the fat trapto 4.41 ± 0.08 mgl -1 in the receiving steam point.There were significant differences (P < 0.05)between all sampling points outside the stream butidentical BOD values within the stream stations.Also, BOD values within the stream were higherthan outside the stream.The concentration of ammonia-nitrogenranged from 2.42 ± 0.06 mgl -1 at 250 mdownstream to 15.30 ± 0.09 mgl -1 in the fat trap.
Effect of effluent from a vegetable oil factory on a receiving stream ecosystem 237Table 1: Mean distribution of physicochemical parameters along a vegetable oil factory effluentdischarge route in Nnewi, NigeriaSitesWater quality parametersChemicaloxygendemand(mgl -1 )Dissolvedoxygen(mgl -1 )Biochemicaloxygendemand(mgl -1 )Ammonianitrogen(mgl -1 )Totalhardness(mgl -1 )pH Copper(mgl -1 )Zinc(mgl -1 )Lead(mgl -1 )Fat trap 720.00±5.94 a 1.81±0.06 a 0.97±0.07 a 15.30±0.09 a 18.30±0.63 a 7.53±0.02 a 0.41±0.04 a 0.54±0.02 a 14.38±0.17 aOil dischargepointSedimentationtankEffluentreceivingstream(Mmiriele)196.00 2.00 1.82 4.68 20.00 6.86 0.46 0.56 15.43±3.57 b ±0.08 a ±0.08 b ±0.06 b ±0.82 b ±0.09 b ±0.05 a ±0.02 a ±0.46 b148.70 3.43 2.94 2.62 24.00 6.69 0.47 0.64 16.73±2.27 c ±0.07 b ±0.04 c ±0.04 c ±0.68 c ±0.02 b ±0.04 a ±0.03 b ±0.31 c117.30 5.00 4.41 3.67 11.20 6.94 0.31 0.56 14.61±2.36 d ±0.08 c ±0.08 d ±0.06 d ±0.04 d ±0.04 c ±0.06 b ±0.02 a ±0.21 aChemical Oxygen Demand250 mdownstream106.20±2.62 e 6.69±0.07 d 4.28±0.09 d 2.42±0.06 e 16.40±0.62 e 7.29±0.06 d 0.18±0.03 a 0.57±0.02 a 14.68±0.29 c1 Mean values in a column followed by the same superscripts are not significantly different (P > 0.05).The pH values along the effluent routeranged from 6.69 ± 0.02 pH to 7.53 ± 0.02 pH inPoint of entry into Mmiriele streamthe sedimentation tank. For the pH, all points250 m dow nstream of Mmirieleoutside the stream were not significantly differentFMENV Standardbut were different form the values of sampling45points within the stream. The 250 m downstream40station had a significantly different pH value from35the pH at the effluent receiving point in Mmirielestream (P < 0.05).140120100806040200pH Temp BOD(mg/l)Param etersCOD(mg/l)DO(mg/l)Figure 2: Water quality parameters of Rimcovegetable oil factory effleunts receivingmmiriele stream compared w ith FederalMinbistry of Environment Standards.There were significant variations (P < 0.05) in thevalues recorded for the parameter at all stationssampled.In addition, the mean values for totalhardness ranged from 11.20 ± 0.53 mgl -1 in thereceiving stream to 24.00 ± 0.53 mgl -1 in thesedimentation tank. As with ammonia-nitrogen,there were significant variations (P < 0.05) in thevalues of total hardness recorded at all stationsalong the effluent route sampled.302520151050Temperature ( o C) & DO (mg/l)The highest mean value of dissolvedcopper recorded was 0.47 ± 0.04 ppm in thesedimentation tank and the least value was 0.18 ±0.03 ppm at 250 m down stream. All pointsoutside the stream were not significantly different(P > 0.05) in values but were significantly differentfrom the values of the stations within the stream.The 250 m downstream station of the Mmirielestream and the effluent receiving station recordedsignificantly different (P < 0.05) value of copper.Dissolved zinc concentration rangedbetween 0.64 ± 0.03 ppm in the sedimentationtank to 0.54 ± 0.02 ppm in the fat trap (Figure 3).The F-LSD separation of means showed that therewere no significant difference (P > 0.05) betweenvalues recorded in the discharge point of thereceiving stream and 250 m downstream but thesewere significantly different (P < 05) from thevalues got in the fat trap and sedimentation tank.The values for dissolved lead differedbetween 14.33 ± 0.17 ppm in the fat trap and16.73 ± 0.31 ppm in the sedimentation tank.There were significant variations (P < 0.05) in thevalues of lead recorded in the effluent routestations (Figure 3). The value in the fat trapstation was however not significantly different (P >0.05) from the values of lead from the Mmirielestream stations. No trace of arsenic was recordedin any of the sampled points.
ATAMA, Chinedu and MGBENKA, Bernard Obialo 238Concentration of Lead (mg/l)1614121086420Figure 3: Concentration of heavy metalsin the Rimco vegetable oil factoryeffluent receiving mmiriele streamcompared w ith Federal Ministry ofEnvironment StandardsDISCUSSIONPoint of entry into Mmirielestream250 m dow nstream of MmirieleFMENV StandardLead Copper ZincHeavy Metals1.20.80.60.40.2The COD, BOD and DO levels at the point ofentrance of the effluent into Mmiriele stream andat 250 m downstream compared to InternationalStandards for water (GESAMP, 1988) and theFederal Ministry of Environment standards formunicipal and industrial effluents discharge intosurface inland waters (Figure 2) showed that thevalues are within acceptable limits. Maitland(1990) reported that clean cold water holds onlyabout 12 mgl -1 of oxygen. Thus the results of DOin Mmiriele represent usable oxygen in theeffluent. However, high temperature around 30ºC in Nigeria, not only reduced the amount ofoxygen which can dissolve in water, therebyminimizing the oxygen supply available to micro<strong>org</strong>anisms.Also, increase in the rate at whichoxygen is utilized by micro-<strong>org</strong>anisms isexacerbated by the high temperature. According tothe traditional dissolved oxygen sag curve, a highrate of oxygen use might result in low or zerodissolved oxygen concentration in a particularstream reach. This would impair the stream’ssubsequent capacity to received further pollutingdischarges. Kolo and Yiza (2000) observed thatincreased <strong>org</strong>anic matter decomposition in watercan reduce the BOD to less than 4 mgl -1 . As canbe seen from the values of BOD in the effluententry point (4.41 ± 0.08 ppm) and the value at the10Concentrations of Copper&Zinc (mg/l)250 m downstream (4.28 ± 0.09) the stream wastending to the marginal 4 mgl -1 BOD.In addition, the pH, ammonia-nitrogenand total hardness concentration were withinNigeria Federal Ministry of Environment setguidelines for waste disposal (FEPA, 1988). Thesource of hardness in the effluents could bethrough wash-offs from the machines with soap.Whatever source, hardness is an important factorfor fish production. The recommended level fortotal hardness in fish pond is 20 mgl -1 (Boyd andLichtkopler, 1979). The hardness level in thiseffluent may be adequate for fish production.On the other hand, the levels of zinc andcopper were considerably low while arsenic wasnotably absent. The level of lead was very highand remained stable throughout the study period.The lead in the stream may be contributed byeffluent from either a battery factory locatedupstream or mobilization from the soil. This highlevel of lead may have resulted mainly from alead-acid accumulator (battery) manufacturingactivity in the vicinity, and from washings ofleaded containers and high traffic density in thestream in this heavily industrialized city. Thebattery factory is located in the upstream sectionof the town. The GESAMP (1988) observed thatlow lead concentration of less than 0.02 mgl -1 mayaffect photosynthesis, delay embryonicdevelopment, and reduce growth in adult fish,mollusks and crustaceans. Mombeshora et al.(1983), however, reported a lower level of lead intheir studies of stream and lakes and Ibadan,Nigeria indicating that the level of lead in theMmiriele stream was high indeed.From the above result it becomesnecessary that factory wastes into the aquaticenvironment be monitored, to put a check onpollution. Furthermore, the quality requirements ofwater use could be the only constraints governingthe choice of stream standards for particularsurface water. Although, there was no direct linkof lead to the Rimco Vegetable Oil factory, westrongly recommend that the high lead levels inthe stream be reduced forthwith through reducedloading of the stream with lead.ACKNOWLEDGEMENTSWe are very grateful to some members of theDepartment of <strong>Zoo</strong>logy, University of Nigeria,Nsukka, namely Prof. F. C. Okafor for very usefuladvice and facilitation of effluent collection fromthe factory, Mr. N. S. Oluah for assistance with thewater analyses and Dr. J. E. Eyo for assisting insampling during one of the several trips to Nnewi.We are indebted to the management of the factoryespecially Engr. L. O. Ilozue for allowing us accessto the factory for collection of samples. Themanagement of the factory by their action and
Effect of effluent from a vegetable oil factory on a receiving stream ecosystem 239utterances showed some willingness to protect theenvironment.REFERENCESAPHA (1976). Standard methods for examinationof water and waste water. 16 th edition.America Public Health Association andWater Pollution Control Federation,Washington DC, 1086 pp.APHA (1980). Standard methods o f theexamination of water and waste water.th17 Edition. America Public HealthAssociation, Washington D. C. 1134 pp.BOYD, E. C. and LICHTKOPLER, F. (1979). Waterquality management in pond fish culture.International Centre for Aquaculture,Agricultural Experiment Station, Researchand Development Series 22. AuburnUniversity, Alabama, USA. 30 pp.CRAUN, G. F., GREATHOUSE, D. G. andZUNDERSON, D. H, (1981). Haemoglobinlevels in young children consuming highnitrate well water in the United States.International Journal o f Epidemiology, 10:309 – 317.FEPA (1988). National interim guidelines andstandards for industrial effluents, gaseousemission and hazardous wastemanagement in Nigeria. FederalEnvironmental Protection Agency, LagosNigeria.GESAMP (1988). Review of potentially harmfulsubstances. Joint Group of Experts on theScientific Aspect of Marine Pollution(GESAMP). Reports of Ships. GESAMP,28: 27.JØRGENSEN, S. E. and JOHNSEN, I. (1989).Principles of environmental science andtechnology: Studies in environmentalscience 33, Elsevier, Oxford, 628 pp.KOLO, R.J and YISA, J. (2000). Preliminary baseline assessment of water quality of RiverSuka, Niger State. Journal of FisheryTechnology. 91: 105.LOVELL, R. T. (1987). Fish nutrition and feedingof fish. Van Nostrand, New York. 260 pp.MAITLAND, P. S. (1990). Biology of freshwater.Chapman and Hall. New York. 76 pp.MEYBECK, M. (1982). Carbon, nitrogen andphosphorus transport by world rivers.American Journal of Science , 28 (2): 401- 450.MEYBECK, M., FRIEDRIC, G., THOMAS, R. andCHAPMAN, D. (1989). Rivers. Pages 65 -160. In: CHAPMAN, D.V. (Editor). Waterquality assessment: A guide to the use ofbiota sedimenta and water in environmentmonitoring. Basil Blackwell Limited,Oxford.MOMBESHORA, C. O., OSIBANJO O. and AJAYI, S.O. (1983). Pollution studies on Nigeriarivers. The onset of lead pollution ofsurface water in Ibadan. EnvironmentInternational, 9: 81 - 84.OWEN, T. L. (1974). A handbook of commonmethods in limnology. C V MosbyCompany, Waco, Texas. 153 pp.SANDRA, C. (2000). Managing phosphorus toprotect water quality. Alberta agriculture,food and rural development. 315 pp.STEEL, R. G. D. and TORRIE, J. H. (1980).Principles and procedures o f statistics: Abiometrical approach. Second edition.McGraw-Hill, New York, NY. 633 pp.SUTER, G. W. and LOAR, J. M. (1992). Weighingthe ecological risk of hazardous wastesites: The Oak Ridge Case. EnvironmentalScience and Technology 6: 432 - 438.UGOCHUKWU, C. N. C. and LETON, T. G. (2004).Effluent monitoring of an oil servicingcompany and its impact on theenvironment. Ajeam-Ragee 8: 27-30.
Animal Research International (2005) 2(1): 240 – 245 240BAOBAB (Adansonia digitata L.) SEED PROTEIN UTILIZATION IN YOUNGALBINO RATS I: BIOCHEMICAL INGREDIENTS AND PERFORMANCECHARACTERISTICSEZEAGU, Ikechukwu EdwinNutrition Unit, Department of Medical Biochemistry, University of Nigeria, Enugu Campus, P. O. Box 15676,Enugu, Nigeria. Email: ikezeagu@yahoo.co.ukABSTRACTRaw, cooked and HCl-extracted baobab, Adansonia digitata seed meals were used forbiological and nutritional evaluation studies. The seed is low in protein (16.60g/100g DM) butcould be a good source of oil (17.50g/100g) and minerals, particularly sodium, potassium andphosphorus, which contained 228.0, 1429.0 and 924.5 mg/100gDM respectively. Low levels ofantinutritional factors such as tannin, phytate, cyanide, oxalate, nitrate/nitrite and absence oftrypsin inhibitors were observed. Seed protein is high in sulfur-amino acid, with a chemicalscore (CS) of 126.80, but marginally limiting in lysine and threonine, with CS of 64.31 and85.59 respectively based on the preschool age (2-5yrs) reference protein requirement. Theseed oil contain appreciable level of unsaturated fatty acids with oleic and linoleic acidsmaking up 66.32% of total fatty acids. The raw diet was similar to the casein diet in weightgain, feed intake, net protein retention (NPR) and true digestibility (TD) but significantlyinferior in protein efficiency ratio (PER). Cooking did not have any significant effect on feedintake but significantly lowered the weight gain relative to the raw and casein diets. HClextractedmeal exerted significantly lower weight gain compared to the raw, cooked andcasein diets . It is concluded that the raw seed showed promise as a source of foodsupplement and is likely to be satisfactory in supporting growth and maintenance in livestockfeeding.Keywords: Adansonia digitata, Baobab seed protein, Biochemical ingredients, Performance, RatsINTRODUCTIONThe majority of sub-Saharan African countriesincluding Nigeria are faced with acute foodshortages. The solution to the food problem mustbe sought through a combination of all availablesources. Food and agricultural scientists arebeginning to screen wild and under-exploitednative plants for possible potential sources of foodin an attempt to widen the narrow food base(Vietmeyer and Janick 1996; Oelke et al., 1997).Several reports have also indicated that lots oflesser-known native crop species are high innutrients and could possibly relieve critical foodshortages if given adequate promotion andresearch attention (Madubuike et al., 1994; Murrayet al., 2001). Working on the prospects of utilizingsuch lesser known and neglected plants, researchreports have revealed that quite a large numberhave useful qualities – either for direct use asanimal feed ingredient or as a raw material forseed protein extraction (Ezeagu et al., 2000,2003). However, prior to utilization of suchunconventional resources data indicating thenutrient composition and toxic factors should beavailable. Toxicological evaluation of possibleepidemiological response to the ingestion of novelfood sources and the methods of processing thatwill enhance their utility as food or feed ingredientare all necessary in order to achieve optimalutilization (Longvah et a l., 2000).Baobab is a well-adapted deciduous treenative to the arid parts of Central Africa and widelyspread in the savannah regions in Nigeria(Wickens, 1980; FAO, 1988). Its leaves, bark andfruit are used as food and for medicinal purposesin many parts of Africa. In the Sahel, for example,baobab leaf is a staple the Hausas used to make“miyan kuka”, a soup prepared by boiling the leafin salt water and reported to be a rich source ofVitamin C. During acute seasonal food supplyfluctuations or famine periods, the leaves and fruitof baobab are of particular importance assupplementary and emergency food (Humphrey etal. 1993). The seed has a relatively thick shell,which is not readily separated from the kernel. Thekernel is edible but the difficulties of decorticatingseem to have limited its use as food/feed andconsequently large quantities go into waste. Butthe increasing pressure of population andpredictable food shortages are creating a demandfor new food sources of human nutrition. Fewreports have indicated the composition of thebaobab fruit pulp and leaves (Nour et a l., 1980;
Baobab seed protein utilization in young albino rats 241Yazzie et al., 1994; Obizoba and Anyika, 1994),but reports on the nutritional and/or biochemicalevaluation of the whole seed are scarcelyavailable. An earlier report had indicated thepotential of its use as food component or feedsupplement (Proll et al., 1998). This study seeks toverify further the nutritional qualities of baobabseed as a protein source and the effect ofprocessing on the nutritional quality in albino ratsMATERIALS AND METHODSTreatment of Sample: About 2 kg of the maturedfruits were harvested from different locations aroundthe city of Ibadan, Nigeria and the seeds weremanually separated from the pods. Cooking wasdone by immersing in boiling water and allowingboiling for 30 min. For acid-extraction, 500g of seedswere immersed in 0.25 M HCl at 60 o C for 4 haccording to the method of Tasneem et al. (1982).The acid extract was decanted and the residuewashed free of acid using tap water and then dried.Raw and treated samples (350 g each) were groundto flour using a Wiley Mill with the 1 mm mesh sieveand stored in plastic bags at -4 o C until analysis.Proximate Analysis: Nitrogen, fat, ash, microandmacro-minerals were determined by standardmethods (AOAC, 1990). Crude proteins (CP) andtotal carbohydrates were calculated by N x 6.25and difference respectively. Total soluble sugarsand starch were determined by the combinedmethods of Duboise et al. (1956) and Kalenga etal. (1981). Soluble sugars were extracted withethanol (95 %) and residual starch was thenhydrolysed with perchloric acid intomonosaccharides. The sugars were thencolourimetrically determined with phenol-sulphuricacid. Gross energy was calculated from theAtwater conversion system (FAO, 1982).Analysis of Antinutritional Factors: Tannin wasdetermined by the Folin-Denis method (AOAC,1990); Phytic acid by the method of Wheeler andFerrel (1971); trypsin inhibitor activity by themethod of Kakade et al. (1974) using benzoyl-DLarginine-p-nitroanilide(BAPNA) as substrate.Phytohaemagglutinating activity was determined bythe serial dilution method of Liener and Hill (1953)using trypsinized rabbit erythrocytes and expressedas haemagglutinating unit (HU)/mg sample. Cyanidewas extracted with 0.1 M ortho-H 3 PO 4 acid andestimated using an auto analyzer according to themethod of Rao and Hahn (1984). Nitrate and nitritewere determined as previously described (Ezeaguand Fafunso, 1995) and oxalate was determined bythe method of Baker (1952).Amino Acid Analysis: Amino acids weredetermined according to the recommendations ofFAO/WHO (1991) by triple hydrolysis (Pellet andYoung, 1980) as previously described (Petzke etal., 1997).Fatty Acid Analysis: For fatty acid analysis thelipid extract was transmethylated withtrimethylsulfonium-hydroxide (TMSH) as describedby Schulte and Weber (1989). Aliquots (10 mg) offat were dissolved in 250 µl trichloromethane,followed by addition of 250 µl of the internalstandard and 250 µl of TMSH solutions. The fattyacid methyl esters were analyzed using a GLC(model 5890 series II, Hewlett Packard Co., PaloAlto, CA.) equipped with a flame-ionizationdetector and a 30 m capillary column (DB-Wax, id0.32mm). The initial oven temperature was 140o C followed by temperature programming in threesteps: a first rate of 4 o C/min until 170 o C, followedby a second rate of 1.5 o C/min until 185 o C and athird rate of 4 o C/min until 220o C. The finaltemperature was maintained for 33 min. Theinjection temperature was 225 o C and the detectortemperature was 250 o C. Helium was used as thecarrier gas. Peak areas were integrated usingHewlett-Packard 3365 Series II ChemStationsoftware, and the fatty acids were expressed aspercentage of total fatty acid pool. Fatty acidswere identified by comparison of their retentiontime with those of known standards. Quantitativedata were obtained using tricosanoate (C 23:0 ) as aninternal standard.Animals and Diets: Experimental diets wereprepared according to the method of Chapman etal. (1959) with adequate provision of vitamins andminerals (Miller, 1963). Twenty weanling malealbino rats, about 24 days old with mean weightsof 26-28 g were obtained from the PreclinicalLaboratories of the University of Ibadan, Ibadan.The animals were housed individually in allaluminumscreen metabolic cages with provisionfor urine, faecal collection and unrestricted accessto water and food. The rats were assigned four pergroup, equalized for body weight in a randomizedblock design. One group was fed the basal proteinfreediet, another group was given a 10% proteindiet based on casein, the other three groups wereassigned to diets with 10% protein supplied by theraw, cooked or acid-extracted meals, respectively.Weighed amounts of diets were daily offered tothe animals for 21 days. The food residues werecollected, dried and weighed. The faeces wereoven-dried at 60 o C and stored in plastic containersuntil analyzed. A drop of dilute H 2 SO 4 was addedto urine samples to prevent any loss of nitrogen.The rats were weighed weekly and proteinefficiency ratio (PER), net protein retention (NPR)and true digestibility (TD) were computed fromtotal feed intake, total faeces voided, as well asthe nitrogen determination.
EZEAGU, Ikechukwu Edwin 242Table 1: Proximate composition and mineral components of baobab seed meal comparedto soybean, cowpea and maizeBaobab Soybean* Cowpea* Maize*Proximate CompositionCrude protein 16.60 36.70 23.1 8.9Crude fat 17.50 20.10 15.0 3.9Ash 5.50 4.60 3.4 1.2Carbohydrates 60.40 33.95 67.8 74.2Total sugars 2.52 - - -Starch 22.60 - - -Crude fibre 14.94 - - -Energy, kJ (kcal)/100g 1883 (450) 1816 (434) 2016 (482) 1490 (356)Minerals (mg/100g)Sodium 228.0 10.0 20.0Potassium 1429.0 192.0 96.0Calcium 212.0 260.0 130.0Magnesium 353.0 320.0Phosphorus 924.5 750.0 430.0Iron 11.13 - -Copper 2.55 - -Zinc 8.41 - -Manganese 2.10 - -*FAO 1982. 1 Mean of two independent analyses, - Not availableAll analysis was done in duplicate. Data wereanalyzed by one-way analysis of variance.Treatment means were compared by the Duncan’s(1955) multiple range tests.RESULTS AND DISCUSSIONChemical analysis of the whole baobab seed ispresented and compared to some common staplesin Table 1. The results seem to be on the samelevel with the previous report (Proll et al., 1998).Comparing protein contents, baobab seed is lowerin protein (16.60g/100g) than soybean (36.70g/100g) and cowpea (23.10g/100g) but higherthan maize (8.90g/100g). Total sugar is low(2.52g/100g) but starch content of (22.60 g/100g)is higher than the 18.44 g/100g reported forsoybean (Ezeagu et al., 2000). With a total fat andcarbohydrate contents of 17.50 and 60.40 g/100grespectively, baobab seeds could be a good sourceof energy and edible oil, and thus a usefulsupplement in animal feed formulation. There areappreciable levels of minerals, potassium (1429.0)and phosphorus (924.5mg/100g) being the mostabundant. The seed meal seems to be higher iniron (11.13), copper (2.55) and zinc(8.41mg/100g) than conventional staples and willeasily satisfy animal needs, assuming that theyoccur in readily available forms. About 34% oftotal P occurred as phytate-P, which is lower than80% value reported for most legumes (Rackis andAnderson, 1977). Gross energy (1883.28) washigher than that of maize (1490.22) butcomparable to those of soybean (1815.89) andcommon beans (2016.40 kJ/100g).The results on antinutritional components(Table 2) showed absence of trypsin inhibitor,which could be considered as a nutritionaladvantage. Tannin (0.29 mg/g), phytate (1.20g/100 g), total oxalate (42.0 mg/100 g) andcyanide (0.25mg/100g) appeared low and inreasonable agreement with values reported forcommonly consumed food articles.Table 2: Antinutritional components ofbaobab seedParametersBaobab*seedTannin, mg/g 0.29Phytate, g/100g 1.20Phytate-phosphorus 0.34Phytate-P as % total P 1.0Trypsin inhibitor, TIU/mgNDHaemagglutinins, HU/mg 0.250Cyanide, mg/100g 0.25Total oxalate, mg/100g 42.0Water soluble Oxalate 26.0Soluble oxalate as % of total 61.9oxalateNitrate, mg/g 19.45Nitrite, mg/g 0.104ND: Not Detected, *Means o f two independent analysesAmino acid profile as shown in Table 3 indicates afair complement of essential amino acids. Usingthe FAO/WHO/UNU (1985) preschool age (2-5yrs)reference amino acid requirement as a guide incalculating the chemical score (CS) of amino acids,the seed seems marginally limiting in lysine andthreonine (CS 64.31 and 85.59% respectively) but
Baobab seed protein utilization in young albino rats 243Table 3: Essential amino acid profile of baobab seed (g/100g Protein)Baobab ChemicalscoreFAO/WHO/UNU 1985(reference pattern)Child* Adult2-5yrLysine 3.73 64.31 5.80 1.60Methionine 1.25Cystein 1.92Total S-Amino Acids 3.17 126.80 2.50 1.70Isoleucine3.54 126.43 2.80 1.30Leucine 6.54 99.09 6.60 1.60Phenylanine 4.54Tyrosine 2.72Total Aromatic Amino Acids 7.26 115.24 6.30 1.90Threonine 2.91 85.59 3.40 0.90Tryptophan 1.38 125.45 1.10 0.5Valine 4.99 142.57 3.50 1.30Histidine 1.98 104.21 1.90 1.601 Total EAAs 33.52 43.30 33.90 12.70*For calculating the chemical score of amino acids, the FAO/WHO/UNU (1985) reference pattern for children 2-5 years old wasused, Total EAAs: Total essential amino acidshigh in sulphur-amino acids (CS 126.8%).Acceptable CS is considered to be in the order of60 and above (Nordeide et al., 1994). However,the seed protein was quite adequate in totalessential amino acids (EAAs) and comparedfavorably to the reference protein in total EAAsand in meeting the recommended adultrequirements.Oleic and linoleic acids are the mostabundant unsaturated fatty acids (Table 4). Withlow polyunsaturated/saturated ratio (P/S) (1.1)compared to soybean (3.6) and other high linoleicTable 4: Fatty acid composition of oil (Area%)*Fatty acidsBaobabLauric C 12 -Myristic C 14:0 0.25Palmitic C 16:0 22.06Palmitoleic C 16:1n-7 0.27Hexadecadienic C 16:2n-4 0.95Stearic C 18:0 4.02Oleic C 18:1n-9 34.97Oleic (isomer) C 18:1n-7 1.00Linoleic C 18:2n-6 26.14Linolenic C 18:3n-6 γ 0.49Linolenic C18:3n-3 α 2.00Arachidic C 20:0 0.86Gadoleic C 20:1n-9 0.22Benhenic C 22:0 0.42Lignoceric C 24:0 -Sum 93.65Sat a 27.61P/S ratio b 1.07a Sum of C +C + C +C +C b Polyunsatura t ed14:0 16: 0 18:0 20:0 22:0,(C16: 2+C 18:2 +C 18:3 / Saturated (C 16:0 +C 18:0 +C 20:0 +C 22:0 +C 24:0 ),*Mean of two independent analysessources (Sinclair, 1964), the baobab seed oil maynot be considered a good source of essential fattyacids.Results of the feeding experiment (Table5) showed total weight gain, feed and proteinintakes (13.45, 70.40 and 8.42 g respectively) ofrats maintained on the raw meal were statisticallysimilar (P < 0.01) to those on the casein controldiet (17.70, 71.53 and 7.15 g respectively). Ratson the raw meal recorded a significantly (P
EZEAGU, Ikechukwu Edwin 244Table 5: Protein quality indices of raw and processed baobab seed mealDietsWeightgain (g)Feedintake (g)Proteinintake (g)PER NPR TD%Casein 17.70 ±1.71 a 71.53±4.71 a 7.15±0.47 ab 2.47±0.08 a 3.07±2.34 a 93.17±5.37 aRaw 13.45 ±2.64 a 70.40±4.14 a 8.42±1.26 a 1.63±0.29 b 2.18±2.96 a 80.64±15.23 aCooked 9.80 ± 1.27 b 62.90±4.98 a 6.29±0.47 b 1.57±0.21 b 2.28±2.48 a 85.53±1.49 aHCl-Extracted 3.53 ± 3.07 c 59.88±10.09 b 6.35±0.99 b 0.49±0.62 c 0.69±7.90 b 79.91±1.69 babc (Means no t followed by the same subscrip t on the same column are significantly diff erent (P
Baobab seed protein utilization in young albino rats 245KAKADE, M. L., RACKIS, J. J., MCGHEE, J. E. andPUSKI, G. (1974). Determination oftrypsin inhibitor activity of soy products: Acollaborative analysis of an improvedprocedure. Cereal Chemistry, 51: 376 -382.KALENGA, K., HOOD, L. F. and VANSOEST, P. J.(1981) Characterisation of starch and fibreof banana fruit. Journal of Food Science,46: 1885 - 1890.KAWATRA, B. L., GARCHA, J. S. and WAGLE, B. S.(1969). Studies on Guar (Cyamopsistetragoloba). Journal of Nutrition andDietetics, 6: 91 – 97.LIENER, I. E. and HILL, E. G. (1953). The effect ofheat treatment on the nutritive value andhaemagglutinating activity of soybean oilmeal. Journal of Nutrition, 49: 609 – 619.LONGVAH, T., DEOSTHALE, Y. G. and KUMAR, P.U. (2000). Nutritional and short-termtoxicological evaluation of perilla seed oil.Food Chemistry, 70: 13 - 16.MADUBUIKE, F. N., OJIMELUKWE, P. C. and AJAH,P. O. (1994). Proximate composition,energy content and physicochemicalproperties of Afzelia africana andBrachystegia eurycoma seeds. PlantsFoods for Human Nutrition, 46: 339 - 334.MILLER, D. S. (1963). A procedure fordetermination of NPU using rat bodytechnique. Pages 34 – 36. In: Evaluationof Protein Quality. National AcademyScience (NRC), Washington DC, USA.MURRAY, S. S., SCHOENINGER, M. J., BUNN, H.T., PICKERING, T. R. and MARLETT, J. A.(2001). Nutritional composition of somewild plant foods and honey used by Hadzaforagers of Tanzania. Journal of FoodComposition and Analysis, 14: 3 - 13.NORDEIDE, M. B., HATLOG, A., FOLLING, M.,LIED, E. and OSHANG, A. (1994). Nutrientcomposition and nutritional importance ofgreen leaves and wild food resources inan agricultural district, Koutiala, inSouthern Mali. International Journal ofFood Science and Nutrition, 47(6): 455 -468.NOUR, A. A., MAGBOUL, B. I. and KHEIRI, N. H.(1980). Chemical composition of baobabfruit (Adansonia digitata L.). TropicalScience, 22: 383 – 388.OBIZOBA, I. C. and ANYIKA, J. U. (1994). Nutritivevalue of baobab milk (gubdi) and mixturesof baobab (Adansonia digitata L.) andhungry rice acha (Digerati exilis) flours.Plant Foods for Human Nutrition, 46: 157– 165.OELKE, E. A., PORTER, R. A., GROMBACHE,R A.W. and ADDIS, P. B. (1997). Wild rice –New interest in an old crop. Cereal FoodsWorld, 42(4): 234 - 247.PELLET, P. L. and YOUNG, V. R. (1980). Nutritionalevaluation of protein foods. UN UniversityFood Nutrition Bulletin, (Supplementary 4):PETZKE, K. J., EZEAGU, I. E., PROLL, J.,AKINSOYINU, A. O. and METGES, C. C.(1997). Amino acid composition, availablelysine content and in vitro proteindigestibility of selected tropical crop seeds.Plant Foods for Human Nutrition, 50: 151 –162.PROLL, J., PETZKE, K. J., EZEAGU, I. E. and METGES,C. C. (1998). Low nutritional quality ofunconventional tropical crop seeds in rats.Journal of Nutrition, 128: 2014 – 2022.RACKIS, J. J. and ANDERSON, R. L. (1977). Mineralavailability in soy protein products. FoodProducts Development, 11: 44 – 47.RAO, P. V. and HAHN, S. K. (1984). An automatedenzymatic assay for determining the cyanidecontent of cassava products. Journal o fScience of Food and Agriculture, 35: 426 –436.SCHULTE, E. and WEBER, K. (1989). SchnelleHerstellung der Fettsäuremethyester ausFetten mit Trimethysulfoniumhydroxid oderNatriummethylat. Fat Science andTechnology, 91: 181 – 183.SINCLAIR, H. M. (1964). Carbohydrate and fats.Pages 41 - 56. In: BEATON, G. H. andMCHENRY, E. W. (Eds.). Nutrition, <strong>Volume</strong>1, Academic Press, New York.TASNEEM, R. and SUBRAMANIAN, N. (1986).Nutritional quality of detoxified Guar(Cyamopsis tetragonoloba) meal. Journal o fAgriculture, Food and Chemistry, 34: 853 –857.TASNEEM, R., RAMAMANI, S. and SUBRAMANIAN, N.(1982). Functional properties of Guar seed(Cyamopsis tetragonoloba) meal detoxifiedby different methods. Journal of FoodScience, 47: 1323 – 1328.VIETMEYER, N. and JANICK, J. (1996). New crops.Pages 2 – 8. In: Proceedings of the ThirdNational Symposium of American Society ofHorticultural Scientist, Alexandria, USA, 22 –25 October 1996.WHEELER, E. L. and FERREL, R. E. (1971). A methodfor phytic acid determination in wheat andwheat fractions. Cereal Chemistry. 48: 312 –320.WICKENS, G. E. (1980). The use of the baobab (A.digitata L) in Africa. Page xx – zz. In: LEHOUEROU, H. N. (Ed.). Browse in Africa:The current state of knowledge. ILCA, AddisAbaba, Ethiopia.YAZZIE, D., VANDERJAGT, D., PASTUSZYN, A.,OKOLO, A. and GLEW R. H. (1994). Theamino acid and mineral content of baobab(Adansonia digitata L) leaves. Journal o fFood Composition and Analysis, 7: 189 -193.
Animal Research International (2005) 2(1): 246 – 251 246EFFECT of Dermestes maculatus INFESTATION ON SOME NUTRITIONALCOMPOSITION OF SMOKED AFRICAN CATFISH, Clarias gariepinusBURCHELL, 18221 UGWU, Lawrence Linus Chukwuma, 2 NWAMBA, Helen Ogochukwu and 2 KANNO, LindaUchenna1 Department of Animal Production and Fisheries Management, Ebonyi State University, Abakaliki, Nigeria2 Department of Applied Biology, Enugu State University of Science and Technology, Enugu, Enugu State,NigeriaCorresponding author: Dr. UGWU, L. L. C., Department of Animal Production and FisheriesManagement, Ebonyi State University, P.M.B.053, Abakaliki, Ebonyi State. NigeriaABSTRACTStudies on pest infestation of some nutritional composition of smoked-dried Clariasgariepinus were carried out, to assess the effect of exposing preserved fish products todifferent levels of infestation by Dermestes maculatus and the resultant effect on pH, crudeprotein (CP), free fatty acid (FFA) and tissue contents. Graded levels (5, 10 and 15) of larvaland adult D. maculatus were used to infest pieces of C. gariepinus placed in 7 groups of 3bottles per group. The experiment lasted 8 weeks (56days). There were consistent decreasesin the pH and CP as well as the tissue contents of fish with storage time, although the CPcontent o f the samples with the larval pests did not differ significantly from those withoutlarval pests (P > 0.05). Fish samples exposed to adult pests showed significant variation (P 0.05). The longer the storage periods of the infested smoked fish the morethe tissue was degraded.Keywords: Dermestes maculatus, Clarias gariepinus infestationINTRODUCTIONThe African catfish, genus Clarias has very highcommercial value in Nigeria owing to its flavourand taste. The good quality coupled with its abilityto feed on virtually anything makes the fish ahighly recommended species for aquaculturedevelopment in Nigeria (Reed et al., 1967; Bard etal., 1976; Olatunde, 1983).The phenomenon of fish preservation isenunciated by the simple principle of making fishunfavourable for the growth of spoilage<strong>org</strong>anisms. In Nigeria, fish drying is the mostadopted technique since it is within the socioeconomiclevels of artisanal fishermen contributingover 90% of domestic fish supply (Mabawonkuand Ajayi, 1982). Many materials subjecting fish todifferent preservation techniques notably:traditional smoking, traditional solar drying, ovenand Ife solar drying have been carried out (Afolabiet al., 1984). Analyses of the preserved fishshowed the occurrence of a high proportion ofpredominantly unsaturated fatty acids in oven andIfe solar-dried fish compared to the traditionallysmoke-dried fish. In spite of the shortcoming,there is an insatiable market for dried fish productsin the country.An estimated 95% of the total artisanalfish landings are smoked or sun-dried; theproblem of large scale infestation often results inmore than 50% losses due to inadequatepackaging and storage (Moses, 1983). The need tofurther investigate the extent and rate of damageof the nutritional quality of dried fish productsbecomes imminent. Studies on the action of D.maculatus as a pest of dried fish and meat inNigeria and Zambia have been carried out (Osuji,1975; Proctor, 1977). Although much work hasbeen done on the prevalence and rate ofdegradation of this pest to host species, little hasbeen done on the effect of pest infestation onnutritional quality of Clarias gariepinus. Theobjective of this study therefore was to determinethe effect of varying levels of pest infestation onthe crude protein, free fatty acid, pH and tissuedegradation of smoked C. gariepinus.MATERIALS AND METHODSFish Collection and Preservation: Twenty-one(21) live specimens (450 ± 2.30g) of Africancatfish, C. gariepinus (Burchell, 1822) were boughtfrom Artisan market, Enugu, Nigeria. The PracticalManual for the Culture o f the African Catfish,
247Clarias gariepinus. (Viveen et al., 1986) was usedin the identification of the fish specimens. Thespecimens were later killed, gutted anddecapitated. The carcasses were cut into smallpieces, washed thoroughly with water andimmersed in 20% saline solution for 10 minutes inaccordance with the methods specified by Horn(1974). The immersion in salt solution was toreduce the water activity (A w ) in the specimensand retard microbial development. They weresubsequently smoked over a smoking kiln for 48hours at 87 0 C, packed into small polythene bagsand kept in the Research Laboratory of EnuguState University of Science and Technology,Enugu.Collection of D. maculatus: D. maculatus wereobtained from 10kg of heavily infested dried C.gariepinus purchased from fish sellers at Enugumain market, Enugu, Nigeria. The larval and adultstages of this pest were disengaged from thetissues and placed in 21 clean reagent bottles(500ml) with perforated covers. In the laboratory,the pests were placed in another set of 21 cleanreagent bottles (50ml) whose open ends werecovered with mosquito-mesh nets.Infestation of C. gariepinus with D.maculatus: The study was designed to havesmoked pieces of C. gariepinus (0.50 kg)subjected to four treatment groups (A, B, C and D)of pest infestation. Group A represented thecontrol with no pest infestation, while groups B, Cand D represented low (LI), medium (MI) and high(HI) infestations of both the adult and larvalstages of D. maculatus. Both the control (A) andthe pest infested treatments (B, C and D) werereplicated thrice to give a total of 21experimental replicates.Smoked pieces of C. gariepinus (10.50 kg)were measured out with a chemical balance andrandomly placed in 21 clean reagent bottles (500ml) at 0.50 kg of fish per bottle. Fish samplescontained in 3 bottles under group B were infestedwith 5 adult D. maculatus while the remaining 3bottles (under the same group) were infested with5 larval pests. This level of infestation wasregarded as low infestation (LI). Fish samplesunder group C were infested with 10 adult pests (3bottles) and 10 larval pests (3 bottles) and thiswas also regarded as medium infestation (MI).Fish samples in group D were infested with 15adult pests (3 bottles) and 15 larval pests (3bottles) regarded as high infestation (HI). Group Afish samples (3 bottles) were uninfested andserved as the control. Each group of bottles withinfested fish samples was appropriately labelledaccording to treatment and left for investigationfor 56 days.Fish samples from each bottle weredisengaged from larval and adult pests every 2weeks (14 days), weighed and analysed chemicallyfor crude protein (AOAC, 1995), free fatty acid(Marinetti,1967) and pH using a pH meter.Chemical Analysis: Fat contents of fish sampleswere extracted by Bligh and Dyer (1959) method.The fatty acids were determined by gas-lipidchromatography (GLC) through esterification byrefluxing in 4% sulphuric acid (H 2 SO 4 ) andmethylation with methyl-hydroxide (MeOH) for 16hat 79 0 C (Marinetti, 1967). Complete esterificationwas confirmed by thin layer chromatography (TLC)on silica gel G plates using a solution of petroleumether, diethyl ether, and acetic acid (90:10:1) assolvent system.Total nitrogen was measured by microkjeldahlmethod and the crude protein contentdetermined by multiplying by 6.25 (AOAC, 1995).The pH was determined with a pH meterimmersed in a suspension of finely ground fishsamples. All the data obtained were subjected toanalysis of variance to determine the levels ofsignificance (Steel and Torrie, 1990).RESULTSThe crude protein (CP) content of C. gariepinusexposed to larvae of D. maculatus decreasedconsistently from a pre-infestation protein value of78.52% to a least value of 45.23 % (Table 1). Thisresult varied with smoked fish sample exposed toadult pest and whose crude protein contentdecreased from 78.52 % to 38.10 % within 8weeks (56 days) experimental period. The least CPcontent was found in the control experiment after8 weeks (56 days). This was compared to the leastCP value (45.23 %) for high larval infestation (HI)and 53.61 % for medium larval infestation (MI)(Table 1). There was no significant difference F(4,8) = 1.36 (P > 0.5) in the CP content betweenvarious levels of larval infestation. However, therewas a significant difference F (4, 8) = 9.84 (P
248Table 1: Percentage (%) mean crude protein of smoked C. gariepinus infested with D.maculatusTreatmentsWeeks of Study0 2 4 6 8LarvaeAdultsL1 78.52 ± 0.14 72.62 ± 0.25 68.40 ± 0.24 66.40 ± 0.09 61.20 ± 0.39M1 78.52 ± 0.13 70.32 ± 0.19 67.01 ± 0.32 55.78 ± 0.49 53.61 ± 0.59H1 78.52 ± 0.35 71.20 ± 0.65 69.14 ± 0.47 48.10 ± 0.18 45.23 ± 0.16F (4,8) = 1.36 (P > 0.05)LI 78.52 ± 0.18 61.22 ± 0.23 61.25 ± 0.18 58.46 ± 0.28 55.03 ± 0.05MI 78.52 ± 0.45 67.50 ± 0.37 60.02 ± 0.48 56.74 ± 0.66 43.72 ± 0.48HI 78.52 ± 0.36 60.04 ± 0.36 46.02 ± 0.34 43.72 ± 0.44 38.10 ± 0.26F (4,8) = 9.84 (P < 0.05)CTRL 78.52 ± 0.12 66.04 ± 0.66 55.87 ± 0.45 52.81 ± 0.56 45.81± 0.27LI= low infestation, MI =medium infestation, HI = high infestation, CTRL = controlTable 2: Mean weight losses (g) of smoked C. gariepinus infested with D. maculatusTreatmentsWeeks of Study0 2 4 6 8LarvaeLI 15.46 ± 0.34 14.26 ± 0.41 13.06 ± 0.14 10.66 ± 0.31 9.47 ± 0.22MI 15.46 ± 0.26 13.06 ± 0.47 10.86 ± 0.47 9.30 ± 0.27 6.80 ± 0.45HI 15.46 ± 0.55 11.66 ± 0.24 9.86 ± 0.24 7.86 ± 0.47 4.68 ± 0.10F - value (treatment) = 5.91 (P > 0.05); F - value (period) = 82.92 (P > 0.01)AdultsLI 15.46 ± 0.08 13.66 ± 0.27 11.94 ± 0.34 10.59 ± 0.31 7.38 ± 0.40MI 15.46 ± 0.45 12.48 ± 0.36 10.81 ± 0.48 7.80 ± 0.41 5.39 ± 0.31HI 15.46 ± 0.35 12.96 ± 0.23 10.10 ± 0.22 7.34 ± 0.51 3.40 ± 0.41F - value (treatment) = 132.97 (P < 0.01); F-Value (period) = 3.63 (P < 0.05)CTRL 15.45 ± 0.35 15.43 ± 0.54 15.37±0.41 15.32±0.35 15.32 ± 0.35F - value (treatment) = 4.63 (P < 0.05); F-value (period) = 135.97 (P < 0.01)LI = Low infestation, MI = Medium infestation, HI= High infestation, CTRL = controlTable 3: Free fatty acids (as % total fatty acid weight) of total lipids of smoked C. gariepinussubjected to various levels of D. maculates infestation.TreatmentsWeeks of Study0 2 4 6 8LarvaeLI 8.42 ± 0.13 9.15 ± 0.16 12.17 ± 0.32 16.96 ± 0.07 18.36 ± 0.14MI 8.42 ± 0.28 10.85 ± 0.18 12.43 ± 0.21 15.97 ± 0.17 18.01 ± 0.58HI 8.42 ± 0.15 9.36 ± 0.18 14.60 ± 0.20 18.71 ± 0.35 20.87 ± 0.43F - value (treatment) = 1.23 (P > 0.05); F-Value (period) = 108.38 (P < 0.01)AdultsLI 8.42 ± 0.32 9.14 ± 0.66 11.25 ± 0.40 15.64 ± 0.32 19.50 ± 0.19MI 8.42 ± 0.11 10.20 ± 0.33 13.03 ± 0.58 16.58 ± 0.26 20.00 ± 0.59HI 8.42 ± 0.21 10.35 ± 0.43 13.48 ± 0.57 16.74 ± 0.35 21.78 ± 0.38F - Value (treatment ) = 3.89 (P < 0.05) ; F - Value (period) = 398.25 (P < 0.01)CRTL 8.42 ± 0.05 9.00 ± 0.12 12.70 ± 0.10 16.30 ± 0.40 20.10 ± 0.30F - Value (treatment) =3.82 (P < 0.05); F- Value (period) = 39.4 (P < 0.01)LI = Low infestation, MI = medium infestation, HI = High infestation, CTRL = Controlsignificant difference between these values andstorage period (P < 0.05). However, no significantdifference was obtained for fish infestation levels(P > 0.05)The quantity of free fatty acids in C.gariepinus in response to the period of exposure toinfestation of larval and adult D. maculatus ispresented in Table 3. The result of the controlexperiment is also presented. The highest meanvalue of 21.78 ± 0.43 % is obtained from larvalinfestation. Two-way analysis of variance revealeda significant effect (P > 0.05) of both larval andadult infestation levels over storage time.However, the different levels of larval treatment
249Table 4: Percentage (%) total lipids of smoked C. gariepinus infested with D. maculatusTreatmentsweeks of study0 2 4 6 8LarvaeLI 8.60 ± 0.12 8.69 ± 0.14 8.05 ± 0.29 8.40 ± 0.08 8.70 ± 0.16MI 9.31 ± 0.16 8.71 ± 0.26 8.71 ± 0.22 8.61 ± 0.18 8.71 ± 0.56HI 8.60 ± 0.15 8.60 ± 0.18 8.73 ± 0.21 8.70 ± 0.36 8.70 ± 0.45F - value (treatment) = 1.60 (P > 0.05); F-value (period) = 38.77 (P < 0.01)AdultsLI 8.39 ± 0.32 8.64 ± 0.64 8.72 ± 0.38 8.59 ± 0.33 8.60 ± 0.18MI 6.73 ± 0.43 6.88 ± 0.32 6.94 ± 0.56 7.02 ± 0.24 7.58 ± 0.57HI 6.24 ± 0.54 6.64 ± 0.41 6.98 ± 0.58 7.07 ± 0.35 7.46 ± 0.30F-value (treatment) = 2.63 (P < 0.05); F-Value (period) = 49.79 (P < 0.01)CTRL 6.68 ± 0.44 6.96 ± 0.42 7.24 ± 0.36 7.13 ± 0.32 7.49 ± 0.31F-value (treatment) = 3.38 (P < 0.05); F- Value (period) = 37.45 (P < 0.01)LI = Low infestation, MI = medium infestation, HI= High infestation, CTRL= controlTable 5: Mean pH values of smoked C. gariepinus infested with D. maculatusTreatmentsWeeks of Study0 2 4 6 8LarvaeLI 6.70 ± 0.01 6.55 ± 0.04 6.51 ± 0.04 6.47 ± 0.01 6.02 ± 0.04MI 6.70 ± 0.03 6.66 ± 0.01 6.40 ± 0.05 6.14 ± 0.02 6.93 ± 0.02HI 6.70 ± 0.10 6.54 ± 0.02 6.31 ± 0.04 6.17 ± 0.03 6.01 ± 0.08F-Value (treatment) = 1.25 (P > 0.05); F-Value (period) = 61.25 (P < 0.01)AdultsLI 6.70 ± 0.50 6.42 ± 0.01 6.33 ± 0.15 6.04± 0.20 5.87 ± 0.07MI 6.70 ± 0.60 6.54 ± 0.17 6.28 ± 0.12 6.17 ± 0.38 5.91 ± 0.28HI 6.70 ± 0.37 6.41 ± 0.18 6.29 ± 0.32 6.00 ± 0.54 5.86 ± 0.45F-Value (treatment) = 1.00 (P < 0.01) ; F-Value (period) = 62.00 (P < 0.01)CTRL 6.59 ± 0.06 6.43 ± 0.23 6.27 ± 0.10 6.02 ± 0.12 6.02 ± 0.12F-value (treatment) = 3.00 (P < 0.05); F- value (Period) = 44 (P < 0.01)LI = Low infestation, MI = medium infestation, HI= High infestation, CTRL= controldid not effect any significant difference in thequantity of free fatty acid in the smoked fish (P >0.05) (Table 3). The smoked C. gariepinusresponded similarly to larval and adult infestationswith regard to its percent total lipids content(Table 4). The values of the lipids weresignificantly different with storage period both forthe larval and adult infestation (P < 0.01) (Table4). The values of the total lipids were significantlydifference with storage period both for the larvaland adult infestations (P < 0.01) (Table 4). Thevalues of the total lipids were not significantlyaffected by levels of larval treatments (P > 0.05)but by adult treatments (P < 0.05). Contrary towhat obtained for the free fatty acids, the highestmean value of total lipids (9.31± 0.16%) wasrecorded with larval infestation (Table 4).Table 5 which shows the mean variationsin pH values of fish infested with larval and adultD. maculatus varied from a pre-infested value of7.00 to a reduced value of 6.01± 0.08 (for larvalinfestation) and 5.86 ± 0.04 (for adult infestation).A least pH value of 6.02 ± 0.12 was recorded forfish under the control experiment. Both larval andadult infestations of the fish affected significantlythe pH value of the fish with storage period (P 0.05) whereas adult infestationssignificantly affected the pH values of the fish (P
250breakdown proteins into peptones, polypeptidesand amino acids resulting in fish deterioration(FAO, 1968).The result of fish tissue degradation led toloss in weight of smoked C. gariepinus (Table 2).C. gariepinus infested with adult D. maculatussuffered the greatest loss in tissue weight contraryto Osuji (1975) and Nduh (1984) views that thelarvae of D. maculatus are the most destructive ofdried stored fish products. The well-developedbiting mouth-parts of adult D. maculatus incomparism with those of the larvae must havecontributed to the rapid loss in tissue weight offish samples infested with the adults in this study.The reason was that the well-developed mouthpartsof the adults conferred on them a moredestructive tendency than the larvae.The treatment of smoked fish samples tovarying levels of larval infestation did not affectthe free fatty acids (FFA) (Table 3) and percenttotal lipids (% TL) (Table 4) of the tissue. FFA and% TL of fish infested by both larval and adultpests increased with prolonged period of storage.These results compared favourably with theobservations made by Olley and Watson (1962)and Nduh (1984) that attributed these increases tothe hydrolysis of Phospholipids by lipases and alsoagreed with Chen et al. (1974) report that duringstorage, fats become rancid owing to peroxideformations at the double bond by atmosphericoxygen. The authors further stated that ranciditymay also be as a result of hydrolytic breakdown bymicro-<strong>org</strong>anisms leading to the liberation of freefatty acids.The pH of the infested fish samples andthe control decreased with periods of storage(Table 5). This was probably due to variations inthe storage medium, which enhanced fastactivities and the release of metabolic by-products(CO 2 , urea and uric acid) from the pests. Thisdecrease in pH could have prevented theproliferation of pathogenic micro-<strong>org</strong>anisms suchas Clostridium botulinum and Bacilliusstearothermophilus. The result was the abundanceof pest food for healthy growth of the pests, aswell as the gycolytic breakdown of fish tissue togive lactic acid. This assertion is in accordancewith the views of Frazier (1976), who reported adecrease in pH post-mortem fish tissues owing toglycolysis. This study, however, varied with that ofEmokpae (1978) who reported an increase in pHof smoked C. gariepinus: something he attributedto the breakdown of protein to amino acids andconsequently to ammonia.Conclusion: The results of this study showed thatthe crude protein contents of infested fishdecreased with increase in storage time. This maybe attributed to the activities of certain micro<strong>org</strong>anismswhich facilitated enzymatic breakdownof proteins to amino acids. Storage time may bedue to the oxidation of fats to fatty acids resultingin rancidity. In addition, the decrease in pH valuesof infested fish was attributed to the metabolic byproducts(CO 2 , urea and uric acid) by micro<strong>org</strong>anismsin the fish tissue. Tissue degradation ofsmoked fish samples was related to the infestationlevels and exposure time. Thus, the longer theperiods of storage of infested smoked fish themore the tissues are degraded.ACKNOWLEDGEMENTThe authors wish to acknowledge the contributionsof the following persons towards the successfulexecution of the research: Dr. C. E. Eze, Head ofDepartment, Applied Biology, Enugu StateUniversity of Science and Technology, Enugu; whoprovided necessary laboratory facilities for thestudy; Professor Okonkwo, Dean of the Faculty ofNatural Sciences of the same institution, whooffered useful advice. We are extremely grateful tothem.REFERENCESAFOLABI, A. O., OMOSOLA, A. A. and OKE, O. L.(1984). Quality changes of Nigeriantraditionally processed freshwater fishspecies. 1. Nutritive and <strong>org</strong>anolepticchanges. Journal of Food Technology, 19:333 – 340.AOAC (1995). Official Methods of Analysis of theAOAC, 16 th Edition, Association of OfficialAnalytical Chemists, Washington DC, USA.928 pBARD, J., DE KIMPE, P., LAZARD, J., LEMASSON,J. and LESSENT, P. (1976). Handbook o ftropical fish culture. Centre TechniqueFrostier Tropical, 45 bis, avenue, de caBelle Gabrielle 94130, Nogent–Sur marine,France. 90 pp.BLIGH, E. G. and DYER, W. J. (1959). A rapidmethod of total lipid extraction andpurification. Canadian Journal ofBiochemistry and Physiology, 37: 911 –917.CHEN, F. C., WAREN, W. and LEVIN, R. E. (1974).Identification of major high boiling volatilecompounds produced during refrigeratedstorage of gaddock fillets. Appliedmicrobiology, 28: 680 – 769.EMOKPAE, A. O. (1978). Organoleptic assessmentof the quality of fresh fish. Pages 12 – 15.In: 1978 Annual Report of NigeriaInstitute of Oceanography and MarineResearch (NIOMR), Lagos, Nigeria.FAO (1968). Ice in fisheries. Food and AgriculturalOrganization. FAO Fisheries Report Series ,59: 1 – 68.
251FRAZIER, W. C. (1976). Food microbiology. Mc-Graw Hill Book Co. New York. 285 pp.HORN, H. J. (1974). Processing of lake Tanganyikasardines in Burundi. Pages 218 – 221. In:KRENZER, R. (ed). Fisher y Products .Fishing News Books, Survey, England.MABAWONKU, A. F. and AJAYI, T. O. (1982).Economic survey of artisanal fisheries inBendel, Cross River, Lagos, Ogun, Ondoand Rivers State. Pages 64 – 76. In:Proceeding of the National Seminar onIntegrated Development of Artisanal andInshore Fisheries in Nigeria, FederalDevelopment of Fisheries, Lagos, Nigeria.M<strong>ARI</strong>NETTI, G. C. (1967). Lipid chromatographicanalysis. <strong>Volume</strong>s 1 and 2, Marcel Decker,Incorporated, New York.MOSES, B. S. (1982). Problems and prospects ofartisanal fisheries in Nigeria. Pages 76 –90. In: Proceedings of Second AnnualConference o f the Fisheries Society ofNigeria (FISON). Calabar, January, 1982.NDUH, T. A. (1984). Insect pests of dried fish soldin Jos Metropolitan market. MSc. Thesis,University of Jos, Nigeria, 126 pp.OLATUNDE, A. A. (1983). Strategies for increasingfreshwater fish production in the GreenRevolution Programme. Pages 70 – 75.In: Proceedings of Second AnnualConference o f the Fisheries Society ofNigeria (FISON). Calabar, January, 1982.OLLEY, J. and WATSON, H. (1962). Phospholipidsactivity in herring muscle. Pages 56 – 66.In: LEITH, J. M.(ed). Proceeding of theFirst International Conference of FoodScience and Technology. Gordon andBreach Publication Limited, London.OSUJI, F. U. C. (1975). Recent studies on beetleinfestation of dried fish in Nigeria withreference to Lake Chad district.Nigerian Journal of Entomology, 1: 63 -68.PROCTOR, D. L. (1977). The protection of smokeddried freshwater fish from insect damageduring storage in Zambia. Journal ofStored Products Research, 8: 139 -149.REED, W., BURCHAR, J., HOPSON, A. J.,JONATHAN, J. and IBRAHIM, Y. (1967).Fish and Fisheries of Northern Nigeria.Government Press, London. 226 pp.SHEWAN, J. M. (1961). The microbiology of waterfish. Pages 487 – 560. In: G.BERGSTORM (ed). Fish as Food. AcademicPress Incorporated, New York.STEEL, R. G. D. and TORRIE, J. H. (1990).Principles and Procedures o f Statistics, ABiometrical Approach.. 2 nd edition, McGraw-Hill Books, Tokyo, Japan. 633 pp.VIVEEN, W. J. A. R., RICHTER, C .J. J., VANOORDT, P. G. W. J., JANSEEN, J. A. L.and HUISMAN, E. A. (1986). PracticalManual for the Culture o f the Africancatfish, Clarias gariepinus
Animal Research International (2005) 2(1): 252 – 254 252THE EFFECT OF SALINITY STRESS ON BUCCAL VENTILATORY RATE IN THEAFRICAN LUNGFISH, Protopterus annectens OWEN1 OKAFOR, Anthony Ikechukwu and 2 CHUKWU, Lucian Obinnaya1 Department of <strong>Zoo</strong>logy, University of Lagos, Lagos, Nigeria2 Department of Marine Sciences, University of Lagos, Lagos, NigeriaCorresponding Author: Dr. OKAFOR, Anthony Ikechukwu, Department of <strong>Zoo</strong>logy, University of Lagos,Lagos, NigeriaABSTRACTThe buccal ventilatory rate of the African lungfish, Protopterus annectens (Owen) followingacclimation to diluted seawater was investigated under laboratory conditions for si x days .Healthy adult specimens of African lungfish, Protopterus annectens (Owen) (mean weight299.4g and mean length 38.9 cm) procured from Anambra river at Otuocha were subjected tothe following concentrations of dilute seawater: 0%, 5% (s = 1.8‰o), 10% (s = 3.5‰),15% (s = 5.3‰), 20% (s = 7.0 ‰), 30% (s = 10.5 ‰) and 40% (s = 14.0 ‰)respectively. The results revealed that increase in salinity had a significant positive correlation(r = 0.92, p < 0.05) with increase in buccal ventilatory rate. The mean least and highestbuccal ventilatory rates were 5.32 and 12.26 times per hour at 1.8%o and 14.0%o salinitiesrespectively. The implications of the findings for the culture of this fish species in estuarineecosystems are discussed.Keywords: Salinity Stress, Buccal Ventilation, Protopterus annectensINTRODUCTIONThe African lungfish, P . annectens lives in shallowparts of West African rivers and lakes Their rangeof distribution spreads from Nigeria to Senegal andbeyond on the West African coast line. (Dupe andGodet, 1969; Dupe, 1973; Daffala et al., 1985;Otuogbai and Ikhenoba, 2001; Okafor and Odiete,2002 a, b). Recent studies show that it cantolerate seawater up to a maximum of 30%(Okafor, 2004). Thus, the fish has got thepotential of being cultured in brackish water.When some fresh water fish species are cultivatedin brackish water, they exhibit enhanced hatching,growth and survival rates (Canagaratnam, 1959;Otto, 1971; Nwigwe, 1985; Sugiyama, 2002).Consequently, there is the need to evaluate thephysiological adjustments which P. annectens canmake whilst subjected to brackish water regimes.The paper therefore determines changes in buccalventilatory rate of P. annectens subjected todifferent concentrations of diluted seawater. Theinformation obtained may serve as guidelines forstudies on the osmoregulatory abilities of thespecies in estuarine ecosystems.MATERIALS AND METHODSLive fish specimens of the African lungfish P.annectens procured from Anambra river atOtuocha in Anambra State of Nigeria weretransported to the <strong>Zoo</strong>logy laboratory of theUniversity of Lagos, Lagos, Nigeria and acclimatedat room temperature for 28 days inside eight glasstanks that measured 0.54 x 0.30 x 0.30 m whichwere neither covered nor aerated. Each tankcontained 3 litres of dechlorinated water. The fishwere fed daily on fish feed obtained from theNigerian Institute of Oceanography and MarineResearch (NIOMR), Victoria Island, Lagos, adlibitum until used for the experiment.The water in all tanks was changed twiceweekly to prevent the accumulation of wastematerials, uneaten food and the fish’s mucoussecretions. Seawater was collected at high andlow tides from the Bar Beach (Atlantic Ocean) atVictoria Island, Lagos and filtered through a fine0.5 mm sieve.Three litres of each of the percentages ofthe seawater were prepared thus: 0%, 5% (s =1.8 ‰), 10% (s = 3.5 ‰), 15 % (s = 5.3 ‰),20% (s = 7.0 ‰), 30% (s = 10.5 ‰) and 40 %(s = 14.0 ‰) by diluting seawater of 100%salinity (s = 35 ‰) with an appropriate volume ofdechlorinated water. The salinity of each prepareddiluted seawater was determined using asalinometer (Table 1).Seawater above 40 % in concentrationwas not prepared since P. annectens tolerates30% seawater indefinitely and 40% seawater foronly about 4 to 5 days (Okafor, 2004).Fourteen specimens of P. annectenschosen from amongst those that survivedacclimation were now introduced into seven glasstanks containing the above concentrations of
Salinity stress and buccal ventilatory rate in African lungfish 253Table 1: The salinities (%o) of the various concentrations of dilute seawater that werepreparedPrepared seawaterConcentration (%)Corresponding salinity(%o)<strong>Volume</strong> of dechlorinatedWater (litres)<strong>Volume</strong> of100% seawater (35 %o)40302015105014.0010.507.005.303.501.800.001.802.102.402.552.702.853.001.200.900.600.450.300.150.00diluted seawater at a stocking rate of twospecimens per tank.Buccal Ventilatory Rate: Only healthy andactive fishes with no external signs of disease orphysical injuries were selected for the experiment.The buccal ventilatory rate was estimated as thenumber of times each fish would remove its headout of the water, opened its mouth in order tobreathe atmospheric oxygen, closed it and dippedits head back into the water, within an hour. Thiswas repeated five times and the mean valuesnoted.RESULTSIncrease in salinity was directly correlated withincrease in buccal ventilatory rate Coefficient oflinear correlation r = 0.9162767 at 0.05 probability(Figure 1). At 0 %, 5%, 10 %, 15 %, 20 %, 30 %and 40 % salinities, the mean buccal ventilatoryrates were 4.04, 5.32, 6.39, 7.50, 9.86, 10.16 and12.26 respectively.Mean rates of buccalventilation141210864200 20 40 60Concentrations of dilutedseawaterFigure 1: The mean rates ofbuccal ventilation at variousconcentrations of dilutedseawaterDISCUSSIONThe result clearly indicates a positive linearcorrelation between salinity and buccal ventilatoryrate. Holliday (1969) reported reduction in oxygencontent of saline waters. The present study opinedthat the increased buccal ventilatory rate whenimmersed in saline water could be a means ofincreasing the total amount of oxygen that wouldreach the tissues via the lungs since the amountreceived from the saline water via the gills washighly reduced.Similar findings have been documented byEnajekpo (1989), Ebele et al. (1990), Onusiriukaand Ufodioke (1994), Chukwu (2001) and Chukwuand Ugbeva (2003). For example, Enajekpo (1989)reported an increase in respiration rate (opercularventilation) in Tilapia zilli and Oreochromisniloticus exposed to sublethal concentrations ofwater soluble fractions of Bonny light crude.Thus in the attempt to culture P.annectens in brackish or estuarine waters, farmersshould put into consideration the increaseddemand for atmospheric oxygen in the newhabitats. Since this process requires theexpenditure of energy, this may be compensatedby increasing the rate of feeding.There is no lungfish that naturally inhabitsbrackish or estuarine waters within this Cenozoicera. However, fossil records have established thatlungfishes that lived during the Permian,Carboniferous and Devonian periods such asGnathorhiza, Megapleuron and Soederberghiawere estuarine and shallow marine dwellers(Carroll, 1988; Ahlberg, et al., 2003).Soederberghia gulped air and probably inhabited ashallow near-shore marine environment (Ahlberg,et al., 2003). The occurrence of Soederberghiagroenlandica in the Famennian old red sandstoneof North America, Greenland and Australiarespectively thus furnishes evidence of contact orclose proximity between North and South Pangaeaduring the Palaezoic era (Ahlberg et al., 2003). Infact the evolution of air breathing by lungfisheshas traditionally been associated with their entryinto freshwaters (Carroll, 1988).REFERENCESAHLBERG, P. E., JOHANSEN, Z., ZERINA, J., andDAESCHLER, E. B. (2003). The lateDevonian lungfish, Soederberghia(Sarcopterygii, Dipnoi) from Australia and
OKAFOR, Anthony Ikechukwu and CHUKWU, Lucian Obinnaya 254North America and its biogeographicalimplications. Journal of VertebratePalaeontology, 21(1): 1 – 12.CANAGARATNAM, P. (1959). Growth of fishes indifferent salinities. Journal of FishResearch Board of Canada, 16: 121 – 130.CARROLL, R. L. (1988). Vertebrate Palaeontologyand Evolution. W. H. Freeman andCompany, New York. 1996 pp.CHUKWU, L. O. (2001). Acute toxicity of treatedindustrial effluent to decapod crustacean,Macrobrachium vollenhoevenii. Journal ofScience, Technology and Environment,1(2 ): 21 – 29.CHUKWU, L. O. and UGBEVA, B. O. (2003). Acutetoxicity of textile mill effluents to estuarinemacro-invertebrate, Clibinarius africanus(Aurivillus) and Tilapia zilli (Gerr)fingerlings. Journal of NigerianEnvironmental Society, 1(2 ): 223 – 228.DAFFALA, A. A., ELIAS, E. E. and AMIN, M. A.(1985). The lungfish, Protopterusannectens (Owen) a bio-control agentagainst Schistosome vector snail. Journalof Tropical Medicine and Hygiene, 88: 131– 134.DUPE, M. and GODET, R. (1969). Conditioning ofthe responsiveness of the central nervoussystem in the life cycle of the lungfish,Protopterus annectens. General andComparative Endocrinology, 2: 275 – 283.DUPE, M. (1973). Factors conditioning theawakening reaction of olfactory origin inthe lungfish, Protopterus annectens.Comparative Biochemistry and Physiology,44A: 647 – 653.EBELE, S., OLADIMEJI, A. A. and DARAMOLA, J. A.(1990). Molluscicidal and piscicidalproperties of copper (II) tetraoxosulfate(VI) on Bulinus globosus (Morelet) andClarias anguillaris (L). Aquatic Toxicology,17: 231 – 238.ENAJEKPO, H. O. T. (1989). Effects o f watersoluble fractions (WSFs) of Bonny Lightcrude oil on some physiologicalparameters in Oreochromis niloticus.M.Sc. Thesis, University of Jos, Nigeria.HOLLIDAY, F. G. T. (1969). The effects of salinityon the eggs and larvae of teleosts. Pages293 – 312. In: W. S. Hoar and D. J.Randall (eds), Fish Physiology, Vol. 1,Academic Press, New York.NWIGWE, C. A. (1985). Effects of salinity onsurvival and growth of the catfish, Clariaslazera. M. Tech. Thesis. Rivers StateUniversity of Science and Technology,Nigeria. 56 pp.OKAFOR, A. I. and ODIETE, W. O. (2002 a). Theprocess of aestivation in the laboratory bythe African lungfish, Protopterusannectens (Owen). African Journal ofScience, 3(2): 764 – 767.OKAFOR, A. I. and ODIETE, W. O. (2002 b).Seasonal changes in Gonadosomatic andHepatosomatic indices of the Africanlungfish, Protopterus annectens (Owen) ofAnambra river, Otuocha, Nigeria. AfricanJournal o f Science, 3(2): 668 – 672.OKAFOR, A. I. (2004). Salinity tolerance of theAfrican lungfish, Protopterus annectens(Owen). African Journal of Science, 5(1):1073 – 1083.ONUSIRIUKA, B. C. and UFODIKE, E. B. C. (1994).Acute toxicity of water extracts of sausageplant, Kigelia africana and akee apple,Blighia sapida on African catfish, Clariasgariepinus (Teugels). Journal of AquaticSciences, 9: 35 – 41.OTTO, R. G. (1971). Effects of salinity on thesurvival and growth of pre-smolt cohosalmon, Oncorhynchus kisutch. Journal o fFish Research Board of Canada, 28: 343 –349.OTUOGBAI, T. O. S. and IKHENOBA, A. (2001).Food and feeding habits of the lungfish,Protopterus annectens (Owen) and thepossible role of the paired fins in feeding.World Journal of Biotechechnology, 2(2):233 – 238.SUGIYAMA, C. R. (2002). The effects of salinity onspermatozoa, eggs and larvae ofParacottus kessleri (Dybowski). JapaneseJournal of Fish Physiology, 3: 342 – 345.
Animal Research International (2005) 2(1): 255 – 260 255PARASITIC DISEASES AND SEXUAL DISABILITY: A CRITICAL REVIEW OFSOME PARASITIC DISEASES WITH SERIOUS SEXUAL REPERCUSSIONS1 OKAFOR, Fabian Chukwuemenam and 2 OMUDU, Edward Agbo1 Department of <strong>Zoo</strong>logy, University of Nigeria, Nsukka2 Department of Biological Sciences, Benue State University, MakurdiCorresponding Author: OMUDU, E. A. Department of Biological Sciences, Benue State University,MakurdiABSTRACTA wide range of parasitic diseases even though not sexually transmitted, invade male andfemale reproductive <strong>org</strong>ans causing direct pathological damages leading to impaired fertilityand sexual dysfunction. This paper provides a framework for thinking about the psychologicalimpact and burden o f these parasitic infections. It begins by providing the etiology of thesediseases and a brief overview of the socio-cultural and psychological implications of infectedand affected individuals. The article concludes with reflections as to how interactions o fparasitological and anthropological factors produce multi-dimensional reproductive healthproblems requiring urgent multi-disciplinary investigation and intervention.Keywords: Parasitic infection, Sexual repercussionINTRODUCTIONA range of parasitic diseases has differentreproductive health consequences for men andwomen. Parasites may affect sex and/or sexual<strong>org</strong>ans in two ways: the infecting <strong>org</strong>anism mayproduce sufficient debilitation or anatomicdeformities to make sex impossible as inonchocercrasis and lymphatic filariasis or maycause direct damage to male and femalereproductive <strong>org</strong>ans impairing fertility as a result ofinhibition of gamete production as intrichomoniasis, schistosomiasis and toxoplasmosis.Of the vast array of parasitic diseases endemic inNigeria, only trichomoniasis caused by theprotozoan parasite Trichomonas vaginalis is knownto be sexually transmitted. A wide range of otherparasitic diseases, even though not sexuallytransmitted, may however invade male and femalereproductive <strong>org</strong>ans causing direct pathologicaldamages leading to impaired fertility and sexualdisability (Burrow and Ferris, 1975; Hartigan,1999; Omudu and Amali, 2003).Other parasitic diseases may not directlyaffect reproductive <strong>org</strong>ans but their variouspathological manifestations may resemble diseasesgenerally believed to be sexually transmitted withits attendant stigma. It is often the stigma thatexacerbates the medical and psychologicalburdens of infected and/or affected individuals.Genital symptoms and manifestations of a varietyof protozoan and helminthic infections which arenot usually sexually transmitted may mimic classicsexually transmitted infections by producingulceration (for example, amoebiasis,leishmaniasis), wart-like lesions (schistosomiasis),or lesions of the upper genital tract as a result ofamoebiasis and schistosomiasis.Richens (2004) reported a variety of othergenital symptoms less suggestive of SexuallyTransmitted Diseases (STDs), these includehydrocele (seen with filariasis) and haemospermia(seen with schistosomiasis). Considering thepathological damage to sex <strong>org</strong>ans and the socialand psychological burden borne by affected andinfected individuals, there is urgent need to focusspecific attention on their clinical presentation withthe aim of providing holistic management andintervention.Schistosomiasis for instance, though notsexually transmitted, has been reported to haveserious sexual implications when the eggs invadetissues lining the reproductive <strong>org</strong>an causinganatomic deformities enough to reduce sexualpleasure for both partners (Hartigan,1999;Hanson, 1999; TDR News 1996). Female GenitalSchistosomiasis (FGS), as it is commonly referredto, has also been associated with a range ofpathologies including infertility, abortion andectopic pregnancy (WHO, 1998). Mondaini et al(2004) reported cases of testicular pains resultingfrom parasitic infection, especially among nonimmunedindividuals who have visited endemiccountries. Though they maintained that scrotalswelling may not be a specific diagnosis forfilariasis, it may however be a pointer to genitalfilariasis.The main focus of this paper is to discussthe sexual implications of some parasitic diseasesand how socio- cultural beliefs combine withparasitological manifestations to make life awretched existence for infected and/or affectedindividuals. It is hoped that medical experts will
OKAFOR, Fabian Chukwuemenam and OMUDU, Edward Agbo 256begin to address some of these socio-culturalbeliefs when developing intervention strategiesrather than focusing only on the biologicalmechanism through which these diseases operate.SOME PARASITIC DISEASES WITH SEXUALREPERCUSSIONSOnchocerciasis: Onchocerciasis, or riverblindness is caused by a filarial parasiteOnchocerca volvulus and transmitted by the bitesof blackfly Simulium species. This disease is ratedas a leading cause of blindness and about 20million people are infected worldwide while onemillion of those infected are totally or partiallyblind (Edungbola and Parakoyi, 1991).Onchocerciasis can manifest in several dramaticand bizarre forms with an incredible adverseimpact on agriculture, demography and socioeconomicconditions. It causes extensive skindisfiguration with unbearable discomfort. However,its most dreadful and terminal complication isblindness.Besides blindness, hernias, leopard skin,hanging groins and elephantiasis have beenidentified as important complications ofonchocerciasis in areas where the disease isendemic (Edungbola et al., 1991). While theassociation between hanging groins and herniashas been reported (Williams and Williams, 1966) ithas been established that hernia is a definite andmajor complication of onchocerciais (Nelson 1958,Edungbola et al., 1991).The medical and socio-economicseriousness of these complications ofonchocerciasis such as hernias, elephantiasis,hanging groins are often associated with sexualdisability because of the severe enlargement of<strong>org</strong>ans and disfiguration. Scrotal elephantiasis andhernias constitute formidable psychological burdenfor infected individuals as a result of obvioussexual repercussions. Partner desertion andabandonment often characterize such situations.In addition to the sexual incapacitation, scrotalelephantiasis and hernias also lower theproductivity and wage earning capacity of thoseafflicted.Gender roles also influence theconsequences of these manifestations ofonchocerciasis (Hartigan,1999, Harnson, 1999).For example masculinity is often demonstratedthrough multiple sexual conquests and control ofresources. Men who develop scrotal elephantiasis,hernia or hanging groins find it very difficult, if notimpossible, to engage in sexual intercourse inaddition to lower productivity. Women, on theother hand depend more on their physicalappearance to enhance their prospects formarriage and sustaining a relationship with malepartners, developing any of these onchocercalmanifestations jeopardise these aspirations.The skin manifestations in onchocerciasisare characterised by severe dermatitis and itching,the thickening and atrophy of skin and pigmentaryaberrations. Obikeze (1992) reported that thesepigmentary aberration (onchodermatitis) has verygrave social, economic and psychologicalimplications for victims of onchocerciasis. Youngwomen and men with the disease arediscriminated against, humiliated by peers,avoided by friends and stigmatized by society.Married women with onchodermatitis lose theaffection of their husbands while marriage chancesof infected persons are adversely affected, if nottotally ruined. Psychologically, onchodermatitisengenders withdrawal behaviour, isolationism andsocietal maladjustment on the part of the affectedindividual.Ovuga et al. (1995) investigated someaspects of social anthropological implications ofonchocercal skin disease in Nebbi district inUganda. Results indicated that onchocerciasis wasconsidered to be mysterious disease, especially thedermal manifestations of lizard and leopard skin.The disease was often mistaken for measles andleprosy and as such affected individuals sufferedfrom discriminatory practices applied on sufferersof measles and leprosy. The belief systems of thecommunity were said to be responsible for thediscriminatory practices of the people againstthose affected by onchocercal skin diseases.Persons who had these skin conditions rankedseparation from spouses as the most painfulaspect of the stigma.Lymphatic Filariasis: Lymphatic filariasis iscaused by the filarial nematode Wuchereriabancrofti and transmitted by the bites of Culexmosquito species. Although the disease caused bythis parasite is rarely fatal, the morbidity due tothe disease is high due to lymphoedema andhydrocoele which are results of impairment inlymphatic drainage. The socio-economicimplications of this disease include social isolationor stigma in reaction to the enlarged limbs orhydrocoel (WHO 1998).It is estimated that 40 million peoplesuffer from the chronic, disfiguring manifestationsof this disease, including 27 million men withtesticular hydrocoele, lymph scrotum orelephantiasis of the scrotum (Dreyer et al. 1997).An estimated 13 million people, the majority ofwhich are women have filarial-associatedlymphoedema or elephantiasis of the leg, arm orbreast (WHO 1998). Although lymphatic filariasis isranked as the second leading known cause ofdisability worldwide (WHO 1998) little attentionhas been paid to the important but hidden
Parasitic diseases and sexual disability 257disability associated with the genital manifestationsof this disease leading to sexual disability.Immobility, clumsiness, embarrassmentand depression have been observed in manysufferers (Mbah and Njoku, 2000). Generally theseproblems have led to severe functional impairmentof occupational and sexual activities. Hydrocoele,the genital manifestations of lymphatic filariasis inmen, present as a chronic swelling of the scrotumand victims find it very difficult to engage in sexualintercourse. About 27 million men are infectedworldwide with 75 % in subsaharan Africa(Hartigan, 1999). The experience of the disease issignificantly influenced by socio-cultural beliefs inendemic communities. Hydrocoele is associatedwith sexual disability and infertility; women oftensuffer greater social and psychologicalconsequence of limb and genital enlargement. Thefear of stigmatization drives many victimsunderground; as a result this disease condition israrely reported at health centres (Hanson, 1999;Hartigan, 1999; Vlassoff and Bonilla 1994).Ahorlu et al. (2001) assessed theconsequences of hydrocoele and benefits ofhydroceolectomy on the physical activity andsocial life in three lymphatic filariasis endemicvillages in Ghana and they reported thathydrocele, especially large ones, severely reducedthe patients’ work capacity and impaired sexualfunction, and that overall, it had a considerablenegative effect on the quality of life for thepatients, their family and the community. Reasonswhy patients refused hydrocoeletomy in the pastwere the high cost of surgery, fear of death andimpotence and /or sterility that might result fromthe operation. Patients that underwenthydrocoelectomy reported remarkableimprovement in quality of life, work capacity andsexual function. Other benefits of hydrocoelectomyincluded the restoration of self-esteem, thusenabling affected individuals to participate more incommunity activities.Other social anthropological studies onlymphatic filariasis in Northern Ghana by Gyaponget al. (2000) revealed that complications of lymphscrotum and ridicule from community memberswere ranked highest among problems of patients.Unmarried men in particular found it difficult tofind a spouse with their condition, and variousdegrees of sexual dysfunction were reportedamongst married men.Schistosomiasis: Schistosomiasis is anexcreta/urine-water borne parasitic diseasetransmitted through fresh water snail intermediatehost. It is caused by the trematode Schistosomahaematobium or S. mansoni. Of all the parasiticdiseases with sexual repercussion, schistosomiasisenjoys the greatest attention. Eggs of both S.mansoni and S. haematobium are often found inreproductive <strong>org</strong>ans of the infected female. Thisdisease has been associated with infertility, extrauterinepregnancy (Hartigan, 1999; Burrow andFerris, 1975). Acute infection of the reproductive<strong>org</strong>an may result to Vesico Vaginal Fistula andchronic inflammation of the vaginal epitheliumleading to painful discomfort during sexualintercourse (Burrow and Ferries, 1975).Female Genital Schistosomiasis (FGS) hasbeen associated with increased vulnerability to HIVinfection. This association is because thesymptoms of urinary and genital schistosomiasisare sometimes confused with other sexuallytransmitted diseases. A study conducted in Malawiin 1994 by some researchers from the WorldHealth Organization on FGS assessed the extent ofpathological damage in the genital area of womeninfected with urinary schistosomiasis. Theyinvestigated the relationship between urinaryschistosomiasis and infertility and the impact ofthe disease on women’s marital and sexual life.Fifty-one women with urinary schistosomiasisunderwent thorough gynecological examinationsincluding colposcopy and photographicdocumentation of lesions. Microscopy of thegenital biopsies revealed that 33 had S.haematobium eggs in their cervix, vagina and /orvulva. There was a significant correlation betweensize of genital lesions and the number of ovacounted. Tumors in the vulva were seen withnaked eyes. The report published in TDR news(1996) observed that though the sample was verysmall, significant cases were found in women whohad fewer children than desired and whosehusbands had children with other women,suggesting some sort of sexual dissatisfaction withpartners. It was reasoned that their husbandswere pushed into extra marital affairs because ofloss of sexual pleasure with partners who had FGS.Schistosomiasis is a disease with seriousgender bias, women are differentially exposed tothe disease as a result of their water carryingresponsibilities. Men are not left out of the sexualrepercussions of this disease. The commonestdiagnostic feature in male urinary schistosomiasisis the passage of bloody urine. This is sometimesconfused with some symptoms of STDs and as aresult infected individuals are stigmatized by peersand avoided by the opposite sex.Trichomoniasis: This is the most prevalentsexually transmitted parasitic infection, and themost prevalent non-viral and bacterial sexuallytransmitted disease in the world (Obiajuru et al.,2002, Njoku et al., 2000). The parasiteTrichomonas vaginalis is basically a flagellate thatexists commonly in the vegetative form. Theprevalence of trichomoniasis has continued to risein Nigeria and other sub-saharan countriesespecially as the greater percentage of the
OKAFOR, Fabian Chukwuemenam and OMUDU, Edward Agbo 258population become sexually active (Hanson, 1999).The parasite inhabits the vagina and cervix offemales and urethra of males. Although sexuallyactive male and female are at risk, it is morefrequently encountered in females than malesbecause it is generally assymptomatic in men.The symptoms could be severe such asintense inflammation of the vagina, with itchingand copious discharge from the vagina or urethra(Acholonu, 1998). T . vaginlis may impair fertility inwomen by causing direct damage to the fallopiantube and may induce watery sperm, prematureejaculation and prostates in men (Ukoli, 1990).Lesions of cervix, vagina and vulva resulting frominfection with T. vaginalis are painful duringintercourse and cause chronic inflammation of thefallopian tubes which may result in infertility, tubalpregnancy and abortion (Burrows and Ferries,1975; Ukoli 1990). These more seriouspathological effects result from long-lastinginfection, though they may be reversed aftersuccessful treatment. The psycho-socialimplications of this disease is very serious withvaginitis and urethritis causing severe discomfortand purulent discharge which mess-up inner wearsof infected persons. Some scholars are of theopinion that this parasite can also be transmittedthrough contaminated inner wears, towels, toiletseat (Obiajuru et al. 2002).The offensive odour of the dischargediscourages initiation and sustenance of sex.Spouses of infected partners are likely to resort toalternative sex partners as the case with otherknown sexually transmitted diseases. Individualswith trichomoniasis are blamed for beingpromiscuous, and since it is often reported amongwomen, there is a gender bias in the stigma. Theinflammation of the vaginal wall results in severepains during sexual intercourse thus exacerbatingthe biological and psychological problems faced byinfected individuals.The manifestations of other parasiticallyinduced diseases may also have seriousrepercussions for sexual harmony. Cutaneousleishmaniasis may disfigure/destroy body partsresulting to lose of sensation. Because of thesimilarity of this disease to leprosy, affectedindividuals are ostracised and denied sexualprivileges. Studies in a number of different regionsof the world indicate that both cutaneous andvisceral leishmaniasis are more likely to bedetected in men than women. It is however,important to note that in the case of cutaneousleishmaniasis, the disease does not result inpermanent incapacitation (Hartigan, 1999).THE IMPORTANCE OF ADDRESSINGPSYCHOLOGICAL ISSUES WHEN ASSESSINGIMPACT AND BURDEN OF PARASITICDISEASESCommunicable disease experts tend to focusexclusively on the biological mechanisms throughwhich disease operates when they develop theirmanagement and intervention strategies; rarely dothey broaden their vision to include anexamination and investigation of how thesediseases impact on the holistic reproductive healthneeds. To accurately assess the magnitude, depthand profound implications of sexual disability forboth men and women suffering from parasiticdiseases with sexual manifestations, socialanthropological investigation on the impact of thedisease on damaged male and female identityneed to be undertaken. Gyapong et al. , (2000)suggested the inclusion of psychological issues inthe calculation of Disability Adjusted Life Years(DALYs). The social and psychologicalconsequences of parasitic diseases are oftenexcluded from the burden of disease calculation.In order to address this biomedical bias, the WHOrecently listed a range of conditions that should beconsidered for global burden of disease (GBD)revisions. These include indirect obstetriccomplication, reproductive tract infection,psychological morbidity and other reproductivehealth concerns (WHO, 1998).Anthropological input in terms ofcommunity perceptions of these diseases includinglocal taxonomies and etiology is very valuable indeveloping health education materials to supportinterventions. While it is important to develop andadminister chemotherapeutic remedies, a moresophisticated understanding of cultural,psychological and social dimensions of endemicparasitic diseases with genital manifestations isalso crucial in introducing sustainable communityintervention. Anthropological involvement indisease management ensures that some account istaken of knowledge and cultural influence on thepatterns of disease and coping mechanismemployed by sufferers. Gubler (1997) thereforenoted that in order to achieve substantivesuccesses in disease prevention and control, thereis the need to include social scientists in thecontrol process primarily due to socio-cultural andpsychological factors that contribute in the spreadand experience of these infections.It is therefore medically, epidemiologicallyand psychologically sensible to address the sexualand reproductive health implications of parasiticdisease in endemic communities. Participatoryresearch methodologies are appropriate for betterunderstanding of psychological burden associatedwith sexual disability and incapacitation induced bythese parasitic infections. This is crucial for the
Parasitic diseases and sexual disability 259development of multi-disciplinary strategy to tackleparasitic diseases and their impact on agriculture,socio-economic well-being and reproductivehealth. Intensifying public education can helpreshape traditional beliefs that often determinecommunity behaviour as a result of fear, ignoranceand socio-cultural practices.CONCLUSIONThe interaction of parasitological and socio-culturalfactors produces multi-dimensional healthproblems that require multi-sectoral intervention.The prevalence, manifestation, natural history andseverity of consequences of these parasiticdiseases vary from place to place, this is becauseresponses, attitudes and beliefs (which influenceoverall disease consequence and burden) differ.Though the medical and socio-economic impact ofparasitic diseases has enjoyed attention from biosocialscientists, the linkage of these diseases tosexual disability with its attendant deprivation andstigma has not enjoy similar patronage. The‘compartmentalization of knowledge’ has made itdifficult for medical and social experts tocommunicate across disciplines. The urgent needtherefore is for integrated disease controlapproach that address the whole ‘web ofcausation’ and overall repercussion of diseases onindividuals and endemic communities.REFERENCESACHOLONU, A. D. W. (1998). Trichomoniasis: Alittle recognized sexually transmitteddisease but with grave consequences.Public lecture, Nigeria Academy ofScience, Lagos.AHORLU, C. K., DUNYO, S. K., ASAMOUH, G. andSIMONSEN, P. E. (2001). Consequencesof hydrocele and the benefits ofhydrocoelectomy. Acta Tropica, 80(3):215 – 221.BURROW, G. N. and FERRIS, M. D. (1975).Medical Complications during pregnancy.W. B. Saunders Company. London. 962pp.DREYER, G., NOROES, J. and ADDIS, D. (1997).The silent burden of sexual disabilityassociated with lymphatic filariasis. ActaTropica, 63: 57 – 60.EDUNGBOLA, L. D. and PARAKOYI, D. B. (1991).Onchocerciasis and dracunculiasis: Areview of the global status. NigerianJournal o f Parasitology, 12: 1 – 27.EDUNGBOLA, L. D., BABATA, A. L., PARAKOYI, D.B., OLADIRAN, A. O., JANYO, M. S. andASAOLU, S. O. (1991). Hernias andonchocerciasis. Nigerian journal ofParasitology, 12: 45 – 50.GUBLER, D. T. (1997). Human behaviour andcultural context in disease control.Tropical Medicine and InternationalHealth, 24(A): l – 2.GYAPONG, M., GYAPONG, J., NEISS, M. andTANNER, M. (2000). The burden ofhydrocele on men in Northern Ghana.Acta Tropica, 77(3): 287 – 294.HANSON, K. (1999). Measuring up : Gender,burden of disease, and priority settingtechniques in the health sector. WorkingPaper Series No. 99(12). Population andDevelopment Studies. Harvard School ofPublic Health, USA.HARTIGAN, P. (1999). Communicable disease,gender and equity in health. WorkingPaper Series No. 99(08). Population andDevelopment Studies. Harvard School, ofPublic Health, USA.MBAH, D. C. and NJOKU, O. O. (2000). Prevalenceof lymphatic filariasis in Oraeri, AnambraState, Nigeria. Nigerian Journal o fParasitology, 21: 95 – 102.MONDAINI, N., HOPSTER, D., CHOI, W. H.,BORLEY, N. C. and THOMPSON, P. M.(2004). Parasitic manifestations oftesticular pain. Archieves Ital Urol Androl ,76(1 ): 121 – 126.NELSON, G. S. (1958). “Hanging groin” and hernia,complications of onchocerciasis.Transactions of the Royal Society ofTropical medicine and Hygiene, 52: 272 –275.NJOKU, A. J., OBIAJURU, I. O. C., NJOKU, J. C.,NWOKOLO, E. A., UWAEZUOKE, J. C. andANOSIKE, J. C. (2000). Prevalence ofTrichomonas vaginalis among students oftertiary institutions in Imo State, Nigeria.Nigerian Journal of Parasitology, 21: 83 –94.OBIAJURU, I. O. C., NJOKU, A J. and OGBULIE, J.N. (2002). Prevalence of Trichomoniasisand the impact of sex education,knowledge and attitudes in relation totrichomoniasis and other sexuallytransmitted diseases in Imo StatesNigeria. Nigerian Journal of Parasitology,23: 81 – 90.OBIKEZE, D. S. (1992). Social impact ofonchocercal skin disease in rural Nigeria:Pages 23 – 45. In: Methods forcommunity diagnosis of onchocerciasis toguide Ivermectin based control in Africa.UNDP/WORLD BANK/WHO/ TDR. Geneva.OMUDU, E. A. and AMALI, O. (2003). Poor,pregnant and parasitized: A pathologicaland socioeconomic appraisal of the impactof parasitic diseases on pregnant womenin Nigeria. International Journal of Genderand Health, 1(1): 21 – 31.
OKAFOR, Fabian Chukwuemenam and OMUDU, Edward Agbo 260OVUGA, E. B. L., OGWAL-OKENY, J. W. andOKELLO, D. O. (1995). Socialanthropological aspect of onchocercal skindisease in Nebbi District, Uganda. EastAfrican Medical Journal, 72(10): 649 –653.RICHENS, J. (2004). Genital manifestations oftropical diseases. Sexually TransmittedInfections, 80: 12 –18.TDR (1996). Malawi study signals, need for moreresearch on female genitalschistosomiasis. Pages 3 – 4. In: Bruyere,J. (ed.). TDR news No. 50. June, 1996.UNDP/WORLD BANK/WHO/TDR. Geneva.UKOLI, F. M. A. (1990). Introduction toParasitology in Tropical A rica. f TextfolwLimited, Ibadan, Nigeria. 463 pp.VLASSOFF, C. and BONILLA, E. (1994). Genderrelated differences in the impact oftropical diseases on women: what do weknow? Journal of Biosocial Sciences, 26:37 – 53.WHO (1998). Gende r and health. Technical Paper,WHO/FRH, WHD/98:16, Geneva.WILLIAMS, E. H. and WILLIAM, P. H. (1996). Anote on apparent similarity in distributionof onchocerciasis, femoral hernia andKaposi’s Sarcoma in the West Nile districtof Uganda. East African Medical Journal,43: 208 – 209.
Animal Research International (2005) 2(1): 261 - 266 261SUPEROXIDE DISMUTASE (SOD) ACTIVITY AND SERUM CALCIUM LEVELIN RATS EXPOSED TO A LOCALLY PRODUCED INSECTICIDE “RAMBOINSECT POWDER”OTITOJU Olawale and ONWURAH Ikechukwu Noel EmmanuelPollution Control and Biotechnology Unit, Department of Biochemistry University of Nigeria, Nsukka, EnuguState, NigeriaCorresponding Author: Dr. ONWURAH I. N. E. Pollution Control and Biotechnology Unit, Department ofBiochemistry University of Nigeria, Nsukka, Enugu State, Nigeria. Email: iyknuelo@yahoo.comABSTRACTStudies of superoxide dismutase (SOD) induction in rats exposed to locally producedinsecticide; “Rambo” of which the active chemical compound is permethrin (0.6% w/w) wasperformed. The calcium levels in the blood plasma of the exposed rats were also evaluated.The rats were divi ded into three groups of fi ve rats per cage.Each group of rats was fed with1 %, 5 % or 10 % of the insecticide in their di ets . The control group was fed normal diet. Theeffect of insecticide at various concentrations on superoxide dismutase (SOD) activity in theblood plasma was not significantly different (P > 0.05) in the newly weaned rats (NWR).However, in the middle-aged rats (MAR) and aged rats (AR) groups, the results weresignificantly different (P < 0.05) against the parallel controls. Comparison of the effect of theinsecticide on SOD induction at various concentrations among the groups based on agedifference showed significantly diff erent result (P < 0.05), especially among the groups fedwith 10 % (w/w) of the insecticide in the diet. Serum Ca 2+ level (0.51 ± 0.22mg/ml) increasedf rom newly weaned rats groups to (0.66 ± 0.24mg/ml) in the middle-aged rats and (0.63 ±0.04mg/ml) for the aged rats . The observed Ca 2+ increase was significantly high for rats fed10 % (w/w) concentration of the insecticide in the diet (P < 0.05). This increase tends tosuggest a concentration- dependent effect. The no-observed-effect-concentration (NOEC) wasfound to be 0.006 g permethrin per 100 g of the diet, which is equivalent to 1% of the“Rambo” insecticide per 100g of the feed. Results of this study show that in non-target<strong>org</strong>anisms “Rambo” insect powder may induce superoxide dismut ase activity, thus ,suggesting, oxidative-stress related toxicity. The observed increase in calcium ion especiallyat 10 % (w/w) of the insecticide showed that permethrin may induce toxic effects associatedwith cell death via mitochondria uncoupling and loss in ATP metabolism.Keywords: Superoxide dismutase, Calcium ion, Permethrin insecticide, Rambo insect powderINTRODUCTIONIn our enthusiasm for new successes, we haveoften overlooked the fact that we have pollutedour environment and purposely or inadvertentlyhave exposed ourselves and other life forms tohazardous chemicals (e.g. pesticides). Most ofthese chemicals have been implicated as causingcell injury and death especially in non-target<strong>org</strong>anisms. (Sotherton, 1991 and Moreby et al.,2001). Toxicity may occur directly as a result of achemical compound being converted to free–radicals or via superoxide anion formation (Bridgeset al., 1983). Free radicals have been implicated inseveral human diseases such as cancer and heartdiseases (Gutheridge, 1994). More so, they causemembrane damage (Onwurah and Eze, 2000), dueto generation of lipid peroxidation product.Detoxification of reactive oxygen species is one ofthe prerequisites of aerobic life, and the multipleline of defence system. The repertoire tocounteract the potentially hazardous reactionsinitiated by oxygen metabolites includes all levelsof protection, prevention, interception and repairs.It comprises non-enzymatic and enzymaticsystems. The enzymes involved in antioxidationare the superoxide dismutase, glutathioneperoxides and catalases (Ledig and Doffoel, 1988).Superoxide dismutase (SOD) catalyses thedestruction (dismutation) of superoxide free –radical ions. These ions are believed to beresponsible for lipid peroxidation and peroxidativehaemolysis of erythrocytes. The action of SODtherefore results in the protection of the biologicalintegrity of cells and tissues against the harmfuleffects of superoxide free radicals (Olusi, 2000).To ameliorate the damage caused by the hydroxylradical formed from superoxide radicals and
OTITOJU Olawale and ONWURAH Ikechukwu Noel Emmanuel 262hydrogen peroxide, <strong>org</strong>anisms have evolvedmechanisms to regulate the concentrations of thetwo reactants. SOD is an important isoenzymefunctioning as superoxide radicals’ scavengers inthe living <strong>org</strong>anisms. Its activity is also induced bydiverse stresses (Bowler et al., 1992), presumably,because of the increase in the concentration ofsuperoxide radicals in cells. SOD is an importantenzyme family in living cells for maintaining normalphysiological conditions and coping with stress.Calcium ions are important and arerequired for many physiological functions.Although, the role of Ca 2+ as a mediator oftoxicant induced cell death has been a subject ofinterest, intracellular Ca 2+ homeostasis is ofimportance to cell viability (Palmeira, 1999). Thecritically important cellular calcium pool forregulation of intracellular events is the cytosolicCa 2+ , and this is control by hormones and growthfactors (Thomas et al., 1984). Loss of the ability torespond to such hormones and growth factors mayresult in cell death (Orrenius et al., 1989). Themechanisms by which Ca 2+ -mobilising hormones,like vasopressin, induce intracellular Ca 2+ transientshave been extensively studied (Kawanishi et al.,1989 and Glennon et al., 1992). Normally,intracellular Ca 2+ homeostasis is maintained by theconcerted operation of cellular transport andcompartmentation systems (Carafoli, 1987).Damages caused by free radicals or superoxideradical on the plasma membrane will lead to a risein cytosolic Ca 2+ concentration, which may causecell injury and finally cell death (Comporti, 1993).Most cells incorporate a variety of veryactive defense and repair systems when exposedto environmental toxicants, and these defensesystems may be overwhelmed during prolongedexposure. The imposed damage may be qualitativeor quantitative in nature. In this study, the effectsof a locally produced insecticide Rambo insectpowder on serum Ca 2+ level and induction of SODwere investigated.MATERIALS AND METHODSTest Sample: The test sample for the experimentwas a locally produced insecticide, Rambo insectpowder that contains 0.60 % (w/w) Permethrin asthe active ingredient. Rambo insect powder isproduced by Gongoni Co. Limited, 89A SharadaIndustrial Estate, Phase 111, Kano, Nigeria.Formulation of Treatment: Differentconcentrations of the insecticide powder in the dietwere prepared by weighing-out a definite amountof growers’ mash (feed) and then mixed with the“Rambo” insect powder. The concentrations of theactive ingredient of the “Rambo” insecticide(permethrin) in the feed were 0.006 g, 0.03 g and0.06 g. This produced either 1 %, 5 % or 10 %(w/w) of the “Rambo” insect powder in the feed.The feed for control contains no “Rambo” powder.All the animals were given sufficient quantity ofwater daily.Procurement and Management ofExperimental Animal: Wilster albino ratsweighing between 120 – 720 g were obtainedfrom the Faculty of Veterinary Medicine, Universityof Nigeria Nsukka (UNN) and maintained on acommercial feed (growers’ mash) for five days inthe animal house of the Department ofBiochemistry, UNN, before the commencement ofthe experiment. The animals were grouped intothree; newly weaned rats (NWR; 2 – 4 weeks,weighing 150 – 185 g), middle aged rats (MAR; 7– 12 weeks, weighing 290 – 335 g), and aged rats(AR; 13 – 16 weeks, weighing 570 – 642 g). Eachgroup was fed with different concentrations of theRambo contaminated diets (1 %, 5 % and 10 %w/w), the control groups were fed with the normaldiet.Protein Determination in the Plasma: Totalprotein concentrations (mg/ml) in the plasma wereanalysed with Follin-Ciocalteau reagent asdescribed by Cunha-Bastos et al. (1999). BovineSerum Albumin (BSA) was used as standardprotein.Superoxide Dismutase Assay: An indirectmethod of inhibiting auto-oxidation of epinephrineto its adrenochrome was used to assay SODactivities in blood plasma (Misra and Fridovich,1971). Auto-oxidation of epinephrine was initiatedby adding 1ml of Fenton reagent prepared asdescribed by Onwurah, (1999) to a mixture ofepinephrine (3 x 10 -4 M), Na 2 CO 3 (10 -3 M), EDTA(10 -4 M), and 1.0ml of deionized water at a finalvolume of 6 ml. The auto-oxidation was read in aspectrophotometer at 480 nm every 30 sec for 5min. The experiment was repeated with 1.0 ml ofthe blood plasma from different blood samplescollected from different groups of animals. A graphof absorbance against time was plotted for each,and the initial rate of auto-oxidation calculated.One unit of SOD activity was defined as theconcentration of the enzyme (mg protein/ml) inthe plasma that caused 50 % reduction in theauto-oxidation of epinephrine (Jewett andRockling, 1993). Superoxide dismutase activity wassubsequently calculated for each sample.Serum Calcium Assay: This was based on themethod of precipitation by chloranilic acid (Cerioti,1974). To 0.5 ml of the serum in a centrifuge tubewas added 0.5 ml of chloranilic acid. This wasmixed thoroughly and centrifuged. The precipitatewas washed in 3 ml of 50 % prapanol–watermixture, and later dissolved in 3.5 ml of citrate
Superoxide dismutase (sod) activity and serum calcium level in rats 263buffer (0.2 mol/l). The mixture was shaken on a“cyclomixer”, and the absorbance read at 530 nmagainst water as blank.Statistical Analysis: Mean values (± SD) ofduplicate experiment with duplicate sampling (N =4) were taken for each analysis. Significantlydifferent results were established by one – wayANOVA and differences between groups, age, andconcentrations were determined by DUNCANmultiple range test. The accepted value ofsignificance was p 0.05) within the groups(NWR, MAR and AR) of experimental rats and thecontrols.The specific activity of SOD did notsignificantly increased in the NWR groups fed with1 %, 5 % or 10 % (w/w) – contaminated dietrelative to control (P > 0.05). In the contrary, theMAR groups and AR groups fed with 1 %, 5 % or10 % - contaminated diet showed significantincrease in the specific activity of SOD (P < 0.05)relative to their controls. Pair wise comparisonbetween NWR/MAR, NWR/AR and MAR/AR groups,fed with 1 %, 5 % or 10 % (w/w) insecticide –contaminated diet between 7 – 21 days ofexposure showed significantly different results (P< 0.05) on SOD only at 10 % (w/w) insecticide –contaminated diet; but the 1 % and 5 % (w/w)insecticide – contaminated showed non significantdifference (P > 0.05) (Table 3).Serum Ca 2+ levels is shown in Figure 1.The results were not significantly different withinthe groups fed with 1 % and 5 % of theinsecticide – contaminated diet (P > 0.05). Theresults were however significantly different withinthe groups NWR, MAR and AR fed with 10 % ofthe insecticide – contaminated diet (P < 0.05).Comparison of the effect of the insecticide on Ca 2+levels between the pairs of NWR/MAR, NWR/ARand MAR/AR groups showed significantly differentresults (P < 0.05) at 10 % concentration ofinsecticide-contaminated diet (Table 3).DISCUSSIONThe effect of pesticides on non-target <strong>org</strong>anisms iswell documented (Moreby and Southway, 1999).The present study reports the effect of permethrin(formulated as “Rambo” insect powder) on nontarget<strong>org</strong>anisms. Our results demonstrated thatSOD activity decreased in the middle-aged rats(MAR) and aged–rats (AR) groups. The newly –weaned rats (NWR) groups showed a markedincrease in the SOD activity when compared withthe control. These differences in plasma SODlevels may be due to several factors, such as age,concentration of toxicants, sex, diet etc. The lowlevels of SOD in the plasma of MAR and AR ratsfed with insecticide-contaminated diet may be dueto the overwhelming influence of superoxideradicals or activated metabolites generated by theinsecticide exposure on the cell membrane of theexposed rats. Determination of SOD in plasmaprotein samples is based on the ability of theenzyme to inhibit superoxide anion- dependentreactions (Marklund and Marklund, 1974).The increase in SOD activity in the NWRgroups may be due to an induction of the enzymeprotein in the presence of reactive metabolites ofpermethrin (Ledig and Doffoel, 1988). This isobvious from the results in Table 2 where theplasma protein level for NWR fed with varyingconcentration of the insecticide in the diet weresignificantly high than that of the control. Similarly,Deuterman (1980) showed that at birth and at theearlier stage of life, there was a marked increasein the activity of many enzymes in the bodysystem of rats. These enzymes are involved inmany reactions relating to xenobiotic metabolismand more so, a number of them are agedependent.The increase in enzyme activity at anearlier stage in life may suggest that NWR groupswith increase level of SOD activity couldmetabolize the permethrin such that its putativetoxic effect was not overwhelming to subjugatethe mechanism of action of SOD. SOD is anextremely potent antioxidative enzyme that fightscellular damage arising from free radical inductionof reactive metabolites from oxidation ofhydrocarbon compounds (Onwurah and Eze,2000). Hence, induction of SOD activity in rats’blood plasma when exposed to environmentaltoxicants such as “Rambo” insecticide may be anadaptive mechanism for its survival. The rate atwhich individual and/or groups of rats metabolizedthe toxicant is age-dependent. This is justified bythe mortality ratio (1:4) of rats in favour of newlyweaned rats when compared with aged rats. SODactivity is also induced by diverse stresses (Bowleret al., 1992) which may include exposure tohydrocarbon compound, copper, ultra-violetradiation, thermal pollution, disease etc.
OTITOJU Olawale and ONWURAH Ikechukwu Noel Emmanuel 264TABLE 1: Rate of auto-oxidation of epinephrine in rats exposed to insecticide-contaminated dietAuto-oxidation mixtures (Am)Auto-oxidation rate Percent inhibition (%)(Units/min)Am + 1.0 ml Distilled H 2 O0.078 ± 0.003 --Am + 1.0 ml plasma NWR 1 %* 0.026 ± 0.014 66.67 ± 0.047Am + 1.0 ml plasma NWR 5 % 0.073 ± 0.047 6.41 ± 0.047Am + 1.0 ml plasma NWR 10 % 0.037 ± 0.013 52.56 ± 0.013Am + 1.0 ml plasma NWR control 0.070 ± 0.030 10.26 ± 0.044Am + 1.0 ml plasma MAR 1 % 0.066 ± 0.044 15.38 ± 0.044Am + 1.0 ml plasma MAR 5 % 0.047 ± 0.003 57.69 ± 0.003Am + 1.0 ml plasma MAR 10 % 0.066 ± 0.044 15.38 ± 0.044Am + 1.0 ml plasma MAR control 0.033 ± 0.003 57.38 ± 0.003Am + 1.0 ml plasma AR 1 % 0..021 ± 0.010 26.92 ± 0.032Am + 1.0 ml plasma AR 5 % 0.042 ± 0.019 46.15 ± 0.019Am + 1.0 ml plasma AR 10 % 0.048 ± 0.023 38.46 ± 0.023Am + 1.0 ml plasma AR control 0.030 ± 0.010 61.54 0.010* Plasma taken from different groups o f rats eg. Newly weaned rats (NWR) fed with 1% (w/w) contaminated diet. For detailssee materials and method.TABLE 2: SOD activity and total plasma protein levels in rats exposed to insecticide-contaminateddietsGroupPlasma Total Protein(mg/ml)Superoxide Dismutse (SOD)Activity (units a / ml)±*Specific activityUnit/mg proteinNWR 1 % 0.66 ± 0.14 1.33 ± 0.0003 2.02 ± 0.340.64 ± 0.17 0.13 ± 0.0009 0.20 ± 0.26NWR 10% 0.48 ± 0.04 1.05 ± 0.0003 2.19 ± 0.29NWR control 0.43 ± 0.02 0.21 ± 0.0006 0.49 ± 0.110.56 ± 0.11 0.31 ± 0.0009 0.55 ± 0.130.68 ± 0.22 0.80 ± 0.0006 0.18 ± 0.10MAR 10% 0.65 ± 0.18 0.31 ± 0.0009 0.48 ± 0.17MAR control 0.67 ± 0.19 1.15 ± 0.0006 1.72 ± 0.24AR 1 % 0.52 ± 0.08 0.23 ± 0.0008 0.44 ± 0.15AR 5% 0.47 ± 0.05 0.92 ± 0.0004 1.96 ± 0.23AR 10% 0.41 ± 0.01 0.77 ± 0.0005 1.88 ± 0.18AR control 0.56 ± 0.07 1.23 ± 0.0002 2.20 ± 0.45*Specific activity for the SOD in all the groups is not significantly different (P < 0.05)a One unit (of activity) of Sod is generallydefine as the amoun t of the enzyme that inhibits the autoxidation o f epinephrine by 50 %.Table 3: Duncan multiple range test of one-way ANOVA for comparing the ages of rats exposed tovarying concentrations of insecticide-contaminated diet on SOD activity and serum calcium levelsCombinations Sod in Plasma Serum Ca 2+ LevelDifferences LSR Differences LSRNWR 1%/ MAR 1% 0.043 0.162 0.12 0.32NWR 1%/ AR 1% 0.003 0.162 0.23 0.32AR1% / MAR 1% 0.043 0.162 0.11 0.32NWR 5%/ MAR 5% 0.026 0.130 0.23 0.36NWR 5%/ AR 5% 0.005 0.130 0.23 0.36AR 5% / MAR 5% 0.031 0.130 0.00 0.35NWR 10%/ MAR 10% 0.037 - 0.049* 0.17 0.09*NWR 10%/ AR 10% 0.000 - 0.049* 0.16 0.09*AR 10% / MAR 10% 0.037 - 0.049* 0.23 0.09**Significantly different results (P < 0.05)SOD is an important enzyme in living cells formaintaining normal physiological conditions andcoping with oxidative stress.The role of calcium ion (Ca 2+ ) as amediator of toxicant-induced cell death is veryimportant to this study because intracellular Ca 2+homeostasis is very important to cell viability. Ourresults demonstrated that there is an increase inthe serum Ca 2+ level from NWR to MAR and ARs.This agrees with the work of Thomas et al.,(1984). Similarly, there seems to be an inversecorrelation between the SOD and serum Ca 2+ level.
Superoxide dismutase (sod) activity and serum calcium level in rats 265Serum Calcium (mg\ml)10.90.80.70.60.50.40.30.20.10Newly Weaned RatMiddle Aged RatAged RatControl 1% 5% 10%Concentrations of Insecticide in DietFigure 1: Serum calcium levels (mg\ml) of rats exposed to insecticidecontaminated dietsThe group with high SOD activity possessed verylow level of serum Ca 2+ . This may be as a result ofthe scavenging ability of SOD on the superoxideradicals generated by the increase in cytosolic Ca 2+level. The elevated Ca 2+ level can cause severaltissue injuries and subsequently affect membranepotential and mitochondrial uncoupling (Marklundand Marklund, 1974). Several studies withxenobiotics demonstrated mitochondrial energyuncouplers (Deuterman, 1980), which suggestdisruption of energy supply as a common principalcause of cellular cytotoxicity.Acute pesticide poisoning, particularly indeveloping countries, is frequent and thus of greatimportance in public health. The magnitude of theproblems depends on a number of contributingfactors, such as types of pesticide regulations,awareness of the degree of danger, training tominimized exposure and availability of medicaltreatment facilities. The use of pesticide indeveloping countries is often characterized by lackof vital knowledge of its toxicity and proceduresfor safe use. This plays a critical role in obtainingdirect exposure by both target and non-target<strong>org</strong>anisms.The action of “Rambo” insecticide on nontargetgroups may vary widely in comparison tothe other insecticides like paraquat (Palmeira,1999); deltamethrin, zeta–cypermethrin anddimethoate (Moreby et al., 2001). It has becomeapparent that both SOD and Ca 2+ are important toboth toxicological and physiological processes. Therelative importance of the various Ca 2+ dependentprocesses in cells needs to be further clarified andthe toxicity of “Rambo” insecticide with otherpyrethroid could be further compared usingbiochemical markers.REFERENCESBOWLER, C., MONTAGU, M. V. and IRIZE, D.(1992). Superoxide dismutase and stresstolerance. Analytical Review PlantPhysiology and Molecular Biology, 43: 83– 116.BRIDGES, J. W., BENFORD D. J. and HUBBARD S.A. (1983). Mechanisms of toxic Injury.Annals of New York Academy of Sciences,83: 42 – 63.CARAFOLI, E. (1987). Intracellular calciumhomeostasis. Analytical Review inBiochemistry, 56: 395 – 433.CERIOTI, G. (1974). In<strong>org</strong>anic substances. Pages1566 – 1572. In: H. C. CUTINS (ed).Clinical Biochemistry. Principles andMethods, <strong>Volume</strong> 2, Blackwell ScientificPublications, Oxford.COMPORTI, M. (1993). Lipid peroxidation, anoverview. Pages 65 – 87. In: POLI, G.,ALBANO, E. and DIANZANI, M. U. (Eds.).Free radicals: from basic science tomedicine. Birkhauser Verlag Basell,Switzerland.CUNHA-BASTOS, V. L. T., CUNHA-BASTOS, J.,LIMA J. S. and CASTRO-FAIRA, M. V.(1991). Brain acetylcholinesterase as an“in-vitro” detector of <strong>org</strong>anophosphorusand carbamate insecticide in water. WaterResources, 25: 835 – 840.DEUTERMAN, W. C. (1980). Metabolism oftoxicants: phase II reactions. Pages 92 –104. In: Hodgson E. and Guthrie, F. E.(Eds.). Introduction to BiochemicalToxicology. Blackwell ScientificPublications, Oxford.DUNCAN, D. (1955). Multiple range test andmultiple F-tests. Biometrics, 11: 1 – 42.
OTITOJU Olawale and ONWURAH Ikechukwu Noel Emmanuel 266GLENNON, M. C., BIRD, G. J., KWAN, C. Y. andPUTNEY, J. W. (1992). Actions ofvasopressin and the Ca 2+ - ATPaseInhibitor, thapsigargin, on Ca 2+ singling inhepatocytes. Journal of BiologicalChemistry, 267: 8230 – 8233.GUTTERIDGE J. M. C. (1994). Antioxidants,nutritional supplements and lifethreateningdiseases. British Journal ofBiomedical Science, 51: 288 – 293.JEWETT, S. L. and ROCKLIN, A. M. (1993).Variation in one unit of activity withoxidation rate of <strong>org</strong>anic substrate inindirect superoxide dismutase assays.Analytical Review of Biochemistry, 212: 55– 59.KAWANISHI, T., BLANK, L. M., HAROOTUNIAN, A.T., SMITH, M. T., and TSIEN, R. Y.(1989). Ca 2+ oscillations induced byhormonal stimulation of individual fura – 2– loaded hepatocytes. Journal of BiologicalChemistry, 264: 12859 – 12866.LEDIG M. and DOFFOEL M. (1988). Superoxidedismutase activity in erythrocytes ofalcoholic patients. Advances in theBiosciences, 71: 125 – 129.MARKLUND, S. and MARKLUND, G. (1974).Involvement of superoxide anion radical inthe auto-oxidation of pyragallol, and aconvenient assay for superoxidedismutase. European Journal ofBiochemistry, 47: 469 – 474.MCCORD, J. M. and FRIDOVICH, I. (1970). Theutility of SOD in studying free radicalreaction. (ii) The mechanism of themediation of cytochrome C reduction by avariety of electron carriers. Journal ofBiological Chemistry, 245: 1374 – 1377.MISRA, H. P. and FRIDOVICH, I. (1971). Thegeneration of superoxide radical duringthe autoxidation of ferredoxin. Journal o fBiological Chemistry, 246: 6886 – 6890.MOREBY S. J., SOUTHWAY S., BARKER, A. andHOLLAND J. M. (2001). A comparison ofthe effect of new and establishedinsecticides on non-target invertebrates ofwinter wheat fields. EnvironmentalToxicology and Chemistry, 20: 2243 –2254.MOREBY, S. J. and SOUTHWAY, S. E. (1999).Influence of autumn applied herbicides onsummer and autumn food available tobirds in winter wheat fields in SouthernEngland. Agricultural Ecosystem andEnvironment, 72: 285 – 297.OLUSI, S. O., (2002). Obesity is an independentrisk factor for plasma lipid peroxidationand depletion of erythrocytecytoprotective enzymes in humans.International Journal o f Obesity, 26: 1159– 1164.ONWURAH I. N. E. and EZE M. O. (2000).Superoxide dismutase activity inAzotobacter vinelandii in the disposition ofenvironmental toxicants exemplified byFenton reagent and crude oil. Journal ofToxic Substance Mechanisms, 19: 111 –123.ONWURAH, I. N. E. (1999). Lipid peroxidation andprotein oxidation in Azotobacter vinelandiiexposed to mercury, silver, crude oil andFenton reagent. Journal of ToxicSubstance Mechanisms, 18(4): 167 – 176.ORRENIUS, S., MCCONKEY, D. J., BELLOMO, G.and NICOTERA, P. (1989). Role of Ca 2+ intoxic cell killing. Trends inPharmacological Sciences, 10: 281 – 285.PALMEIRA, C. M. (1999). Herbicide inducedmitochondrial and cellular liver toxicity: Areview of paraquat, dinoseb, and 2,4 – Deffects. Journal of Toxic Substancemechanisms, 18: 187 – 204.SOTHERTON, N. W. (1991). Conservationheadlands and practical combination ofintensive cereal farming and conservation.Pages 373 – 397. In: FIRBANK, L. G.,CARTER, N., DERBY-SHIRE, J. .F. andPOTTS G. R. (Eds.). The ecology oftemperate cereal fields. BlackwellScientific Publishers, Oxford.THOMAS, A. P., ALEXANDER, J. and WILLIAMSON,J. R. (1984). Relationship between inositolpolyphospate production and the increaseof cytosolic free Ca 2+ induced byvasopresin in isolated hepatocytes.Journal o f Biological Chemistry, 259: 5574– 5584.
Animal Research International (2005) 2(1): 267 – 274 267ANIMAL WASTE MANAGEMENT STRATEGIES, A REVIEW1 UCHEWA, Emmanuel Nwafoagu, 1 OTUMA, Michael Oria and 2 BROOKS, Peter1 Department of Animal production and Fisheries Management, Ebonyi State University, PMB 053, Abakaliki,Ebonyi State, Nigeria2 Faculty of Food, Land and Leisure, University of Plymouth, Seale Hayne, Newton Abbot. TQ12 6NQ, UnitedKingdomCorresponding Author: UCHEWA, E. N. Department of Animal production and Fisheries Management,Ebonyi State University, PMB 053, Abakaliki, Ebonyi State, NigeriaABSTRACTThe issue of pollution and environmental protection now command widespread interes t andpolitical attention. Increased concern over environmental destruction has led to theintroduction of new anti pollution laws and regulations in many countries throughout theworld . Some such regulations focus on curbing pollution caused by industrial and agriculturalactivi ties . Animals produce enormous quantities of waste per day. In areas supportingintensive livestock production, accumulation of such waste can pose a serious environmentalhazard. A single animal pen of a moderate size will produce quantities o f waste equal to thatproduced by a small town annually. Waste produced from these pens usually lead to soil,water and the atmosphere pollutions . Several nutritional advances have been reported whichserve to reduce the excretion and pollutive effect o f animal waste.Keywords: Environmental pollution, Animal, Nutrition, Animal wasteINTRODUCTIONIntensive animal production systems are inefficientfeed converters into. This is particularly true fornitrogen (N), phosphorus (P) and potassium (K)ratio in animal diet compare to the dietary intake.A large fraction of these elements in feed are notdeposited in animal tissue, but wasted as amixture of urine and faecal matter (Tamminga andVerstegen, 1992). Losses in animal excreta occurin form of solid, liquid and gases.High animal stocking density often, resultsin high waste production per unit area, thus animalmanure is becoming a burden on the environment(AFRC, 1991). This is particularly the case in areaswhere intensive systems are employed for animalhusbandry such as in The Netherlands andHolland. Public pressure aimed at reducingenvironmental pollution, including that caused bythe animal industry, is a growing concern. In orderto avoid a forced, significant reduction in the sizeof the animal industry, measures will have to betaken to reduce its negative impact on theenvironment (Tamminga and Verstegen, 1992). Anumber of biological approaches may be pursuedwhich can help reduce environmental pollutionarising from animal waste.Dietary manipulation designed to increasefeed digestibility reduces the quantity of faecalmatters produced by the animals. Theincorporation of specific enzymes in diets has alsosolved some specific nutritional problems.Enzymes rich feed often reduces the level ofpollutants excreted in the faecal matter (Bateman,1998).MAJOR POLLUTANTSTo sustain their growth, plants must assimilate avariety of nutrient, most notably nitrogen andphosphorus. These nutrients are invariably presentin animal manure (Headon and Walsh, 1994).Manure thus serves as an effective fertiliser.However, if manure is applied to the soil at a rate,which exceeds plant assimilation, a build up ofnutrients can occur (Tamminga et al., 1992). Suchnutrients, which include nitrogen, phosphorus andminerals, can cause serious pollution.Phosphorus: Low efficiency in the utilization ofdietary phosphorus is seen in pigs and othermonogastric animals. This is reflected by the largequantity of phosphorus normally associated withanimal waste (Cromwell, 1980). Dietarysupplementation of phytase enzyme can effect theconcentration of phosphorus in poultry andlivestock wastes through its ability to liberatephytate phosphorus contained in the cell walls offeed grains (Edens et al., 1999). However thisliberation of phytate phosphorus can only beaccomplished if a concomitant reduction is made insupplemented dietary in<strong>org</strong>anic phosphorus andcalcium. Phytate forms acid salts with mineralcations such as calcium, magnesium, copper, Zinc,
UCHEWA, Emmanuel Nwafoagu et al. 268iron and potassium thereby reducing mineralsolubility and availability (Erdman, 1979). Whenacted upon by phytase enzyme, these cations arereleased much like phosphorus. Consequently,increased availability of these minerals will result inincreased retention of phosphorus in chicken givenphytase. In contrast with nitrogen, phosphorusgenerally remains in association with the surfacelayer of soil. This limits the extent to whichphosphorus pollutes the ground water (MAFF,1996). Soil erosion or manure run-off from the soilsurface, however, can result in appreciablequantities of phosphorus entering the waterways.The presence of excess nutrients in suchwaterways invariably leads to pollution.Nitrogen: Excess nitrogen present in manure is inin<strong>org</strong>anic form (often as ammonium ion NH + 4 ).Some may be lost to the atmosphere as ammonia(NH 3 ) (MAFF, 1996). Because of its positivecharge, NH +4 tends to associate electrostaticallywith the soil particles. This renders much of theapplied nitrogen initially immobile in the soil.However, some of the NH +4 in the soil, whichremains unassimilated by plants, is subsequentlyconverted to nitrate in the soil. Although aproportion is converted to nitrogen gas (N 2 ) by theprocess of denitrification, much of the nitrate willfind its way into ground water supplies (Headonand Walsh, 1994).Although quantitatively, nitrogen andphosphorus represent the major pollutants presentin animal wastes, several other waste constituentscan have adverse environmental effects.Increasing concern has been voiced by many withregard to the quantities of minerals derived fromanimal faeces released in the environment (AFRC,1991).NUTRITIONAL APPROACHES TO REDUCEPOLLUTION FROM ANIMAL WASTESA number of nutritional approaches may bepursued which can help reduce the pollutive effectof animal waste (Vandergrift, 1992). In thisregards, in piggery attention has been focused onreduction of nitrogen and phosphorus in the faecalmatters, while maintaining health and highperformance of the pigs. Nutritional managementcan substantially reduce the quantity of nitrogenand phosphorus excreted by pigs (VanKlooster etal., 1998).Dietary manipulation designed to increasefeed digestibility reduces the qualities of manureproduced by an animal (MAFF, 1991). Inclusion ofprobiotics in the diet may also assist the animal toutilise dietary nutrients more efficiently(Goransson, 1997). The presence of pathogens orpotential pathogens (coliform) in the gut canrender digestion and absorption of nutrients lesseffective. This in turn results in excessive excretionof such nutrients in the faeces (Van’t Klooster etal., 1998).The addition of specific enzymes to dietsmay also solve specific nutritional problems. Feedenzymes can reduce the levels of nitrogen andphosphorus excreted in the faeces. Phytaserenders phosphorus in the form of phytic acid,which is biologically available to the animal(Cromwell, 1980). Cellulases and protease may beused to enhance digestion of fibrous andproteinacious dietary components (Tamminga andVerstegen, 1992). Glucanases and pentosanasesmay be employed to destroy anti-nutritivemolecules such asglucans and pentosans (Headonand Walsh, 1994). Anti-nutritional factors generallyhave an adverse effect on digestion and onassimilation. Their removal, therefore, exerts apositive effect on these physiological processes.Ammonia is one of the most noxiouspollutants associated with animal waste(Tamminga and Verstegen, 1992). Build up ofammonia concentrations in animal pen has adetrimental effect on both animals and animalkeepers alike. Excess of ammonia into theatmosphere has an obvious pollutive effect (Hornand Squire, 1997). Beal et al. (2001) has shownthat pre-treatment of pigs diet with proteaseincreased the in vitro digestion of nitrogen inweaner pigs. There are four reasons why enzymesmay be added in certain diets:1. To remove or destroy anti-nutritional factors2. To enhance overall feed digestibility3. To render certain nutrients biologically available4. To reduce the pollutive effect of animal excretesReducing Phosphorus Excretion throughNutrition: Inclusion of microbial phytase in pigdiets is one of the initial successes in the utilizationof enzyme to solve specific nutritional problem.Phytase currently represents the most excitingpotential application of enzyme in the animal feedindustry (Nasi, 1990). Two thirds of thephosphorus in cereal grain is in form of phyticacid, (phytate). This form of phosphorus isbiologically unavailable to monogastric animals, asthey do not produce digestive enzyme (phytase)capable of releasing the phosphate groups fromphytate (Bateman, 1998).Jongbloed et al. (2000) stated that since1990 various experiments with exogenousmicrobial phytase have been reported to quantifytheir effect on the apparent digestibility/availabilityof phosphorus. One of the first and mostinteresting experiments was the dose-responseeffect of microbial phytase (Natusphos ® ) on theapparent digestibility of phosphorus in growingpigs from 20 to 55 Kg (Beers and Jongbloed,1992). Six doses of phytase (from 0 to 1800FTU/Kg) were used in two types of grower’s diets
Animal waste management strategies 269Increase digestible P (g/Kg)1.41.210.80.60.40.20Corn/soy dietBy-product diet0 450 900 1350 1800 2250Phytase (FTU/Kg)Figure 1: Improvement in digestible P bymicrobial phytase (Natuphos) in two dietsfor growing pigs (Beers and Jongbloed,1992)(based either on corn-soybean meal or phytaterichby-products). The efficiency of microbialphytase appeared to be related to its dose and thetype of diet (Figure 1).From 0 – 400 FTU/Kg there was a rapidincrease in microbial phytase efficacy, whichflattened afterwards. In the experiment, it wasshown that microbial phytase was considerablyeffective in enhancing phosphorus digestion andso increases the amount of digestible /availablephosphorus in the feed for pigs.Approximately 67 % of the phosphorus in planttissue is in the form of phytate phosphorus(Myoinositol hexakisphosphate) (Cromwell et al.,1993), which is only minimally available tomonogastric animals since they lack the phytaseenzyme that hydrolyses phytic acid to inositoland/or thophosphate (Peeler, 1972).Supplementation of phytase enzyme in cornsoybeanmeal diet of broiler chickens improves theavailability of phytate bound phosphorus (Simonset al., 1992; Edens et al., 1999). Phytatephosphorus content of corn is 68% of the totalphosphorus, and in soybean meal phytatephosphorus represents 60 % of the totalphosphorus (Edens et al. 1999). Simons et al(1990) demonstrated that in three-week-oldbroilers the availability of dietary phosphorus couldbe increased up to 65 % by means ofsupplemental dietary phytase while reducing fecalphosphorus by 50 %. Furthermore, inclusion ofphytase activity in diets having wheat, triticale,rye, or their by-products resulted in betterphosphorus utilization in poultry (Choct, 2001).The efficacy of microbial phytase depends onanimal related factor such as physiological statusand housing condition (Kemme et al. 1997a).Kemme et al. (1997b) showed that the efficacy ofphytase in generating digestible phosphorusdecreased in the order of lactating sows, growingfinishingPigs, sows at the end of pregnancy,piglets and sows at mid pregnancy.A prerequisite for a good evaluation ofmicrobial phytase efficacy is that the animal be fedbelow their phosphorus requirement. This is due tointestinal regulation of phosphorus absorptionwhen animals are fed above their phosphorusrequirement. It is commonly known that higherdietary calcium levels decrease apparentabsorption of phosphorus. Thus a balance ofcalcium: phosphorus must be established forexcellent performance (Jongbloed, 1993).Reducing Nitrogen Excretion throughNutrition: To reduce the level of nitrogen in fecalmatter through nutrition, two approaches arepossible thus: (I) Enhancement of the depositionof nitrogen in animal products (meat, eggs, milk)and (ii) constant maintenance reduction of dietarynitrogen input while productivity is sustained(Tamminga and Verstegen, 1992). The firstapproach requires the intermediary metabolism tooperate more efficiently, while the secondapproach largely depends on reducing nitrogenlosses along the gastro-intestinal tract.Both approaches will result in a reductionof Nitrogen in animal excreta by 20 %. A moreefficient intermediary metabolism will reducenitrogen excretion in urine by 10 %, whereas areduction in losses from gastro-intestinal willreduce quantities present in both faeces and urineby 30 % (Lenis and Jongbloed, 1994). Feedingration containing a poor balance of amino acidsresults in removal of excess nitrogen in the faeces.Taylor, et al. (1979) indicated that the dietarycontent of total crude protein could be reducedfrom 17.6 % to 14.5 % by the addition ofcrystalline lysine. This leads to improved balanceof essential amino acids present in the diet andbetter protein utilisation.Inclusion of protease in the diet may alsopromote more efficient utilization of dietary protein(Headon and Walsh, 1994). The endogenousproteolytic activities associated with the digestivetract are normally more than adequate to promoteefficient degradation of dietary protein. Forinstance supplementation of feeds with exogenousmicrobial proteolytic activities can serve to improveprotein utilization in animals subject to highprotein intake.Cellulase help in the breakdown of cellwall structure and make nutrients in vegetablematerials much more available to the animal, theyalso break down xylan in cereal grains and reduceviscosity of the digester. The increase in the transittime in the gut leads to increase efficiency ofutilization. The enzyme activation may also help
UCHEWA, Emmanuel Nwafoagu et al. 270promote more efficient digestion of poorlydigestible proteins, such as those found in intimateassociation with some other dietary factors(Bateman 1998).In monogastric animals, proteindigestibility is low for some legume seeds, due tothe presence of anti-nutritional factors (ANF) likelectins and protease inhibitors (Tamminga andVerstegen 1994). Low protein digestion can beovercome by technological treatment of the diet inan optimal combination of temperature, moistureand time. Short treatment at high temperature ismore effective in reducing the antinutritional factorcontent of the dietary ingredient. Reduction in theactivity of proteinous ANF and further breakdownof non-starchy polysaccharides can beaccomplished using enzymes, during germinationand grinding to finer particle size.Beal et al. (1998) in a factorial analysisdemonstrated the difference in the in vitronitrogen digestibility between raw soybean anddifferent full fat soybean meals both with andwithout enzyme treatment at different p H (Table1). Surprisingly, they observed that raw soybeanappeared to be more digestible in pigs thanprocessed soybean meal. However, the pretreatmentof soybean with exogenous enzymesincreases protein digestibility. This is because largemolecular weight proteins are partially hydrolyzedbefore the commencement of digestion. Thedifference in nitrogen digestibility between the rawand processed soybean meal could be due to anumber of factors. Heat denaturation preventingdigestive enzymes to act on amino acid residues,differences in solubility due to the pH of thestomach and loss of available protein due to heatinduced interactions with other substances.Nitrogen excretion can also be reducedsubstantially by supplying dietary amino acids inaccordance with the animal’s requirement and byincorporating free amino acids in the feeds andlowering crude protein content.Multi phase feeding, in which diets can beautomatically adjusted by means of a computercontrolled feeding system may reduce excretion ofnitrogen and phosphorus by 10 and 15 to 22%,respectively. Bourdon and others achievednitrogen and phosphorus reduction applying multiphase feeding to castrated male pigs weighingbetween 25 and 100kg with decreased dietaryprotein levels, and supplementary addition oflimiting amino acids (VanKlooseter et al., 1998).From the experiments they concluded that theamount of nitrogen excreted was reduced by 50%, with multi phase feeding accounting for 0.10%. Van-der Peet-schwering et al. (1996) usingmultiphase feeding for growing and castrated malepigs between 25 and 110Kg live weight. Reportedthat multi phase feeding reduced ammoniaemission by 45%, compared to the single controldiet. Further more, multi phase feeding lead to 22% reduction in phosphorus excretion by growingpigs (Beers and Jongbloed 1992). Results ofKemme et al. (1997a, b) indicated that multi phasefeeding does not always lead to optimumperformance and slaughter quality of pigs.Requirements of nitrogen and phosphorusfor breeding sows are much lower duringpregnancy than during lactation. The use ofseparate diets for pregnancy and lactationcompared with one diet for both reduced theexcretion of nitrogen and phosphorus by 20 %(VanKlooseter et al., 1998).Growth promoters, because of improvedfeed conversion ratios have an estimated 7 and3% reduction on nitrogen and phosphorusexcretion per weaned piglet and growing pigrespectively, according to Jongbloed et al (1992).Both nitrogen and phosphorus excretion can befurther reduced with recombinant porcinesomatotropin (rPST) (Bateman 1998);unfortunately, the use of growth promoters in feedis banned.The source and level of fermentablecarbohydrates in the diet influence ammoniavolatilisation of pig slurry (Coppoolse et al. 1990).In an experiment, using three different treatments,Aarnink and Lenis (1998) fed soluble maize starchin treatment 1 and replaced it with coconutexpeller and soybean hulls in treatment II and IIIrespectively, ammonia volatilisation was decreasedunder laboratory conditions by 0.35%, 0.51% and0.36% respectively. In a second experiment, thesame authors examined the effect of electrolytebalance (Na + K – Cl), Ca-level and Ca-salt onammonia emission from slurry. When CaSO4, Ca –benzoate or CaCl2, replaced CaCO3 respectively,the ammonia emission of slurry under laboratoryconditions was reduced by 30%, 54% and 33%respectively.EFFECT ON THE PERFORMANCE OF THEANIMALThere have been numerous reports on the effectsof microbial phytase and phosphorus utilization. Inaddition to the general established improvementsin phosphorus digestibility, significantly higher liveweight gain and better-feed conversion efficiencyhave often been reported (Beers and Jongbloed,1992; Cromwell, 1980; Dungelhoef andRodehutscord, 1995 and Kemme et al., 1997a).This could be explained by interference of phyticacid with the digestion of other essential mineralsand protein. Phytate complexes in acid andalkaline media have been described (Dierick andDecuypere (1994). In vitro studies have shownthat phytate-protein complexes involving aminogroups of lysine, histidine and arginine are formed,which are insoluble and biologically unavailable in
Animal waste management strategies 271Table 1: In vitro N digestibility (%) in different full fat soybean meals pre-treated withproteases P2, P3, or P4 with pepsin digestion at p H 2Protease 20,000% N digestibilityunits g/N RSB SPC MIC TSD AUTControl 78.5 80.3 74.7 67.8 1 70.1 1P2 85.8 a1 84.0 a1 79.1 a1 73.5 a 81.1 a2P3 88.9 a 84.9 a1 82.7 1 74.4 a 78.1P4 85.8 a1 87.8 a1 77.8 a 74.8 a 82.3 aValues in the same column with the same letter are not significantly different P
UCHEWA, Emmanuel Nwafoagu et al. 272endogenous enzyme production is very rapid,benefits of enzyme addition will be short-lived andof the order of two weeks (Headon and Walsh,1994). α - Amylase addition to a barley diet foryoung pigs improved live weight gain and feedconversion ratio by about 4 %. In grower andfinishing and growing pigs, amylasesupplementation to cereals did not affect pigperformance (Dierick and Decuypere, 1994). Choct(2001) reported significant increase in the liveweight gain and feed conversion efficiency ofchickens fed barley diets. Since it is establishedthat the starch in barley is totally digestible by theamylase secreted by chickens, improvements withamylase supplementation were probably due tothe added enzymes used; i.e. the crude enzymeused contained β - glucanase activity.The effects of added enzymes are greaterin poultry than in pigs and more apparently inyoung than in older animals (Dierick andDecuypere, 1994). However, it is difficult to drawdefinite conclusions. Table 3 shows the meaneffects of simple addition of enzymes to poultryand pigs diets.EFFECT ON THE ENVIRONMENTIn the absence of microbial phytase, onlyapproximately 16 % of phosphorus in corn andapproximately 36 % of phosphorus in soybeanmeal is digested by pigs (Jongbloed et al., 2000).Because of the large amount of undigested dietaryphosphorus, a substantial amount of phosphorus isremoved via the faces. Based on the estimates ofCromwell et al. (1993), a dose of microbial phytaseequal to 1000FTU/g converted approximately onethird of the unavailable phosphorus to an availableform. About 500FTU/Kg of diet generatesapproximately 0.8 g digestible Phosphorus perkilogram of diet, which is equivalent to 1.0 gphosphorus from monocalcium phosphate or 1.23g phosphorus from dicalcium phosphate, which isoften used in the United States.A significant reduction in poultry manurephosphorus can be achieved via the use ofmicrobial phytase in feed. This can reduce thenitrogen: phosphorus ratio in poultry wastes.Blander and Flegal (1997) studied the effect offeed supplemented with allzyme phytase in layerdiets and reported a 16 % reduction in fecalphosphorus from laying hens fed in<strong>org</strong>anicphosphorus at 80 % of NRC requirements and a25 % reduction in fecal phosphorus from layinghens fed 60 % of NRC requirements. A 35 %decrease in fecal phosphorus from laying hensgiven microbial phytase product at 250 FTU/Kgdiet was reported by Coppoolse et al. (1990).Similarly, Blanda and Flegal (1996) reporteddecreased phosphorus excretion in turkeys givenallzyme phytase. The fecal reductions from layinghens and market turkeys given allzyme phytasesupplemented feeds were similar to thephosphorus reduction found in pigs given anotherphytase feed supplement, (Simons and Versteegh,1992) and broilers (Yi et al., 1996).Conclusion: Many of the environmental impact ofpig farming are known and ultimately controllable.The use of enzymes in pig production is an wellacceptedpractice today. Generally, most of theenzymes effectively depolymerise the soluble NSPinto smaller polymers, though some products withaffinity for both soluble and insoluble NSP are alsoused. It is wise to test economic policy andregulatory changes against the environmentalconsequences and ensure proper planning andimplementation of control measures. That said, itis clear that whilst the potential for damage on theenvironment is great, nutritional manipulation toenhance efficient utilisation of Phosphorus andnitrogen by monogastric animals will reduce thedamage done to the environment by these animalsby at least 30 %.REFERENCESAFRC (1991). Live stock feeds and feeding.Agricultural and Food Research Council .Nutrition Abstract and Review, Series B,61: 683 – 722.BATEMAN, G. (1998). Environmental impact ofpollutants from pig farming and currentlegislative developments. Pages 251 –268. In: WISEMAN, J., VARLEY, M. A. andCHADRWICK, J. P. (Ed). Progress in PigScience. Nottingham University Press.Nottingham.BEERS, S. and JONGBLOED, A. W. (1992).Apparent overall (total) digestibility ofphosphorus in relation to doses ofAspergillus niger phytase in diets for pigs.Journal o f Animal Science, 70: 237 – 242.BEAL, J. D., BROOKS, P. H. and SCHOLETZE, H.(1998). The effect of pre-treatment withdifferent proteases on the in-vitrodigestibility of nitrogen in raw soyabeanand four different processed full fatsoybean meals. Pages 112 -115. In: VANARENDONK, J. A. M. DUCROCQ, V., VANDER HONING, Y., MADEC, F., VAN DERLENDE, T., PULLER, D., FOLCH, J.,FERNANDEZ, E. W. and BRUNS, E.W.(ED). Book of Abstract of the 49 th meetingof the European Association of AnimalProduction. Warsaw 24 th – 29 th August,1998.BLANDER, R, J. and FLEGAL, C. (1996). The effectof using phosphate enzyme on theperformance of growing market Turkeys
Animal waste management strategies 273and excreted phosphorus. Poultry Science,75: 52 – 60.BLANDER, R, J. and FLEGAL, C. (1997). The effectof Phytase on egg production and eggspecific gravity in laying hens. PoultryScience, 76(1): 3.CHOCT, M. (2001). Enzyme supplementation ofPoultry diets based on viscous cereals.Pages 145 - 160. In: BEDFORD M. R. andPARTRIDGE, G. C. (Ed). Enzymes in farmanimal nutrition. CABI Publishing.Wallingford, Oxon.COPPOOLSE, J., VAN VUREN, A. M., HUISMAN, J.,JANSSEN, W. M. M., JONGBLOED, A. W.,LENIS, N. P and SIMONS, P. C. M. (1990).The excretion of nitrogen, Phosphorusand potassium by farm animals, now andtomorrow. Landbouwtijdchrift, 45: 909 –927.CROMWELL, G. L. (1980). Biological availability ofPhosphorus in foodstuffs for swine.Foodstuffs, 52: 38 – 42.CROMWELL, G. L., COFFEY, R. D., MONEGNE, H.J. and RANDOLPH, J. H. (1993). Efficacyof low activity phytase in improving thebioavailability of phosphorus in cornsoybeanmeal diets for pigs. Journal o fAnimal Science, 73: 449 – 456.DUNGELHOEF, M and RODEHUTSCORD, M.(1995). Effect of phytase on thedigestibility of phosphorus in pigs. UlbersTierernhrg, 23: 133 – 157.DIERICK, N. A and DECUYPERE, J. A. (1994).Enzymes and growth in pigs. Pages 169 –195. In: COLE, D. J. A., WISEMAN, J. andVARLEY, M. A. (Ed). Principles of PigScience. Nottingham University Press,Leicestershire.EDENS, F, W., PARKHURST, C. R. andHARVENSTEIN, G. B. (1999). Allzymephytase reduces phosphorus and nitrogenexcretion by caged broilers and by broilersin conventional housing. Pages 491 – 150.In: LYON, T. P. and JACQUES, K. A. (Ed).Biotechnology in the feed industry.Proceedings of Alltech’s 15 th AnnualSymposium. Nottingham University Press.Nottingham.ERDMAN, J. W. (1979). Oil seed phytases.Nutritional implications. Journal of AnimalScience, 56: 736 – 741.GORANSSON, L. (1997). Alternatives to antibiotics– The influence of new feeding strategiesfor pigs on biology and performance.Pages 451 - 462. In: WISEMAN, J. andGARNSWORTHY, P. C. (Ed). Recentdevelopment in pig nutrition 3.Nottingham University Press. Nottingham.HEADON, D. R. and WALSH, G. (1994). Biologicalcontrol of pollutants. Pages 196 – 213.In: COLE, D. J. A., WISEMAN, J. andVARLEY, M. A. (Ed). Principles of PigScience. Nottingham University Press,Leicestershire.HORN, D. B. and SQUIRE, C. R. (1997). Animproved method for the estimation ofammonia in blood plasma. Journal ofVeterinary Science, 17: 99 – 108.JONGBLOED, A. W., KEMME, P. A. and MROZ, Z.(1993). The role of microbial phytase inpig production. Pages 173 – 180. In:WENK, C. and BOESSINGER, M. (Ed).Enzyme in Animal production. Proceedingsof the 1 st Symposium, Kartanse Ittingen,Switzerland.JONGBLOED, A. W. and MROZ, Z. (1999).Influence of phytase on availability ofphosphorus, amino acids and energy inswine. Pages 1 – 20. In: COLE, D. J. A.,WISEMAN, J. and VARLEY, M. A. (Ed).Principles of Pig Science. NottinghamUniversity Press, Nottingham.JONGBLOED, A. W., KEMME, P. A., MROZ, Z. andDIEPEN, H. T. M. (2000). Efficacy, useand application of microbial phytase in pigproduction, a review. Pages 111 – 130.In: LYONS, T. P. AND JACQUES, K. A.(ED). Biotechnology in the feed industry.Proceedings of Alltech’s 16 th AnnualSymposium. Nottingham University Press,Nottingham.KEMME, P. A., RADCLIFFE, J. S., JONGBLOED, A.W. and MROZ, Z. (1997a). The effect ofbody weight, housing, and calculationmethod on mineral digestibility and theefficacy of microbial phytase in diets f<strong>org</strong>rowing finishing pigs. Journal of AnimalScience, 75: 2139 – 2146.KEMME, P. A., RADCLIFFE, J. S., JONGBLOED, A.W., MROZ, Z. and BREYNEY, A. C.(1997b). The efficacy of Aspergillus nigerphytase in reducing phytate phosphorusavailable for absorption in pigs influencedby their physiological status. Journal ofAnimal Science, 75: 2129 – 2138.LENIS, N. P. and JONGBLOED, A. W. (1994).Modelling animal feed and environment toestimate nitrogen and mineral excretionby pigs. Pages 342 – 351. In : COLE, D. J.A., WISEMAN, J. and VARLEY, M. A.(Eds). Principles of Pig Science.Nottingham University Press, Nottingham.MAFF (1991). Code o f good agricultural practicefor the protection of water. Ministry ofAgriculture, Fisheries and Food, UnitedKingdom. 120 pp.MAFF (1996). Agriculture in the United Kingdom.Ministry of Agriculture, Fisheries and FoodUnited Kingdom. 110 pp.
UCHEWA, Emmanuel Nwafoagu et al. 274NASI, M. (1990). Microbial phytase supplementationfor improving availability ofplant phosphorus in the diet of thegrowing pigs. Journal of AgriculturalScience, 62: 435 – 443.PEELER, H. T. (1972). Biological availability ofnutrients in feed. Availability of majormineral ions. Journal of Animal Science ,35: 695 – 699.QIAN, H. E., KORNEGAY, T. and DENBOW, D. M.(1996). Phosphorus equivalence ofmicrobial phytase in Turkey diets asinfluenced by calcium to phosphorusratios and phosphorus levels. PoultryScience, 75: 69 – 81.SCHONER, B. R. J., HOPPE, P. P., SCHWARZ, G.and WIEESCHE, H. (1991). Comparativeeffects of microbial phytase and in<strong>org</strong>anicphosphorus on performance and retentionof phosphorus, calcium and crude ash inbroilers. Journal of Animal Nutrition, 66:248 – 255.SCHONER, B. R. J., HOPPE, P. P., SCHWARZ, G.and WIEESCHE, H. (1993). Effects ofmicrobial phytase and in<strong>org</strong>anicphosphorus in broiler chickens:performance and mineral retention atvarious calcium levels. Journal of AnimalNutrition. 69: 235 – 244.SIMONS, P. C. M. and VERSTEEGH, H. A. J.(1992). The effect of the addition ofmicrobial phytase to layer feed on thetechnical result and skeleton and eggshellquality. Spelderholt Publication, No. 568:223 – 231.SIMONS, P. C. M., JONGBLOED, A. W.,VERSTEEGH, H. A. J., SLUMP, P., BOSS,K. D., WOLTERS, M. G. E., BENDEKER, R.F. and VERSCHOOR, G. J. (1990).Improvement of phosphorus availabilityby microbial phytase in broiler and pigs.British Journal of Nutrition, 64: 525 – 540.SWICK, R. A. and IVEY, F. J. (1990). Effect ofdietary phytase addition on broilerperformance in phosphorus deficientdiets, Poultry Science, 69: 133 – 142.TAMMINGA, S. and VERSTEGEN, M. W. A. (1992).Implications of nutrition of animals onenvironmental pollution. Pages 342 – 351.In: GARNSWORTHY, P. C., HARESIGN, W.and COLE, D. J .A. (Eds). RecentAdvances in Animal Nutrition. NottinghamUniversity Press. Nottingham.TAYLOR, A. J., COLE, D. J. A. and LEWIS, D.(1979). The effect of crystalline lysine inthe utilization of dietary protein by pigs.Journal o f Animal Science, 65: 481 – 487.VANKLOOSTER, C. E., van der PEET-SCHWERING,C. M. C., AARNINK, A. J. A. and LENIS, N.P. (1998). Pollution issues in pigoperations and the influence of nutrition,housing and manure handling. Pages 507– 518. In: WISEMAN, J., VARLEY, M. Aand CHADWICK, J. P. (Eds). Progress inPig Science. Nottingham University Press,Nottingham,VAN DER PEET-SCHWERING, C. M. C., VERDOES,N., VOERMANS, M. P and BEELEN, G. M.(1996). Animal Nutrition and ammoniaemission. Pages 618 – 626. In: VAN DERAAR, P. J., AARNINK, A. J. A., BLOK, M. Cand VAN VUUREN, A. M. (Eds). State ofthe art in research. The Netherlands.YI, Z., KORNEGAY, E. T. and DENBOW, D. M.(1996). Improving phytate phosphorusavailability in corn and soybean meal forbroilers using microbial phytase andcalculation of phosphorus equivalencyvalues for phytase. Poultry Science, 75:240 – 249.
Animal Research International (2005) 2(1): 275 – 286 275CYTOGENETIC V<strong>ARI</strong>ATIONS IN Clarias species (CL<strong>ARI</strong>IDAE:SURULIFROMIS) OF THE ANAMBRA RIVER USINGLEUCOCYTES CULTURE TECHNIQUESEYO, Joseph EffiongDepartment of <strong>Zoo</strong>logy, University of Nigeria, Nsukka, NigeriaABSTRACTCytogenetic variations among four Clarias species from Anambra river, Nigeria were studiedusing leucocytes culture techniques. Heterogeneity in chromosome number (2n = 48 inClarias ebriensis and C. albopunctatus to 2n = 56 in C. anguillaris and C. gariepinus) andKaryotype morphologies occurred among the cl ariids . The chromosomes were characterizedby a high proportion of meta-submetacentric chromosomes and low proportion of acrocentricchromosomes . The females karyotype morphologies exhibited a heteromorphic pairsuspected to be the sex chromosome complex. The following formulae were established forthe male clariids; C . ebriensis 6m + 22sm + 20a FN =76; C.albopunctatus 4m ± 22sm + 22aFN = 74; C. gariepinus 8m + 24a FN = 88; and C. anguillaris 8m + 26m + 22a FN = 90. Thef emale karyotype morphologies were C . ebriensis 6m + 23sm + 19a FN = 77, C. albopunctatus4m ± 23sm + 21a FN = 75, C. gariepinus 8m + 25sm + 23a FN = 89 and C. anguillaris 8m +27sm + 21a FN = 91. A generic chromosomal number of 2n = 54 + 4 for the clariids wassuggested. The almost uniform karyotype morphologies and the closeness of the chromosomenumbers around the generic chromosome number may suggest success with which theclariids may hybridize in nature.Keywords: Cytogenetics, Chromosomes, Karyotype, Idiogram, Clarias, Clariidae, Leucocyte cultureINTRODUCTIONKaryological evidences have often been utilized insolving problems relating to speciation, identity ofsex determining chromosome, phyleticrelationship, the taxonomic status and identity ofboth interspecific and even intergeneric hybridsamong <strong>org</strong>anisms. Concerning speciation, newevidence suggests that karyotype plays a primaryrole (White, 1978) contrary to Mayr (1963) originalhypothesis that only polyploidy and geographicalisolation lead to the formation of new species.Fish comprises polyphyletic group which hasundergone an enormous expansion, the number ofexisting species totals about 20,000 (Lagler et al.,1977). This is about 48.10 % of all the existingvertebrates. The capacity of this group to adapthas led to their colonization of extremelyspecialized niches. Pisces explosive expansioncannot be explained wholly in terms ofgeographical isolation since chromosomemechanism probably plays a role in speciation(Sola et al., 1981).About 1000 to 1500 species have beenstudied out to the 20,000 species (Lagler et al.,1977). Evidence has been found of evolution bypolyploidization in the Cypriniidae (Wolf et al.,1969) and Salmoniidae (Ohno et al., 1969) usingkaryological techniques. In salmonids currentlyundergoing expansion, chromosome polymorphismswere shown (Th<strong>org</strong>aard, 1977). In thePoecilids, speciation may occur by interspecifichybridization. This apparently applies to Poeciliaformosa Bloch, 1801; whose hybrid origin is widelyaccepted based on morphological and karyologicalcharacteristics (Prehn and Rasch, 1969).The teleosts provide good materials forcytologists working on sex determinationproblems. In most species sex chromosome areabsent or not morphologically identified. However,some species are known to exhibit maleheterogamete whereas others have femaleheterogamete. Kallman (1973), reported thatallopathic populations of the same species maydisplay female or male heterogamete as shown inXiphophorus maculates Hecke, 1848 in which thesex chromosomes were identified by means ofpigment gene marker showing a sex-linkedhereditary patterns. Feldber et al., (1987) showedthe occurrence of chromosome system for sexdetermination of ZZ/ZW type in Semaprochilodustaeniurus Newton, 1978 (Pisces: Prochilodontidae)which is lacking in Semaprochilodus insignis C. andV., 1929. Chromosome W found in the femalewas the largest in the complement. ChromosomeZ was the next largest complement and tentativelyconsidered as pair number one in males. Heaf andSchmid (1984) have shown sex-chromosomedifferentiation in another poecillid species, Poecilliasphnops var. melonistica Jordan and Snyder, 1906.
EYO, Joseph Effiong 276Karyotype evolution and geographicaldistribution among fishes have been studied. Inthe genus, Oryzias; Oyzidae, Uwa (1986), Uwaand Parenti (1988) and Uwa et al., (1988) dividedthe rice fish into three groups: monoarmedchromosome type (O. melastigma Jordan andStarks, 1906 (Uwa and Iwata, 1981) O. javanicusJordan and Starks, 1906 (Uwa and Iwata, 1981),biarmed chromosome type O. sp. (Oryzias species)(Uwa and Magtoon, 1986) O. curvinotus Jordanand Starks, 1906 (Uwa, et al., 1982), and fusedchromosome type (O. celebensis Jordan and Seale,1906 and O. minutillus Jordan Starks, 1906 inSouth and South Eat Asia to the Indian ocean.The biarmed chromosome types are distributed inEast Asia and Luzon. The degree of the karyotypeevolution by increased of biarmed chromosomenumber in this group seems to correlate with thegeographical distribution from Indo-China to Japanand Luzon to China. Members of the fused armchromosome types are found in Sulawesi andThailand.Cytogenetical investigations amongteleosts has revealed inter and intra-specificvariations in nucleolar <strong>org</strong>anizing region (NOR).Feldberg and Bertollo (1985) noted among the neotropical cichlids that the NORs were located on thefirst chromosome pair in the complement andcoincided with secondary constrictions observedthere, whereas in Cichlasoma facetum Swainson,1839 and Geophagus brasilcensis Heckel, 1840,the NOR were located on another chromosomepair. NORs have been investigated in several fishspecies, such as Carassius sp. Nilsson, 1832(Funaki et al., 1975; Ojima and Yamano, 1980),Umbra limi Gronow, 1763 (Kligerman and Bloom,1977), cichlid fishes (Kornfield et al., 1979),Fundulus diaphanous Lacepode, 1803 (Howel andBlack, 1979). In the fish species, the NORs wereusually located near the telomeric regions ofsatellite chromosomes except for F. diaphanouswhere they were located on the secondaryconstriction of the sex chromosomes. The NORsare of obvious importance to geneticists.Kligerman and Bloom (1977) reported that theNORs are sites of prior genetic activities and wheresatellite chromosomes occur. This chromosomepair could serve as an adequate marker as inUmbra limi.The interests of cytogeneticists andevolutionists are closely connected with that ofichthyologists in the study of hybrids. In thefreshwater bony fish, evidences were frequentlyfound in interspecific and even intergeneric hybridswhere sympatric populations of different speciesexist. The development of fish culture hasresulted in numerous experiments on hybridizationto obtain new strains, which are more diseaseresistant, faster growing than their relative wildstock. In such case, karyological knowledgeallows the parent species to be recognized andgive some indication of the likelihood of success inthe case of artificial crossbreeding. Furthermore,it may help to make predictions concerning hybridfertility and the interactions of two parental stocks.Although it is not possible to drawabsolute conclusion about phyletic relationshipsfrom karyological comparison of different species,karyotype analyses have supplemented othertaxonomic evaluating methods. The systematicdefinition of species depends on a carefulmorphological analysis, and the karyotype is amajor morphological character among severalothers.The phyletic relationship among thesiluriform fishes based on karyotype and variationin chromosomal number revealed that, Bagremarinus Catesby, 1771 had 2n = 54 chromosomescomposed of 12 metacentric, 8 submetacentricand the remainder with terminal or near terminalcentromere (Fitzsimons et al., 1988).Furthermore, the karyotype of three species ofariid catfishes (Arius dussumier C and V, 1840,Arius felis C and V 1840 and Bagre marinus)indicated the same diploid chromosomal number,but each species had a different arm number.Data for 132 species in 14 families of catfishesindicated a predominance of 56 ± 2 chromosomesin the diploid set (Fitzsimons et al., 1988).According to them, the range in diploid numberwas most common among the Ariidae, Bagridae,Ictaluridae and Pimelodidae, which together havebeen suggested from osteological evidence asforming a group close to the ancestral stock fromwhich present day catfish evolved. In a study ofchromosomal evolution among the Ictaluridcatfishes, LeGrande (1981) observed that a diploidchromosome number of 56 ± 2 was wide among70 species of catfishes in 10 families and wasespecially more frequent in four families, theAriidae, Bagridae, Ictaluridae and Pimelodidae. Inaddition, average diploid count of 56 modal countfor catfishes were approximated from the averagesand / or modal counts of ariids, (all 54), bagrids(mostly between 50 and 60, with a weak mode at52), clariids (50, 52 and 56), ictalurids (mostlybetween 56 and 60 with exclusion of divergentkaryotype in Noturus) and Primelodids (mostly 56).LeGrande (1981) hypothesized an ancestralkaryotype of 2n = 56 for Ictalurids and pointed outthat the closeness in this number to thosereported for the Ariidae, Bagridae and Pimelodidaecoincides with Gosline (1975 a, b) suggestion thatthese families plus Doradidae constitute a groupnear the ancestral stock from which living catfishesevolved. Considering the Clariids, Teugels et al.(1992) reported a standard karyotype of 2n = 56for Clarias gariepinus and 2n = 52 forHeterobranchus longifilis Valenciennes, 1840.Their hybrids revealed an intermediate karyotype
Cytogenetic variations in Clarias species 277of 2n = 54. Furthermore, sex chromosomes wereobserved as ZW heteromorphic pair in femalehybrid karyotypes. The ZZ chromosome pair inmale hybrids was similar to that found in male C.gariepinus and male H. longifilis.Hartley (1987) divided the species of thesub-order: Salmonidea into two groups (categoriesA and B) based on chromosome number,chromosome arm number, and the distribution ofone-armed and two-armed chromosomes.Category A karyotypes were widespread both interms of geographic distribution and number ofspecies, while category B karyotypes wererestricted to member of the genera Salmo andOncorhynchus. In category A, it was assumedthat tetraploidy followed arrangement of thediploid ancestral karyotype of 2n = 50, NF = 60(the lowest diploid and chromosome arm numberfound in the smolts) and that the resultingancestral tetraploid salmon had 2n = 100, NF =120 karyotype. Hartley (1987) observed that aseries of pericentric inversion and centric fusionshad reduced chromosome number andchromosome arm number through Brachymystazlenok Gunter, 1866, (2n = 94, NF = 116) andHucho hucho Gunter, 1866, (2n = 82, NF = 114)to the category A karyotypes (2n = 80, NF = 100)and finally to the category B karyotypes (2n = 60,NF = 104). He concluded that by the time thecategory B karyotypes were achieved, centricfusions had played a far greater role in theevolution of the vast majority o the salmonidskaryotypes than pericentric inversions, althoughthe latter had played important role in theevolution of the Atlantic salmon karyotype.The karyotypic evolution of tenNeotropical cichlids showed that the chromosomeevolution of the group was more conservative thandivergent (Feldberg and Bertollo, 1985). Allspecies had a chromosome number of 2n = 48,though with some differences in chromosomemorphology. Pericentric inversions were probablythe main event that led to the karyotypes morecommonly found in this group. On the basis offundamental number (FN), four general groupsreflected the occurrence of a progressive numberof chromosome rearrangements. Group one withFN = 48, (represented by Chaetobranchopsisaustralis Eigenmann and Ward 1907), group twowith FN = 50 – 52 (comprising Geophagusbrasiliensis Heckel, 1840; G. surinamensis Heckel,1840 and Gymnogeophagus balzanii Ribeiro,1918), group three with FN = 54 (represented byCrenicichla lacustris Ribeiro, 1918, C. lepidotaHenkel, 1840 and C. vittala Heckel, 1840 and toBatrachops semifasciatus Heckel, 1840), groupfour with FN = 58 – 60 (represented by Astronotusocellatus Swainson, 1839 and Cichlasoma facetumSwainson, 1839) (Feldberg and Bertollo, 1985).Despite the constancy of chromosome number, 2n= 48, a few distinctive characteristics which areproducts of structural rearrangements ofchromosomes that occurred during their karyotypicevolution can be seen in some species or group ofspecies.Ichthyologists and fish taxonomists in theclassification of related species have often employknowledge from karyotype. For instance, thelarval forms of most species are morphologicallyidentical and quite different from the adult forms.Because of the resemblance among larval forms,their identification if often difficult. Morphologicalobservations are inadequate vis-à-vis theidentification of the species, except where thedevelopmental stages can be followed, which isusually difficult and not documented for many fishspecies. In such cases, Sola et al. (1981) notedthat the knowledge of the karyotype and theirdiversified forms might provide a precisediagnostic criterion. Oliveria et al. (1988) basedthe classification of Neotropic Ostrariophysi onkaryotypic data and noted that 2n = 50 tend toprevail among Ostrariophysi. This character wasalso seen among the Otophysi (2n = 50). TheCypriniformes have a second modal number of 2n= 100, often seen among the families ofCyprinidae and Catostanidae. Yu et al. (1987)proposed that the cypriniformes might haveoriginated from 2n = 50 ancestors. Thecharaciphysi and characiformes differ from thecypriniforms by having almost 2n = 54. Amongthe characiformes, several groups may becharacterized based on their chromosome number.The characiforms, erythrinidae and lebiasinidae aretypified by chromosome number of less than 2n =54 while the Serrasalminae are characterized bychromosome number of more than 2n = 54.From the foregoing review, karyotypicinformation appears to be very important indiscriminating species. The technical andinterpretation problems often encountered by fishcytologists should not be employed as a base forjudging the validity of karyotypic information vis-àvisclassification of related and unrelated species.The identification of artificial (diploidy and/orpolyploidy) and natural hybrids, and of sexdetermining chromosomes is currentlycytogenetically accomplished. For a properdiscrimination of the species, information from fishmolecular biology, anatomy, anatomy, physiologyethology and ecology is highly desirable. Thisstudy further enriches the information on fishcytogenetic by investigating into the karyotypicvariations among members of the Pisces familyClariidae of Anambra river, Nigeria usingleucocytes culture techniques.
EYO, Joseph Effiong 278MATERIALS AND METHODSCollection and Care of Catfish: Catfishspecimens were collected from Anambra river,Nigeria. The fish were captured using set nets(mesh size 70 mm – 120 mm) and long line baitedwith earthworm and palm fruits. Specimens werealso bought from the fishers at the landing site. Allcatfishes were transported to Fisheries andHydrobiology wet laboratory, Department of<strong>Zoo</strong>logy, University of Nigeria, Nsukka.Identification and classification of fish were donewith Lowe-McConnell (1972), Sydenham (1983)and Ezenwaji (1989) (see Eyo, 1997). Livespecimens were given 1 ppm potassiumpermanganate (KMnO 4 ) flush prophylactictreatment for 10 minutes. This was to avoid theintroduction of wild ectoparasites and pathogens.Catfishes were acclimatized in nine aquaria tanks(80 x 40 x 40 cm) in groups of eight fish per tankfor 14 days. All fishes were fed with 5 % bodyweight daily with 40 % formulated fish feed (Eyo,2004a). All other culture conditions were asexplained in Eyo and Ezechie (2004).Phytohaemaglutinin Extraction: Phytohemaglutinin(PHA) used for this study wasextracted from kidney bean, Phosealus vulgarisusing a modified method of Rigas and Osgood(1954). Finely ground and sieved red kidney beanseed (250 grams) was digested with one litre of 1% NaCl for twenty-four hours at 4 0 C refrigeration.The extract was centrifuged at 1400 rpm for 15minutes using Multex centrifuge. The light yellowsupernatant was recovered and the precipitatediscarded. The supernatant was adjusted to pH5.7 and cold ethanol added to final concentrationof 30 % ethanol, and centrifuged at 1400 rpm for15 minutes. The precipitate was rejected and 400ml of 10 % ethyl ether, absolute ethanol and 75% ethanol in the ratio (1:1:1) was added to theyellow supernatant. A milky white colourdeveloped upon shaking. The milky whitesupernatant was re-incubated at 4 0 C refrigerationfor 24 hours.After the re-incubation, the extract wascentrifuged at 1400 rpm for 15 minutes. Theresulting yellow supernatant was discarded. Themilky white precipitate was dissolved in 150 ml of1 % NaCl. The pH was re-adjusted to 5.7 and theethanol fractionation repeated by adding 300 ml of1:1:1 volume of absolute ethanol, 10% ethyl etherand 75% ethanol. The resulting milky whiteextract was shaken vigorously and re-incubated at4 0 C for 24 hours. The extract was centrifuged at1400 rpm for 15 minutes. The resulting lightyellow supernatant discarded and the milky whiteprecipitate dissolved in 150 ml of 1% sodiumchloride. The ethanol fractionation was repeatedby adding 200 ml of 1:1:1 volume of ethanol, 10%ether and 75% ethanol. The extract wasvigorously shaken and centrifuged at 2000 pm for15 minutes. The milky white precipitate wasdissolved in 100 ml of 0.1M phosphate buffer pH8.0 and 40 ml of saturated ammonium sulphatesolution added. A light pink colour developed.The light pink extract was centrifuged at 2000 rpmfor 15 minutes and the precipitate discarded, 105ml of saturated ammonium sulphate solution wasadded to 150 ml of the supernatant, shakenvigorously and centrifuged at 2000 rpm for 15minutes. The precipitate was dissolved in 100 mldeionized water, shaken vigorously andcentrifuged.The procedure was repeated by adding 50ml of deionized water and 17.5 ml of saturatedammonium solution was added. The extractedwas vigorously shaken and centrifuged at 2000rpm for 15 minutes. The phytohaemagglutinin(PHA) was freed from the ammonium sulphate bydissolving the light pink precipitate in 50 ml ofdeionized water, vigorously shaken andcentrifuged. This procedure was repeated twice,and the resulting phytohaemagglutinin (2 grams)was freeze-dried. A stock solution of 1 mg ml -1phytohaemagglutinin was made by dissolving 0.1gram of PHA in 100 ml of 0.85 % sodium chloridesolution. The stock solution was stored at 10 ± 50 C.Blood Sampling: Blood was collected by heartpuncture after anaesthezing the catfishes inL/1500 solution of MS-222 (Methanesulfonate salt)for 3 minutes. The abdomen wiped with absoluteethanol and the visceral cavity opened to exposethe heart. One ml of blood was obtained using asterile 2 ml plastic syringe containing 0.2 ml of 0.1M sodium citrate (an anticoagulant) with a 21gauge, 1-inch needle. The sampled blood fromeach catfish was stored in a labeled sterile capped5 ml plastic tube at 10 ± 5o C until used.Contamination of sampled blood was avoided bydealing with only one sex of a fish species per day.All the equipments were heat sterilized before andafter use. Catfishes sampled for blood were 20males and 18 females of Clarias gariepinus, 21males and 24 females of Clarias anguillaris, 30males and 21 females of Clarias ebriensis and 26males and 30 females of Clarias albopunctatus.Blood Leucocytes Separation: Blood leucocyteswere separated by three simple sedimentationmethods modified from Blaxhall (1981) and theleucocytes-rich supernatant used as inoculums.The methods were:1. Hank’s balance salt solution (HBSS)sedimentation: 1 ml of anticoagulatedblood was diluted with 1 ml of HBSS andmixed by gentle inversion in 5 ml sterile
Cytogenetic variations in Clarias species 279caped plastic test tube. The content wascentrifuged at 2,700 rpm for 3 minutesusing micro angle centrifuge.2. Hank’s balance salt solution plusphytohaemagglutinin separation: 1ml of HBSS and 0.2 ml of 1 mg ml -1 PHAwere added to 1 ml of anticoagulatedblood. The contents were mixed andcentrifuged at 2, 700 rpm for 3 minutes toensure proper settling out of erythrocytes.3. Phytohaemagglutinin separation: 1ml of anticoagulated blood was dilutedwith 0.2 ml of 1 mg ml -1 PHA. This wasmixed by gentle inversion in a sterile 5 mlcapped plastic test tube. The content wascentrifuged at 2,700 rpm for 3 minutes.In each case, the leucocyte richsupernatant was used as inoculum.Blood Leucoyte Culture Techniques: Thecomplete culture medium used composed of 20 mlof HBSS, 2 ml of Eargle’s Essential CultureMedium. Laboratory prepared phytohaemagglutininwas added to make up either 5 % of theentire culture medium. Furthermore, freshlyprepared rabbit sera were added to make up 20 %of the entire culture medium. The completemedium was aseptically filtered using membranefilter. The complete culture medium (5 ml) wasplaced in sterile tube. Various glass and plasticsterile test tubes were tried for culturing of fishleuocytes. About 0.05 ml of leucocyte richsupernatant was aseptically placed on the bottomof the culture tube containing 5 ml of the completeculture medium using a sterile 1 ml syringe fittedwith 26-gauge 1¼-inch needle. Culture vials wereincubated at 36 ± 1 0 C for 72 hours.Chromosome Harvesting and SlidePreparation Techniques: The cultured leucocytecells were arrested 3 – 6 hours with 0.3 µg ml -1 ofcolchicine solution before the end of the 72 hoursculture period to give good mitotic chromosomespread for karyotyping (Eyo, 1997). At the end ofincubation and metaphase arresting period, thecells were harvested by centrifuging at 1000 rpmfor 5 minutes. The supernatants were discardedand the white button-like residue given 5 ml of0.075 M KCl hypotonic treatment for 10 minutesand expirated using a micropipette. The residueswere obtained through centrifugation and thesupernatants discarded. 2 ml of freshly preparedcold Carnony’s fixative (absolute ethanol andglacial acetic acid (3:1)) was added to the residuecells, expirated to disperse the cell pellets and leftstanding for 15 minutes. The fixation process wasrepeated twice at 15 minutes intervals. After thefinal centrifugation, the fixative was decantedleaving about 3 drops in which to re-suspend thecells through expiration. The chromosome spreadwas accomplished using a modification of Mellman(1965) air-dried technique.Thoroughly clean grease free slides(commercially pre-cleaned slides) were dipped intodeionized water and frozen. The chilled slideswere observed for cleanliness by adherence ofwater film. Excess fluid was shaken off and onedrop of cells suspension was placed on the centerof the wet slide inclined at an angle of 45 0 . Ablotter placed underneath the slides removedexcess fluid. Drying was completed immediatelyby blowing the slides to promote evaporation andby gentle warming under 80 watts electric bulb.The quality of slides was checked using ahand lens. Inadequate spreading was correctedby re-fixation of the cells. Slides were stained in10 % buffered Giemsa stain for 5 minutes, anddehydrated for 1 min each in two jars of acetone,one jar of acetone and xylene solution (1:1) andfinally one jar of xylene. Slides were observed todestain in acetone when shaken and or agitated.Thus, shaking and agitation was avoided. Slideswere scanned for metaphase chromosomes usinga binocular light microscope at X 1500magnification. Slides with good metaphasechromosomes were processed into permanentmounts. The chromosomal arm lengths weremeasured to the nearest micron using ocularmicrometer.Chromosome Analysis Nomenclature: Tenslides per species showing good metaphasechromosome were analysed. The frequency ofdiploid chromosomes number per species wasrecorded. The maximum or minimum mean andmodal chromosome number were computed foreach species. F-LSD was employed to separatethe differences in modes. The arm ratio r, (longarm L/ short arm S) and the centromeric index i(100 x short arm/total length of chromosome)were calculated. Furthermore, each chromosomewas classified into any of the six groups; M, m,sm, st, t, and T based on Levan et al. (1964)classification (Table 1).Table 1: Chromosome arm nomenclaturerelevant to Clariid cytotaxonomyTerm Location d value r valueM Median point M 00 1.0m median region m 0.0 – 2.5 1.01 -1.7Sm Submedian region Sm 2.5-5.0 1.7-3.0St subterminal region st 5.0-7.5 3.0-7.0t(a) terminal region t 7.5-10 7.0-00T(a) Terminal point T 10-0 00
EYO, Joseph Effiong 280Based on the nomenclature, the karyotypicdifference within and between the Clarias specieswere ascertained.length percentage distribution of 8.80 % to 4.40% with bimodal chromosome percentage totallength of 6.60 %, made up of 40.00 % medianRESULTSCytogenetic Variations among four ClariasSpecies from Anambra River, Nigeria: Tables2 and 3 illustrates the modal chromosomes andkaryotype morphology distribution respectivelyamong the Clarias species of Anambra river. Themodal metaphase chromosome numbers were 2n= 48 in C. ebriensis, 2n = 48 in C. albopunctatus,2n = 56 in C. gariepinus and 2n = 56 in C.anguillaris. They were characterized by a highproportion of meta-submetacentric chromosomesand low proportion of acrocentric chromosomes.All female karyotypes exhibited a heteromorphicpair suspected to be sex chromosome complex.The following formulae were established for themale clariids; C. ebriensis 6m + 22sm + 20a FN=76; C. albopunctatus 4m ± 22sm + 22a FN = 74;C. gariepinus 8m + 24a FN = 88; and C.anguillaris 8m + 26m + 22a FN = 90. The femalekaryotype morphologies were C. ebriensis 6m +23sm + 19a FN = 77, C . albopunctatus 4m ±23sm + 21a FN = 75, C. gariepinus 8m + 25sm +23a FN = 89 and C. anguillaris 8m + 27sm + 21aFN = 91. Furthermore, figures 1 – 4 displaysrepresentative metaphase chromosomes of malesand females Clarias species from Anambra River,Nigeria.The karyotype distributions and idiogramswere developed based on chromosomenomenclature of Clarias species using theircentromeric indices and presented on figures 5and 6, 7 and 8, 9 and 10 and 11 and 12 for malesC. ebriensis, C. albopunctatus, C. gariepinus andC. anguillaris respectively. In C. ebriensis, six (6)chromosomal length distributions occurred withmodal chromosome percentage total length of7.00 %. Seventy five percent of the modalchromosomes were submedian chromosomeswhile 12.50 % were both median and terminalchromosomes (Figure 5 and 6).In C. albopunctatus, the chromosometotal length percentage distributions exhibitingbimodal length peaks of 9.01 % made up of 50.00% submedian and 50.00 % terminalchromosomes; and 7.50 % made up of 100%submedian chromosomes (Figures 7 and 8). C.gariepinus exhibited chromosome total lengthpercentage distributions of 8.37 % and 3.90 %with modal chromosome percentage length of 5.58%. Fifty-seven percentage (57.00 %) of the modalchromosome percentage total length distributionwere submedian chromosomes while 29.00 %were terminal chromosomes with only one (14.00%) median chromosome (Figure 9 and 10).Similarly, C. anguillaris exhibits chromosome totalMaleFemaleFigure 1: Metaphase chromosomes ofClarias ebriensis from Anambra river,Nigeria (bar = 10µ)MaleFemaleFigure 2: Metaphase chromosomes ofClarias albopunctatus from Anambrariver, Nigeria (bar = 10µ)MaleMaleFemaleFigure 3: Metaphase chromosomes ofClarias gariepinus from Anambra river,Nigeria (bar = 10µ)FemaleFigure 4: Metaphase chromosomes ofClarias anguillaris from Anambra river,Nigeria (bar = 10µ)chromosomes and 60.00 % terminalchromosomes; and 5.52 %, made up of 100 %submedian chromosomes. The chromosome totallength has been categorized into 13 length groups(Figures 11 and 12).
Cytogenetic variations in Clarias species 281Table 2: Frequency distribution of the diploid chromosome number among Clarias speciesfrom Anambra River, NigeriaSpecies No. of slides scanned Diploid chromosome numberMale Female Total 48 49 50 51 52 53 54 55 56 57 58C. ebriensis 4 3 7 17 6 - 1 5 8 8 - 10 1 -C. albopunctatus 2 3 5 15 2 3 2 8 - 14 8 2 - -C. gariepinus 4 3 7 7 - 3 3 2 - 10 - 11 - 3C. anguillaris 2 4 6 6 3 3 - 4 4 6 - 8 - 3Table 3: Karyotype distribution among Clarias species from Anambra River, NigeriaSpeciesKaryotypeMale FN Female FNC. ebriensis 6m + 22sm + 20a 76 6m + 23sm + 19a 77C. albopunctatus 4m + 22sm + 22a 74 4m + 23sm + 21a 75C. gariepinus 8m + 24sm + 24a 88 8m + 25sm + 23a 89C. anguillaris 8m + 26sm + 22a 90 8m + 27sm + 21a 19Figure 5: Karyotype of Clarias ebriensis from Anambra river, NigeriaRelative chromosome length in percentage109876543210123456789101122334 5 67 84 5 67 89 10119 1011Short Arm (S) %12 14 1513 16 17 18 1914 151216 17 18 1913Long Arm (L) %20 2122 23 2420 212223 24Figure 6: An idiogram of the karyotype of male Clarias ebriensis showing themorphology of the chromosomes. The 0 represents the position of the centromereDISCUSSIONThe chromosome number of Clarias species ofAnambra river, varied from 2n = 48 to 2n = 56with modal chromosome number of 2n = 56 in C.gariepinus and C. anguillaris. The observed rangeand modal chromosome number is in agreementwith Ozouf-Costaz et a l. (1990) for the clariids.
EYO, Joseph Effiong 28210Figure 7: Karyotype of Clarias albopunctatus from Anambra river, Nigeria8Short Arm (S) %Relative chromosome length in percentage642012345678910112 32 34 5 645 67 87 89910 1110 1112 13 14 15 1617 18 19 2012 13 14 15 16 17 18 19 20Long Arm (L)%212122 23 2422 23 24Figure 8: An idiogram of the karyotype of male Clarias albopunctatus showing themorphology of the chromosomes. The 0 represents the position of the centromereTeugels et al. (1992) reported 2n = 52 forHeterobranchus longifilis Valenciennes, 1840 and2n = 54 in the hybrid of C. gariepinus vs. H.longifillis.The result of the present studiesindicated that the karyotypes consisted more ofsubmedian chromosomes in C. ebriensis and C.anguillaris and almost equal number of submedianand terminal chromosomes in C. gariepinus and C.albopunctatus in which the centromeres wereclearly defined. Differences in chromosome sizeswere observed, but were very gradual and at nopoint were the variations greater than errorinvolved in the method of measurement. Similarkaryotypes were described for C. gariepinus(Ozouf-Costaz et al., 1990) and H. longifilis(Teugels et al., 1992) strains used for aquaculture.The observed chromosomal divergence betweenthese clariids species was consistent with theirmorphological differences (Eyo, 2003). The almostuniformity of chromosome number andmorphology within the clariids may also suggestsuccess with which many species will hybridize.Crosses between clariids (C. gariepinus vs Hlongi ilis) f using artificial fertilization method havebeen reported (Teugels et al., 1992). In nature,the occurrence of chromosome number aroundmodal values among the clariids may suggest thatchromosomal changes may be associated with theprocess of speciation within the group, possiblythrough high rate of hybridization resulting fromcommunal spawning. Information on thechromosome number among siluriform fishesindicated that diploid chromosome number forcatfishes range from the mid-20’s to well over 100with most species having a diploid set in the mid-40’s to upper 100’s, but no clear modal numberhave been suggested. An increase in diploidchromosome number is associated with aconcomitant change in arm number. In the studyof chromosome number among the siluriformfishes, Fitzsimons et al. (1988) noted that a diploidchromosome number of 56 ± 2 was widespread
Cytogenetic variations in Clarias species 283Figure 9: Karyotype of Clarias gariepinus from Anambra river, Nigeria109Relative chromosome length in percentage876543210012345678911226 73 4 56 78 98 9Short Arm (S) %12 13 141015 1923 24 25 161117 18 20 21 2226 27 2823 24 2512 13 14 19151016 26 27 2820 21 2217 1811Long Arm (L)%10Figure 10: An idiogram of the karyotype of male Clarias gariepinus showing themorphology of the chromosomes. The 0 represents the position of the centromereamong 70 species of catfishes in 10 families andwas especially frequent in four families, theAriidae, Bagridae, Ictaluridae and Pimelodidae.The observed range for the clariids 2n = 48 to 2n= 56 fall below the speculated 2n = 56 ± 2 rangeof Fitzsimons et al. (1988). Thus the range for theclariids may be put at 2n = 52 ± 4. The observedsimilarities in chromosome number although withalmost similar morphometric and meristiccharacters may explain the placement of both C.anguillaris and C. gariepinus in the subgenusClarias (Clarias) by Teugels (1982). The disparityin chromosome number (Eyo, 1997) along withdissimilar morphometric (Eyo, 2002; 2003) andmeristic (Eyo, 2004b) characters of C. ebriensisand C. albopunctatus from C. gariepinus and C.anguillaris may equally explain the placement of C.ebriensis and C. albopunctatus in the subgeneraClarias (Anguilloclarias) and Clarias (Clarioides)respectively.Karyological evidences have beenemployed in solving problems relating tochromosome number, functional arm, phyleticrelationship, the taxonomic status as well aspossibility of speciation among the studied Clariasspecies. For instance the wide dispersal ofchromosome number around modal value (2n =56) among the clariids suggested possibilities ofthe species undergoing speciation.Conclusively, the grouping of Clariaseither as macroclarias or as megaclarias based onsimilarities in size and morphological featureshould be adopted as a stock management tool.The key diagnostic characters (Eyo, 2003) as wellas the relationship between standard length andmorphometric characters (Eyo and Inyang, 2003)may be adopted by clariid taxonomist.
EYO, Joseph Effiong 284Relative chromosome length in percentage10987654321001234567891011Figure 11: Karyotype of Clarias anguillaris from Anambra river, NigeriaShort Arm (S) %2 3 5 610 114121315 16 17 18 1924 25 267 8 91420 21 22 2327 2824 25 265 610 11 12 13 15 16 17 18 192 3 427 2820 21 22 23147 8 9Long Arm (L)%Figure 12: An idiogram of the karyotype of male Clarias anguillaris showing themorphology of the chromosomes. The 0 represents the position of the centromereThe cytotaxonomy of the clariids places them intotwo chromosomal number types; 2n = 56represented by C. anguillaris and C. gariepinus,and 2n < 56 as in C . ebriensis and C.albopunctatus justifies the managerial designationof the clariids into megaclarias and macroclarias.ACKNOWLEDGEMENTThe author acknowledges Drs. N. M. Inyang andB. O. Mgbenka for supervising the PhD thesis fromwhich this paper was extracted. Furthermore,greatly acknowledged are, the Nigerian Academyof Science for their Postgraduate fellowship awardin 1993; and Prof. G. G. Teugels (late), Drs. D. H.J. Sydenham and H. M. G. Ezenwaji for identifyingthe species and provision of relevant researchdocuments. Finally, I am thankful to Nkiruka Ezefor typesetting the manuscript.REFERENCESBLAXHALL, P. C. (1981). A comparison of methodsused for the separation of fishlymphocytes. Journal of Fish Biology, 18:177 – 181.EYO, J. E. (1997). Morphometric and cytogeneticvariations among Clarias species(Clariidae) in Anambra rive r, Nigeria. PhDThesis, Department of <strong>Zoo</strong>logy, Universityof Nigeria, Nsukka. 267 pp.EYO, J. E. (2002). Conspecific discrimination inratio morphometric characters amongmembers of the Pisces Genus: Clarias
Cytogenetic variations in Clarias species 285Scopoli, 1777. The <strong>Zoo</strong>logist, 1(2): 23 –34.EYO, J. E. (2003). Congeneric discrimination ofmorphometric characters among membersof the Pisces Genus Clarias (Clariidae) inAnambra River, Nigeria. The <strong>Zoo</strong>logist ,2(1 ): 86 – 103.EYO, J.E. (2004a). The Effects of SubstitutingSoyabean Meal for Breadfruit Meal onDiets Acceptability, Growth Response andCost of Diets Fed to Heterobranchusbidorsalis (%) X Clarias gariepinus (&)Hybrid. Bio-Research, 2(2): 27 – 33.EYO, J. E. (2004b). Differences in meristic countsof the genus Clarias (Pisces: Clariidae) inAnambra river, Nigeria. Animal ResearchInternational, 1(1): 31 – 35.EYO, J. E. and EZECHIE, C. U. (2004). The Effectsof Rubber (Havea brasiliensis) Seed MealBased Diets on Diet Acceptability andGrowth Performance of Heterobranchusbidorsalis (%) X Clarias gariepinus (&)Hybrid. Journa l of Sustainable TropicalAgriculture Research, 10:EYO, J. E. and INYANG, N. M. (2003). RegressionModel and Clarias species (Clariidae –Scopoli 1777) Taxonomy. Journal ofScience and Technology Research, 2(3):40 – 49.EZENWAJI, H. M. G. (1989). Aspects of the Biologyof some “small” Clarias species inAnambra River Basin, Nigeria. PhDThesis, University of Nigeria, Nsukka. 244pp.FELDBERG, E. and BERTOLLO, L. A. C. (1985).Karyotypes of 10 species of Neotropicalcichlids (Pisces: Perciformes). Caryologia,38 (3 - 4 ): 257 - 268.FELBERG, E., BERTOLLO, L. A. C., TOLEDO, L. F.A., FORESTI, F., FICHO, O. M. andSANTOS, A. F. (1987). Biological aspectsof Amazonian fish IX. Cytogenetic studiesin two species of the genusSemaprochilodous (Pisces, Prochilodontidae).Genome, 29: 1 – 4.FITZSIMONS, J. M., LEGRANDE, W. H. and KERTH,J. W. (1988). Karyology of the marinecatfish Bagre marinus (Ariidae) with ananalysis of chromosome numbers amongSiluriforms fishes. Japanese Journal o fIchthyology, 35(2 ): 189 – 193.FUNAKI, K., MATSAI, S. and SASAKI, M. (1975).Location of nucleolar <strong>org</strong>anizers in animaland plant chromosomes by means of animproved N-banding technique.Chromosoma, 22(4): 223 – 236.GOSLINE, W. A. (1975). The palatine-maxillarymechanisms in catfishes, with commentson the evolution and zoogeography ofmodern Siluriods. Occasional Papers,California Academy of Science, 120: 1 –31.HAAF, T. and SCHMID, M. (1984). An early stageof ZW/ZZ sex chromosomes differentiationin Poecilia sphenops var melanistica(Poeciliidae, Cyprinodontiformes).Chromosoma, 89: 37 – 41.HARTHEY, S. E. (1987). The chromosomes ofsalmonid fishes. Biological Reviews, 62:197 – 214.HOWEL, W. M. and BLACK, D. A. (1979). Locationof the nucleolus <strong>org</strong>anizer regions on thesex chromosomes of the banded killifish,Fundulus diaphanus. Copeia, 1979: 544 –546.KALLMAN, K. D. (1973). The sex-determiningmechanism of the platyfish Xyphophorusmaculatus. Pages 19 – 28. In:SCHRODER, J. H. (Ed). Genetics andmutagenesis of fish. Springer-Verlag,Berlin.KLIGERMAN, A. D. and BLOOM, S. E. (1977).Rapid chromosome preparations fromsolid tissues of fishes. Journal of FisheryResearch Board of Canada, 34: 266 – 269.KORNFIELD, I, L., RICHLER, U. R. and WAHRMAN,J. (1979). Biochemical and cytogeneticaldifferentiation among cichlid fishes of thesea of Galilee. Evolution, 33: 1 – 14.LAGLER, F. K., BARDACH, I. E., MILLER, R. R. andMAY PASSINO, D. R. (1977). Ichthyology.Second Edition, John Wiley and Sons, NewYork. 506 pp.LEGRANDE, W. H. (1981). Chromosomal evolutionin North American catfishes (Siluriformes:Ictaluridae) with particular emphasis onthe madtones, Nototus. Copeia, 1: 33 –52.LEVAN, A., FREGDA, K. and SANDBURG, A. (1964).Nomenclature for centromeric position onchromosomes. Hereditas, 52: 201 – 220.LOWE-MCCONNELL, R. H. (1972). FreshwaterFishes of the Volta and Kainji lakes.Ghana University Press, Accra.MAYR, E. (1969). Principles of systematic zoology.THM Edition, McGraw-Hill Coy, Ltd.Bombay. 428 pp.MELLMAN, W. J. (1965). Human peripheral bloodleucocyte cultures. Pages 22 – 56. In:YUNIS, J. J. (Ed). Human ChromosomesMethodology. Academic Press, New York.OHNO, S., MURAMOTO, J., KLEIN, and ATKIN, N.B. (1969). Diploid tetraploid relationship inclupeoid and salmonoid fish. Pages 139 –147. In: DARLINGTON, C. D. and LEWIS,K. R. (Eds.). Chromosomes Today,<strong>Volume</strong> 2, Oliver and Boyd, Edinburgh.OJIMA, Y. and YAMANO, T. (1980). Theassignment of the nuclear <strong>org</strong>anizer in thechromosomes of the fauna (Carassius,
EYO, Joseph Effiong 286Cyprinidae, Pisces). Proceedings of theJapanese Academic of Sciences, 56B: 551– 556.OLIVERIA, C., ALMEIDA TOLEDO, L. F., FORESTBRISKI, H. A. and TOLEDO FILHO, S. A.(1988). Chromosome formulae ofNeotropical freshwater fishes. Review o fBrazilian Geneticist, 11(3): 577 – 624.OZOUF-COSTAZ, C., TEUGELS, G. G. andLEGENDRE, M. (1990). Karyologicalanalysis of three stains of the Africancatfish Clarias gariepinus Clariidae used inaquaculture. Aquaculture, 87: 271 – 277.PREHN. L. M. and RASCH, E. M. (1969).Cytogenetic studies of Poecilia (Pisces). 1.Chromosome numbers of naturallyoccurring poeciliid species and theirhybrids from eastern Mexico. CanadianJournal of Genetics and Cytology, 11: 880– 895.RIGAS, D. A. and OSGOOD, E. E. (1954).Purification and properties of thephytohemagglutinin of Phaseolus vulgaris.Journal o f Biological Chemistry, 212: 607– 609.SOLA, L., CATAUDELLA, S. and CAPANNA, E.(1981). New developments in vertebratecytotaxonomy III. Karyology of bonyfishes: A Review. Genetica, 54: 285 – 328.SYDENHAM, D. H. J. (1983). A key to the genusClarias in Nigeria. Memograph of theDepartment of <strong>Zoo</strong>logy, University ofIbadan, Nigeria. 2 pp.TEUGELS, G. G. (1982). A systematic outline of theAfrican species of the genus Clarias(Pisces, Clariidae) with annotatedbiography. Annales du musee Royal de L’Afrique Centrale, Tervuren, Sciences<strong>Zoo</strong>logyques. 230 pp.TEUGELS, G. G., OZOUF-COSTAZ, C., LEGENDRE,M. and PARENT, M. (1992). A karyologicalanalysis of the artificial hybridizationbetween Clarias gariepinus Burchell, 1822and Heterobranchus longifilisValenciennes. 1840 (Pisces: Clariidae).Journal ofFish Biology, 40: 81 – 86.THORGAARD, G. H. (1977). Heteromorphic sexchromosomes in male rainbow trout.Science, 196: 900 – 902.UWA, H. (1986). Karyotype evolution andgeographical distribution in the ricefish,genus Oryzias (Oryziidae). Pages 867 -876. In: UYENO, T., ARAI, R., TANIUCHIT. and MATSUURA, K. (eds.) Indo-PacificFish Biology: Proceedings of the SecondInternational Conference on Indo-PacificFishes. Ichthyological Society of Japan,Tokyo.UWA, H. and IWATA, A. (1981). Karyotype andcellular DNA content of Oryzias javanicus(Oryziidae, Pisces). ChromosomesInformation Service (CIS), 31: 24 – 26.UWA, H. and MAGTOON, W. (1986). Descriptionand karyotype of a new rice fish, Oryziasmekongensis, from Thailand. Copeia,1986(2): 473 – 478.UWA, H. and PARENTI, L. R. (1988). Morphometricand meristic variation in ricefish, genusOryzias: a comparison with cytogeneticdata. Japanese Journal o f Ichthyology ,35(2 ): 159 – 166.UWA, H., TANAKA, K. and FORMACION, M. J.(1982). Karyotype and banding analysesof the Hawaiian medaka Oryziascurvinotus (Pisces). ChromosomeInformation Service (CIS), 33: 15 – 17.UWA, H., WANG, R. and CHEN, Y. (1988).Karyotypes and geographical distributionof ricefishes from Y<strong>unn</strong>an, South WesternChina. Japanese Journal of Ichthyology,35(3 ): 332 – 340.WHITE, M. J. D. (1978). Modes of speciation.Freeman and Company, San Francisco.187 pp.WOLF, U., RITTER, H., AKIN, N. and OHNO, S.(1969). Polyploidization in the fish familyCyprinidae, order Cypriniformes. I. DNAcontent and chromosome set in variousspecies of Cyprinidae. Humangenetik, 7:240 – 244.YU, X., ZHOU, T., LI. K. and ZHOU, M. (1987). Onthe karyosystematics of cyprinid fishesand a summary of fish chromosomalstudies in China. Genetica, 72: 225 – 236.
ANIMAL RESEARCH INTERNATIONALVOLUME 2, NUMBER 1, MARCH 2005CONTENTS1 INFLUENCE OF DIETARY PROTEIN CONTENT ON GROSS EFFICIENCY OF FOODCONVERSION AND NET PROTEIN UTILIZATION OF AFRICAN CATFISH (Clariasgariepinus BURCHELL, 1822) FRY - MGBENKA, Bernard Obialo, ASOGWA, MaureenObioma and UGWU, Lawrence Linus Chukwuma2 THE EFFECTS OF SEASON AND DISTANCE ON THE PREVALENCE AND INTENSITYRATES OF URINARY SCHISTOSOMIASIS IN AGULU-LAKE AREA OF ANAMBRASTATE, NIGERIA - EKWUNIFE, Chinyelu Angela3 THE EFFECT OF TRANSPORTATION STRESS ON HAEMATOCRIT LEVEL OFOreochromis niloticus LINNAEUS - ORJI, Raphael Christopher Agamadodaigwe4 EFFECTS OF PALM OIL ON SOME OXIDATIVE INDICES OF ALLOXAN INDUCEDDIABETIC RABBITS - OGUGUA Victor Nwadiogbu and IKEJIAKU ChukwuemekaAfam5 EFFECT OF EXPOSURE TO SUBLETHAL CONCENTRATIONS OF GAMMALIN 20 ANDACTELLIC 25 EC ON THE LIVER AND SERUM LACTATE DEHYDROGENASE ACTIVITYIN THE FISH Clarias albopunctatus - OLUAH, Ndubuisi Stanley, EZIGBO, JosephChukwura and ANYA, Nnenna Catherine6 EFFECT OF EFFLUENT FROM A VEGETABLE OIL FACTORY IN SOUTHEASTERNNIGERIA ON THE MMIRIELE STREAM - ATAMA, Chinedu and MGBENKA, BernardObialo7 Baobab (Adansonia digitata L.) seed protein utilization in young albino rats I:Biochemical ingredients and performance characteristics - EZEAGU, IkechukwuEdwin8 EFFECT of Dermestes maculatus INFESTATION ON SOME NUTRITIONALCOMPOSITION OF SMOKED AFRICAN CATFISH, Clarias gariepinus BURCHELL, 1822- UGWU, Lawrence Linus Chukwuma, NWAMBA, Helen Ogochukwu and KANNO,Linda Uchenna9 THE EFFECT OF SALINITY STRESS ON BUCCAL VENTILATORY RATE IN THEAFRICAN LUNGFISH, Protopterus annectens OWEN - OKAFOR, Anthony Ikechukwuand CHUKWU, Lucian Obinnaya10 PARASITIC DISEASES AND SEXUAL DISABILITY: A CRITICAL REVIEW OF SOMEPARASITIC DISEASES WITH SERIOUS SEXUAL REPERCUSSIONS - OKAFOR, FabianChukwuemenam and OMUDU, Edward Agbo11 SUPEROXIDE DISMUTASE (SOD) ACTIVITY AND SERUM CALCIUM LEVEL IN RATSEXPOSED TO A LOCALLY PRODUCED INSECTICIDE “RAMBO INSECT POWDER” -OTITOJU Olawale and ONWURAH Ikechukwu Noel Emmanuel12 ANIMAL WASTE MANAGEMENT STRATEGIES, A REVIEW - UCHEWA, EmmanuelNwafoagu, OTUMA, Michael Oria and BROOKS, Peter13 CYTOGENETIC V<strong>ARI</strong>ATIONS IN Clarias species (CL<strong>ARI</strong>IDAE: SURULIFROMIS) OFTHE ANAMBRA RIVER USING LEUCOCYTES CULTURE TECHNIQUES - EYO, JosephEffiongPAGES212 – 218219 – 223224 – 226227 – 230231 – 234235 – 239240 – 245246 – 251252 – 254255 – 260261 – 266267 – 274275 – 286