1: Graphing Trends - Delsea
1: Graphing Trends - Delsea
1: Graphing Trends - Delsea

You also want an ePaper? Increase the reach of your titles
YUMPU automatically turns print PDFs into web optimized ePapers that Google loves.
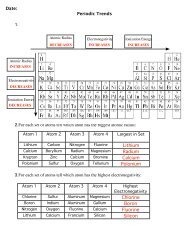
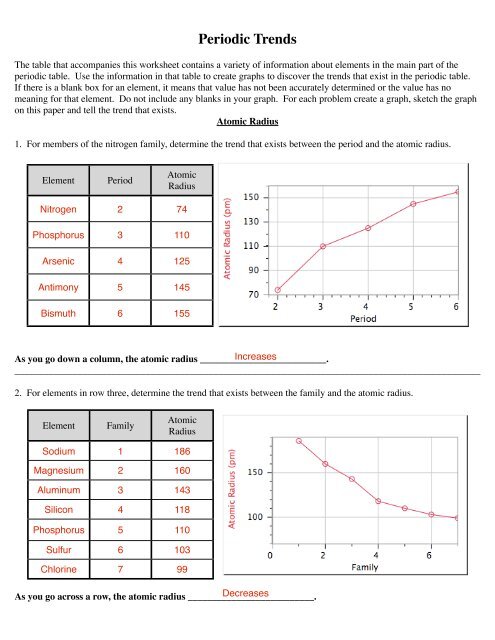
Periodic <strong>Trends</strong>The table that accompanies this worksheet contains a variety of information about elements in the main part of theperiodic table. Use the information in that table to create graphs to discover the trends that exist in the periodic table.If there is a blank box for an element, it means that value has not been accurately determined or the value has nomeaning for that element. Do not include any blanks in your graph. For each problem create a graph, sketch the graphon this paper and tell the trend that exists.Atomic Radius1. For members of the nitrogen family, determine the trend that exists between the period and the atomic radius.ElementPeriodAtomicRadiusNitrogen 2 74Phosphorus 3 110Arsenic 4 125Antimony 5 145Bismuth 6 155As you go down a column, the atomic radius __________________________.Increases________________________________________________________________________________________________2. For elements in row three, determine the trend that exists between the family and the atomic radius.ElementFamilyAtomicRadiusSodium 1 186Magnesium 2 160Aluminum 3 143Silicon 4 118Phosphorus 5 110Sulfur 6 103Chlorine 7 99As you go across a row, the atomic radius __________________________.Decreases
Electronegativity1. For members of the oxygen family, determine the relationship between the electronegativity and the period in whichthe element is found.Element Period ElectronegativityOxygen 2 3.5Sulfur 3 2.6Selenium 4 2.5Tellurium 5 2.3Polonium 6 1.8 As you go down a column, the electronegativity _______________________.Decreases________________________________________________________________________________________________2. For members of the third row, discover the relationship between the electronegativity and the family number of theelement.Element Family ElectronegativitySodium 1 0.9Magnesium 2 1.2Aluminum 3 1.5Silicon 4 1.9Phosphorus 5 2.2Sulfur 6 2.6Chlorine 7 3.2 As you go across a row, the electronegativity ________________________.Increases
Ionization Energy1. For the noble gases, determine the relationship between the ionization energy and the period of the element.ElementPeriodIonizationEnergyHelium 1 24.59Neon 2 21.57Argon 3 15.76Krypton 4 14Xenon 5 12.13Radon 6 10.75 As you go down a column, the ionization energy _______________________.Decreases________________________________________________________________________________________________2. For members of row two, discover the relationship between the ionization energy and the family number of theelement.ElementFamilyIonizationEnergyLithium 1 5.39Berylium 2 9.32Boron 3 8.3Carbon 4 11.26Nitrogen 5 14.53Oxygen 6 13.62Fluorine 7 17.42Neon 8 21.57 As you go across a row, the ionization energy ________________________.Increases
Atomic Radius vs. Ionic RadiusFor elements in row three, determine the trend that exists between atomic radius and ionic radius. Draw a line for theatomic radius vs the family number. Then draw a second line for the ionic radius vs the family number. Discuss thetrend between the two lines.ElementFamilyAtomicRadiusIonic RadiusSodium 1 186 95Magnesium 2 160 65Aluminum 3 143 50Silicon 4 118 41Phosphorus 5 110 212Sulfur 6 103 184Chlorine 7 99 181Discuss the trend that you observe:For metals (Families 1-4) the atomic radius is largerthan the ionic radius. For nonmetals (Families 5-7)the atomic radius is smaller that the ionic radius.