DX7 Tutorial - General One-Factor - Part 1 - Quality Coach
DX7 Tutorial - General One-Factor - Part 1 - Quality Coach
DX7 Tutorial - General One-Factor - Part 1 - Quality Coach
- No tags were found...

You also want an ePaper? Increase the reach of your titles
YUMPU automatically turns print PDFs into web optimized ePapers that Google loves.
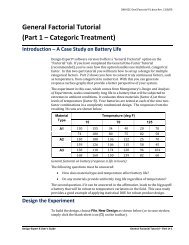
DX8-02A-Gen1<strong>Factor</strong>-P1.docx Rev. 12/8/09<strong>General</strong> <strong>One</strong>-<strong>Factor</strong> <strong>Tutorial</strong>(<strong>Part</strong> 1 – The Basics)IntroductionIn this tutorial you will build a general one-factor design using Design-Expert ®software. This type of design is very useful for simple comparisons of categoricaltreatments, such as:Who will be the best supplier,Which type of raw material should be selected,What happens when you change procedures for processing paperwork.If you wish to experiment on a continuous factor, such as time, which can beadjusted to any numerical level, consider using response surface methods (RSM)instead. This is covered in a separate tutorial.The data for this example come from the Stat-Ease bowling league. Three bowlers(Pat, Mark, and Shari) are competing for the last team position. They each bowl sixgames in random order – ideal for proper experimentation protocol. Results are:Game Pat Mark Shari1 160 165 1662 150 180 1583 140 170 1454 167 185 1615 157 195 1516 148 175 156Mean 153.7 178.3 156.2Bowling scoresBeing a good experimenter, the team captain knows better than to simply pick thebowler with the highest mean score. The captain needs to know if the averagescores are significantly different, given the variability in individual games. Maybeit’s a fluke that Mark’s score is highest.This one-factor case study provides a good introduction to the power of simplecomparative design of experiments (DOE). It exercises many handy features foundin Design-Expert software. We won’t explain all features displayed in this currentexercise because most will be covered in later tutorials. Many other features andoutputs are detailed only in the help system, which you can access by clicking Helpin the main menu, or in most places via a right click, or by pressing the F1 key(context sensitive).Design-Expert 8 User’s Guide <strong>General</strong> <strong>One</strong>-<strong>Factor</strong> <strong>Tutorial</strong> – <strong>Part</strong> 1 1
Design the ExperimentWe will assume that you are familiar with your computer’s graphical user interfaceand your mouse. Start the program by double clicking the Design-Expert icon. Youwill then see the main menu and icon bar.Click on File in the main menu. Unavailable items are dimmed. (If you prefer usingyour keyboard, press the Alt key and underlined letter simultaneously, in this caseAlt F.)File menuSelect the New Design item with your mouse. (The blank-sheet icon on the leftof the toolbar is a quicker path to this screen. To try this, press Cancel to reactivatethe tool bar.) Using either path, you now see four yellow tabs on the left ofyour screen. The <strong>Factor</strong>ial tab comes up by default. Select <strong>General</strong> <strong>Factor</strong>ial forthis design because the factor is categorical. (If your factor is numerical, such astemperature, then you would use the <strong>One</strong> <strong>Factor</strong> option under the ResponseSurface tab.) Note the helpful description: “Design for 1 to 12 factors where eachfactor may have a different number of levels.”<strong>General</strong> <strong>Factor</strong>ial design2 <strong>General</strong> <strong>One</strong>-<strong>Factor</strong> <strong>Tutorial</strong> – <strong>Part</strong> 1 Design-Expert 8 User’s Guide
DX8-02A-Gen1<strong>Factor</strong>-P1.docx Rev. 12/8/09Enter the Design ParametersLeave the number of factors at its default level of 1 but click the entry formatVertical (easier than Horizontal for multiple levels). Enter Bowler as the name ofthe factor. Tab down to the Units field and enter Person. Next tab to Type. Fordetails on the options for factor type, click the light bulb icon ( ) in the toolbar toaccess our context-sensitive screen tips.Screen tips on factor TypeLeaving Type at its default of Nominal, tab down to the Levels field and enter 3.Now tab to L(1) (level one) and enter Pat. Type Mark, and Shari for the other twolevels (L2 and L3).<strong>General</strong> <strong>Factor</strong>ial design-builder dialog box – completedPress Continue to specify the remaining design options. In the Replicates field,which becomes active by default, type 6 (each bowler rolls six games). Tab to the“Assign one block per replicate” field but leave it unchecked. Design-Expert nowrecalculates the number of runs for this experiment: 18.Design options enteredPress Continue. Let’s do the easy things first. Leave the number of Responses atthe default of 1. Now click on the Name box and enter Score. Tab to the Unitsfield and enter Pins.Design-Expert 8 User’s Guide <strong>General</strong> <strong>One</strong>-<strong>Factor</strong> <strong>Tutorial</strong> – <strong>Part</strong> 1 3
Response name dialog box – completedAt this stage you can skip the remainder of the fields and continue on. However, itis good to gain an assessment of the power of your planned experiment. In thiscase, as shown in the fields below, enter the value 10 because the bowling captaindoes not care if averages differ by fewer than 10 pins. Then enter the value 5 forstandard deviation (derived from league records as the variability of a typicalbowler). Design-Expert then compute a signal-to-noise ratio of 2 (10 divided by 5).Optional power calculator – necessary inputs enteredPress Continue to view the happy outcome – power that exceeds 80 percentprobability of seeing the desired difference.Results of power calculationClick on Continue for Design-Expert to create the design and take you to thedesign layout window.Before moving on, take a look at the unique branching interface provided byDesign-Expert for the design and analysis of experiments and resultingoptimization.4 <strong>General</strong> <strong>One</strong>-<strong>Factor</strong> <strong>Tutorial</strong> – <strong>Part</strong> 1 Design-Expert 8 User’s Guide
DX8-02A-Gen1<strong>Factor</strong>-P1.docx Rev. 12/8/09Save the DesignDesign-Expert software’s easy-to-use branching interfaceYou will explore some branches in this series of tutorials and others if you progressto more advanced features, such as response surface methods for processoptimization.When you complete the design setup, save it to a file by selecting File, Save As.Type in the name of your choice (for this tutorial, we suggest Bowling) for yourdata file, which is saved as a *.dxp type.Save As dialog boxClick on Save. Now you’re protected in case of a system crash.Design-Expert 8 User’s Guide <strong>General</strong> <strong>One</strong>-<strong>Factor</strong> <strong>Tutorial</strong> – <strong>Part</strong> 1 5
Create a Data Entry FormIn the floating Design Tool click Run Sheet (or go to the View menu and selectRun Sheet) to produce a recipe sheet for your experiment with your runs inrandomized order. A printout provides space to write down the responses. (Note:this view of the data does not allow response entry. To type results into theprogram you must switch back to the home base – the Design Layout view.)Run Sheet view (your run order may differ)It’s not necessary for this tutorial, but if you have a printer connected, you canselect File, Print, and OK (or click the printer icon) to make a hard copy. (You cando the same from the basic design layout if you like that format better.)Enter the Response DataWhen performing your own experiments, you will need to go out and collect thedata. Simulate this by clicking File, Exit. Click on Yes if you are prompted to Save.Now re-start Design-Expert and use File, Open Design or click the open file iconon the toolbar)) to open your data file (Bowling.dxp). You should now seeyour data tabulated in the randomized layout. For this example, you must enteryour data in the proper order to match the correct bowlers. To do this, right-clickthe Std column header and choose Sort by Standard Order.Sort runs by standard (std) orderNow enter the responses from the table on page one, or use the following screen.Except for run order, your design layout window must look like that shown below.6 <strong>General</strong> <strong>One</strong>-<strong>Factor</strong> <strong>Tutorial</strong> – <strong>Part</strong> 1 Design-Expert 8 User’s Guide
DX8-02A-Gen1<strong>Factor</strong>-P1.docx Rev. 12/8/09Design Layout in standard order with response data enteredWhen you conduct your own experiment, be sure to do the runs and enter theresponse(s) in randomized order. Standard order should only be used as aconvenience for entering pre-existing design data.If you are a real stickler for precision, replace (type over) your run numbers withthe ones shown above, thus preserving the actual bowlers’ game sequence. Bowlingsix games is taxing but manageable for any serious bowler. However, short andrandom breaks while bowling six games protects against time-related effects suchas learning curve (getting better as you go) and/or fatigue (tiring over time).Save your data by selecting File, Save from the menu (or via the save icon on thetoolbar). Now you’re backed up in case you mess up your data. This backup isgood because now we’ll demonstrate many beneficial procedures Design-Expertfeatures in its design layout. Start by pressing the screen tips button (or selectTips, Screen Tips). These tips, found throughout Design-Expert, clarify the screencurrently displayed. Be sure to play the video clips that are offered for most of thedetailed features – these movies make it far clearer than static, written tutorials canabout how to use our advanced tools.Design-Expert 8 User’s Guide <strong>General</strong> <strong>One</strong>-<strong>Factor</strong> <strong>Tutorial</strong> – <strong>Part</strong> 1 7
Tips on features for Design Layout screenTry some features highlighted in the Design Layout tips. For example, right-clickthe Select button. This allows you to control what Design-Expert displays.Select button for choosing what you wish to display in the design layoutIn the comments column above we added a notation that after run 8, the bowlingalley proprietor re-oiled the lane – for what that was worth. Seeing Pat’s scores, theeffect evidently was negligible). Try this if you like. If comments exceed allottedspace, double click the right border for automatic column re-sizing. That’s handy!Press the red X (close button) of any help screen to close it. Now, to better graspthe bowling results, order them from low-to-high as shown below by right-clickingthe Response column header and selecting Sort by This Response.8 <strong>General</strong> <strong>One</strong>-<strong>Factor</strong> <strong>Tutorial</strong> – <strong>Part</strong> 1 Design-Expert 8 User’s Guide
DX8-02A-Gen1<strong>Factor</strong>-P1.docx Rev. 12/8/09Analyze the ResultsSorting a response column (also works in the factor column)You’ll find sorting a very useful feature. It works on factors as well as responses. Inthis example, you quickly see that Mark bowled almost all the highest games.Now we’ll begin data analysis. Under the Analysis branch of the program (on theleft side of your screen), click the Score node. Transform options appear in themain window of Design-Expert on a progressive tool bar. You’ll click these buttonsfrom left to right and perform the complete analysis. It’s a very easy process. TheTransform option gives you the opportunity to select a transformation for theresponse. This may improve the analysis’ statistical properties.Transformation button – the starting point for the statistical analysisIf you need some background on transformations, first try Tips. For completedetails, go to the Help command on the main menu. Click the Search tab and enterDesign-Expert 8 User’s Guide <strong>General</strong> <strong>One</strong>-<strong>Factor</strong> <strong>Tutorial</strong> – <strong>Part</strong> 1 9
Examine the Analysis“transformations.” As shown at the bottom of the Transformscreen above, theprogram provides data-sensitive advice, so press ahead with the default of None byclicking the Effects button.By necessity, the tutorial now turns a bit statistical. If this becomes intimidating,we recommend you attend a basic class on regression, or better yet, a DOEworkshop such as Stat-Ease’s computer-intensive Experiment Design Made Easy.Design-Expert may default to the mean (average) response as its model forprediction. If so, you will see “A-Bowler” established as an error (“e”) term asshown below. But if it’s already set up to be modeled (indicated by it beingidentified as “M”), then skip the next few instructions.Effect button result – default mean modelRight-click the Bowler term and place this in your prediction model by clickingModel.Effects button resultsFocus on the F-value column and associated probability (“Prob>F”). In this case,there’s a very small probability, near 0.06% (p = 0.0006), that the differences inbowling averages (the term “A-Bowler” that you designated “M” for model) are dueto chance variation (the term “Pure Error” labeled “e” for error, generated by thewithin-bowler multiple games). In other words, it appears at this stage that thedifference between bowlers is significant.To get more statistical details, press the ANOVA (Analysis of Variance) button.Notice to the far right side of your screen that Design-Expert verifies that theresults are significant.10 <strong>General</strong> <strong>One</strong>-<strong>Factor</strong> <strong>Tutorial</strong> – <strong>Part</strong> 1 Design-Expert 8 User’s Guide
DX8-02A-Gen1<strong>Factor</strong>-P1.docx Rev. 12/8/09ANOVA results (annotated), with context-sensitive Help enabled via right-click menuNow select View, Annotated ANOVA from the menu atop the screen and uncheck() this option. Note that the blue textual hints and explanations disappear so youcan make a clean printout for statistically savvy clients. Re-select View, AnnotatedANOVA to ‘toggle’ back all the helpful hints. Before moving on, try the first hintshown in blue: “Use your mouse to right click on individual cells for definitions.”For example, perform this tip on the p-value of 0.0006 as shown above (select Helpat the bottom of the pop-up menu). There’s a wealth of information to be broughtup from within the program with a few simple keystrokes: Take advantage!Now click the ‘floating’ (moveable) R-squared Bookmark button (or press thescroll-down arrow at the bottom right screen) to see various summary statistics.Summary statisticsThese summary annotations reveal what you need to know, but don’t be shy aboutclicking on a value and getting online Help via a right-click (or try the F1 key). Inmost cases you will access helpful advice about the particular statistic.Now click the Coefficients Bookmark button to view the output illustrated below.Design-Expert 8 User’s Guide <strong>General</strong> <strong>One</strong>-<strong>Factor</strong> <strong>Tutorial</strong> – <strong>Part</strong> 1 11
Coefficient estimatesHere you see statistical details such as coefficient estimates for each model termsand their confidence intervals (“CI”). The intercept in this simple one-factorcomparative experiment is simply the overall mean score of the three bowlers. Youmay wonder why only two terms, A1 and A2, are provided for a predictive modelon three bowlers. It turns out that the last model term, A3, is superfluous becauseit can be inferred once you know the mean plus the averages of the other twobowlers.Now let’s move on to the next section within this screen: “Treatment Means.”Treatment meansHere are the averages for each of the three bowlers. As you can see below, theseare compared via pair-wise t-tests in the following part of the ANOVA report.Treatment meansYou can conclude from the treatment comparisons that: Pat differs significantly (24.68 pins worse!) when compared with Mark (1vs 2)The 2.5 pins mean difference between Pat and Shari (1 vs 3) is notsignificant (nor is it considered important by the bowling team’s captain –12 <strong>General</strong> <strong>One</strong>-<strong>Factor</strong> <strong>Tutorial</strong> – <strong>Part</strong> 1 Design-Expert 8 User’s Guide
DX8-02A-Gen1<strong>Factor</strong>-P1.docx Rev. 12/8/09Analyze Residualsrecall in the design specification for power that a 10-pin difference was theminimum of interest) Mark differs significantly (22.17 pins better!) when compared with Shari (2vs 3).Before moving ahead, press Top on the floating Bookmark. This is a very handyway of moving through long reports, so it’s worth getting in the habit of using it.Click the Diagnostics button to bring up the normal plot of residuals. Ideally thiswill be a straight line, indicating no outlying abnormalities. If you have a pencilhandy (or anything straight), hold it up to the graph. Does it loosely cover up all thepoints? The answer is “Yes” in this example – it passes the “pencil test” fornormality. You can reposition the thin red line by dragging it (place the mousepointer on the line, hold down the left button, and move the mouse) or its “pivotpoint” (the round circle in the middle). However, we don’t recommend you botherdoing this – the program generally places the line in the ideal locationautomatically. If you need to re-set the line, simply double-click your left mousebutton over the graph.Notice that the points are coded by color to the level of response they represent –going from cool blue for lowest values to hot red for the highest. In this example,the red point is Mark’s outstanding 195 game. Pat and Shari think Mark’s 195 gameshould be thrown out because it’s too high. Is this fair? Click this point so it will behighlighted on this and all the other residual graphs available via the DiagnosticsTool (the ‘floating’ palette on your screen).Normal probability plot of studentized residuals (195 game highlighted)Design-Expert 8 User’s Guide <strong>General</strong> <strong>One</strong>-<strong>Factor</strong> <strong>Tutorial</strong> – <strong>Part</strong> 1 13
Notice on the Diagnostics Tool that “Studentized” is checked on by default. Thisconverts raw residuals, reported in original units (‘pins’of bowling in this example), to dimensionless numbersbased on standard deviations, which come out in plus orminus scale. More details on studentization reside inHelp. Raw residuals can be displayed by un-checking thisdefault studentized mode on the Diagnostics Tool. Checkit out! However, when runs have greater leverage(another statistical term to look up in Help), only theStudentized form of residuals produces valid diagnostic graphs. In this example, ifPat and Shari succeed in getting Mark’s high game thrown out (don’t worry – theywon’t!), then each of Mark’s remaining five games will exhibit a leverage of 0.2(1/5) versus 0.167 (1/6) for each of the others’ six games. Due to potentialimbalances of this sort, we advise that you always leave the Studentized featurechecked (as done by default).On the Diagnostics Tool, select e i vs. Pred. to generate a plot of residuals foreach individual game (the label “e i” referring to the error in fitting each individualresult) versus what is predicted by the response model. [Sidebar: Supposedly,“residuals” were originally termed “error” by statisticians, but the managementpeople got upset at so many mistakes being made!] Let’s make it easier to see whichresidual goes with which bowler by pressing the down-list arrow for the Color byoption in the Diagnostics Tool and selecting A:Bowler.Residuals versus predicted values, colored by bowlerThe size of the studentized residual should be independent of its predicted value.In other words, the vertical spread of the studentized residuals should beapproximately the same for each bowler. In this case the plot looks OK. Don’t bealarmed that Mark’s games stand out as a whole. The spread from bottom-to-top isnot out of line with his competitors, despite their protestations about the highestscore (still highlighted).14 <strong>General</strong> <strong>One</strong>-<strong>Factor</strong> <strong>Tutorial</strong> – <strong>Part</strong> 1 Design-Expert 8 User’s Guide
DX8-02A-Gen1<strong>Factor</strong>-P1.docx Rev. 12/8/09Bring up the next graph on the Diagnostics Tool list – e i vs Run (residuals versusrun number). (Note: your graph may differ due to randomization.)Residuals versus run chart (Note: your graph may differ due to randomization)Here you might see trends due to changing alley conditions (the lane re-oiling, forexample), bowler fatigue, or other time-related lurking variables. (The pattern onyour graph may differ from what we show here due to the randomized run order,but that will not be relevant to this discussion.) In this example things lookrelatively normal. However, even if you see a pronounced upward, downward, orshift change, it will probably not bias the outcome because the runs are completelyrandomized. To ensure against your experiment being sabotaged by uncontrolledvariables, always randomize!At the top of the Diagnostics Tool, click the Influence button. The default is Ext.Student e i (externally studentized residuals), which show if any points stand out.Externally studentized residuals graph (your graph may differ due to random runs)Design-Expert 8 User’s Guide <strong>General</strong> <strong>One</strong>-<strong>Factor</strong> <strong>Tutorial</strong> – <strong>Part</strong> 1 15
On this graph, also known as “outlier t,” we are looking for points outside the plusand minus control limits. Again, for details on the meaning of externalstudentization, refer to Help, but briefly, this graph differs from the run chart in theprevious figure by excluding each run, such as the one in question by Mark, prior tocalculating the residual on a scale of standard deviation. In this case, all points fallwithin the limits (calculated at the 95 percent confidence level). In other words,Mark’s high game does not exhibit anything more than common-cause variability,so it should not be disqualified.Before moving on, at the bottom of the Diagnostics Tool, try this surprising feature:Pop-Out View. Then on the new Diagnostics Tool, go back to the Diagnosticsbutton, click it, and re-select e i vs Run (residuals versus run number). Now youcan see the two views, internal versus external, side by side.View the Means and Data PlotPop-out view of residual versus run numberClose the pop-out view by clicking the X in the upper right corner of the graph.Because there’s no indication of abnormality, it’s OK to move on to the modelgraph. This will reveal the outcome of a change in the bowling team membership.It will make a good final report to the Stat-Ease team on who they should invite as anew member. Unfortunately only one person can be chosen. Select the Model Graphs button from the progressive tool bar to display a plotcontaining all the response data and the average value at each level of thetreatment (factor). This plot gives an excellent overview of the data and the effectof the factor levels on the mean and spread of the response. Note how convenientlyDesign-Expert scaled the Y axis from 140 to 200 pins in increments of 10.16 <strong>General</strong> <strong>One</strong>-<strong>Factor</strong> <strong>Tutorial</strong> – <strong>Part</strong> 1 Design-Expert 8 User’s Guide
DX8-02A-Gen1<strong>Factor</strong>-P1.docx Rev. 12/8/09<strong>One</strong>-factor effects graph with Mark’s predicted score (mean) highlightedThe squares in this effects plot represent predicted responses for each factor level(bowler). Click the square representing Mark’s top score. Notice that Design-Expert displays the prediction for this treatment level (reverting to DOE jargon) onthe legend at the left of the graph. Vertical ‘I-beam-shaped’ bars represent the 95%least significant difference (LSD) intervals for each treatment. Mark’s LSD barsdon’t overlap horizontally with Pat’s or Shari’s, so with at least 95% confidence,Mark’s mean is significantly higher than the means of the other two bowlers.Oh, by the way, maybe you noticed that the numerical value for the height of theLSD bar appeared when you clicked Mark’s square. You can also click on any roundpoint to see the actual scores. Check it out!Pat and Shari’s LSD bars overlap horizontally, so we can’t say which of them bowlsbetter. It seems they must spend a year in a minor bowling league and see if ayear’s worth of games reveals a significant difference in ability. Meanwhile, Markwill be trying to live up to the high average he exhibited in the tryouts and thusjustify being chosen for the Stat-Ease bowling team.That’s it for now. Save your results by going to File, Save. You can now ExitDesign-Expert if you like, or keep it open and go on to the next tutorial – part twofor general one-factor design and analysis. It delves into advanced features viafurther adventures in bowling.Design-Expert 8 User’s Guide <strong>General</strong> <strong>One</strong>-<strong>Factor</strong> <strong>Tutorial</strong> – <strong>Part</strong> 1 17