Structure Plan 1996 - 2011 - Worcestershire County Council
Structure Plan 1996 - 2011 - Worcestershire County Council
Structure Plan 1996 - 2011 - Worcestershire County Council
- No tags were found...

Create successful ePaper yourself
Turn your PDF publications into a flip-book with our unique Google optimized e-Paper software.
<strong>Worcestershire</strong> <strong>County</strong><strong>Structure</strong> <strong>Plan</strong><strong>1996</strong> - <strong>2011</strong>Baseline MonitoringStatementat April 2001worcestershirecountycouncilOctober 2003
WORCESTERSHIRE COUNTY STRUCTURE PLAN<strong>1996</strong>-<strong>2011</strong>BASELINE MONITORING STATEMENTAT APRIL 20011 Introduction1.1 The <strong>Worcestershire</strong> <strong>County</strong> <strong>Structure</strong> <strong>Plan</strong> is a long term planning documentproduced by the <strong>County</strong> <strong>Council</strong> which sets out the strategic policy frameworkfor planning and development control locally; ensures that the provision fordevelopment is realistic and consistent with national and regional policy; andsecures consistency between local plans. The <strong>Plan</strong> was adopted in June 2001and covers the period <strong>1996</strong>-<strong>2011</strong>. The <strong>County</strong> <strong>Council</strong> has a statutoryresponsibility to produce, monitor and keep under review the <strong>Structure</strong> <strong>Plan</strong>.1.2 Monitoring of the <strong>Plan</strong> is necessary in order to assess the effectiveness of thepolicies in achieving the objectives of the <strong>Plan</strong> and to keep under review matterswhich may be expected to affect the development of the <strong>County</strong>. Particularemphasis is placed on monitoring in the context of the new direction for thedelivery of housing through the planning system set out in <strong>Plan</strong>ning PolicyGuidance Note 3: Housing (March 2002). This is based on the ‘plan, monitor,manage’ approach to the provision of housing. More recent governmentguidance on the preparation of development plans, including the function ofmonitoring in the plan-making process, is contained in ‘Making <strong>Plan</strong>s: GoodPractice in <strong>Plan</strong> Preparation and Management of the Development <strong>Plan</strong>Process’ (2002). This guidance refers to the positive approach to the delivery ofobjectives through dynamic use of planning mechanisms which “will requireamong other things, the use of precise, purpose-designed and consistentinformation gathered and fed into the cycle through monitoring”.1.3 Guidance in ‘Making <strong>Plan</strong>s’ sets out the following practical considerations indevising a monitoring scheme:• The way that monitoring is carried out for a development plan should belinked to other plans with which there is a policy relationship. This meansplans at the same policy level within the same strategic area and plans forlevels above (or below) the plan. The regional planning bodies are seeking adegree of consistency.• The information requirements for monitoring must be realistic. That is, theremust be something that is capable of unequivocal measurement and the levelof effort in collecting the information must be proportionate to the value of theinformation.• The information must also be capable of being collected consistently at timeintervals providing for comparison.• It is best practice that measuring the progress of the plan towards its statedpolicy objectives and targets should be an annual process. However, the1
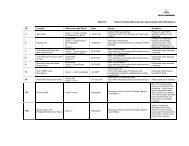
3 Indicators in Relation to <strong>Structure</strong> <strong>Plan</strong> Objectives3.1 This chapter presents the indicators, where available, as set out in Chapter 14of the <strong>County</strong> <strong>Structure</strong> <strong>Plan</strong>, in relation to each <strong>Structure</strong> <strong>Plan</strong> objective. Thefull list of figures is set out in Appendix 1.3.2 STRUCTURE PLAN OBJECTIVE: Seek a reduction in the consumption ofenergy and finite resources through the more efficient use of resources,recycling, the use of renewable sources and the reduction in the amountof waste produced.Indicator 1:Number and percent of dwellings and buildings for employment purposes(B1-B8) on previously developed land.3.2.1 Figure 1 shows the number of dwellings completed on brownfield (previouslydeveloped) land by district <strong>1996</strong>-2001. The number of dwellings developed onpreviously developed land during the period <strong>1996</strong>-2001 was highest inWychavon District and lowest in Redditch. In terms of the percentage of thetotal number of dwellings completed on brownfield sites during the period, WyreForest was the highest at 78% of the total and Redditch and Worcester City thelowest at 22%. The latter percentage may be explained by the large number ofdwellings completed on greenfield sites at Warndon Villages and St. Peter theGreat in Worcester during this period.Figure 1:Dwellings completed on brownfield sites <strong>1996</strong>-2001 by District and as apercentage of total completions <strong>1996</strong>-2001.DistrictCompletions onbrownfield sites<strong>1996</strong>-2001Total dwellingscompleted<strong>1996</strong>-2001% of totalcompletions onbrownfield sitesBromsgrove 845 1,658 51Malvern Hills 1,029 1,522 68Redditch 413 1,881 22Worcester 579 2,620 22Wychavon 1,455 3,445 42Wyre Forest 801 1,022 78<strong>County</strong> total 5,122 12,148 42Source: <strong>County</strong> and District <strong>Council</strong>s' Residential Land Availability Schedules, April 20013.2.2 Figure 2 shows the amount of land developed for employment purposes onbrownfield sites by district <strong>1996</strong>-2001. Overall about 37% of the total amount ofemployment development in the <strong>County</strong> was on previously developed landduring this period. The percentages vary from 25% in Malvern Hills District to52% of the total district housing completions in Wyre Forest District.4
Figure 2:Development for employment uses on brownfield land by District andas a percentage of total completions by district <strong>1996</strong>-2001 (hectares).DistrictCompletionson brownfieldland <strong>1996</strong>-2001Total employmentcompletions<strong>1996</strong>-2001% of totalcompletions onbrownfield landBromsgrove 6.7 15.7 43Malvern Hills 4.03 16.02 25Redditch 14.95 29.83 50Worcester 4.2 15.63 27Wychavon 8.82 30.88 28Wyre Forest 4.61 8.83 52<strong>County</strong> total 43.31 116.89 37Sources: District and <strong>County</strong> <strong>Council</strong>s Employment Land Availability Schedules, April 2001Indicator 2:Proportion of waste reused, recycled, used for energy production andlandfilled (tonnes).3.2.3 Figure 3 provides the total amounts of waste reused, recycled and landfilled inthe <strong>County</strong> <strong>1996</strong>-2001. The figures for the amount of waste used for energyproduction is not available and therefore the proportions in each categorycannot be calculated.Figure 3:Proportion of waste composted, recycled, and landfilled in the <strong>County</strong><strong>1996</strong>-2001 (tonnes).<strong>1996</strong>-1997 1997-1998 1998-1999 1999-2000 2000-2001Composted n/k 10,018 5,665 13,039 11,266Recycled 9,246 10,230 16,045 18,835 18,913Landfilled 236,573 225,511 233,634 258,230 253,972Source: Waste Services, <strong>Worcestershire</strong> <strong>County</strong> <strong>Council</strong>3.3 STRUCTURE PLAN OBJECTIVE: Protect from damaging development andland use activity and enhance biodiversity and diverse and importantenvironmental townscape and historic features and characteristics.Indicator 3:Number of countryside management projects established.3.3.1 198 countryside management projects were established in the <strong>County</strong> during2000-2001.Indicator 4:Number and percent of minerals applications refused on environmentalgrounds.5
3.3.2 In the <strong>County</strong> two minerals planning applications were refused during the period1999-2001 (the only period for which information is available), both partly onenvironmental grounds; this represented 50% of the total number of mineralsapplications determined.Indicator 5:Number and percentage of minerals applications permitted/ modifiedrelated to need/environmental factors/quality of restoration of aftercare.3.3.3 In the <strong>County</strong> as a whole during the period 1999-2001 3 minerals planningapplications (75% of the total determined) were permitted, or permitted withmodifications related to need/environmental factors.Indicator 6:Number and percent of waste applications refused on environmentalgrounds.3.3.4 In the <strong>County</strong> as a whole during the period 1999-2001 5 waste planningapplications were refused, of which 2 were refused solely on environmentalgrounds and 3 were refused partly on environmental grounds. This represented5% and 7% respectively of the total number of waste applications determinedduring the period.Indicator 7:Number and percent of waste applications permitted/modified related toneed/ environmental factors/quality of restoration of aftercare.3.3.5 In the <strong>County</strong> as a whole during the period 1999-2001 36 waste planningapplications were permitted or permitted with modifications related to need,environmental factors, or quality of restoration of aftercare. This represented86% of the total number of waste applications determined.Indicator 8:Number of Conservation Areas in the <strong>County</strong>.3.3.6 The number of conservation areas in each district at April 2001 was as follows:Bromsgrove – 10; Malvern Hills – 21; Redditch – 2; Worcester City – 16;Wychavon – 66; Wyre Forest – 15.Indicator 9:Number of new Conservation Areas Designated.3.3.7 Two new conservation areas were designated in the <strong>County</strong> during the period<strong>1996</strong>-2001, one in Bromsgrove District and one in Malvern Hills District.3.4 STRUCTURE PLAN OBJECTIVE: Meeting the housing requirement of thepopulation of the <strong>County</strong> through the provision of an adequate range ofgeneral market, affordable and social housing in a way which respects theenvironmental capacity of the area and makes the most effective use ofthe existing settlement pattern.Indicator 10:Progress towards meeting the 28,100 dwellings provision for the period<strong>1996</strong>-<strong>2011</strong>.6
3.4.1 Between <strong>1996</strong> and 2001 a total of 12,148 dwellings were completed in the<strong>County</strong>. This represents about 43% of the total dwellings requirements for the<strong>County</strong> for the period <strong>1996</strong>-<strong>2011</strong> as set out in <strong>Structure</strong> <strong>Plan</strong> Policy D.4.Figure 4:Dwellings completed by District <strong>1996</strong>-2001 compared to <strong>Structure</strong> <strong>Plan</strong>Allocations <strong>1996</strong>-<strong>2011</strong>.DistrictDwellingscompleted<strong>1996</strong>-2001<strong>Structure</strong> <strong>Plan</strong>allocation<strong>1996</strong>-<strong>2011</strong>% ofallocationcompletedBromsgrove 1,658 3,950 42Malvern Hills 1,522 3,900 39Redditch 1,881 4,550 41Worcester 2,620 5,250 50Wychavon 3,445 7,450 46Wyre Forest 1,022 3,000 34<strong>County</strong> total 12,148 28,100 43Source: <strong>County</strong> and District <strong>Council</strong>s' Residential Land Availability Reports, April 2001Indicator 11:Number of new dwellings provided, classified as affordable/ social byexisting stock and new build <strong>1996</strong>-2001.3.4.2 A total of 1,108 dwellings classified as affordable/social were developed in the<strong>County</strong> between <strong>1996</strong>-2001. This represents 9.1% of the total number ofdwellings completed in the <strong>County</strong> during that period.Indicator 12:Level of Homelessness by District.3.4.3 During the year 2000-2001 there were 1,606 people registered as homeless inthe <strong>County</strong>. Figure 5 shows the numbers homeless by district. It indicates thathomelessness varied from 156 persons in Worcester City to 371 persons inWyre Forest. (Alternative published figures using different definitions ofhomeless are available from those in Figure 5).Figure 5:Numbers of persons registered as homeless by District 2000-2001.DistrictNumbers homeless2000-2001Bromsgrove 250Malvern Hills 234Redditch 304Worcester 156Wychavon 291Wyre Forest 371<strong>County</strong> total 1,606Source: DTLR7
Indicator 13:Average house and income levels by District.3.4.4 Figure 6 indicates that Malvern Hills District had the highest average houseprice in the <strong>County</strong> in April 2001, and Wyre Forest the lowest. The relativelyhigh house price levels in Malvern Hills are likely to reflect the district'sattractiveness as a retirement location. Average income levels in 2001 by districtset out in Figure 7 show that of the districts where the information is available,Bromsgrove District had the highest average income in 2001.This may reflectthe fact that the district is attractive to relatively affluent commuters to theconurbation. Data for Malvern Hills and Wychavon Districts is not available.Figure 6:Average house price by District, April- June 2001.DistrictAverage House PriceApril- June 2001(£)Bromsgrove 135,966Malvern Hills 141,755Redditch 102,187Worcester 100,032Wychavon 134,563Wyre Forest 93,817<strong>County</strong> average 117,337Source: Land RegistryFigure 7:Average income level by District 2001.DistrictAverage income levelin 2001(£)Bromgrove 416.3Malvern Hillsn/aRedditch 402.5Worcester 388.8Wychavonn/aWyre Forest 366.0Note : Average income levels are gross weeklyearnings of full time employees at adult rates.Source: New Earnings SurveyIndicator 14:Vacancies in existing stock by District, 2001.3.4.5 Figure 8 shows that in 2001 Wychavon District had the highest percentage ofvacant housing stock at 4.0% and Malvern Hills District the lowest at 0.7%. In<strong>Worcestershire</strong> as a whole 2.1% of the existing stock was vacant, a total of4,979 dwellings.8
Figure 8:Vacancies in existing stock by District, 2001.DistrictVacancies in existingstock (% of total)Bromsgrove 396 (1.1)Malvern Hills 210 (0.7)Redditch 333 (1.1)Worcester 1,177 (2.9)Wychavon 1,939 (4.0)Wyre Forest 924 (2.2)<strong>County</strong> total 4,979 (2.1)Source : Regional Housing Land Availability Survey, 2001Indicator 15:Number and percent of dwellings committed within or adjacent to theurban areas of Bromsgrove, Droitwich, Kidderminster, Stourport-on-Severn, Redditch, Worcester, Malvern, Evesham and Pershore.3.4.6 <strong>Structure</strong> <strong>Plan</strong> Policy SD.6 requires that the majority of the outstandingdevelopment needs of the <strong>County</strong> to be met within the <strong>Structure</strong> <strong>Plan</strong> period willtake place within or adjacent to the urban areas of Bromsgrove, Droitwich,Kidderminster, Stourport-on-Severn, Redditch, Worcester, Malvern, Eveshamand Pershore. Figure 9 shows the total dwelling capacity of sites with planningpermission, under construction and allocated for housing in local plans at April2001 for each urban area.The number of dwellings committed at thesesettlements totalled 4,145 dwellings.Figure 9:Dwellings commitments in and adjacent to urban areas and as apercentage of total District commitments at April 2001.Urban AreaDwellingscommitmentsin urban areaTotal districtdwellingscommitments2001% of total inurban areaBromsgrove Town 770 1,184 65Malvern Town* 175 497 35Redditch Town 940 1,059 89Worcester 608 608 100Droitwich 326 1,308 25Evesham 184 1,308 14Pershore 60 1,308 5Kidderminster 677 1,382 49Stourport-on-Severn 405 1,382 29<strong>County</strong> total 4,145 6,038 68NotesCommitments comprise local plan allocations, sites under construction and sites with planningpermission* Malvern Town comprises Malvern, Malvern Wells and West MalvernSource: District and <strong>County</strong> <strong>Council</strong> Residential Land Availability Reports, April 20019
Indicator 16:Annual district housing completed and with permission.3.4.7 Figure 10 shows the annual dwellings completions by district for the period<strong>1996</strong>-2001. The dwellings commitments at April 2001 by district are set out aspart of Figure 11 below.Figure 10:Annual District Housing Completions by District <strong>1996</strong>-2001.District <strong>1996</strong>-97 1997-98 1998-99 1999-00 2000-01Average<strong>1996</strong>-2001Bromsgrove 291 254 199 331 583 332Malvern Hills 402 467 306 151 196 304Redditch 262 380 284 472 483 376Worcester City 689 522 670 466 273 524Wychavon 661 773 718 627 666 689Wyre Forest 164 252 248 184 174 204Source: District and <strong>County</strong> <strong>Council</strong> Residential Land Availability Reports, April 2001Indicator 17:Total District Housing completed and with permission since <strong>1996</strong> as anumber and percentage of the District requirement for the period<strong>1996</strong>-2006.3.4.8 <strong>County</strong> <strong>Structure</strong> <strong>Plan</strong> Policy D.2 provides indicative amounts of housing to beprovided in each district in two time periods, <strong>1996</strong>-2006 and 2006-<strong>2011</strong>. The<strong>Structure</strong> <strong>Plan</strong> expects that phasing policies in local plans will be broadly in linewith the indicative amounts set out in Policy D.2. Figure 11 illustrates that byApril 2001, Wyre Forest District had already met the indicative amount to beprovided in the district as set out in Policy D.2 for the period <strong>1996</strong>-2006 and theindicative amount for Bromsgrove had virtually been met in that district.3.4.9 All of the district councils, with the exception of Bromsgrove, are at variousstages in reviewing their local plans which will roll them forward to the <strong>County</strong><strong>Structure</strong> <strong>Plan</strong>’s end date of <strong>2011</strong>. Reference should be made to thoseemerging local plans to gain an understanding of how the district councils areaddressing the issue of the managed release of land for housing.DistrictFigure 11:Total District Dwellings Completed and with permission since <strong>1996</strong> as anumber and percentage of the <strong>Structure</strong> <strong>Plan</strong> phasing requirement for theperiod <strong>1996</strong>-2006.Completions<strong>1996</strong>-2001CommitmentsApril 200110Totalcompletions andcommitmentsPhasing<strong>1996</strong>-06% ofPhasing<strong>1996</strong>-2006Bromsgrove 1,658 1,184 2,842 3,000 95Malvern Hills 1,522 497 2,019 2,900 70Redditch 1,881 1,059 2,940 3,600 82Worcester City 2,620 608 3,228 4,150 78Wychavon 3,445 1,308 4,753 5,900 81Wyre Forest 1,022 1,382 2,404 2,400 100Source: District and <strong>County</strong> <strong>Council</strong> Residential Land Availability Reports, April 2001
3.5 STRUCTURE PLAN OBJECTIVE: Work towards a better balance betweenhousing, employment, social and community facilities within settlements.Indicator 18:Number and percent of dwellings built within or adjacent to the urbanareas of Bromsgrove, Droitwich, Kidderminster, Stourport-on-Severn,Redditch, Worcester, Evesham, Malvern and Pershore.3.5.1 Figure 12 shows that housing completions <strong>1996</strong>-2001 in and adjacent to theurban areas of the six districts as a percentage of the total completions tend toreflect districts’ rurality. The built up area of Worcester generally extends to theCity’s administrative boundary and hence all of the completions were within oradjacent to the built up area. Housing completions in Redditch District werealmost entirely within Redditch Town. Although this District has extensive ruralareas, residential development is restricted by green belt designation whichcovers much of the rural area and by the limited scope for housing developmentin the rural settlements of Feckenham and Astwood Bank. Kidderminster andStourport-on-Severn together accounted for about 74% of the total housingcompletions in Wyre Forest District. Malvern Town and Bromsgrove Town arethe dominant settlements in the districts of Malvern Hills and Bromsgroverespectively. There are extensive rural areas in both districts, but no other largesettlements and this is reflected in the percentage of the total completions ineach district which occurred at the two towns. In Wychavon District the threeurban areas of Droitwich, Evesham and Pershore together accounted for about52% of the total housing completions. Wychavon is an extensive rural districtwhere considerable numbers of rural windfall and allocated housing completionsare reflected in the above percentage.Figure 12:Number of Dwellings built within or adjacent to the urban area <strong>1996</strong>-2001and as a percentage of total completions in the District.Urban Area(s)DwellingsCompletionsIn urbanarea(s)<strong>1996</strong>-2001DistrictDwellingsCompletions<strong>1996</strong>-2001% of Districtcompletionsin urbanarea(s)Bromsgrove Town 755 1,658 46Malvern Town* 614 1,522 40Redditch Town 1,746 1,881 93Worcester 2,620 2,620 100Evesham, Droitwich and 1,808 3,445 52PershoreKidderminster and757 1,022 74Stourport-on-Severn* Malvern Town comprises Malvern, Malvern Wells and West MalvernSource: District and <strong>County</strong> <strong>Council</strong> Residential Land Availability Reports, April 200111
Indicator 19:Annual district housing completed and with permission.3.5.2 This indicator is the same as indicator 16 above. See Figure 11.Indicator 20:Total District Housing completed and with permission since <strong>1996</strong> as anumber and percentage of the District requirement for the period<strong>1996</strong>-2006.3.5.3 This indicator is the same as indicator 16. See Figure 11.Indicator 21:Amount of land for employment purposes (Classes B1, B2 and B8) in orimmediately adjacent to the urban areas of the <strong>County</strong> within transportcorridors.3.5.4 <strong>Structure</strong> <strong>Plan</strong> Policy SD.6 in essence requires that the majority of theoutstanding development needs of the <strong>County</strong> should be met within or adjacentto the urban areas of the <strong>County</strong>. Figure 16 shows the total amounts of landavailable for employment uses in April 2001. All of the settlements have railstations and lie within rail transport corridors with the exception of Stourport-on-Severn, which is in a bus corridor.Figure 13:Available land for employment in or immediately adjacent to the urbanareas of the <strong>County</strong> within transport corridors at April 2001 (hectares).Urban AreaCompletions<strong>1996</strong>-2001Available land foremploymentApril 2001Bromsgrove Town 3.3 12.1Malvern Town 12.87 10.25Redditch Town 29.83 42.94Worcester 15.63 28.92Droitwich 2.04 18.3Evesham 10.0 17.9Pershore 5.77 7.22Kidderminster 5.32 22.75Stourport-on-Severn 1.69 3.81Note: Available land comprises local plan allocations and sites underconstruction and with planning permissionSource: District and <strong>County</strong> <strong>Council</strong> Employment Land Availability Schedules,April 2001Indicator 22:Progress towards meeting the amount of land needed within Classes B1,B2 and B8 in each District.12
District3.5.5 Figure 14 shows that of the six districts, Redditch and Wyre Forest had met theirrespective <strong>Structure</strong> <strong>Plan</strong> employment land allocations by 2001. The remainingdistricts had still to identify land for employment uses to meet their employmentland allocations. Reference should be made to the emerging reviews of DistrictLocal <strong>Plan</strong>s for information on how the <strong>Structure</strong> <strong>Plan</strong> employment landallocations are being addressed.Figure 14:Employment Land Completions <strong>1996</strong>-2001 and Commitments 2001compared to <strong>Structure</strong> <strong>Plan</strong> Employment Land Allocations (hectares).Completions<strong>1996</strong>-2001Commitments2001TotalCompletions andcommitments<strong>1996</strong>-2001<strong>Structure</strong> <strong>Plan</strong>EmploymentAllocationShortfall/Surplusat 2001Bromsgrove 15.70 38.90 54.60 55 -0.4Malvern Hills 16.02 16.55 32.57 55 -22.43Redditch 29.83 42.94 72.77 65 +7.77Worcester 15.63 28.92 44.55 75 -30.45Wychavon 30.88 57.92 88.80 100 -11.2Wyre Forest 8.83 36.03 44.86 45 0Note: Figures for Redditch include Ravensbank Business Park in Bromsgrove DistrictSource: District and <strong>County</strong> <strong>Council</strong> Employment Land Availability Schedules, April 20013.6 STRUCTURE PLAN OBJECTIVE: Enhance the role of settlements ascentres for service provision.Indicator 23:Employment levels by centre.3.6.1 Figure 15 shows the number of jobs in the service sector in the main urbanareas of the <strong>County</strong> in 2001. The number of jobs in the service sector is highestin Worcester City reflecting its sub-regional importance as an administrative,education, shopping and entertainment centre. Redditch town centre has thenext largest number of jobs in the service sector which is in part explained bythe number of jobs in retailing.Figure 15:Service Sector Employment Levels by Urban Centre, 2001.Service Sector EmploymentUrban Centre2001Bromsgrove Town 19,299Malvern Town 11,132Redditch Town 24,913Worcester 36,606Droitwich 6,156Evesham 6,800Pershore 2,299Kidderminster 17,876Stourport-on-Severn 3,629Source: Annual Business Inquiry, National Online Manpower InformationSystem13
3.7 STRUCTURE PLAN OBJECTIVE: Promote energy efficient construction,design and development patterns.Indicator 25:Number and percent of dwellings and employment development (B1-B8)built/planned for within or adjacent to urban areas of Bromsgrove,Droitwich, Kidderminster, Stourport-on-Severn, Redditch, Worcester,Evesham, Malvern and Pershore.3.7.1 Figure 9 above shows the number of dwellings commitments within or adjacentto the urban areas named in <strong>County</strong> <strong>Structure</strong> <strong>Plan</strong> Policy SD.6. This totalrepresents about 68% of the commitments in the <strong>County</strong> at that date. As maybe expected the respective percentage totals of the six districts reflect theirgeographical characteristics and the implementation of the previous structureplan development strategy which required the majority of housing developmentto be concentrated in, or adjacent to, the urban areas of the <strong>County</strong>. MalvernHills and Wychavon Districts, which are largely rural in nature and containrelatively small urban areas, have the lowest percentages of committeddwellings in or adjacent to their respective urban areas. Conversely the City ofWorcester District is essentially urban in nature with built development tight tothe district boundary and therefore all of the dwelling commitments are within oradjacent to the urban area. The number of dwellings completions are shown inFigure 16.3.7.2 Similarly the number and percentage of commitments and completions foremployment uses (Classes B1, B2 and B8) within or adjacent to the urban areasat April 2001 reflect the characteristics of the districts and the previousdevelopment plan strategy. See Figures 13 and 17.Figure 16:Dwellings completions within or adjacent to main urban areas <strong>1996</strong>-2001.Dwellings completionsUrban Area<strong>1996</strong>-2001Bromsgrove Town 755Malvern Town 614Redditch Town 1,746Worcester 2,620Droitwich 839Evesham 760Pershore 209Kidderminster 519Stourport-on-Severn 238Source: District and <strong>County</strong> <strong>Council</strong> Residential Land AvailabilitySchedules, April 200114
Figure 17:Employment development within or adjacent to main urban areas<strong>1996</strong>-2001.Employment development withinUrban Areaor adjacent to main urban areas<strong>1996</strong>-2001 (hectares)Bromsgrove Town 3.3Malvern Town 12.87Redditch Town 29.83Worcester 15.63Droitwich 2.04Evesham 10.0Pershore 5.77Kidderminster 5.32Stourport-on-Severn 1.69Source: <strong>County</strong> and District <strong>Council</strong> Employment Land Availability Schedules, April20013.8 STRUCTURE PLAN OBJECTIVE: Seek the location of development inareas which will minimise the need to travel and reduce the distancesrequired to be travelled (energy efficient locations).Indicator 26:Number and percent of dwellings and employment development (B1-B8)built within or adjacent to the urban areas of Bromsgrove, Droitwich,Kidderminster, Stourport-on-Severn, Redditch, Worcester, Evesham andPershore.3.8.1 See Figures 16 and 17 for these indicators.3.9 STRUCTURE PLAN OBJECTIVE: Guide new development to locationswhich can be served by a choice of transport modes for the movement ofpeople and freight.Indicator 27:Number and percent of dwellings and employment development (B1-B8)built within or adjacent to the urban areas of Bromsgrove, Droitwich,Kidderminster, Stourport-on-Severn, Redditch, Worcester, Evesham andPershore.3.9.1 See Figures 16 and 17 for these indicators.Indicator 28:Number of Class B8 developments at located within easy access torailheads and/or waterway termini.3.9.2 No developments of this nature took place in the <strong>County</strong> during the period <strong>1996</strong>-2001.15
3.10 STRUCTURE PLAN OBJECTIVE: Support and facilitate the developmentof alternative modes of travel to the car.Indicator 29:Length and number of bus lanes provided in the <strong>County</strong> at April 2001.3.10.1 In <strong>Worcestershire</strong> as a whole in April 2001 there were fourteen bus lanes, ten inRedditch, three in Worcester, and one in Kidderminster, with a total length of6.3 km.Indicator 30:Number of new Park and Ride facilities and parking spaces provided.3.10.2 In 2001 one bus park and ride facility operated in the <strong>County</strong>. It is located offDroitwich Road in the north of Worcester City. 450 car parking spaces areavailable at the site.3.10.3 During the year 2001-2002, the first year of operation, about 108,000 ticketswere issued at the park and ride site in Worcester.Indicator 31:Length and number of walking routes.3.10.4 In the <strong>County</strong> as a whole in 2001 there were about 4,820 km of public rights ofway, comprising 4,200 km of footpaths, 600 km of bridleways and 20 km ofbyways. The number of individual walking routes is not available.Indicator 32:Length and number of cycling routes.3.10.5 In the <strong>County</strong> as a whole in 2001 there were over 52 km of cycling routes, about32 km of which are in Worcester City. Redditch District has about 11 km andthe remaining districts of Malvern Hills, Bromsgrove, Wychavon and WyreForest each have less than 5 km of routes. The number of individual routes isnot available.3.11 STRUCTURE PLAN OBJECTIVE: Facilitate the strengthening anddiversification of the economic base of the Region and of <strong>Worcestershire</strong>by the provision of a mixed portfolio of development locations and sitesand by the enhancement and management of an attractive <strong>County</strong>environment.Indicator 33:Progress towards meeting the provision of a portfolio of employment(Classes B1, B2 and B8) land and sites in each district in terms ofgreenfield/ brownfield location and size.3.11.1 Figure 18 shows that in 2001 the employment land portfolio of available sites inBromsgrove District were generally small in size. The emerging BromsgroveDistrict Local <strong>Plan</strong> allocates land for employment at Stoke Prior and at BuntsfordHill and Aston Fields, Bromsgrove.16
District3.11.2 In Redditch Borough the employment land portfolio in 2001 had a reasonablerange of sites in terms of size, location and quality. The largest site in theportfolio was a greenfield business park with 15.7 hectares remaining to bedeveloped. The site adjoins the built-up area of Redditch in Bromsgrove District.3.11.3 Over two-thirds of the Wyre Forest District employment land portfolio werepreviously developed sites. However in total they accounted for less than onethirdof the total amount of available employment land.3.11.4 In Malvern Hills District the employment land portfolio included only two sitesover 1 hectare in size. The great majority of the available sites comprised smallbrownfield sites.3.11.5 Worcester City’s portfolio in 2001 comprised ten sites; most of the availableemployment land was previously developed and includes former railway goodsyards. The size and number of greenfield sites available in 2001 was extremelylimited and all this land was located on the north east edge of the built up area.The portfolio is proposed to be strengthened in this respect by the allocation oftwo large greenfield sites in the emerging review of the City of Worcester DistrictLocal <strong>Plan</strong> at locations to the east and west of the River Severn.3.11.6 In Wychavon in 2001 the employment land portfolio was reasonably welldistributed in terms of size of site and brownfield/greenfield split. As Figure 18shows, the urban areas of Droitwich, Evesham and Pershore each had sitesavailable for development in 2001, however none of the towns had brownfieldsites available. A significant site outside of the urban areas in the district wasavailable at a major location at Hartlebury Estate, Hartlebury. Employment landin the remaining part of the rural area of the district was generally limited topreviously developed sites at Hinton-on-the-Green, Blackminster and Norton.Figure 18:Employment Land Portfolio by District: Total number of sites available bysize and greenfield/brownfield 2001.Total area of sitesunder 0.4 ha (no.of sites)Total area of sites0.4-0.99 ha(no. ofsites)Total area of sites1-4.99 ha(no. ofsites)Total area of sitesover 5ha(no. ofsites)Greenfield Brownfield Greenfield Brownfield Greenfield Brownfield Greenfield BrownfieldBromsgrove 0.8(1) 1.3(3) 0.9(2) 4.3(7) 7.6(3) 1(2) 9.5(2) 13.5(2)Malvern Hills 0.72(3) 2.94(29) 0.72(2) 3.01(4) 2.32(1) 0 8.7(1) 0Redditch 1.66(6) 0.71(4) 3.82(6) 1.32(2) 7.53(4) 9.47(3) 15.7(1) 0Worcester 0.3(1) 0 0.4(1) 1.7(2) 2.82(2) 7.6(2) 0 16.1(2)Wychavon 0.77(4) 0.66(2) 5.53(8) 2.21(3) 9.38(3) 11.67(4) 27.74(2) 0Wyre Forest 0 2.27(11) 1.14(2) 3.09(4) 17.43(5) 5.9(4) 6.2(1) 0Source: <strong>County</strong> and District <strong>Council</strong>s Employment Land Schedules 200117
Figure 19:Land available for employment development by District by location2001(hectares).LocationBromsgrove DistrictBromsgrove town 12.3Elsewhere in district 26.6LocationMalvern Hills DistrictMalvern town 10.25Elsewhere in district 9.56LocationRedditch DistrictRedditch town 42.94Elsewhere in district 0.0LocationWorcester CityWorcester 28.92LocationWychavon DistrictDroitwich 18.3Evesham 17.9Pershore 7.22Elsewhere in district 14.5LocationWyre Forest DistrictKidderminster 22.75Stourport-on-Severn 3.81Elsewhere in district 9.47Source: <strong>County</strong> and District <strong>Council</strong>s' Employment Land AvailabilitySchedules, April 2001Indicator 34:Progress towards meeting the amount of land provided within UseClasses B1, B2 and B8 in each District (land with current planningpermission and local plan allocations and completions).3.11.7 See Figure 14 above for information on this indicator.Indicator 35:Readily available land by sector (international down to local) on a<strong>County</strong>wide basis.3.11.8 Figure 20 shows that about 52 hectares of readily available land in the <strong>County</strong> in2001 were classified as being in the national/international market sector. Thisland is capable of attracting and accommodating firms from elsewhere in the UKand beyond by virtue of size, position, communications and associateddevelopments surrounding the site. Ravensbank Business Park, Beoley, nearRedditch is an example of such a site. Land classified as being in the regionalmarket sector is considered capable of attracting and accommodating both firmsfrom elsewhere in the region and regional manufacturing/distribution plants of18
large companies from outside the region. There were about 57 hectares of landin this category. Enigma Business Park, Malvern is an example of such a site.The third category is land classified as being in the local market sector. Thiscategory comprises two sub-categories: good local which are sites appropriateto accommodate successful local firms wishing to expand/relocate. They areunlikely to attract inward investment but capable of commanding localspeculative interest; and other local which are capable of development but lesslikely to attract speculative private interest. About 17 hectares were available inthis category. The Coloroll Redevelopment Site at Kidderminster is an exampleof such a site. The <strong>County</strong> has a higher percentage of available land in thenational/international market sector (87%) than the West Midlands regionalaverage (77%). For further information on this indicator reference should bemade to the Regional Industrial Land Study 2001.Figure 20:Readily available land for employment uses by market sector in the<strong>County</strong> at 2001 (hectares).National/InternationalRegional Local Total ReadilyAvailable52 57 17 126Source: Regional Industrial Land Study, 2001Indicator 36:Readily available land for employment (B1-B8) purposes since <strong>1996</strong>,completed and available (at date of monitor).3.11.9 See Figure 14 above.Indicator 37:Employment changes in terms of sector/full-time employees/part-timeemployees.3.11.10 From Figure 21 it can be seen that the largest net gain in full-time workers in theperiod 1998-2001 occurred in Malvern Hills District due to the growth in servicesector employment outstripping the decline in manufacturing jobs. The largestnet loss in full-time workers was in Wyre Forest District where there were netlosses in the manufacturing, construction and other services sectoral groups.As Figure 22 shows in respect of changes in part-time employment, the largestnet gains were in Worcester and Redditch Districts. Wyre Forest suffered thelargest net loss in part-time jobs over the period. The year 1998 was chosen asthe nearest to <strong>1996</strong> for which comparable data to 2001 is available.19
Figure 21:Employment changes 1998-2001 by employment sector by District:full-time employees.Broad Sectoral Groups 1998 2001 Change % changeBromsgrovePrimary & Utilities 511 490 -21 -4.1Manufacturing & Construction 5,201 4,591 -610 -11.7Retail & Distribution 416 5,461 +745 +15.8Administration & other Services 929 8,245 -884 -9.7Total 19,557 18,787 -770 -3.9Malvern HillsPrimary & Utilities 1,084 958 -126 -11.6Manufacturing & Construction 4,644 4,547 -97 -0.2Retail & Distribution 3,051 4,255 +1,204 +39.4Administration and Other Services 6,275 7,284 +1,009 +16.1Total 15,054 17,044 +1,990 +13.2RedditchPrimary & Utilities 18 96 +78 +43.3Manufacturing & Construction 12,678 12,319 -359 -2.8Retail & Distribution 6,279 73,352 +1,073 +17.1Administration & Other Services 9,085 9,467 +382 +4.2Total 28,060 29,234 +1,174 +4.2Worcester CityPrimary & Utilities 664 480 -184 -27.7Manufacturing & Construction 7,224 7,189 -35 -0.5Retail & Distribution 9,071 10,332 +1,261 +13.9Administration & Other Services 12,479 13,365 +886 +7.1Total 29,438 31,366 +1,928 +6.5WychavonPrimary & Utilities 2,091 1,872 -219 -10.5Manufacturing & Construction 12,374 11,718 -656 -5.3Retail & Distribution 8,185 10,815 +2,630 +32.1Administration & Other Services 10,199 9,377 -822 -8.1Total 32,849 33,782 +933 +2.8Wyre ForestPrimary & Utilities 485 458 -27 -5.6Manufacturing & Construction 10,570 8,797 -1,773 -16.8Retail & Distribution 5,908 6,587 +679 +11.5Administration & Other Services 7,811 6,455 -1,356 -17.4Total 24,774 22,297 -2,479 -10.0Source: Annual Business Inquiry Employee Analysis20
Figure 22:Employment changes 1998-2001 by employment sector by District:part-time employees.Broad Sectoral Groups 1998 2001 Change% changeBromsgrovePrimary & Utilities 161 96 -65 -40.4Manufacturing & Construction 616 525 -91 -14.8Retail & Distribution 4,216 4,757 +541 +12.8Administration & Other Services 8,938 11,449 +2,511 +28.1Total 13,931 16,827 2,896 +20.8Malvern HillsPrimary & Utilities 232 167 -65 -28.0Manufacturing & Construction 588 477 -111 -18.8Retail & Distribution 2,428 3,460 +1,032 +42.5Administration & Other Services 5,050 4,961 -89 -1.7Total 8,298 9,065 +767 +9.2RedditchPrimary & Utilities 9 5 -4 -44.4Manufacturing & Construction 1,593 1,054 -539 -33.8Retail & Distribution 3,568 4,461 +893 +25.0Administration & Other Services 4,934 7,122 +2,188 +44.3Total 10,104 12,642 +2,538 +25.1Worcester CityPrimary & Utilities 74 23 -51 -6.9Manufacturing & Construction 531 517 -14 -2.6Retail & Distribution 6,730 7,923 +1,193 17.7Administration & Other Services 7,821 9,274 +1,453 +18.6Total 15,156 17,737 +2,581 +17.0WychavonPrimary & Utilities 481 414 -67 -13.9Manufacturing & Construction 1,153 937 -215 -18.7Retail & Distribution 5,387 6,309 +922 +17.1Administration & Other Services 6,385 6,741 +356 +5.6Total 13, 405 14,401 +996 +7.4Wyre ForestPrimary & Utilities 114 90 -24 -21.0Manufacturing & Construction 933 758 -175 -18.8Retail & Distribution 4,919 5,331 +412 +8.4Administration & Other Services 6,141 5,381 -760 -12.4Total 12,107 11,560 -547 -4.5Source: Annual Business Inquiry Employee Analysis21
Indicator 39:Number of town enhancement schemes.3.11.11 In the <strong>County</strong> as a whole, 60 town enhancement schemes were created duringthe period <strong>1996</strong>-2001, 56 of which were in Wychavon District.3.12 STRUCTURE PLAN OBJECTIVE: Support the enhancement, developmentand integration of, and access to, a range of recreation facilities bothwithin and around settlements.Indicator 40:Number of tourist facilities/hotel accommodation over a given period.3.12.1 During the period <strong>1996</strong>-2001 405 serviced accommodation establishments werecreated in the <strong>County</strong>.3.12.2 According to Visit Heart of England, in the <strong>County</strong> as a whole about 1 millionovernight trips to the <strong>County</strong> were made by UK residents during 2001. Duringthe same period about 136,000 overnight trips were made by overseas visitorsto the <strong>County</strong>. Domestic visitors to the <strong>County</strong> accounted for 2.6 million of thetotal number of nights 3.8 million nights stayed in the <strong>County</strong> during 2001. Theremainder of nights stayed were by overseas visitors. In 2001 the equivalentspend by domestic visitors to the <strong>County</strong> was £196 million and that spent byoverseas visitors was £37 million.22
4 Conclusions4.1 This report presents the findings of the initial monitoring of the <strong>County</strong> <strong>Structure</strong><strong>Plan</strong> for the period <strong>1996</strong>-2001 for those <strong>Structure</strong> <strong>Plan</strong> indicators that are readilyavailable. In line with the Guidance in “Making <strong>Plan</strong>s” the report concentrateson those indicators that are capable of being collected consistently at timeintervals providing for comparison. Of particular importance in this regard is dataon housing provision which will be valuable in implementing the plan, monitor,manage approach to the provision of housing advocated by government and inexamining the delivery of the development strategy of the <strong>Plan</strong>.4.2 The report provides a baseline statement of the position at 2001, the year inwhich the <strong>Structure</strong> <strong>Plan</strong> was adopted. Because of this no conclusions can bemade on the extent to which the <strong>Structure</strong> <strong>Plan</strong> policies are being implemented.4.3 Future monitoring reports will update the indicators in this report and will seek toinclude additional indicators set out in the <strong>County</strong> <strong>Structure</strong> <strong>Plan</strong>.23
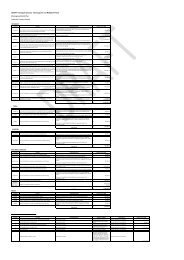
Appendix 1 – List of figures in the report.Figure 1 Dwellings completed on brownfield sites<strong>1996</strong>-2001 by District and as apercentage of total completions <strong>1996</strong>-2001.Figure 2 Development for employment uses on brownfield land by District and as apercentage of total completions <strong>1996</strong>-2001(hectares).Figure 3 Proportion of waste composted, recycled, and landfilled in the <strong>County</strong><strong>1996</strong>-2001 (tonnes).Figure 4 Dwellings completed by District <strong>1996</strong>-2001 compared to <strong>Structure</strong> <strong>Plan</strong>Allocations <strong>1996</strong>-<strong>2011</strong>.Figure 5 Numbers of persons registered as homeless by district 2000-2001.Figure 6 Average house price by District, April-June 2001.Figure 7 Average income level by District 2001.Figure 8 Vacancies in existing stock by District, 2001.Figure 9Dwellings commitments in and adjacent to urban areas as percentage oftotal District commitments at April 2001.Figure 10 Annual District Housing Completions by District <strong>1996</strong>-2001.Figure 11 Total District Dwellings Completed and with permission since <strong>1996</strong> as anumber and percentage of the <strong>Structure</strong> <strong>Plan</strong> phasing requirement for theperiod <strong>1996</strong>-2006.Figure 12 Number of Dwellings built within or adjacent to the urban area <strong>1996</strong>-2001Figure 13and as a percentage of total completions in the District.Available land for employment in or immediately adjacent to the urbanareas of the <strong>County</strong> within transport corridors at April 2001 (hectares).Figure 14 Employment Land Completions <strong>1996</strong>-2001 and Commitments 2001compared to <strong>Structure</strong> <strong>Plan</strong> Employment Land Allocations (hectares).Figure 15 Service Sector Employment Levels by Urban Centre, 2001.Figure 16 Dwellings completions within or adjacent to main urban areas <strong>1996</strong>-2001.Figure 17 Employment development within or adjacent to main urban areas <strong>1996</strong>-2001.Figure 18Figure 19Figure 20Figure 21Figure 22Employment Land Portfolio by District: Total number of sites available bysize and greenfield/brownfield 2001.Land available for employment development by District by location2001(hectares).Readily available land for employment uses by market sector in the<strong>County</strong> at 2001.Employment changes 1998-2001 by employment sector by District: fulltimeemployees.Employment changes 1998-2001 by employment sector by District: parttimeemployees.24