- Page 1 and 2: TanzaniaHIV/AIDS and MalariaIndicat
- Page 3 and 4: The 2007-08 Tanzania HIV/AIDS and M
- Page 5 and 6: 3.5 Access to Mass Media ..........
- Page 7 and 8: 12.2 Orphans and Vulnerable Childre
- Page 9 and 10: Table 4.3Table 4.4Table 4.5Table 4.
- Page 11 and 12: Figure 9.2 HIV Prevlence by Region/
- Page 14: FOREWORDThis report presents the ma
- Page 18 and 19: SUMMARY OF FINDINGSThe 2007-08 Tanz
- Page 20 and 21: HIV prevalence among youth (women a
- Page 23 and 24: xxii | Map of Tanzania
- Page 25 and 26: 1.2 NATIONAL POLICY ON HIV/AIDSIn r
- Page 27 and 28: To assess levels and trends in know
- Page 29 and 30: 1.8 FIELDWORKData collection was ca
- Page 31 and 32: Table 1.1 Results of the household
- Page 33 and 34: Figure 2.1 presents a graphic pictu
- Page 35 and 36: Table 2.3.1 Educational attainment
- Page 37 and 38: Educational attainment is higher in
- Page 39 and 40: 2.5.1 Energy SourcesTable 2.5 prese
- Page 41 and 42: The most common items are agricultu
- Page 43 and 44: The 2007-08 THMIS included aquestio
- Page 45 and 46: Table 3.1—ContinuedBackgroundchar
- Page 47 and 48: Education is positively related to
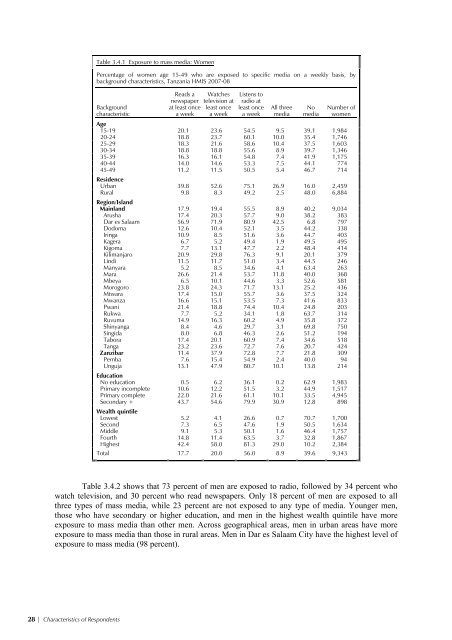
- Page 49: Table 3.3.2 Employment status: MenP
- Page 53 and 54: 3.6 CURRENT MARITAL STATUSMarriage
- Page 55 and 56: Polygyny also varies by household w
- Page 57 and 58: Four in ten women age 20-49 marry b
- Page 59 and 60: There is a positive relationship be
- Page 62 and 63: FERTILITY AND REPRODUCTIVE HEALTH 4
- Page 64 and 65: Table 4.2 Fertility by background c
- Page 66 and 67: infertility, 1 or the inability to
- Page 68 and 69: 4.3 ADOLESCENT FERTILITYAdolescent
- Page 70 and 71: Table 4.7 Antenatal carePercent dis
- Page 72: Table 4.8 Place of antenatal carePe
- Page 75 and 76: Table 5.1 Knowledge of AIDSPercenta
- Page 77 and 78: The use of condoms as an effective
- Page 79 and 80: Table 5.3.2 Comprehensive knowledge
- Page 81 and 82: more education) and those in the fo
- Page 83 and 84: Table 5.5.1 Exposure to HIV educati
- Page 85 and 86: 5.6 KNOWLEDGE AND ATTITUDE CONCERNI
- Page 87 and 88: Table 5.6.2 Knowledge and attitudes
- Page 89 and 90: Table 6.1.1 Accepting attitudes tow
- Page 91 and 92: Stigma is also found to vary with l
- Page 93 and 94: 6.3 ATTITUDES OF ADULTS TOWARDS EDU
- Page 96 and 97: HIV/AIDS-RELATED BEHAVIOUR 77.1 INT
- Page 98 and 99: Table 7.2.1 Recent sexual activity:
- Page 100 and 101:
Figure 7.1 Recent Sexual Intercours
- Page 102 and 103:
Table 7.3.2 Multiple sexual partner
- Page 104 and 105:
Table 7.4 Payment for sexual interc
- Page 106 and 107:
Table 7.5.1 Coverage of prior HIV t
- Page 108 and 109:
Figure 7.2 Prior HIV Testing by Edu
- Page 110 and 111:
7.7 PREVALENCE OF SEXUALLY TRANSMIT
- Page 112 and 113:
Figure 7.3 Prevalence of STIs and S
- Page 114:
Table 7.8 Prevalence of medical inj
- Page 117 and 118:
Table 8.1 Comprehensive knowledge a
- Page 119 and 120:
Table 8.2 Age at first sexual inter
- Page 121 and 122:
Never-married women and men age 15-
- Page 123 and 124:
Figure 8.3 Condom Use at Premarital
- Page 125 and 126:
Table 8.5.2 Higher-risk sexual inte
- Page 127 and 128:
Table 8.6 Age-mixing in sexual rela
- Page 129 and 130:
8.9 HIV TESTING AMONG YOUNG PEOPLEK
- Page 132 and 133:
HIV PREVALENCE 99.1 INTRODUCTIONPri
- Page 134 and 135:
Table 9.1 Coverage of HIV testing b
- Page 136 and 137:
Table 9.1—ContinuedBackgroundchar
- Page 138 and 139:
Table 9.3 HIV prevalence by ageAmon
- Page 140 and 141:
There are large variations in HIV p
- Page 142 and 143:
Table 9.5 shows that men who are cu
- Page 144 and 145:
Women who said they had higher-risk
- Page 146 and 147:
Table 9.8 shows data on HIV prevale
- Page 148 and 149:
Table 9.11 HIV prevalence by male c
- Page 150 and 151:
INFANT AND CHILD MORTALITY 1010.1 I
- Page 152 and 153:
As expected, the level of infant an
- Page 154:
category (1.41) is 41 percent highe
- Page 157 and 158:
11.1 OWNERSHIP AND USE OF MOSQUITO
- Page 159 and 160:
carrying mosquitoes. Much of the fi
- Page 161 and 162:
11.2 USE OF ANTIMALARIAL DRUGS DURI
- Page 163 and 164:
11.3 TREATMENT OF CHILDREN WITH FEV
- Page 165 and 166:
11.4.1 Type and Timing of Antimalar
- Page 167 and 168:
11.4.2 Availability of Drug at Home
- Page 169 and 170:
11.6 SOURCE OF MOSQUITO NETSUntil l
- Page 171 and 172:
In spite of steady increases in ITN
- Page 174 and 175:
ORPHANS AND VULNERABLE CHILDREN 12P
- Page 176 and 177:
12.2 ORPHANS AND VULNERABLE CHILDRE
- Page 178 and 179:
12.3.1 School Attendance by Survivo
- Page 180 and 181:
While there are no differences in p
- Page 182 and 183:
Table 12.7 Widows dispossessed of p
- Page 184 and 185:
Table 12.9 External support for orp
- Page 186 and 187:
REFERENCESAgot, K.E., J.O. Ndinya-A
- Page 188 and 189:
SAMPLE IMPLEMENTATIONAPPENDIX AAppe
- Page 190 and 191:
Table A.2 Sample implementation: Me
- Page 192 and 193:
Table A.4 Coverage of HIV testing a
- Page 194:
Table A.6 Coverage of HIV testing a
- Page 197 and 198:
where h represents the stratum whic
- Page 199 and 200:
Table B.2 Sampling errors for Natio
- Page 201 and 202:
Table B.4 Sampling errors for Rural
- Page 203 and 204:
Table B.6 Sampling errors for Mainl
- Page 205 and 206:
Table B.8 Sampling errors for Mainl
- Page 207 and 208:
Table B.10 Sampling errors for Zanz
- Page 209 and 210:
Table B.12 Sampling errors for Nort
- Page 211 and 212:
Table B.14 Sampling errors for Sout
- Page 213 and 214:
Table B.16 Sampling errors for East
- Page 215 and 216:
Table B.18 Sampling errors for Dodo
- Page 217 and 218:
Table B.20 Sampling errors for Kili
- Page 219 and 220:
Table B.22 Sampling errors for Moro
- Page 221 and 222:
Table B.24 Sampling errors for Dar
- Page 223 and 224:
Table B.26 Sampling errors for Mtwa
- Page 225 and 226:
Table B.28 Sampling errors for Irin
- Page 227 and 228:
Table B.30 Sampling errors for Sing
- Page 229 and 230:
Table B.32 Sampling errors for Rukw
- Page 231 and 232:
Table B.34 Sampling errors for Shin
- Page 233 and 234:
Table B.36 Sampling errors for Mwan
- Page 235 and 236:
Table B.38 Sampling errors for Many
- Page 237 and 238:
Table B.40 Sampling errors for Pemb
- Page 239 and 240:
216 | Appendix B
- Page 241 and 242:
Joyce MbambaYulitha MwakasoleRemigi
- Page 244:
QUESTIONNAIRESAppendix DAppendix D
- Page 247 and 248:
HOUSEHOLD SCHEDULEIntroduction and
- Page 249 and 250:
IF AGE 0-17 YEARSIF AGE 5 YEARS OR
- Page 251 and 252:
IF AGE 0-17 YEARSLINE SICK CARE SUR
- Page 253 and 254:
HOUSEHOLD CHARACTERISTICSNO. QUESTI
- Page 255 and 256:
NO. QUESTIONS AND FILTERS CODING CA
- Page 257 and 258:
NO. QUESTIONS AND FILTERS CODING CA
- Page 259 and 260:
SUPPORT FOR SICK PEOPLENO. QUESTION
- Page 261 and 262:
NO.QUESTIONS AND FILTERSSUPPORT FOR
- Page 263 and 264:
NO.QUESTIONS AND FILTERSCODING CATE
- Page 265 and 266:
CHILD 4 CHILD 5 CHILD 6502 LINE NUM
- Page 267 and 268:
515 CHECK 509:NUMBER OF CHILDREN WI
- Page 270 and 271:
UNITED REPUBLIC OF TANZANIATANZANIA
- Page 272 and 273:
NO. QUESTIONS AND FILTERS CODING CA
- Page 274 and 275:
NO. QUESTIONS AND FILTERS CODING CA
- Page 276 and 277:
213 214 215 216217 218219 220221222
- Page 278 and 279:
LAST BIRTH NEXT-TO-LAST BIRTH SECON
- Page 280 and 281:
LAST BIRTH NEXT-TO-LAST BIRTH SECON
- Page 282 and 283:
LAST BIRTH NEXT-TO-LAST BIRTH SECON
- Page 284 and 285:
NO. QUESTIONS AND FILTERS CODING CA
- Page 286 and 287:
LASTSEXUAL PARTNERSECOND-TO-LASTSEX
- Page 288 and 289:
NO. QUESTIONS AND FILTERS CODING CA
- Page 290 and 291:
NO. QUESTIONS AND FILTERS CODING CA
- Page 292 and 293:
NO. QUESTIONS AND FILTERS CODING CA
- Page 294 and 295:
NO. QUESTIONS AND FILTERS CODING CA
- Page 296 and 297:
SECTION 7 - HIV TESTTHIS PAGE TO BE


![Obtaining Informed Consent for HIV Testing [QRS4] - Measure DHS](https://img.yumpu.com/49850117/1/190x245/obtaining-informed-consent-for-hiv-testing-qrs4-measure-dhs.jpg?quality=85)


