

Tanzania HIV/AIDS and Malaria Indicator Survey ... - Measure DHS
Tanzania HIV/AIDS and Malaria Indicator Survey ... - Measure DHS
Tanzania HIV/AIDS and Malaria Indicator Survey ... - Measure DHS
- No tags were found...

You also want an ePaper? Increase the reach of your titles
YUMPU automatically turns print PDFs into web optimized ePapers that Google loves.
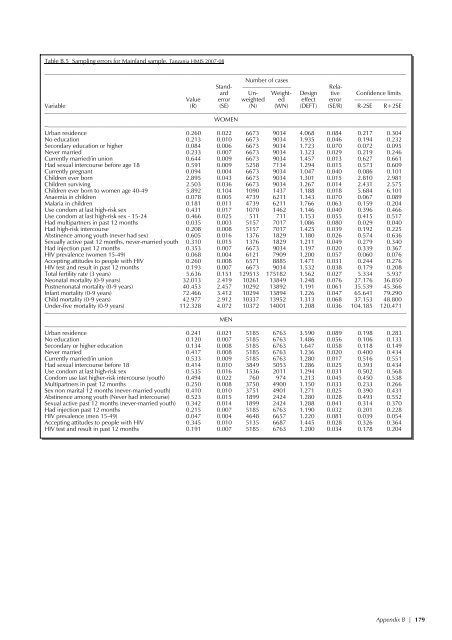
Table B.5 Sampling errors for Mainl<strong>and</strong> sample, <strong>Tanzania</strong> HMIS 2007-08–––––––––––––––––––––––––––––––––––––––––––––––––––––––––––––––––––––––––––––––––––––––––––––––––––––––––––––––––––––––Number of casesSt<strong>and</strong>- –––––––––––––––– RelaardUn- Weight- Design tive Confidence limitsValue error weighted ed effect error ––––––––––––––––Variable (R) (SE) (N) (WN) (DEFT) (SE/R) R-2SE R+2SE–––––––––––––––––––––––––––––––––––––––––––––––––––––––––––––––––––––––––––––––––––––––––––––––––––––––––––––––––––––––WOMEN–––––––––––––––––––––––––––––––––––––––––––––––––––––––––––––––––––––––––––––––––––––––––––––––––––––––––––––––––––––––Urban residence 0.260 0.022 6673 9034 4.068 0.084 0.217 0.304No education 0.213 0.010 6673 9034 1.935 0.046 0.194 0.232Secondary education or higher 0.084 0.006 6673 9034 1.723 0.070 0.072 0.095Never married 0.233 0.007 6673 9034 1.323 0.029 0.219 0.246Currently married/in union 0.644 0.009 6673 9034 1.457 0.013 0.627 0.661Had sexual intercourse before age 18 0.591 0.009 5258 7134 1.294 0.015 0.573 0.609Currently pregnant 0.094 0.004 6673 9034 1.047 0.040 0.086 0.101Children ever born 2.895 0.043 6673 9034 1.301 0.015 2.810 2.981Children surviving 2.503 0.036 6673 9034 1.267 0.014 2.431 2.575Children ever born to women age 40-49 5.892 0.104 1090 1437 1.188 0.018 5.684 6.101Anaemia in children 0.078 0.005 4739 6211 1.343 0.070 0.067 0.089<strong>Malaria</strong> in children 0.181 0.011 4739 6211 1.766 0.063 0.159 0.204Use condom at last high-risk sex 0.431 0.017 1070 1462 1.146 0.040 0.396 0.466Use condom at last high-risk sex - 15-24 0.466 0.025 511 711 1.153 0.055 0.415 0.517Had multipartners in past 12 months 0.035 0.003 5157 7017 1.086 0.080 0.029 0.040Had high-risk intercourse 0.208 0.008 5157 7017 1.425 0.039 0.192 0.225Abstinence among youth (never had sex) 0.605 0.016 1376 1829 1.180 0.026 0.574 0.636Sexually active past 12 months, never-married youth 0.310 0.015 1376 1829 1.211 0.049 0.279 0.340Had injection past 12 months 0.353 0.007 6673 9034 1.197 0.020 0.339 0.367<strong>HIV</strong> prevalence (women 15-49) 0.068 0.004 6121 7909 1.200 0.057 0.060 0.076Accepting attitudes to people with <strong>HIV</strong> 0.260 0.008 6571 8885 1.471 0.031 0.244 0.276<strong>HIV</strong> test <strong>and</strong> result in past 12 months 0.193 0.007 6673 9034 1.532 0.038 0.179 0.208Total fertility rate (3 years) 5.636 0.151 129513 175182 1.562 0.027 5.334 5.937Neonatal mortality (0-9 years) 32.013 2.419 10261 13849 1.248 0.076 27.176 36.850Postnenonatal mortality (0-9 years) 40.453 2.457 10292 13892 1.191 0.061 35.539 45.366Infant mortality (0-9 years) 72.466 3.412 10294 13894 1.226 0.047 65.641 79.290Child mortality (0-9 years) 42.977 2.912 10337 13952 1.313 0.068 37.153 48.800Under-five mortality (0-9 years) 112.328 4.072 10372 14001 1.208 0.036 104.185 120.471–––––––––––––––––––––––––––––––––––––––––––––––––––––––––––––––––––––––––––––––––––––––––––––––––––––––––––––––––––––––MEN–––––––––––––––––––––––––––––––––––––––––––––––––––––––––––––––––––––––––––––––––––––––––––––––––––––––––––––––––––––––Urban residence 0.241 0.021 5185 6763 3.590 0.089 0.198 0.283No education 0.120 0.007 5185 6763 1.486 0.056 0.106 0.133Secondary or higher education 0.134 0.008 5185 6763 1.647 0.058 0.118 0.149Never married 0.417 0.008 5185 6763 1.236 0.020 0.400 0.434Currently married/in union 0.533 0.009 5185 6763 1.280 0.017 0.516 0.551Had sexual intercourse before 18 0.414 0.010 3849 5053 1.286 0.025 0.393 0.434Use condom at last high-risk sex 0.535 0.016 1536 2011 1.294 0.031 0.502 0.568Condom use last higher-risk intercourse (youth) 0.494 0.022 760 974 1.213 0.045 0.450 0.538Multipartners in past 12 months 0.250 0.008 3750 4900 1.150 0.033 0.233 0.266Sex non marital 12 months (never-married youth) 0.410 0.010 3751 4901 1.271 0.025 0.390 0.431Abstinence among youth (Never had intercourse) 0.523 0.015 1899 2424 1.280 0.028 0.493 0.552Sexual active past 12 months (never-married youth) 0.342 0.014 1899 2424 1.288 0.041 0.314 0.370Had injection past 12 months 0.215 0.007 5185 6763 1.190 0.032 0.201 0.228<strong>HIV</strong> prevalence (men 15-49) 0.047 0.004 4648 6657 1.220 0.081 0.039 0.054Accepting attitudes to people with <strong>HIV</strong> 0.345 0.010 5135 6687 1.445 0.028 0.326 0.364<strong>HIV</strong> test <strong>and</strong> result in past 12 months 0.191 0.007 5185 6763 1.200 0.034 0.178 0.204Appendix B | 179


![Obtaining Informed Consent for HIV Testing [QRS4] - Measure DHS](https://img.yumpu.com/49850117/1/190x245/obtaining-informed-consent-for-hiv-testing-qrs4-measure-dhs.jpg?quality=85)


