

Tanzania HIV/AIDS and Malaria Indicator Survey ... - Measure DHS
Tanzania HIV/AIDS and Malaria Indicator Survey ... - Measure DHS
Tanzania HIV/AIDS and Malaria Indicator Survey ... - Measure DHS
- No tags were found...

Create successful ePaper yourself
Turn your PDF publications into a flip-book with our unique Google optimized e-Paper software.
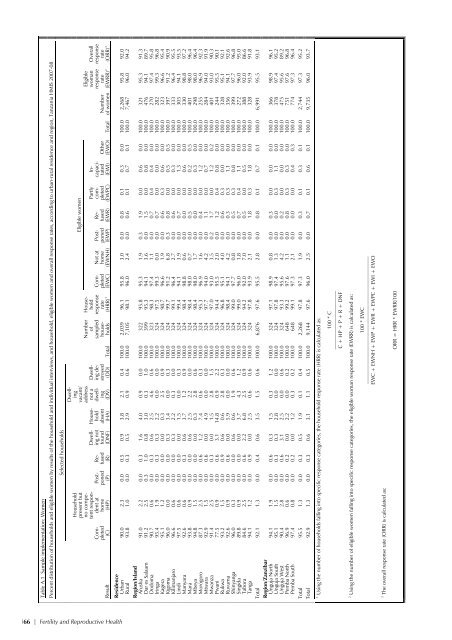
Table A.1 Sample implementation: WomenPercent distribution of households <strong>and</strong> eligible women by results of the household <strong>and</strong> individual interviews, <strong>and</strong> household, eligible women <strong>and</strong> overall response rates, according to urban-rural residence <strong>and</strong> region, <strong>Tanzania</strong> HMIS 2007-08ResultCompleted(C)Householdpresent butno competentrespondentathome(HP)Postponed(P)Selected householdsRefused(R)Dwellingnotfound(DNF)Householdabsent(HA)Dwellingvacant/addressnot adwelling(DV)NumberDwellingde-sampledofstroyedhouseholds(DD) TotalHouseholdresponserate(HRR) 1 Completed(EWC)Not athome(EWNH)Postponed(EWP)Eligible womenRefused(EWR)Partlycompleted(EWPC)Incapacitated(EWI)OtherNumber(EWO) Total of womenEligiblewomanresponserateresponserate(ORR) 3(EWRR) 2 OverallResidenceUrban 90.0 2.3 0.0 0.5 0.9 3.8 2.1 0.4 100.0 2,039 96.1 95.8 3.0 0.0 0.8 0.1 0.3 0.0 100.0 2,268 95.8 92.0Rural 93.8 1.0 0.0 0.3 0.5 2.9 0.9 0.6 100.0 7,105 98.1 96.0 2.4 0.0 0.6 0.1 0.7 0.1 100.0 7,467 96.0 94.2Region/Isl<strong>and</strong>Arusha 91.0 2.2 0.0 0.3 1.6 4.0 0.9 0.0 100.0 322 95.8 95.3 1.9 0.3 1.9 0.0 0.6 0.0 100.0 321 95.3 91.3Dar es Salaam 91.2 2.5 0.3 1.0 0.8 3.0 0.3 1.0 100.0 399 95.3 94.1 3.6 0.0 1.5 0.0 0.8 0.0 100.0 476 94.1 89.7Dodoma 90.7 0.6 0.0 0.3 0.6 2.5 4.6 0.6 100.0 323 98.3 97.4 1.1 0.0 0.7 0.4 0.4 0.0 100.0 270 97.4 95.8Iringa 95.4 1.9 0.0 0.3 0.3 2.2 0.0 0.0 100.0 324 97.5 99.3 0.0 0.0 0.7 0.0 0.0 0.0 100.0 282 99.3 96.8Kagera 95.1 1.2 0.0 0.0 0.0 0.3 2.5 0.9 100.0 324 98.7 96.6 1.9 0.0 0.6 0.3 0.6 0.0 100.0 323 96.6 95.4Kigoma 96.0 0.0 0.0 0.0 0.3 3.4 0.0 0.3 100.0 324 99.7 91.2 6.8 0.3 0.8 0.0 0.5 0.5 100.0 397 91.2 90.9Kilimanjaro 96.6 0.6 0.0 0.0 0.3 2.2 0.3 0.0 100.0 324 99.1 96.4 2.7 0.0 0.6 0.0 0.3 0.0 100.0 333 96.4 95.5Lindi 97.5 0.6 0.0 0.0 0.0 1.5 0.0 0.3 100.0 324 99.4 94.1 3.9 0.0 0.7 0.0 1.3 0.0 100.0 305 94.1 93.5Manyara 92.6 0.6 0.0 0.3 0.6 3.7 1.2 0.9 100.0 324 98.4 98.8 0.6 0.0 0.0 0.0 0.6 0.0 100.0 330 98.8 97.2Mara 93.8 0.9 0.0 0.0 0.6 2.5 2.2 0.0 100.0 324 98.4 98.0 0.7 0.0 0.5 0.0 0.2 0.5 100.0 401 98.0 96.4Mbeya 94.8 1.5 0.0 0.0 0.0 0.3 2.8 0.6 100.0 324 98.4 98.0 1.7 0.0 0.0 0.0 0.3 0.0 100.0 298 98.0 96.4Morogoro 87.3 2.5 0.0 0.6 1.2 7.4 0.6 0.3 100.0 324 95.3 96.9 1.6 0.0 0.4 0.0 1.2 0.0 100.0 255 96.9 92.3Mtwara 92.9 1.5 0.0 0.6 0.0 4.9 0.0 0.0 100.0 324 97.7 94.0 4.2 0.0 1.1 0.0 0.7 0.0 100.0 284 94.0 91.9Mwanza 91.4 2.5 0.0 0.3 0.0 1.5 2.8 1.5 100.0 324 97.0 93.0 3.5 0.2 1.7 0.0 1.2 0.2 100.0 401 93.0 90.3Pwani 77.5 0.9 0.0 0.6 3.1 14.8 0.9 2.2 100.0 324 94.4 95.5 2.0 0.0 1.2 0.4 0.8 0.0 100.0 244 95.5 90.1Rukwa 93.2 1.5 0.0 0.9 0.6 0.6 2.8 0.3 100.0 324 96.8 95.1 4.0 0.0 0.6 0.3 0.0 0.0 100.0 328 95.1 92.1Ruvuma 92.6 0.9 0.0 0.6 0.0 5.9 0.0 0.0 100.0 324 98.4 94.1 4.2 0.0 0.3 0.3 1.1 0.0 100.0 356 94.1 92.6Shinyanga 96.0 0.3 0.0 0.0 0.6 0.6 1.9 0.6 100.0 324 99.0 97.7 0.8 0.0 0.5 0.3 0.8 0.0 100.0 399 97.7 96.8Singida 89.8 0.9 0.0 0.0 0.0 3.7 4.3 1.2 100.0 324 99.0 96.0 1.8 0.0 0.7 0.4 1.1 0.0 100.0 272 96.0 95.0Tabora 84.6 2.5 0.0 0.6 2.2 6.8 2.5 0.9 100.0 324 94.2 92.0 7.0 0.0 0.5 0.0 0.5 0.0 100.0 388 92.0 86.6Tanga 94.1 1.2 0.0 0.9 0.0 2.5 0.6 0.6 100.0 324 97.8 93.9 2.1 0.0 1.8 0.3 1.8 0.0 100.0 328 93.9 91.8Total 92.1 1.3 0.0 0.4 0.6 3.5 1.5 0.6 100.0 6,876 97.6 95.5 2.8 0.0 0.8 0.1 0.7 0.1 100.0 6,991 95.5 93.1Region/ZanzibarUnguja North 94.1 1.9 0.0 0.6 0.3 1.5 0.3 1.2 100.0 324 97.1 98.9 0.8 0.0 0.3 0.0 0.0 0.0 100.0 366 98.9 96.1Unguja South 95.1 1.5 0.0 0.3 0.3 2.8 0.0 0.0 100.0 324 97.8 97.4 1.3 0.0 0.0 0.3 1.1 0.0 100.0 378 97.4 95.2Unguja West 90.4 2.8 0.0 0.6 3.1 2.5 0.0 0.6 100.0 324 93.3 95.6 4.2 0.0 0.2 0.0 0.0 0.0 100.0 475 95.6 89.2Pemba North 96.9 0.6 0.0 0.2 0.0 2.2 0.0 0.2 100.0 648 99.2 97.6 1.1 0.0 0.8 0.3 0.3 0.0 100.0 751 97.6 96.8Pemba South 97.4 0.8 0.0 0.2 0.0 1.2 0.3 0.2 100.0 648 99.1 97.3 2.1 0.0 0.0 0.0 0.4 0.3 100.0 774 97.3 96.4Total 95.5 1.3 0.0 0.3 0.5 1.9 0.1 0.4 100.0 2,268 97.8 97.3 1.9 0.0 0.3 0.1 0.3 0.1 100.0 2,744 97.3 95.2Total 92.9 1.3 0.0 0.3 0.6 3.1 1.1 0.5 100.0 9,144 97.6 96.0 2.5 0.0 0.7 0.1 0.6 0.1 100.0 9,735 96.0 93.7Using the number of households falling into specific response categories, the household response rate (HRR) is calculated as:1100 * C———————————C + HP + P + R + DNFUsing the number of eligible women falling into specific response categories, the eligible woman response rate (EWRR) is calculated as:2100 * EWC————————————————————————EWC + EWNH + EWP + EWR + EWPC + EWI + EWOThe overall response rate (ORR) is calculated as:3ORR = HRR * EWRR/100166 | Fertility <strong>and</strong> Reproductive Health


![Obtaining Informed Consent for HIV Testing [QRS4] - Measure DHS](https://img.yumpu.com/49850117/1/190x245/obtaining-informed-consent-for-hiv-testing-qrs4-measure-dhs.jpg?quality=85)


