

Tanzania HIV/AIDS and Malaria Indicator Survey ... - Measure DHS
Tanzania HIV/AIDS and Malaria Indicator Survey ... - Measure DHS
Tanzania HIV/AIDS and Malaria Indicator Survey ... - Measure DHS
- No tags were found...

Create successful ePaper yourself
Turn your PDF publications into a flip-book with our unique Google optimized e-Paper software.
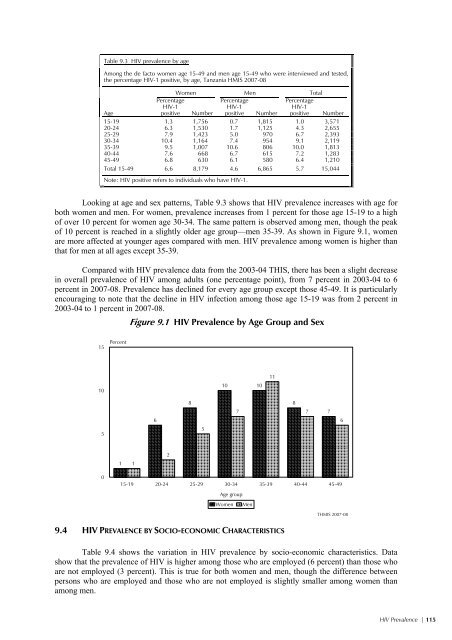
Table 9.3 <strong>HIV</strong> prevalence by ageAmong the de facto women age 15-49 <strong>and</strong> men age 15-49 who were interviewed <strong>and</strong> tested,the percentage <strong>HIV</strong>-1 positive, by age, <strong>Tanzania</strong> HMIS 2007-08Women Men TotalPercentage<strong>HIV</strong>-1Percentage<strong>HIV</strong>-1Percentage<strong>HIV</strong>-1Agepositive Number positive Number positive Number15-19 1.3 1,756 0.7 1,815 1.0 3,57120-24 6.3 1,530 1.7 1,125 4.3 2,65525-29 7.9 1,423 5.0 970 6.7 2,39330-34 10.4 1,164 7.4 954 9.1 2,11935-39 9.5 1,007 10.6 806 10.0 1,81340-44 7.6 668 6.7 615 7.2 1,28345-49 6.8 630 6.1 580 6.4 1,210Total 15-49 6.6 8,179 4.6 6,865 5.7 15,044Note: <strong>HIV</strong> positive refers to individuals who have <strong>HIV</strong>-1.Looking at age <strong>and</strong> sex patterns, Table 9.3 shows that <strong>HIV</strong> prevalence increases with age forboth women <strong>and</strong> men. For women, prevalence increases from 1 percent for those age 15-19 to a highof over 10 percent for women age 30-34. The same pattern is observed among men, though the peakof 10 percent is reached in a slightly older age group—men 35-39. As shown in Figure 9.1, womenare more affected at younger ages compared with men. <strong>HIV</strong> prevalence among women is higher thanthat for men at all ages except 35-39.Compared with <strong>HIV</strong> prevalence data from the 2003-04 THIS, there has been a slight decreasein overall prevalence of <strong>HIV</strong> among adults (one percentage point), from 7 percent in 2003-04 to 6percent in 2007-08. Prevalence has declined for every age group except those 45-49. It is particularlyencouraging to note that the decline in <strong>HIV</strong> infection among those age 15-19 was from 2 percent in2003-04 to 1 percent in 2007-08.Figure 9.1 <strong>HIV</strong> Prevalence by Age Group <strong>and</strong> Sex15 Percent Women Men1010 1011568578776112015-19 20-24 25-29 30-34 35-39 40-44 45-49Age groupTHMIS 2007-089.4 <strong>HIV</strong> PREVALENCE BY SOCIO-ECONOMIC CHARACTERISTICSTable 9.4 shows the variation in <strong>HIV</strong> prevalence by socio-economic characteristics. Datashow that the prevalence of <strong>HIV</strong> is higher among those who are employed (6 percent) than those whoare not employed (3 percent). This is true for both women <strong>and</strong> men, though the difference betweenpersons who are employed <strong>and</strong> those who are not employed is slightly smaller among women thanamong men.<strong>HIV</strong> Prevalence | 115


![Obtaining Informed Consent for HIV Testing [QRS4] - Measure DHS](https://img.yumpu.com/49850117/1/190x245/obtaining-informed-consent-for-hiv-testing-qrs4-measure-dhs.jpg?quality=85)


