

Tanzania HIV/AIDS and Malaria Indicator Survey ... - Measure DHS
Tanzania HIV/AIDS and Malaria Indicator Survey ... - Measure DHS
Tanzania HIV/AIDS and Malaria Indicator Survey ... - Measure DHS
- No tags were found...

You also want an ePaper? Increase the reach of your titles
YUMPU automatically turns print PDFs into web optimized ePapers that Google loves.
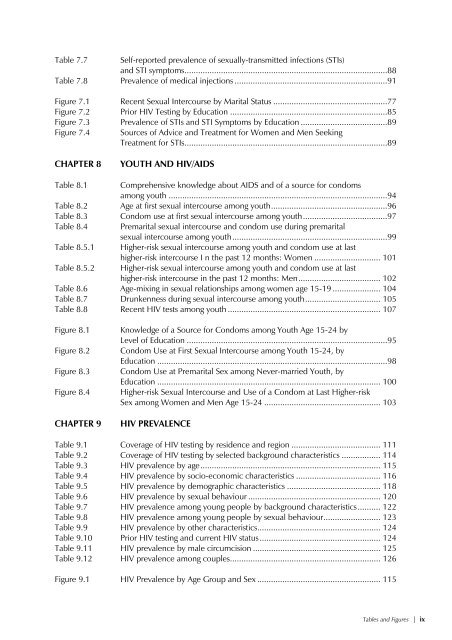
Table 7.7 Self-reported prevalence of sexually-transmitted infections (STIs)<strong>and</strong> STI symptoms.........................................................................................88Table 7.8 Prevalence of medical injections ...................................................................91Figure 7.1 Recent Sexual Intercourse by Marital Status ..................................................77Figure 7.2 Prior <strong>HIV</strong> Testing by Education .....................................................................85Figure 7.3 Prevalence of STIs <strong>and</strong> STI Symptoms by Education ......................................89Figure 7.4 Sources of Advice <strong>and</strong> Treatment for Women <strong>and</strong> Men SeekingTreatment for STIs.........................................................................................89CHAPTER 8YOUTH AND <strong>HIV</strong>/<strong>AIDS</strong>Table 8.1Table 8.2Table 8.3Table 8.4Table 8.5.1Table 8.5.2Comprehensive knowledge about <strong>AIDS</strong> <strong>and</strong> of a source for condomsamong youth ................................................................................................94Age at first sexual intercourse among youth...................................................96Condom use at first sexual intercourse among youth.....................................97Premarital sexual intercourse <strong>and</strong> condom use during premaritalsexual intercourse among youth....................................................................99Higher-risk sexual intercourse among youth <strong>and</strong> condom use at lasthigher-risk intercourse I n the past 12 months: Women ............................. 101Higher-risk sexual intercourse among youth <strong>and</strong> condom use at lasthigher-risk intercourse in the past 12 months: Men.................................... 102Table 8.6 Age-mixing in sexual relationships among women age 15-19 ..................... 104Table 8.7 Drunkenness during sexual intercourse among youth................................. 105Table 8.8 Recent <strong>HIV</strong> tests among youth ................................................................... 107Figure 8.1Figure 8.2Figure 8.3Figure 8.4CHAPTER 9Knowledge of a Source for Condoms among Youth Age 15-24 byLevel of Education ........................................................................................95Condom Use at First Sexual Intercourse among Youth 15-24, byEducation .....................................................................................................98Condom Use at Premarital Sex among Never-married Youth, byEducation .................................................................................................. 100Higher-risk Sexual Intercourse <strong>and</strong> Use of a Condom at Last Higher-riskSex among Women <strong>and</strong> Men Age 15-24 ................................................... 103<strong>HIV</strong> PREVALENCETable 9.1 Coverage of <strong>HIV</strong> testing by residence <strong>and</strong> region ....................................... 111Table 9.2 Coverage of <strong>HIV</strong> testing by selected background characteristics ................. 114Table 9.3 <strong>HIV</strong> prevalence by age............................................................................... 115Table 9.4 <strong>HIV</strong> prevalence by socio-economic characteristics ..................................... 116Table 9.5 <strong>HIV</strong> prevalence by demographic characteristics ......................................... 118Table 9.6 <strong>HIV</strong> prevalence by sexual behaviour .......................................................... 120Table 9.7 <strong>HIV</strong> prevalence among young people by background characteristics.......... 122Table 9.8 <strong>HIV</strong> prevalence among young people by sexual behaviour......................... 123Table 9.9 <strong>HIV</strong> prevalence by other characteristics...................................................... 124Table 9.10 Prior <strong>HIV</strong> testing <strong>and</strong> current <strong>HIV</strong> status..................................................... 124Table 9.11 <strong>HIV</strong> prevalence by male circumcision ........................................................ 125Table 9.12 <strong>HIV</strong> prevalence among couples.................................................................. 126Figure 9.1 <strong>HIV</strong> Prevalence by Age Group <strong>and</strong> Sex ...................................................... 115Tables <strong>and</strong> Figures | ix


![Obtaining Informed Consent for HIV Testing [QRS4] - Measure DHS](https://img.yumpu.com/49850117/1/190x245/obtaining-informed-consent-for-hiv-testing-qrs4-measure-dhs.jpg?quality=85)


