Source - Brookfield Asset Management
Source - Brookfield Asset Management
Source - Brookfield Asset Management
You also want an ePaper? Increase the reach of your titles
YUMPU automatically turns print PDFs into web optimized ePapers that Google loves.
Cautionary Note Regarding Forward-Looking StatementsThis presentation contains “forward-looking information” within the meaning of Canadian provincial securities laws and “forward-looking statements” within themeaning of Section 27A of the U.S. Securities Act of 1933, as amended, Section 21E of the U.S. Securities Exchange Act of 1934, as amended, “safe harbor”provisions of the United States Private Securities Litigation Reform Act of 1995 and in any applicable Canadian securities regulations. Forward-lookingstatements include statements that are predictive in nature, depend upon or refer to future events or conditions, include statements regarding g the operations,business, financial condition, expected financial results, performance, prospects, opportunities, priorities, targets, goals, ongoing objectives, strategies andoutlook of <strong>Brookfield</strong> and its subsidiaries, as well as the outlook for North American and international economies for the current fiscal year and subsequentperiods, and include words such as “expects,” “anticipates,” “plans,” “believes,” “estimates,” “seeks,” “intends,” “targets,” “projects,” “forecasts” or negativeversions thereof and other similar expressions, or future or conditional verbs such as “may,” “will,” “should,” “would” and “could.”Although we believe that our anticipated future results, performance or achievements expressed or implied by the forward-looking statements and information arebased upon reasonable assumptions and expectations, the reader should not place undue reliance on forward-looking statements and information because theyinvolve known and unknown risks, uncertainties i and other factors, many of which h are beyond our control, which h may cause the actual results, performance orachievements of <strong>Brookfield</strong> to differ materially from anticipated future results, performance or achievement expressed or implied by such forward-lookingstatements and information.Factors that could cause actual results to differ materially from those contemplated or implied by forward-looking statements include, but are not limited to: theimpact or unanticipated impact of general economic, political and market factors in the countries in which we do business; the behavior of financial markets,including fluctuations in interest and foreign exchanges rate; global equity and capital markets and the availability of equity and debt financing and refinancingwithin these markets; strategic actions including dispositions; the ability to complete and effectively integrate acquisitions into existing operations and the ability toattain expected benefits; changes in accounting policies and methods used to report financial condition (including uncertainties associated with critical accountingassumptions and estimates); the effect of applying future accounting changes; business competition; operational and reputational risks; technological change;changes in government regulation and legislation within the countries in which we operate; changes in tax laws, catastrophic events, such as earthquakes andhurricanes; the possible impact of international conflicts and other developments including terrorist acts; and other risks and factors detailed from time to time inour documents filed with the securities regulators in Canada and the United States.We caution that the foregoing list of important factors that may affect future results is not exhaustive. When relying on our forward-looking statements, investorsand others should carefully consider the foregoing factors and other uncertainties and potential events. Except as required by law, <strong>Brookfield</strong> undertakes noobligation to publicly update or revise any forward-looking statements or information, whether written or oral, that may be as a result of new information, futureevents or otherwise.”CurrencyAll dollar figures are in U.S. dollars, unless otherwise indicated..2| <strong>Brookfield</strong> <strong>Asset</strong> <strong>Management</strong> Inc.
Today’s Agenda• Overview Bruce Flatt• Our 10-Year Plan Brian Lawson• Property Ric Clark• Infrastructure Sam Pollock• Renewable Power Sachin Shah• Private Equity Cyrus Madon• Conclusion Bruce Flatt3| <strong>Brookfield</strong> <strong>Asset</strong> <strong>Management</strong> Inc.
OverviewBruce Flatt
We are an asset manager focused onhigh quality “real assets”We have four businesses: (i) property (ii) renewable power(iii) infrastructure and (iv) private equityOur operations include 100 offices across the globe with500 investment professionals and 23,000 operating employeesOur objective: to earn 12%-15% compound annual growth in theunderlying value of our business on a per share basisThe intrinsic value of the business based on IFRS valuations is$42 per share5| <strong>Brookfield</strong> <strong>Asset</strong> <strong>Management</strong> Inc.
We are one of the largest managers of real assetsTotal assets managed by us exceed $150 billionWe operate:27 private funds with committed capital of $27 billion3 listed funds with total market capitalization of $26 billion6| <strong>Brookfield</strong> <strong>Asset</strong> <strong>Management</strong> Inc.
And, we are global…….so we can invest where we find valueCanada$23 billion AUMUK, Western Europe &Middle East$5 billion AUMAsia & Australasia$17 billion AUMUnited States$96 billion AUMSouth America$17 billion AUM7| <strong>Brookfield</strong> <strong>Asset</strong> <strong>Management</strong> Inc.
But, our business model is simple<strong>Source</strong> equity from clients who are seeking exposure toproperty, renewable power, infrastructure and privateequity returnsUtilize our global reach to identify andacquire high quality real assets on a value basisFinance them on a long-term, low risk basisEnhance the cash flows and value of these assetsthrough our leading operating platforms8| <strong>Brookfield</strong> <strong>Asset</strong> <strong>Management</strong> Inc.
And, we differentiate ourselves asowner-operators ofreal assets9| <strong>Brookfield</strong> <strong>Asset</strong> <strong>Management</strong> Inc.
80 million sq. ft. of office propertiesWorld Financial Center, New York10| <strong>Brookfield</strong> <strong>Asset</strong> <strong>Management</strong> Inc.
165 million sq. ft.of retail mallsAla Moana, Honolulu11| <strong>Brookfield</strong> <strong>Asset</strong> <strong>Management</strong> Inc.
170 hydroelectric power plantsGartshore, Ontario12| <strong>Brookfield</strong> <strong>Asset</strong> <strong>Management</strong> Inc.
7 wind farmsPrince Wind Farm, Ontario13| <strong>Brookfield</strong> <strong>Asset</strong> <strong>Management</strong> Inc.
The largest metallurgical coal terminal in the worldDalrymple Bay Coal Terminal,Australia14| <strong>Brookfield</strong> <strong>Asset</strong> <strong>Management</strong> Inc.
And ports, rail, toll roads and transmission lines<strong>Brookfield</strong> Rail,Australia15| <strong>Brookfield</strong> <strong>Asset</strong> <strong>Management</strong> Inc.
as well as 3 million acres of timberlandsLongview Timberlands,Oregon16| <strong>Brookfield</strong> <strong>Asset</strong> <strong>Management</strong> Inc.
These high quality real assets are in demandby investors as they seek yield.....They offer favourable long-term, risk adjusted returnsgenerating cash and capital returns,with lower volatility,and inflation hedge attributes17| <strong>Brookfield</strong> <strong>Asset</strong> <strong>Management</strong> Inc.
So, we believe anotherglobal l transformationtiof capital is underway18| <strong>Brookfield</strong> <strong>Asset</strong> <strong>Management</strong> Inc.
1970s and 80s were a fixed income era10%EquitiesFixed Income 90%19| <strong>Brookfield</strong> <strong>Asset</strong> <strong>Management</strong> Inc.
During the 1990s, equities took over30%EquitiesFixed Income 70%20| <strong>Brookfield</strong> <strong>Asset</strong> <strong>Management</strong> Inc.
In the 2000s alternatives started to emerge35%EquitiesFixed Income 50%5%10%AlternativesReal Estate21| <strong>Brookfield</strong> <strong>Asset</strong> <strong>Management</strong> Inc.
Today, real assets are taking holdFixed Income 40%35%EquitiesInfrastructure10%5%10%Real EstateAlternatives22| <strong>Brookfield</strong> <strong>Asset</strong> <strong>Management</strong> Inc.
In the 2020s we expect 30% to 50% of allocations to bereal assetsFixed Income20%20%Equities10%AlternativesInfrastructure& Other30%20%Real Estate23| <strong>Brookfield</strong> <strong>Asset</strong> <strong>Management</strong> Inc.
Furthermore, the total amount ofinvestable assets is growing exponentially1970s$ 5 Trillion2000s$ 30 Trillion2012 $ 45 Trillion2020s$ 70 Trillion24| <strong>Brookfield</strong> <strong>Asset</strong> <strong>Management</strong> Inc.
Which means, close to$15 trillion of new moneywill flow to real assets…………25| <strong>Brookfield</strong> <strong>Asset</strong> <strong>Management</strong> Inc.
Why?7% - 15%8%2%BondYieldsEquityYieldsReal <strong>Asset</strong>Yields26| <strong>Brookfield</strong> <strong>Asset</strong> <strong>Management</strong> Inc.
And, because interest rates are zero andsolid risk adjusted yields can be earned in these assets10 YearTreasury2000 2012(Today)27| <strong>Brookfield</strong> <strong>Asset</strong> <strong>Management</strong> Inc.
But, as important, governments need funding;so the supply of assets will be available……..28| <strong>Brookfield</strong> <strong>Asset</strong> <strong>Management</strong> Inc.
And we are now set up with a structuredesigned d to deliver cash flow and growthto both public market and institutional investors<strong>Brookfield</strong><strong>Asset</strong> <strong>Management</strong>~30% ~70% ~90% 100%FLAGSHIPLISTEDFUNDS<strong>Brookfield</strong><strong>Brookfield</strong><strong>Brookfield</strong><strong>Brookfield</strong>Renewable EnergyInfrastructure Partners Property Partners Capital Partners Partners1PRIVATEINSTITUTIONALFUNDS<strong>Brookfield</strong>Infrastructure Funds<strong>Brookfield</strong>Property Funds<strong>Brookfield</strong>Private Equity Funds1) Privately held29| <strong>Brookfield</strong> <strong>Asset</strong> <strong>Management</strong> Inc.
And with excellent historical returns,we should be able to continue to growPrivate FundsCommitted/Pledged d Capital 2 Vintage Gross IRR 13 ($ billions)Core Plus & Value Add $ 15 2003 – 2012 13%Opportunistic 12 2001 – 2012 27%Flagship Listed FundsInfrastructure (BIP) $ 7 2008 21%Renewable Energy (BREP) 4 8 1998 17%Property (BPY) 4 11 1991 16%1) Reflects performance from initial investment date to June 30, 2012 for private funds, and September 30, 2012 for flagship listed funds2) Includes client and <strong>Brookfield</strong> capital as of June 30, 2012 for private funds and represents market capitalization for the flagship listed funds3) Reflects the internal rate of return before fund expenses, management fees and carried interests for private funds and the compound annual growth rate for flagship listed funds.Prior performance is not indicative of future results and there can be no assurance that we will achieve comparable results or be able to avoid losses4) Reflects performance of underlying assets from the later of 1998, 1991 or acquisition for BREP and BPY, respectively30| <strong>Brookfield</strong> <strong>Asset</strong> <strong>Management</strong> Inc.
Which should allow each of our funds to grow, and allow us toexpand our fee bearing equity capital to over $100 billionand total AUM to over $200 billionManaged ManagedListedPrivate($ billions) Equity Equity TotalProperty $ 25 $ 20 $ 45Infrastructure t 20 15 35Renewables 20 5 25Private Equity ‒ 10 10$ 65 $ 50 $ 11531| <strong>Brookfield</strong> <strong>Asset</strong> <strong>Management</strong> Inc.
So, whatever the world brings us on the economic front,we should be able to respond…….32| <strong>Brookfield</strong> <strong>Asset</strong> <strong>Management</strong> Inc.
Our 10-Year PlanBrian Lawson
We have a tremendous opportunity tosubstantially increase cash flows and shareholder valuesHistorically, increases in cash flows and values were driven mostly byinvestment and operating activitiesWe have the potential to also generate growth through the assetmanagement component of our businessIntrinsic Value Per Share2012 2022 IRRGeneral partner $ 7 $ 45 26%Invested capital 33 85 11%$ 40 $ 130 13%Notes/Assumptions1) Proforma for spin-off of <strong>Brookfield</strong> Property Partners34| <strong>Brookfield</strong> <strong>Asset</strong> <strong>Management</strong> Inc.
Our business plan is anchored by a relativelysmall number of straight-forward assumptionsOur listed fund capital increases in line with target distribution growthand issuance of equity to fund growthWe achieve target fundraising goals for private funds with current marketfee economicsCapital is invested and we achieve target returnsThere is no major reallocation of invested capital35| <strong>Brookfield</strong> <strong>Asset</strong> <strong>Management</strong> Inc.
Over 10 years our fee bearing capital grows to$115 billion and total AUM to the mid $200s$115B$70B$45B2012 2017 2022Private FundsListed FundsCAGR 10%Notes/Assumptions1) Private fund capital includes commitments from third parties and excludes <strong>Brookfield</strong> direct and indirect ownership2) Listed entities capital equals total market capitalization, including <strong>Brookfield</strong> ownership3) Proforma for launch of <strong>Brookfield</strong> Property Partners36| <strong>Brookfield</strong> <strong>Asset</strong> <strong>Management</strong> Inc.
Our intrinsic values correspondingly grow to$130 per share with 35% related to the GP(per share) $130$75GP$40GPICGPICIC2012 2017 2022General PartnerInvested CapitalCAGR 13%Notes/Assumptions1) 2012 per June 30, 2012 interim report, proforma for spin-off of <strong>Brookfield</strong> Property Partners2) CAGR reflects dividends at current rate37| <strong>Brookfield</strong> <strong>Asset</strong> <strong>Management</strong> Inc.
This is backed by 3-fold growth in FFO to $5.9 billion$5.9B$3.2BGP$1.7BGPICGPICIC2012 2017 2022General PartnerInvested CapitalCAGR 13%Notes/Assumptions1) GP FFO includes 100% of fee revenues for listed funds, fees associated with third party capital only for private funds and includes carriedinterests and associated direct costs on an “accrual” basis consistent with <strong>Brookfield</strong>’s MD&A disclosure and based on target yields2) 2012: LTM ended June 30, 2012 for invested capital FFO and annualized as at September 30, 2012 for general partner FFO38| <strong>Brookfield</strong> <strong>Asset</strong> <strong>Management</strong> Inc.
The market capitalization of our listed funds increaseswith growth in cash flows and equity issuance$65B$40B$26BBIPBREPBPY2012 2017 2022Notes/Assumptions1) Midpoint target distribution growth: BPY – 4%; BREP - 4%; BIP – 5%2) Equity issuances: $500 million each year per entity to 2017; $750 million each year per entity thereafter3) Constant distribution yield4) Includes target initial capitalization for BPY of $10.8 billion39| <strong>Brookfield</strong> <strong>Asset</strong> <strong>Management</strong> Inc.
The increase in market capitalization of listed fundsdrives commensurate increases in base fees…ListedMarketAnnualFunds Capitalization tiFees2012 $26B$165M2017 $40B$340M2022 $65B$650MCAGR 15%Notes/Assumptions1) <strong>Brookfield</strong> earns base management fees equal to an initial amount plus 125 bps on any increases in market capitalization40| <strong>Brookfield</strong> <strong>Asset</strong> <strong>Management</strong> Inc.
Plus…we receive a participation in distribution increases(IDRs) as we successfully grow these listed funds –fully aligning us with all shareholdersIDRs$16M $80M $270MDistributionss2012 2017 2022Distribution growthIDRs paid to <strong>Brookfield</strong>Notes/Assumptions1) <strong>Brookfield</strong> receives a 15% participation in distributions above an initial threshold and 25% beyond a secondthreshold, determined on a per share basis2) Assumes dividend growth at mid-point of target distribution growth rates41| <strong>Brookfield</strong> <strong>Asset</strong> <strong>Management</strong> Inc.
We have tremendous momentumwith our private fund capital raising activities with atarget of $50 billion of client capital at work by 2022$50B$17.5B$30B2012 2017 2022Notes/Assumptions1) Reflects an approximate 11% growth rate2) This is roughly equivalent to $4 billion new commitments per annum raised to 2017; $6 billion per annumthereafter, and distributions of capital based on expected investment horizon42| <strong>Brookfield</strong> <strong>Asset</strong> <strong>Management</strong> Inc.
The increase in private fund capital to $50 billion drives a6-fold increase in the associated base feesPrivate FundCapital Annual Fees 12012 $17.5B$130M2017 $30B$400M2022 $50B$750MCAGR 19%Notes/Assumptions1) 2012 reflects annualized fees based on current capital commitments and fee arrangements2) Target weighted average fee of 135 bps by 2017 and 150 bps by 202243| <strong>Brookfield</strong> <strong>Asset</strong> <strong>Management</strong> Inc.
Plus…we are entitled to a profit interest in our private funds(“carried interest”) – typically ranging from 10% to 20%Fee BearingCapitalAnnualizedCarry2012 $17.5B$350M2017 $30B$600M2022 $50B$1,000MCAGR 11%Notes/Assumptions1) Reflects the weighted average target gross return, carried interest and investment period and equates to200 bps of capital based on target mix of fund strategies2) 2012 reflects annualized revenues based on proforma fund capital and 200 bps yield44| <strong>Brookfield</strong> <strong>Asset</strong> <strong>Management</strong> Inc.
Pulling it all together… th45| <strong>Brookfield</strong> <strong>Asset</strong> <strong>Management</strong> Inc.
The FFO from our General Partner activitiesshould triple to more than $1.5 billion annually($ millions) Current 2017 2022Base fees- Listed $ 165 $ 340 $ 650- Private 130 400 750IDRs 15 80 270Carried interest 350 600 1,000Revenues $ 660 $ 1,420 $ 2,670FFO $ 410 $ 870 $1,670CAGR 15%Notes/Assumptions1) See preceding slides for revenue assumptions2) Assumes gross margin in 2017 and 2022 of 50% for base fees and 70% for carried interests3) Current assumes annualized fees based on proforma capital and target returns46| <strong>Brookfield</strong> <strong>Asset</strong> <strong>Management</strong> Inc.
Which should drive a 6-fold increase in the valueof our GP activities to $30 billion$30B$15B$4.8B2012 2017 2022CAGR 25% 20%Base fees, net of G&A (20x)IDRs (20x)Carried interests, net of direct G&A (10x)Accrued carry, net (1x)47| <strong>Brookfield</strong> <strong>Asset</strong> <strong>Management</strong> Inc.
We have substantial capital invested alongside our clients,that is also working for you($ billions) 2012LP CapitalListed funds $18Private equity 220Direct investments 9Leverage e (8)LP CapitalNet invested capital $ 21Listed fundsPrivate equityOtherDirect investments48| <strong>Brookfield</strong> <strong>Asset</strong> <strong>Management</strong> Inc.
…which grows to $55 billion when compounded at 11%,a rate that we have exceeded significantly in the past2012 2017 2022$21B $35B $55BLP CapitalListed fundsPrivate equityOtherDirect investmentsCAGR 11%Notes/Assumptions1) CAGR includes dividends paid at current annualized rate of $0.56 per share49| <strong>Brookfield</strong> <strong>Asset</strong> <strong>Management</strong> Inc.
Over time we will generate asubstantial amount of “non-strategic” capital2012 2017 2022$21B $35B $55BCore LP Capital Non-strategicListed @ 25% "Excess" listed$22B$38BPrivate equityDirectNotes/Assumptions1) “Core” LP listed capital assumed to be 25% of equity capitalization of listed entities“Non-strategic”capital50| <strong>Brookfield</strong> <strong>Asset</strong> <strong>Management</strong> Inc.
We are very focused on maintainingalignment of interests with all of our stakeholdersThe most important point in our business plan is investment success anddelivery of solid returns for our clientsThe alignment of interests with our clients, shareholders and throughoutthe organization is critical to our success<strong>Management</strong> continues to own 20% of <strong>Brookfield</strong> and we have substantialownership of each of our fundsWhile the fees we generate are important – the LP capital is even moreimportant51| <strong>Brookfield</strong> <strong>Asset</strong> <strong>Management</strong> Inc.
Our asset management arrangementsstrengthen this alignment of interestsIn our listed funds, we are rewarded for growing cash flows enablingincreasing distributions to unitholders– Distribution growth should lead to value appreciation and, in turn,increased base fees– IDRs provide us with a direct incentive to grow cash flows anddistributionsIn our private funds, the largest component of our compensation, andtherefore most of our margin, is derived from carried interests, and istherefore entirely performance basedFinally, we have invested meaningful capital in our funds, and sub-parreturns will offset the benefit of any fee revenues52| <strong>Brookfield</strong> <strong>Asset</strong> <strong>Management</strong> Inc.
Keys To SuccessMeet or exceed target investment returnsClear communication of return expectationsWell defined investment strategies and clear mandates for each entityReputation and integrity53| <strong>Brookfield</strong> <strong>Asset</strong> <strong>Management</strong> Inc.
ConclusionWe have the opportunity to create substantial shareholder valuethrough investment returns and GP activitiesOur success will be predicated on our ability to raise capital andinvest wiselyExcess capital will provide tremendous flexibility and opportunities tofurther increase valuesThis gives us great confidence going forward54| <strong>Brookfield</strong> <strong>Asset</strong> <strong>Management</strong> Inc.
Q & A
<strong>Brookfield</strong> Property GroupRic Clark
Agenda• Overview• Investment Performance• Investment Environment and Recent Initiatives• Growth Plans• Priorities and Conclusion57| <strong>Brookfield</strong> <strong>Asset</strong> <strong>Management</strong> Inc.
OverviewGlobal l property asset manager focused on high h quality commercial real estatetGlobal InvestorProperty <strong>Asset</strong>sPerformance$86B AUM ~ 550 assets14.9% gross IRR 1~ 300M sq. ft.1) Gross return since 1989. Past performance is not indicative of future results, and there can beno assurance that comparable future results will be achieved. Any expenses, managementfees and carried interest applicable to any funds will reduce an investor’s returns58| <strong>Brookfield</strong> <strong>Asset</strong> <strong>Management</strong> Inc.
Overview30 Offices | 240 Real Estate t Professionals | 15,000 Employees in BPG and Service BusinessesCANADA• $7.9 billion RE AUM• 44 RE Professionals• 2,350 RE EmployeesUK & EUROPE• $1.8 billion RE AUM• 34 RE Professionals• 2,390 RE EmployeesAUSTRALIA• $9.0 billion RE AUM• 30 RE Professionals• 1,605 RE EmployeesUNITED STATES• $65.5 billion RE AUM• 108 RE Professionals• 3,545 RE EmployeesBRAZIL• $2.2 billion RE AUM• 27 RE Professionals• 5,045 RE Employees59| <strong>Brookfield</strong> <strong>Asset</strong> <strong>Management</strong> Inc.
OverviewDifferentiators t that t have led to our success• Prudent investment approach• Alignment of interests• Value-add operating platforms60| <strong>Brookfield</strong> <strong>Asset</strong> <strong>Management</strong> Inc.
OverviewOur platforms source opportunities, underwrite investments,tidentify and reduce risk and drive performanceBROOKFIELD PROPERTY GROUP+$86 billion AUMOFFICERETAILMULTIFAMILY &INDUSTRIALOPPORTUNITY$36 billion AUM$38 billion AUM$6 billion AUM$6 billion AUM128 properties84 million sq. ft.185 properties165 million sq. ft.47,000 multifamily units7 million sq. ft. industrial11 million sq. ft. officeand other assetsPRIVATE FUNDS61| <strong>Brookfield</strong> <strong>Asset</strong> <strong>Management</strong> Inc.
Investment Performance
Investment Performance12% CAGR2012$86B AUM1989$6B AUMInitiatedDistressedInvestingLaunchedReal EstateFund PlatformLaunchedCanadianOffice FundLaunchedBrazil Retailand U.S.Office fundsEstablishedAustralianReal EstatePlatformLaunchedReal EstateTurnaroundFund toCapitalize onGlobalDistressInitiatedLaunch ofFlagshipListedPropertyEntityRecapitalizedOlympia &York$615 millionReal EstateFinanceFund I$600 millionAcquiredO&YProperties /O&Y REIT$894 millionAcquiredTrizecProperties$2.2 billionAcquiredMultiplex$4.1 billionRecapitalizedGeneralGrowthProperties$2.8 billion<strong>Brookfield</strong>PropertyPartners$10.8 billion19892004 2005 2006 2007 2009 201263| <strong>Brookfield</strong> <strong>Asset</strong> <strong>Management</strong> Inc.
Investment PerformanceOne of the world’s largest and most successful real estate t asset managers• Largest Global Real Estate Investment Manager by AUM – Property Funds Research2012• Top Real Estate Investment Manager by AUM – IREIRanked #1 “Global Real Estate <strong>Asset</strong>s Under <strong>Management</strong>”Ranked #1 “North American Real Estate <strong>Asset</strong>s Under <strong>Management</strong>”Ranked #1 “Australasian Real Estate <strong>Asset</strong>s Under <strong>Management</strong>”• Top Consistent Performing Real Estate Manager – Preqin2010• Global and North American Deal of the Year (General Growth Properties) – PERE• Top Consistent Performing Real Estate Manager – Preqin2009• Global Firm of the Year – PERE• Global Fundraise of the Year – (Real Estate Turnaround Investment Program) PERE64| <strong>Brookfield</strong> <strong>Asset</strong> <strong>Management</strong> Inc.
Investment Performance 1FLAGSHIP LISTED FUNDS• $17.3 billion of equity invested since 1989 2• 15.4% gross IRROPPORTUNISTIC REAL ESTATEINVESTMENTS• $9 billion of equity invested since 1987• 20.1% gross IRR and 2.6x gross multiple of capital (“MOC”)MOC)PRIVATE REAL ESTATE FUNDS • $10 billion of equity invested since 2004• 17.6% gross IRR and 1.6x gross MOC– Core-plus and value add funds • $5 billion of equity invested in 4 funds since 2004• 12.5% gross IRR and 1.6x gross MOC– Opportunistic funds • $5 billion of equity invested in 4 strategies since 2006• 28.2% gross IRR and 1.7x gross MOC1) With respect to all gross IRRs and MOCs provided herein, past performance is not indicative of future results, and there can be noassurance that comparable future results will be achieved. Any expenses, management fees and carried interest applicable to anyfunds will reduce an investor’s returns2) Returns through December 31, 201165| <strong>Brookfield</strong> <strong>Asset</strong> <strong>Management</strong> Inc.
Investment PerformanceUnparalleled l alignment of interest t ensures true investment t partnership approach$18$16$14$12$10$8$6$4$2(in billio ons)$0CAPITAL COMMITTEDCumulative Fund Raising Since 2004($ billions)$2$3$3$7$3$8$4$9$5$112008 2009 2010 2011 Q2 2012PRIVATE REAL ESTATE INVESTOR BASE>50 Number of LP fund investors$11 B Client capital committed to private funds~50%~75%Clients > $50 million invested in multipleprivate fundsClients > $200 million invested in multipleprivate funds<strong>Brookfield</strong>Third Party66| <strong>Brookfield</strong> <strong>Asset</strong> <strong>Management</strong> Inc.
Investment Performance($ billions) 2004 2012E 1<strong>Asset</strong>s under management $ 20.6 $ 86.3Equity invested 2.7 19.5Fee-bearing capital 2 0.4 23.6Liquidity 3 0.4 3.8($ millions) 2004 2012E 1Base annualized fees $ 6 $ 114Cumulative third party performance fees 4 – 443Total fees and carry $ 6 $ 5871) Represents actual figures for first half 2012 and <strong>Brookfield</strong> estimates for second half of 20122) Third party committed capital and market capitalization of publicly listed funds3) Includes private funds and BPY4) Includes realized and cumulative unrealized performance fees67| <strong>Brookfield</strong> <strong>Asset</strong> <strong>Management</strong> Inc.
Investment Environment andRecent Initiatives
Investment EnvironmentCANADA• Commodities-based economy• Sound financial institutions• Development and selectacquisition opportunitiesUK & EUROPE• Government balance sheets stretched• Banking system in severe de-leveraging cycle• Large NPL’s and looming debt maturities• Slowing real estate fundamentalsUNITED STATES• Fundamentals improvingat uneven pace• Lending improving buttargeted• Many 2005-20072007transactions requirerecapitalizationBRAZIL• Growth slowing but temporary• Interest rates have declined• Growth of middle classfuelling consumer andhousing demand• Opportunities emerge whenforeign capital retreatsAUSTRALIA• Commodities-based economy• Sound financial institutions• Foreign financial institutions movingcollateralized loans• Locals concerned about slowing growth69| <strong>Brookfield</strong> <strong>Asset</strong> <strong>Management</strong> Inc.
Recent InitiativesOFFICE• $830 million Hammerson London office portfolio• $1 billion Thakral Holdings – a diversified ifi d Australianlisted real estate companyRETAIL• $200 million Rouse Properties rights backstop• $570 million U.S. acquisitions through affiliatesMULTIFAMILY• $440 million U.S. apartment portfolio• $250 million value-add acquisitions in the U.S.INDUSTRIAL• $845 million merger agreement in the U.S. with Verde• $210 million value-add acquisitions in the U.S.70| <strong>Brookfield</strong> <strong>Asset</strong> <strong>Management</strong> Inc.
Growth Plans
Growth Plans• Expand fee-bearing AUM and equity invested by targeted accretive investments throughprivate fund offerings and listed funds• $3.5 billion equity raised for private real estate programs in the last 12 months. Continue toraise capital for various investment initiatives• $10.8 billion launch of <strong>Brookfield</strong> Property Partners (“BPY”)72| <strong>Brookfield</strong> <strong>Asset</strong> <strong>Management</strong> Inc.
Growth PlansRaised over $15 billion in private funds to fuel growth alongside listed funds<strong>Brookfield</strong> Property GroupFlagship Listed FundPrivate Investment ProgramsEntity<strong>Brookfield</strong>Property PartnersMarketCap (M)Focus1) Represents estimates once launched at IFRS values$10,800 Global commercial propertiesStrategyCommittedCapital (M)FocusCanadian Office C$1,040 OfficeUS U.S. Office 2220 2,220 Office$10,800 1 U.S. Industrial Value-Add 410 IndustrialU.S. Multifamily Value-Add 320 MultifamilyBrazil Retail 990 RetailOpportunistic – NA N.A. 500 Multi-sector– Global 8,040 Multi-sectorReal Estate Finance 1,800 Mezzanine debt~$15,30073| <strong>Brookfield</strong> <strong>Asset</strong> <strong>Management</strong> Inc.
Growth Plans<strong>Brookfield</strong> is spinning-off i its commercial real estate t assets into<strong>Brookfield</strong> Property Partners (BPY)• A leading global owner, operator and investor in high quality commercial property• Publicly traded limited partnership, to be listed on the NYSE and TSX• Managed by <strong>Brookfield</strong>• Interest aligned with Manager74| <strong>Brookfield</strong> <strong>Asset</strong> <strong>Management</strong> Inc.
Growth Plans<strong>Brookfield</strong> Property Partners’ mandate:• Invest for value in quality real estate assets in the world’s most resilient and attractive markets• Generate long-term, predictable, sustainable cash flows• Provide investors with an attractive ti dividend id d yield• Grow through acquisitions and low risk development75| <strong>Brookfield</strong> <strong>Asset</strong> <strong>Management</strong> Inc.
Growth Plans<strong>Brookfield</strong> Property Partners is targeting ti attractive ti risk-adjusted d total t returnsDistribution:~ 4% Initial YieldDistributionGrowth Target:3% - 5%Payout Ratio:80% of FFOTargetAnnualized TotalReturn:12%+76| <strong>Brookfield</strong> <strong>Asset</strong> <strong>Management</strong> Inc.
Growth Plans<strong>Brookfield</strong> Property Partners benefits from its relationship with <strong>Brookfield</strong>• Successful track record launching high growth flagship companies– <strong>Brookfield</strong> Infrastructure Partners (2008)– <strong>Brookfield</strong> Renewable Energy Partners (2011)• Supportive sponsor– Comprehensive suite of services to BPY– Property and corporate teams source, underwrite and execute transactions involvingseveral asset types and varying complexity• Strong alignment of interestst– Significant ownership stake– <strong>Management</strong> fees and incentive distributions tied to capitalization and distribution growth• Corporate governance– Independent boards with majority of independent directors– Conflicts committees review transactions77| <strong>Brookfield</strong> <strong>Asset</strong> <strong>Management</strong> Inc.
Priorities and Conclusion
Priorities• Complete listing of BPY and distribution to <strong>Brookfield</strong> shareholders to generate efficientcapital structure for continued growth• Continue to raise private capital for various investment initiatives• Harvest capital from mature or under-performing investments within BPY and existing funds,recycling capital into accretive and higher growth opportunities• Grow fee-bearing assets under management79| <strong>Brookfield</strong> <strong>Asset</strong> <strong>Management</strong> Inc.
Conclusion• Real estate investment landscape remains compelling, particularly in the U.S. and Europe• Bank sponsored and other real estate funds remain in restructuring mode, leading to shallowcompetition• Dearth of new construction over last two decades coupled with low interest rate environmentshould lead to sharp valuation increases once a sustained recovery takes hold• Launching <strong>Brookfield</strong> Property Partners, coupled with our suite of private funds, will provideabundant and efficient capital sources from which to capitalize on global opportunities80| <strong>Brookfield</strong> <strong>Asset</strong> <strong>Management</strong> Inc.
Q & A
Infrastructure GroupSam Pollock
Agenda• Overview• Investment Funds• Recent Accomplishments• Investment Environment• Financial Profile• Priorities83| <strong>Brookfield</strong> <strong>Asset</strong> <strong>Management</strong> Inc.
Leading Global Infrastructure <strong>Asset</strong> Manager11 Offices | Over 100 Corporate Professionals | Over 6,000 Operating EmployeesNORTH AMERICA EUROPE$6 billion AUM $2 billion AUMElectric Utilities~9,000 km oftransmission linesTransportation30 ports, 3,200 kmof toll roads and5,100 km of railEnergyOver 15,000 km ofpipelines ppTimberSOUTH AMERICA$6 billion AUMAUSTRALASIA$6 billion AUM2.6 million acres84| <strong>Brookfield</strong> <strong>Asset</strong> <strong>Management</strong> Inc.
<strong>Brookfield</strong> Infrastructure <strong>Asset</strong> Manager – At A Glance($ billions, except fees) 2010 2011 2012E 1Status / Profile:<strong>Asset</strong>s under management $ 15.7 $ 18.8 $ 22.1Fee-bearing capital 2 8.2 10.7 12.4Dry powder 3.4 3.6 2.1Fees 110M 172M 197M($ billions) 2010 2011 2012E 1Activity:itCapital raised during year $ 2.1 $ 0.8 $ 0.7Market value increases 0.3 1.2 1.6Capital deployed/committed 3 1.3 0.4 1.21) Represents actual figures for first half 2012 and <strong>Brookfield</strong> estimates2) Committed third party private fund capital and 100% of the market capitalization of publicly listed funds3) Includes capital invested and committed to transactions that are expected to close by end of year85| <strong>Brookfield</strong> <strong>Asset</strong> <strong>Management</strong> Inc.
<strong>Brookfield</strong> Infrastructure – Investment FundsPublic and private funds total over $14 billion of capital,including <strong>Brookfield</strong>’s commitment<strong>Brookfield</strong> Infrastructure GroupFund NamePublic FundsMarketCap(millions)Comments<strong>Brookfield</strong> ~$7,000 • Listed on NYSE andInfrastructureTSXPartners L.P.• Diversified infrastructureAcadianTimber Corp.~$7,200200 • Listed on TSX• East coast timberFund NamePrivate FundsCommittedCapital(millions)FocusFully Invested Funds $3,300 • Transmission• TimberAmericasInfrastructure2,655 • RegionalPeru/Colombia 840 • RegionalInfrastructureTimber Funds 200 • Global~$7,00086| <strong>Brookfield</strong> <strong>Asset</strong> <strong>Management</strong> Inc.
<strong>Brookfield</strong> Infrastructure PartnersGenerated total t returns to investors of over 45% since September 2009$40STOCK PRICE PERFORMANCEUNIT PERFORMANCE BENCHMARKS$35$30ListedonNYSE$660m equity offering/Australian Railexpansion1-Year 3-YearBIP (NYSE) 39% 47%BIP (TSX) 47% 41%S&P 500 5% 28%$25$20BBIacquisition$500m equityoffering/SouthAmerican tollroad acquisitionDJB Infrastructure Index 8% 20%<strong>Source</strong>: Bloomberg; includes reinvestment of distributions$15$10$5$0Listed onTSXMerger with PrimeInfrastructureINVESTMENT HIGHLIGHTS• High quality core infrastructureassets• Stable cash flows• Solid distribution with growth• Organic growth projects and M&A87| <strong>Brookfield</strong> <strong>Asset</strong> <strong>Management</strong> Inc.
<strong>Brookfield</strong> Americas Infrastructure Fund• $2.7 billion in commitments• Closed in September 2010, now 88% deployed• 10 investments totaling ~$2.3 billion• Generated gross IRR of 24% as of June 30, 2012 1,2INVESTMENTS BY GEOGRAPHYINVESTMENTS BY SECTORAvailable CapitalNorth America12%Europe &Australasia 4 7% Energy46%Available Capital13%12%Renewable Power31%South America35%Utilities15%29%Transportation1) Past performance is not indicative of future results, and there can be no assurance that comparable future results will be achieved. Any expenses,management fees and carried interest applicable to the Fund will reduce an investor’s returns2) Unrealized investments included in returns are at fair value as determined in good faith88| <strong>Brookfield</strong> <strong>Asset</strong> <strong>Management</strong> Inc.
Timber Funds<strong>Brookfield</strong>’s timberlands funds have achieved a gross IRR of 7.8% 1• One of the largest global timberland investors and fund managers• Invested $3.5 billion through 11 timber transactionsIsland Timberlands Longview Timber Brazil Timber Fund Acadian Timber<strong>Asset</strong>s635,000 acresof freehold timberlandsin coastalBritish Columbia651,000 acresof freehold timberlandsin U.S. PacificNorthwest240,000 acresof freehold timberlandin Brazil1.1m acresof freehold timberlandsin New Brunswickand MaineAUM/Market Cap $1 billion $3 billion ~$500 million $200 millionGross IRR 1 8.0% 6.5% 15.5% 10.6%1) Performance is on a composite basis. There can be no assurance that the Funds will achieve comparable results or be able to avoidlosses. Any expenses, management fees and carried interest applicable to the Funds will reduce an investor’s returns89| <strong>Brookfield</strong> <strong>Asset</strong> <strong>Management</strong> Inc.
Recent AccomplishmentsFor 2012, we expect to execute over $3 billion of transactionstiElectricUtilities• $440 million – Colombian regulated distribution utility• $750 million – 550 km Texas electricity transmission system under construction• ~$465 million – UK regulated distribution business (Q4)Transportation• $850 million investment in portfolio of ~3,200 km of S.A. toll roads (Q4)• A$600 million – Australian rail expansion project on time and on budgetEnergy• 90% of an Alberta natural gas storage facility• ~$480 million – district heating and cooling company serving Toronto CBD (Q4)Timberlands• 5,000 acres of eucalyptus plantations in Mato Grosso do Sul state, Brazil90| <strong>Brookfield</strong> <strong>Asset</strong> <strong>Management</strong> Inc.
Global Investment Environment for InfrastructureIt remains a compelling time to invest in the infrastructure t sector• Significant opportunities to deploy capital at good valuesEXAMPLE• Deleveraging of European construction companiesBrazilToll RoadSector• Government privatization – global phenomena • Only 8% of Brazilianhighway concessionshave been granted to• Commodities pullback driving cash strapped companiesprivate sectorto search for liquidity to complete projects• Auctioning of federalmotorway concessionsannounced• Access to private and public fund capital is strong91| <strong>Brookfield</strong> <strong>Asset</strong> <strong>Management</strong> Inc.
<strong>Brookfield</strong> Invested Capital – Infrastructure<strong>Brookfield</strong> intends to invest in infrastructure t through h its listed funds• <strong>Brookfield</strong> Infrastructure will acquire interest in a directly held transmission asset in 2013 1• <strong>Brookfield</strong> will continue to invest in timber strategies albeit at lower participation levels– Legacy direct investments intended to be reduced over time in keeping with assetmanagement philosophy($ millions) Market Value June 2012 Ownership %Public<strong>Brookfield</strong> Infrastructure Partners $ 2,000 $ 1,715 2 28%Acadian 90 68 45%Private / Direct2,090 1,783 –Transmission 235 10%Timber 722 12.5-38%1) Subject to satisfaction of certain closing conditions and final approvals2) Includes a further $145 million investment in <strong>Brookfield</strong> Infrastructure in August 2012$ 2,740 –92| <strong>Brookfield</strong> <strong>Asset</strong> <strong>Management</strong> Inc.
Financial Performance• <strong>Brookfield</strong> Infrastructure’s GP revenues have grown at a four-year CAGR of ~80%• Strong investment performance will meaningfully increase incentive distributions andperformance fees($ millions) 2008A 2009A 2010A 2011A 2012E 1Base <strong>Management</strong> Fees<strong>Brookfield</strong> Infrastructure Partners $ 7 $ 10 $ 28 $ 53 $ 85Private funds 12 15 37 43 4419 25 65 96 129Performance IncomeIncentive distributions – – – 4 16Realized/unrealized performance fees – 4 38 48 48Transaction and advisory fees – 11 7 24 4– 15 45 76 68Total Revenues $ 19 $ 40 $ 110 $ 172 $ 1971) Represents actual figures for first half of 2012 and <strong>Brookfield</strong> estimates93| <strong>Brookfield</strong> <strong>Asset</strong> <strong>Management</strong> Inc.
Priorities• Completing near-term investment initiatives– Close pending acquisitions– Bring Texas electricity transmission system andrail expansions on line• Continue to raise capital with a mandate of globalinfrastructure investments• Recycle capital from direct investments into flagship funds94| <strong>Brookfield</strong> <strong>Asset</strong> <strong>Management</strong> Inc.
Conclusion• Significant opportunities to deploy capital at attractive values• Substantial interest in infrastructure products from public and private investors• Success over last five years makes us a leading infrastructure t manager• Strong performance will drive substantial incentive distributions and performance fees in future95| <strong>Brookfield</strong> <strong>Asset</strong> <strong>Management</strong> Inc.
Q & A
Renewable PowerSachin Shah
Agenda• Overview and Investment Strategy• Recent Accomplishments and Challenges• Investment Performance• Priorities98| <strong>Brookfield</strong> <strong>Asset</strong> <strong>Management</strong> Inc.
Overview and Strategy
A Leading Renewable Power <strong>Asset</strong> Manager$18B<strong>Asset</strong>s Under<strong>Management</strong>140Hydro <strong>Asset</strong>sAdded inLast 10 Years17% IRRGross ReturnOver 12 Years100 | <strong>Brookfield</strong> <strong>Asset</strong> <strong>Management</strong> Inc.
<strong>Brookfield</strong> Renewable Energy Group($ billions, except fees) 2010 2011 2012E 1<strong>Asset</strong>s under management $ 15.8 $ 17.7 $ 17.9Invested capital 7.5 8.0 7.7Fee-bearing capital- Listed fund 2.1 7.0 7.6- Private fund 0.5 0.5 0.5Available liquidity 0.4 0.5 1.0Fees 2 n/a 20 M 30 M1) 2012 amounts are as at June 30, 20122) Fees are presented on an annualized basis for our listed funds101 | <strong>Brookfield</strong> <strong>Asset</strong> <strong>Management</strong> Inc.
<strong>Asset</strong> Manager with Global Reach• Access to <strong>Brookfield</strong>’s global investment and asset managementplatforms• Senior management team with strong value focus and trackrecord• 30 investment professionals in renewable power with M&A andproject development capabilities• Key expertise to drive value of renewable portfolio– Operations– Marketing– Financing / funding102 | <strong>Brookfield</strong> <strong>Asset</strong> <strong>Management</strong> Inc.
Track Record of GrowthProven track record of accretive expansion through acquisition,partnership and organic growthLaunch of<strong>Brookfield</strong>RenewableEnergy PartnersLaunch of GreatLakes HydroIncome FundSignificant growthin the U.S. andexpansion intoBrazilDiversification intonew technologies:- Pumped storage-WindMerger of CanadianoperationsCalifornia andwestern U.S.expansion1999 2001-2004 2005-2010 2011-20121) Approximate market cap of GLHIF at IPO and <strong>Brookfield</strong> Renewable at September 27, 2012103| <strong>Brookfield</strong> <strong>Asset</strong> <strong>Management</strong> Inc.
<strong>Asset</strong> <strong>Management</strong> StrategyOur objective is to deliver gross returns of 12-15% 15%for investors in our managed funds• Deploy capital into our core markets and technologies– Base management fees and IDRs annually of $100 million– Grow the underlying value of our listed fund to over $50 per share– Invest in new markets or renewable technologies• Execute organic growth initiatives– High value projects– Contracting initiatives• Enhance funding and access to capital– Increase participation in private funds to 50%– Investment grade financing104 | <strong>Brookfield</strong> <strong>Asset</strong> <strong>Management</strong> Inc.
Accomplishments and Challenges
2012 Accomplishments• Launched BREP, simplifying our holdings in the power sector and advancing the overall assetmanagement strategy• Continued to progress $1.3 billion of key development projects• Deployed over $1 billion to acquire hydro and wind assets in our core markets, leveraging ourworld-class platforms• Increased underlying value of our portfolio through investment, funding and operating expertise• Progressed key capital markets initiatives– Raised over $3 billion in public and private transactions– Lowered cost of capital by 50 bps106 | <strong>Brookfield</strong> <strong>Asset</strong> <strong>Management</strong> Inc.
Challenges for 2013• Markets will continue to be over-supplied• Renewable programs may experience short-term pressure• Cost escalation with high levels of infrastructure construction activity in Latin America• Legislative/regulatory challenges• Significant supply margins and shale gas prices are pushing prices to cyclical lows107 | <strong>Brookfield</strong> <strong>Asset</strong> <strong>Management</strong> Inc.
Investment Performance
Recent TransactionsIn the last two years we have allocated over $2 billion of capital to therenewable power sector and grown our installed capacity by 25%• Developed or acquired 500 MW of wind facilities in North America– Pursued high value wind regions (California, Ontario)– Constructed 350 MW of wind below budget and on time, leveraging developmentexpertise• Added (or building) approximately 500 MW of hydro facilities in North America and Brazil– Acquired 380 MW hydro portfolio in southeast United States– Underwritten based on current low price environment with significant upside to futurerising energy prices– Continuing to construct 100 MW of projects in Brazil and Canada• Investments will generate $15 - $20 million of fees annually for <strong>Brookfield</strong>109 | <strong>Brookfield</strong> <strong>Asset</strong> <strong>Management</strong> Inc.
Historical Investment PerformanceGeographicCapital UnderGrossFocus AUM <strong>Management</strong> Vintage IRR 1($ billions) ($ billions)Listed FundsFund I – BRPF(BRC.UN)Canada $ 5 $ 2.1 1999 – 2011 16%Fund II – BREP Global 16 7.6 2011 – present 26%(BEP.UN)Direct HoldingsU.S. and Brazil Americas $ 11 $ 4.0 2001 – 2011 26%1) Past performance is not indicative of future results, and there can be no assurance that comparable future results will be achieved.Any expenses, management fees and carried interest applicable to the Funds will reduce an investor’s returns110 | <strong>Brookfield</strong> <strong>Asset</strong> <strong>Management</strong> Inc.
Priorities Over The Next Five Years
Priorities – Next 5 YearsBusiness PrioritiesLook for large scale opportunities todeploy capital and take advantage ofcurrent low price environment and/ordistress in EuropeUnlock $6 to $8 of value per BREP sharethrough h organic growth initiativesiti Re-contract PPA maturities andmerchant exposures at accretivepricesPull $400 - $600 million of capital fromassets through refinancing activities anddeploy on an accretive basisMaintain our investment grade, nonrecoursefinancing strategy and ourcredit ratingsImpact on <strong>Brookfield</strong>Double AUM and increase basemanagement fees and IDRs by over$100 million annuallyIncrease the value of <strong>Brookfield</strong>’sholdings in its power investments t by$1 - $1.5 billionSecure long term value on 5 TWh ofperpetual contracts for <strong>Brookfield</strong>Continue to attract new sources of capitaland finance investments efficientlyManage underlying businesses on a lowrisk basis112| <strong>Brookfield</strong> <strong>Asset</strong> <strong>Management</strong> Inc.
Q & A
Private Equity GroupCyrus Madon
Private Equity Group• Private Equity Group Overview• Investment Strategy• Portfolio Companies• Opportunity for Growth115 | <strong>Brookfield</strong> <strong>Asset</strong> <strong>Management</strong> Inc.
Overview<strong>Brookfield</strong>’s Private Equity Group focuses on value investing• Opportunistic approach• Distress investing with an objective to control or influence• Private equity investments in industries where wehave expertise• History of sourcing great transactions throughoutmarket cycles and conditions• Strong operational skills are a significant differentiatorfrom other managers• Distress capabilities are proven over decades116 | <strong>Brookfield</strong> <strong>Asset</strong> <strong>Management</strong> Inc.
Capital Under <strong>Management</strong>• $7.3 billion in assets under management– $3.2 billion of private equity and debt funds– $4.1 billion of investments owned directly• Over time a greater proportion of assets under management will be held through h funds• $2.4 billion of capital has been raised across three private equity funds since inception of thefirst fund in 2001– <strong>Brookfield</strong> represented 50% of the total commitments in Fund I and 27.5% in Fund III• Capital raised from the first two funds is fully deployed; Fund III capital is over 15% deployed117 | <strong>Brookfield</strong> <strong>Asset</strong> <strong>Management</strong> Inc.
Team Growth Over TimeThe Private Equity Group has a dedicated di d and growing investment t teamwith extensive experience• Senior team, including investment committee,has an average 24 years of experienceNUMBER OFINVESTMENT PROFESSIONALS• Investment professionals in offices in Canada,U.S., UK and Brazil• Dedicated operations team is highlyexperienced in operational value-add andturnarounds• Deep operating bench across <strong>Brookfield</strong>businesses351362001 2006 2012118 | <strong>Brookfield</strong> <strong>Asset</strong> <strong>Management</strong> Inc.
Investment Performance$1.7 billion invested in North America through h three private equity funds since 2001• Fund returns are expected to improve as portfolio matures• No realized losses to dateREALIZED/SUBSTANTIALLY REALIZED INVESTMENTS 19 investmentsALL FUND INVESTMENTS20 investments1.7x$2.8B2.4x$1.7B$1.7B$0.7BCapital InvestedTotal ValueCapital InvestedTotal Value1) Includes all fully realized investments and investments which havebeen substantially monetized119| <strong>Brookfield</strong> <strong>Asset</strong> <strong>Management</strong> Inc.
Investment Performance<strong>Brookfield</strong> Private Equity Group has generated consistently tl strong results• 24.3% gross IRR 1 across these funds over 11 years• Net outperformance of 13.6% versus the S&P 500PRIVATE EQUITY RETURNS SINCE INCEPTION24.3%17.1%3.5%<strong>Brookfield</strong> PE <strong>Brookfield</strong> PE S&P 500Funds (Gross)1Funds (Net)1) Past performance is not indicative of future results, and there can be no assurance that comparable future results will be achieved.Any expenses, management fees and carried interest applicable to the Funds will reduce an investor’s returns120| <strong>Brookfield</strong> <strong>Asset</strong> <strong>Management</strong> Inc.
Investment StrategyProven approach to investing• Invest at discounts to intrinsic value• Pursue investments using multiple strategies to mitigate general market timing risk• Acquire great assets that need operational repositioning or represent a platform opportunity• Focus on industry sectors we know so we can invest with confidence• Pursue complex situations• Seek returns that do not require revenue growth• Focus on downside protection121 | <strong>Brookfield</strong> <strong>Asset</strong> <strong>Management</strong> Inc.
Sourcing – Deals Reviewed<strong>Brookfield</strong>’s deal sourcing capability is a distinct t advantage in identifying i opportunities• Pro-active approach to sourcing/screening• During the last 12 months the Private Equity Groupreviewed 40 transactions across various industries• Three of these became investments and severalothers are being pursued• Long-standing relationships with restructuringprofessionals such as investment bankers, lawyers,accountants and lenders• Distress debt knowledge provides anotherdifferentiated approach• <strong>Brookfield</strong> leverages its global platforms;500 investment professionals world-wide<strong>Brookfield</strong>Proprietary88%SOURCINGBanking/AdvisorRelationships12%INDUSTRY BREAKDOWNManufacturing3%16%ForestProducts16%BuildingMaterialsMetals / Mining18%11% 31%5%Oil and GasOtherPower122| <strong>Brookfield</strong> <strong>Asset</strong> <strong>Management</strong> Inc.
Steps We Take to Create ValueAd dedicated di doperations team is critical lto our success• Active involvement with portfolio companies to change strategies, enhance management depthand improve margins• Reposition products away from lower margin pure commodities to value-added products withless cyclical end markets• Diversify customer base and expand into international markets• Surface value by monetizing non-core assets and actively enhancing working capitalmanagement• Implement low risk capital structures, particularly in distress situations where companies areunderperforming123 | <strong>Brookfield</strong> <strong>Asset</strong> <strong>Management</strong> Inc.
Portfolio Companies124 | <strong>Brookfield</strong> <strong>Asset</strong> <strong>Management</strong> Inc.
Overview of Current Portfolio and Progress26 Companies~$8 billion in aggregateannual revenue~13,000 employees~ 10 industries• We have driven EBITDA improvements in each of our portfolio companies• All portfolio companies are low cost producers or have exceptional market positions• All companies are highly attractive industry targets125 | <strong>Brookfield</strong> <strong>Asset</strong> <strong>Management</strong> Inc.
Overview of Current Portfolio and Progress• Market positioning and expansion– Western Forest Products has significantly expanded product shipments to Asia– Ainsworth has developed new products being tested today in China– MAAX Bath has substantially repositioned its product portfolio and approach to market• New products now represent 21% of its revenue and YTD sales are up 12% yearover year– Hammerstone is moving beyond its start-up phase and increasing its order book• Platform acquisitions– Ember Resources has acquired 45 BCF of coal-bed methane assets which will createsynergies through reduced operating costs– Our global relocation business acquired Prudential Realty with anticipated annualsynergies of $50 million– CWC Well Services acquired 22 additional service rigs in 2011, now the 6th largestservice rig provider in Canada126 | <strong>Brookfield</strong> <strong>Asset</strong> <strong>Management</strong> Inc.
Opportunity for Growth
Favourable Conditions for Private Equity and DistressEquity market valuations are reasonable while debt yields are volatile3530252015105PRICE-EARNINGS RATIO AND HIGH YIELD DEBT SPREADS%2015105001997199819992000200120022003200420052006200720082009201020112012S&P500 Price-Earnings RatioHigh Yield Debt Spreads128| <strong>Brookfield</strong> <strong>Asset</strong> <strong>Management</strong> Inc.
Favourable Conditions for Private Equity and Distress• Volatility in markets creates opportunity– Very slow economic growth and high unemployment in the U.S.– Europe’s issues are far from being resolved– Distress debt acquired early this year is trading at close to par value• Operationally challenged businesses are struggling to raise debt or equity capital– Mid-market mining companies have limited access to capital– Natural gas and merchant power generation businesses are struggling to generate freecash flow• Financing markets have been exceptional for high quality companies with demonstrated cashflow generation– A number of our portfolio companies such as Western Forest Products and Norbord haverecently completed debt refinancings i on attractive ti terms• Investor hunger for yield is creating an inventory of future distress opportunities129 | <strong>Brookfield</strong> <strong>Asset</strong> <strong>Management</strong> Inc.
Growing Our Business• Pursue buyouts or corporate carve-outs of underperforming businesses with great assets• Pursue larger distress situations opportunistically• Seek opportunities outside North America– Brazil continues to offer an attractiveand natural market for us to pursue– Enhanced effort in Europe where banksare shedding loans and assetsPRIVATE EQUITY FUNDSCapital Under <strong>Management</strong>($ billions)• Launch larger private equity funds and industryspecific funds where we have experience (i.e. oil and gas)0.41.32.02001 2006 2012 Future130| <strong>Brookfield</strong> <strong>Asset</strong> <strong>Management</strong> Inc.
<strong>Brookfield</strong> Private Equity Group Competitive Advantage• Significant restructuring capability to pursue distress transactions during periods of volatility• Deep operations expertise• Tremendous knowledge synergies from other <strong>Brookfield</strong> platforms (energy, power generation,infrastructure and real estate)• Global platform for deal sourcing• Access to capital in difficult markets as a result of <strong>Brookfield</strong>’s strong relationships with LP’sand with intermediaries131 | <strong>Brookfield</strong> <strong>Asset</strong> <strong>Management</strong> Inc.
Summary of OpportunityThe <strong>Brookfield</strong> Private Equity Group provides anexcellent investment opportunity for our clients• Proven team• Differentiated approach• Strong track record and history of value creation• Deep and broad operations experience• Attractive fundamentals for our business approach• Strong networks across <strong>Brookfield</strong> with strategics,lenders and intermediaries132 | <strong>Brookfield</strong> <strong>Asset</strong> <strong>Management</strong> Inc.
Housing Recovery Update
U.S. Housing Market in Early Stages of a Recovery• Six year U.S. housing depression has improved to early stages of a recovery• Recovery is evidenced by several positive signs:– Inventories of existing single family homes have decreased 30% year-over-year– Unemployment continues to decrease albeit at a moderate pace (8.2% vs. 9% in 2011)– Household formations are increasing from record lows– Home price increases without support of government initiatives– Public homebuilders are reporting backlog increases of more than 20% year-over-year– U.S. population is expected to increase by 15 million from 2012-2017 requiring 6 millionincremental housing units• Recovery is tempered by persistent low levels of consumer confidence, high delinquency rates,and abnormally large levels of shadow inventory• Housing starts should reach 750,000 in 2012 and exceed 900,000 in 2013 – well below the1.5 million units that is considered normal for the longer term• Our industry conviction remains strong – we expect moderately improved conditions for thenext 18-24 months – followed by a return to more normal levels of 1.5 million units within thenext tfive years134| <strong>Brookfield</strong> <strong>Asset</strong> <strong>Management</strong> Inc.
Key IndicatorsA Long Way to Go to “Normal”• Housing starts remain at depressed levels and have recovered modestly from the trough• Household formations and delinquency rates are improving, but are still far from balanced levels• Employment rate has improved and will be key to a strengthening recoveryHousing Starts550,000Bottom750,000Current1.5MNormalHousehold Formations350,000Bottom635,000Current1.3MNormalUnemployment10%Bottom7.8%Current5%NormalDelinquenciesi14%Bottom12%Current5.7%Normal135| <strong>Brookfield</strong> <strong>Asset</strong> <strong>Management</strong> Inc.
Key IndicatorsThe Good News• Affordability is at record high, with home prices near cyclical lows• Mortgage rates remain extremely low – Fed has indicated that low rates will remain through 2015• Inventories have dropped significantly in 2012 and are approaching more normal levelsHome Price Index125Bottom130Current150NormalMortgage Rates2.8% 3%Bottom Current5.5%NormalSingle Family Inventory11.8M6.3M4.5MBottom Current Normal136| <strong>Brookfield</strong> <strong>Asset</strong> <strong>Management</strong> Inc.
U.S. Public Homebuilders Seeing Improved Order Books• U.S. homebuilders indicate market conditions are improving and are optimistic• Backlogs have increased more than 20% for the major public homebuilders year-over-yearwith some companies reporting growth in orders of more than 50%• National Association of Homebuilders / Wells Fargo builder sentiment index increased to 40,from 37 in August – highest level in 6 years8,000HOMEBUILDER BACKLOGS2011 vs. 20127,0006,0005,0002011 Backlog2012 Backlog4,0003,0002,0001,0000Lennar Corp.Toll Brothe ers Inc.Hov vnavianMDC Holdin ngs Inc.BeazerPulteGrou up, Inc.DR Hortton Inc.NV VR Inc.KBHome137| <strong>Brookfield</strong> <strong>Asset</strong> <strong>Management</strong> Inc.
Housing Recovery and <strong>Brookfield</strong>• During the industry downturn <strong>Brookfield</strong> invested approximately $1.2 billion in companiesthat have and will benefit from the U.S. housing recovery• <strong>Brookfield</strong>’s entire housing related portfolio companies currently generate $4.1 billion inrevenue and employ 6,900 people• Portfolio companies have been operationally repositioned to generate cash at cycle lows,and are now becoming highly profitable with significant further upside to come138 | <strong>Brookfield</strong> <strong>Asset</strong> <strong>Management</strong> Inc.
<strong>Brookfield</strong> Investments that Directly Benefit from a RecoveryCompany Ownership Ticker DescriptionHomebuilding<strong>Brookfield</strong> Residential Properties Direct NYSE/TSX:BRP North American land developer & homebuilderBuilding ProductsNorbord Direct TSX:NBD Producer of panel board for North America & EuropeAinsworth Lumber BCP II TSX:ANS Producer of panel board for North America & AsiaWestern Forest Products BCP I TSX:WEF Producer of specialty lumber for North America & AsiaMaax BCP II Private North American manufacturer of bathroom productsTimberlandsLongview Timberlands Global Timber Fund Private Timberlands in Northwestern U.S.Island Timberlands Direct Private Timberlands in Western CanadaAcadian Timber Corp. Direct TSX:ADN Timberlands in New Brunswick & MaineServices<strong>Brookfield</strong> Real Estate Services Inc.DirectTSX:BRE Canadian provider of residential real estate services<strong>Brookfield</strong> Real Estate & Relocation Services Direct Private U.S. provider of residential real estate services139| <strong>Brookfield</strong> <strong>Asset</strong> <strong>Management</strong> Inc.
Leverage to a Recovery in U.S. Housing2.21.91.41.5$1,9801.00.6 0.6 0.70.811 1.1$?$510($110)2006 2007 2008 2009 2010 2011 2012 2014 2016 2004TroughTrailingPreviousPeakEBITDA ($mil) Housing Starts (mil) Forecast Housing Starts (mil)140 | <strong>Brookfield</strong> <strong>Asset</strong> <strong>Management</strong> Inc.
<strong>Brookfield</strong> Housing Related Portfolio Investments Proportional EBITDAEBITDA 1($ millions)$1,100100$?$300($80)TroughTrailing1.5MStartsPreviousPeak1) <strong>Brookfield</strong>’s interest141| <strong>Brookfield</strong> <strong>Asset</strong> <strong>Management</strong> Inc.
Conclusion• Prospects for businesses linked to a recovery in U.S.housing are positive – U.S. will return to a morenormal level l of housing starts t of 1.5 million per yearwithin the next five years• The rapid decline and prolonged bottom in housingresulted in many casualties – survivors have capturedmarket share and will benefit strongly as the recoveryphase continues• The path to a normal level of starts will not be smooth– this presents opportunity for well-capitalized andnimble companies• We are in the early stages of a recovery and theoperating leverage embedded in our investments istremendous142 | <strong>Brookfield</strong> <strong>Asset</strong> <strong>Management</strong> Inc.
Q & A
ConclusionBruce Flatt
Q&A
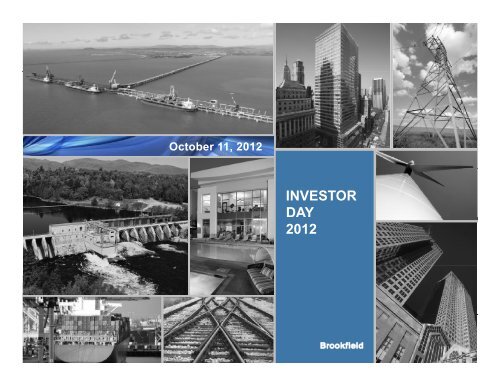
October 11, 2012INVESTORDAY2012


