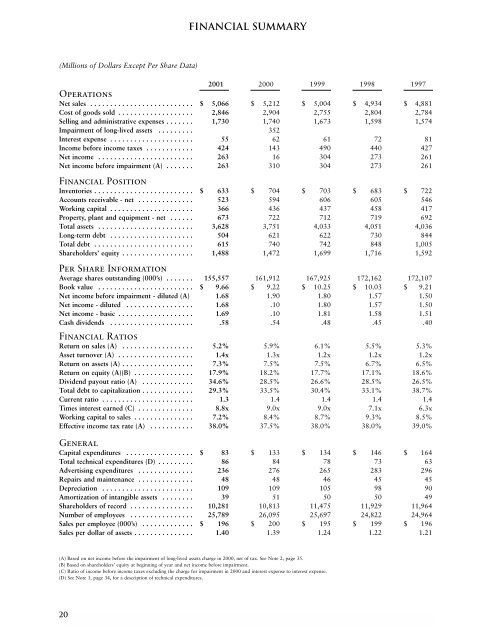
FINANCIAL SUMMARY(Millions of Dollars Except Per Share Data)<strong>2001</strong> 2000 1999 1998 1997OperationsNet sales . . . . . . . . . . . . . . . . . . . . . . . . . . $ 5,066 $ 5,212 $ 5,004 $ 4,934 $ 4,881Cost of goods sold . . . . . . . . . . . . . . . . . . . 2,846 2,904 2,755 2,804 2,784Selling and administrative expenses . . . . . . . 1,730 1,740 1,673 1,598 1,574Impairment of long-lived assets . . . . . . . . . 352Interest expense . . . . . . . . . . . . . . . . . . . . . 55 62 61 72 81Income before income taxes . . . . . . . . . . . . 424 143 490 440 427Net income . . . . . . . . . . . . . . . . . . . . . . . . 263 16 304 273 261Net income before impairment (A) . . . . . . . 263 310 304 273 261Financial PositionInventories . . . . . . . . . . . . . . . . . . . . . . . . . $ 633 $ 704 $ 703 $ 683 $ 722Accounts receivable - net . . . . . . . . . . . . . . 523 594 606 605 546Working capital . . . . . . . . . . . . . . . . . . . . . 366 436 437 458 417Property, plant and equipment - net . . . . . . 673 722 712 719 692Total assets . . . . . . . . . . . . . . . . . . . . . . . . 3,628 3,751 4,033 4,051 4,036Long-term debt . . . . . . . . . . . . . . . . . . . . . 504 621 622 730 844Total debt . . . . . . . . . . . . . . . . . . . . . . . . . 615 740 742 848 1,005Shareholders’ equity . . . . . . . . . . . . . . . . . . 1,488 1,472 1,699 1,716 1,592Per Share InformationAverage shares outstanding (000’s) . . . . . . . 155,557 161,912 167,925 172,162 172,107Book value . . . . . . . . . . . . . . . . . . . . . . . . $ 9.66 $ 9.22 $ 10.25 $ 10.03 $ 9.21Net income before impairment - diluted (A) 1.68 1.90 1.80 1.57 1.50Net income - diluted . . . . . . . . . . . . . . . . . 1.68 .10 1.80 1.57 1.50Net income - basic . . . . . . . . . . . . . . . . . . . 1.69 .10 1.81 1.58 1.51Cash dividends . . . . . . . . . . . . . . . . . . . . . .58 .54 .48 .45 .40Financial RatiosReturn on sales (A) . . . . . . . . . . . . . . . . . . 5.2% 5.9% 6.1% 5.5% 5.3%Asset turnover (A) . . . . . . . . . . . . . . . . . . . 1.4x 1.3x 1.2x 1.2x 1.2xReturn on assets (A) . . . . . . . . . . . . . . . . . . 7.3% 7.5% 7.5% 6.7% 6.5%Return on equity (A)(B) . . . . . . . . . . . . . . . 17.9% 18.2% 17.7% 17.1% 18.6%Dividend payout ratio (A) . . . . . . . . . . . . . 34.6% 28.5% 26.6% 28.5% 26.5%Total debt to capitalization . . . . . . . . . . . . . 29.3% 33.5% 30.4% 33.1% 38.7%Current ratio . . . . . . . . . . . . . . . . . . . . . . . 1.3 1.4 1.4 1.4 1.4Times interest earned (C) . . . . . . . . . . . . . . 8.8x 9.0x 9.0x 7.1x 6.3xWorking capital to sales . . . . . . . . . . . . . . . 7.2% 8.4% 8.7% 9.3% 8.5%Effective income tax rate (A) . . . . . . . . . . . 38.0% 37.5% 38.0% 38.0% 39.0%GeneralCapital expenditures . . . . . . . . . . . . . . . . . $ 83 $ 133 $ 134 $ 146 $ 164Total technical expenditures (D) . . . . . . . . . 86 84 78 73 63Advertising expenditures . . . . . . . . . . . . . . 236 276 265 283 296Repairs and maintenance . . . . . . . . . . . . . . 48 48 46 45 45Depreciation . . . . . . . . . . . . . . . . . . . . . . . 109 109 105 98 90Amortization of intangible assets . . . . . . . . 39 51 50 50 49Shareholders of record . . . . . . . . . . . . . . . . 10,281 10,813 11,475 11,929 11,964Number of employees . . . . . . . . . . . . . . . . 25,789 26,095 25,697 24,822 24,964Sales per employee (000’s) . . . . . . . . . . . . . $ 196 $ 200 $ 195 $ 199 $ 196Sales per dollar of assets . . . . . . . . . . . . . . . 1.40 1.39 1.24 1.22 1.21(A) Based on net income before the impairment of long-lived assets charge in 2000, net of tax. See Note 2, page 35.(B) Based on shareholders’ equity at beginning of year and net income before impairment.(C) Ratio of income before income taxes excluding the charge for impairment in 2000 and interest expense to interest expense.(D) See Note 1, page 34, for a description of technical expenditures.20
Management’s Discussion and Analysis of FinancialCondition and Results of OperationsFinancial Condition – <strong>2001</strong>Net operating cash flow generated by the Company during<strong>2001</strong> was $561.6 million primarily as a result of netincome from operations and reductions in working capitalwhich were partially offset by an unusual tax-related paymentof $65.7 million that was made to the U.S. InternalRevenue Service for contested tax issues plus accrued interest.The unusual tax-related payment was made to preventthe imposition of above-market interest charges while contestedtax issues are being resolved. Working capitalreductions occurred as a result of an increased focus bymanagement to improve collections of accounts receivableand accelerate inventory turnover to coincide with lowersales demand. The operating cash flow provided the majorityof funds to invest $82.6 million in property, plant andequipment, reduce total debt by $123.1 million, purchasetreasury stock of $157.1 million, increase the annual dividendto $91.0 million, and complete acquisitions ofbusinesses of $15.2 million. The Company ended the yearwith $118.8 million in cash and cash equivalents. The Company’scurrent ratio decreased to 1.32 at December 31, <strong>2001</strong>from 1.39 at the end of 2000. The Company’s ConsolidatedBalance Sheets and Statements of Consolidated Cash Flows,on pages 30 and 31 of this report, provide more detailed informationon the Company’s financial position and cash flows.Goodwill, which represents the excess of cost over thefair value of net assets acquired in purchase business combinations,decreased $33.2 million in <strong>2001</strong>. Intangible assets,which represent items such as trademarks and patents,decreased $11.6 million in <strong>2001</strong>. These decreases were dueto amortization expense and foreign currency translationadjustments, partially offset by increases resulting fromacquisitions completed in <strong>2001</strong>. During <strong>2001</strong>, the FinancialAccounting Standards Board (FASB) issued Statement ofFinancial Accounting Standards (SFAS) No. 142, “Goodwilland Other Intangible Assets,” which supersedes APBONo. 17, “Intangible Assets.” See Note 1 on pages 34 and35 of this report for a description of SFAS No. 142. TheCompany has adopted or will adopt SFAS No. 142 in therequired periods. Application of the non-amortization provisionsof the statement for goodwill and intangible assetsacquired before July 1, <strong>2001</strong> is expected to increase netincome approximately $24.7 million for the full year 2002.Deferred pension assets of $393.6 million at December31, <strong>2001</strong> represent the excess of the fair market value ofthe assets in the Company’s defined benefit pension plansover the actuarially-determined projected benefit obligations.The <strong>2001</strong> increase in deferred pension assets of $29.2million represents primarily the recognition of the currentyear net pension credit, described in Note 6 on pages 36 to38 of this report. The assumed discount rate used to computethe actuarial present value of projected benefitobligations was decreased from 7.00 percent to 6.75 per-cent at December 31, <strong>2001</strong> due to decreased rates of highquality,long-term investments. The decrease in the actualreturn on plan assets during <strong>2001</strong> was primarily the resultof returns on equity investments that were below theassumed return of 8.5 percent.A decrease in Other assets of $13.0 million was due primarilyto the amortization of capitalized costs incurredrelated to designing, developing, obtaining and implementinginternal use software in accordance with Statementof Position 98-1, “Accounting for the Cost of ComputerSoftware Developed or Obtained for Internal Use.” In addition,a reduction in assets related to certain marketingprograms of the Company also contributed to the decreasein Other assets.Net property, plant and equipment decreased $49.7 millionto $672.7 million at December 31, <strong>2001</strong> due todepreciation expense of $109.2 million, impairment chargeson assets held for disposal of $6.4 million and foreign currencytranslation adjustments partially offset by capitalexpenditures of $82.6 million and acquisitions. Capitalexpenditures during <strong>2001</strong> in the Paint Stores Segment wereprimarily attributable to opening new paint stores and storerelocations along with normal replacement and upgradingof store equipment. In the Consumer and InternationalCoatings Segments, capital expenditures during <strong>2001</strong> wereprimarily related to efficiency improvements in productionfacilities and information systems hardware. Capital expendituresin the Automotive Finishes Segment during <strong>2001</strong>primarily related to improvements and upgrades to theautomotive technology center. In 2002, the Companyexpects that its most significant capital expenditures willrelate to various capacity and productivity improvementprojects at manufacturing and distribution facilities, newstore openings, new point-of-sale equipment and new orupgraded information systems hardware. The Companydoes not anticipate the need for any specific long-term externalfinancing to support these capital programs.There were no short-term borrowings outstanding underthe Company’s commercial paper program at December 31,<strong>2001</strong>. During the year, borrowings were made under theCompany’s commercial paper program that is fully backedby and limited to the borrowing availability under the Company’srevolving credit agreements. The aggregatemaximum borrowing capacity under the current revolvingcredit agreements as of December 28, <strong>2001</strong> is $750.6 million.The current portion of long-term debt increased $98.9million due primarily to the reclassification of $100.0 millionof 6.5% Notes due February 1, 2002. Current portionof long-term debt at December 31, <strong>2001</strong> also included currentmaturities of $11.9 million related to variouspromissory notes and other obligations.Long-term debt decreased $117.2 million to $503.5 millionat December 31, <strong>2001</strong>, resulting primarily from21