2001 Annual Report - Investor Relations - Sherwin Williams
2001 Annual Report - Investor Relations - Sherwin Williams
2001 Annual Report - Investor Relations - Sherwin Williams
- No tags were found...

Create successful ePaper yourself
Turn your PDF publications into a flip-book with our unique Google optimized e-Paper software.
The <strong>Sherwin</strong>-<strong>Williams</strong> Company<strong>2001</strong> ANNUAL REPORTAmerica’s Paint Company
America’s Paint Company. Words of strength about a companywith more than $5 billion in annual sales. Words of stability abouta company with more than 135 years of coatings experience. Wordsstabilitysecurityof security about a company with increased dividends to shareholdersfor 22 consecutive years. Words that honor, humble andremind us of our industry leadership and corporate responsibilityto our customers, employees and shareholders.Table of ContentsSummary of Operating Segments 2Financial Highlights 3Letter to Shareholders 4The Operating Segments 8Stores Map 18Subsidiaries and Cautionary StatementRegarding Forward-Looking Information 19Financial Summary 20Management’s Discussion and Analysis ofFinancial Condition and Results of Operations 21<strong>Report</strong>s of Management and Independent Auditors 28Consolidated Financial Statements and Notes 29Directors, Officers, Operating Presidents 47Shareholder Information 48On the CoverLike many Americans,Philadelphia painter MegSaligman was “struck by adesire to do something”after the events of Sept. 11,<strong>2001</strong>.Working with the city’sMural Arts Program andwith paint, brushes and buckets supplied by<strong>Sherwin</strong>-<strong>Williams</strong>, she and three other painters – EfrainHererra, Larissa Preston and Cesar Viveros – painted a7,500-square-foot flag mural in downtown Philadelphia.“We are not doctors or therapists, so we couldn’t helppeople heal in that way,” Saligman says. “But if in our smallway we could offer solace and a sense of unity to even oneperson, it would be worthwhile.” It also was important toher that people go about their daily activities despitethe tragedy.“We’re painters, and we paint,” she says.The <strong>Sherwin</strong>-<strong>Williams</strong> Company recruits, selects and hires the best possible people available – without discrimination based on race, religion, color,creed, sex, national origin, age, disability, status as a special disabled veteran, veteran of the Vietnam era or any other unlawful consideration.
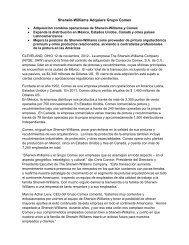
SUMMARY OF Operating SegmentsPaint StoresConsumerAutomotiveFinishesInternationalCoatingsPRODUCTS SOLDPaints, stains, caulks, applicators,wallcoverings,floorcoverings, spray equipmentand related productsMARKETS SERVEDDo-It-Yourselfers, professionalpainting contractors,home builders, propertymanagers, architects, interiordesigners, industrial,marine, aviation, flooringand original equipmentmanufacturer (OEM)product finishesMAJOR BRANDS SOLD<strong>Sherwin</strong>-<strong>Williams</strong> ® , Con-Lux ® , Old Quaker ,Mercury ® , Brod Dugan ® ,Mautz ® , Pro-Line ® , Sea-Guard ® , ArmorSeal ® ,Kem ® Hi-Temp, Cook ,Sher-Wood ® , Powdura ® ,Polane ® and Kem Aqua ®OUTLETS2,573 <strong>Sherwin</strong>-<strong>Williams</strong>stores in North AmericaPRODUCTS SOLDBranded, private label andlicensed brand paints,stains, varnishes, industrialproducts, wood finishingproducts, applicators, corrosioninhibitors, aerosolsand related productsMARKETS SERVEDDo-It-Yourselfers, professionalpainting contractorsand industrial maintenanceMAJOR BRANDS SOLDDutch Boy ® , Krylon ® ,Minwax ® , Cuprinol ® ,Thompson’s ® Water Seal ® ,Formby’s ® , Red Devil ® ,Pratt & Lambert ® , MartinSenour ® , H&C , WhiteLightning ® , Dupli-Color ®and Rubberset ®OUTLETSLeading mass merchandisers,home centers, independentpaint dealers, hardwarestores, automotiveretailers and industrial distributorsin North AmericaPaint StoresConsumerAutomotive FinishesPRODUCTS SOLDHigh performance interiorand exterior coatings forthe automotive, fleet andheavy truck markets, aswell as thousands of associatedproductsMARKETS SERVEDAutomotive jobbers,wholesale distributors,collision repair facilities,dealerships, fleet ownersand refinishers, productionshops, body buildersand original equipmentmanufacturersMAJOR BRANDS SOLD<strong>Sherwin</strong>-<strong>Williams</strong> ® , MartinSenour ® , Western ® ,Lazzuril , Excelo , Baco and ScottWarren OUTLETS174 company-operatedbranches in the UnitedStates, Canada, Jamaicaand Chile, and other operationsin the United States,Canada, Mexico, Brazil,Jamaica, Chile and ItalyPRODUCTS SOLDArchitectural paints,stains, varnishes, industrialmaintenance products,aerosols, product finishes,wood finishing productsand related productsMARKETS SERVEDDo-It-Yourselfers, professionalpainting contractors,independent dealers,industrial maintenanceand OEM product finishesMAJOR BRANDS SOLD<strong>Sherwin</strong>-<strong>Williams</strong> ® , DutchBoy ® , Krylon ® , Kem-Tone ® , Martin Senour ® ,Pratt & Lambert ® ,Minwax ® , Sumare ,Ronseal , Globo ,Pulverlack ® , Colorgin ,Andina , Tri-Flow ,Thompson’s ® Water Seal ®and Marson OUTLETSDistribution in more than20 countries throughwholly-owned subsidiaries,joint ventures andlicensees of technology,trademarks and tradenames,including 52 company-operatedarchitecturaland industrial stores inChile and BrazilInternational CoatingsNet External Sales By Operating Segment2
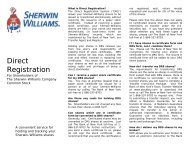
Financial Highlights(thousands of dollars except per share data)<strong>2001</strong> 2000 1999Net sales $5,066,005 $5,211,624 $5,003,837Net income before impairment (1) 263,158 309,654 303,860Less: Impairment of long-lived assets, net of tax 293,628Net income 263,158 16,026 303,860Per share:Net income before impairment - diluted (1) 1.68 1.90 1.80Less: Impairment of long-lived assets, net of tax 1.80Net income - diluted 1.68 .10 1.80Net income - basic 1.69 .10 1.81Cash dividends .58 .54 .48Book value 9.66 9.22 10.25Average shares outstanding (thousands) 155,557 161,912 167,925Return on sales (1) 5.2% 5.9% 6.1%Return on net operating assets employed (ronae) (2) 27.5% 29.8% 29.8%Return on beginning shareholders’ equity (1) 17.9% 18.2% 17.7%Earnings before interest, taxes, depreciation and amortization (ebitda) (1) $ 627,174 $ 717,503 $ 707,030Free cash flow (3) $ 388,090 $ 242,442 $ 271,941Total debt to capitalization 29.3% 33.5% 30.4%Interest coverage (1) 8.8x 9.0x 9.0xCurrent ratio 1.3 1.4 1.4Total technical expenditures (4) $ 86,222 $ 83,627 $ 78,1896000500040003000322041334881Sales(millions of dollars)4934500452125066200010000199519961997199819992000<strong>2001</strong>2.01.51.18Net income per share - diluted (1)1.901.801.501.571.331.681.00.50.0199519961997199819992000<strong>2001</strong>(1) Based on net income before the impairment of long-lived assets charge in 2000, net of tax. See Note 2, page 35.(2) Based on income before taxes, and the impairment of long-lived assets charge in 2000, divided by average net accountsreceivable, inventories, property, plant and equipment and accounts payable.(3) Net operating cash less capital expenditures and payments of cash dividends.(4) See Note 1, page 34, for a description of technical expenditures.3
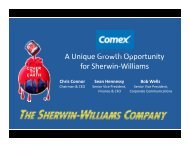
Christopher M. ConnorChairman and Chief Executive OfficerJoseph M. ScaminacePresident and Chief Operating OfficerTotal ReturnsPercent Change of Stock Price and Dividends ReinvestedDecember 29, 2000, to December 31, <strong>2001</strong>1086420-2-4-6-8-107.1%<strong>Sherwin</strong>-<strong>Williams</strong>-4.2%Dow JonesIndex-9.3%S&P 500Source: Bloomberg
letter to shareholdersBy any measure, <strong>2001</strong> will be remembered as an extraordinary year.It was a year of tough business conditions in a tough economy that affected us all.It was a year of a shocking national tragedy that touched us deeply. It was a yearthat brought our nation together and caused us to reflect upon our individual, family,community and corporate values. At The <strong>Sherwin</strong>-<strong>Williams</strong> Company, our culture isshaped by the values we have adhered to for the past 136 years. Our <strong>Annual</strong> <strong>Report</strong> toShareholders begins by naming a few of these cornerstone values. Words like strength, stabilityand security have always been woven tightly into the fabric of our company just asthey reflect what is good and right about our country.In <strong>2001</strong>, <strong>Sherwin</strong>-<strong>Williams</strong> generated sales of $5.07 billion,which was a 2.8 percent decline year over year. Netincome came in at $263.16 million vs. $309.65 million in2000, before a charge for impairment of long-lived assets.Diluted net income per share finished <strong>2001</strong> at $1.68 vs.$1.90 before the impairment of long-lived assets charge.While the landscape of American business was filled withcompanies that fared far worse, we take no satisfactionin this relative comparison. We are disappointed withour results.Despite previous widespread forecasts, we recognizedearly in the year that an economic recovery in <strong>2001</strong> wasn’tlikely to occur. It was clear that our track record of 23 consecutiveyears of improved earnings was in jeopardy.Management reacted quickly by implementing a programwe called “Challenge 24.” The goal was straightforwardand simple: leave no stone unturned in an effort to achievea 24th consecutive year of improved earnings. Challenge 24was a rallying cry for each employee. We wanted to unleashthe talent, knowledge and power of 25,000 employeespulling in the same direction.Unfortunately, the combined energy and effort of ourteam was not enough to overcome the significant challengesposed by a weak global economy. Although our string ofconsecutive years of improved earnings ended at 23, Challenge24 made us a stronger company and helped us achievesome impressive gains.In a year of lower sales and earnings, investors look forsigns of strength, such as a company’s ability to generatecash. This past year, through excellent management of workingcapital, we increased free cash flow by $145.65 millionto a record $388.09 million. We define free cash flow as netoperating cash available after dividend payments and capitalexpenditures.Two factors contributed heavily to this strong performance.We reduced accounts receivable and inventory levelsby a combined $133.63 million and decreased days outstandingon both accounts receivable balances and inventory.Our selling, general and administrative expenses were loweryear over year for the first time in 20 years. This was accomplishedwhile still making significant investments in ourcompany. We also were able to reduce headcount throughthoughtful and responsible management of our humanresource needs.Our increased free cash flow was used to furtherstrengthen, stabilize and secure our company in a numberof ways. We retired $123.06 million of debt andincreased our year-end cash position by $115.92 million.We also used the cash to make an important acquisitionin our Paint Stores Segment by purchasing the net assetsof the Mautz Paint Company, including their 33 paintstores in the Midwest. Additionally, we bought back 6.7million shares of the company’s common stock on theopen market.On the strength of our free cash flow performance, in2002 the Board of Directors approved our 23rd consecutiveincrease in first quarter dividend payments. While <strong>2001</strong>was not the year we had hoped for, we nonetheless viewthese results as a positive indicator – during an especiallytough year – of management’s commitment to fiscal responsibilityand shareholder value.Paint Stores SegmentThe Paint Stores Segment increased sales by 0.7 percentover last year to finish the year at $3.21 billion. Operatingprofit came in at $390.49 million, which was a decrease of5.1 percent from 2000’s performance. Sales of architecturaland industrial paint gallons increased but were offset by5
letter to shareholdersnegative year over year comparisons in our chemical coatingsbusiness.Our marketing strategy is driven by paint purchasetrends. As the population ages and people have less freetime, the do-it-yourself market is shifting toward hiring professionalpainting contractors, who purchase almost all ofthe products they need from the paint store channel. Therefore,our 2,573 company paint stores in North America andthe Caribbean give us a significant advantage over all otherpaint store competitors serving professional customers.We remain committed to our program of store expansionand added or acquired a net of 85 stores to our chainin <strong>2001</strong>. In addition, we continued to introduce new productsspecifically aimed at improving the productivity of ourprofessional customers. This commitment to technologyensures that we are at the forefront of product innovationsyear after year.This past year, we continued to strengthen our leadershipposition in the industrial and marine coatingsbusiness. We gained market share by introducingnew product technology aimed at specific focus markets.Our expanded business with the U.S. Navy is oneexample of our growing customer base for industrial andmarine coatings.Our chemical coatings business had a tough year as manufacturingcompanies across North America posted loweroutput month after month throughout <strong>2001</strong>. We took stepsto significantly strengthen this part of our company by forminga dedicated division within the Paint Stores Segmentfocused on growing domestic market share, expanding oursupply capabilities outside North America, driving gallonsales and improving profits. We have significant opportunitiesin this business and look forward to improved resultsin the future.Consumer SegmentNet sales for the Consumer Segment ended the year at$1.11 billion for a 9.0 percent decline from 2000’s performance.Operating profit came in at $108.17 million,representing a 24.1 percent decrease over last year.Despite this performance, there were encouraging positivetrends in our Consumer Segment. During the secondhalf of the year, sales with existing customers began to stabilize.More importantly, quarter over quarter profitimprovements were registered in the fourth quarter for thefirst time in several years. We completed the realignment ofthis Segment to create three separate divisions: ConsumerDivision, Diversified Brands Division and Wood Care Division.The management teams responsible for these divisionsplayed a significant role in the improved cash performanceof the company. The leadership role these teams assumedin our company’s Operational Excellence program is beginningto pay dividends that we expect to continue in 2002.The Consumer Segment has a portfolio of outstandingbrand names and relationships with leading retailersthroughout North America. We expect improved futureresults from this Segment.Automotive Finishes SegmentThe Automotive Finishes Segment experienced a net salesdecrease of 5.9 percent to $464.23 million for the year.Operating profit decreased to $51.23 million from $61.26million. The decline in operating profit for the year was dueprimarily to lower sales volume and related manufacturingabsorption. While collision repair sales throughout the yearwere higher, this gain was insufficient to offset a soft domesticeconomy that negatively impacted car and truckproduction, curtailing this Segment’s OEM sales. In addition,inventory corrections by customers in the secondarydistribution channels of this Segment further adverselyimpacted sales. We are encouraged, though, by the quarterover quarter operating profit improvement registered by ourAutomotive Finishes Segment in the fourth quarter of <strong>2001</strong>.This was the first full year of residency by our AutomotiveFinishes Segment in its 350,000-square-foot WorldHeadquarters in Warrensville Heights, Ohio. This investmentin technology and facilities is already paying dividendsby improving our customer relationships and service.Our customer loyalty program, the A-Plus Club, has anenrollment of more than 750 customers. We are excitedabout our growing and highly visible participation inNASCAR as the paint supplier to nearly 20 racing teams in<strong>2001</strong>. Automotive Finishes Segment customers also can availthemselves of numerous e-business options at our highlyinteractive web site.The Automotive Finishes Segment has developed a comprehensivedistribution platform that includes 174 companyoperatedbranches, thousands of automotive refinishdistributors and a presence in nearly 30 countries throughsubsidiaries and licensing agreements.International Coatings SegmentNet sales in the International Coatings Segmentdecreased 8.9 percent to $279.62 million in <strong>2001</strong>. Operatingprofit, in U.S. dollars, decreased to $4.90 million from$17.65 million. The sales decrease was due primarily tounfavorable currency exchange rates and weak economicconditions in South America. Excluding the effects ofcurrency exchange fluctuations relative to last year, net salesfor the Segment increased 5.2 percent in <strong>2001</strong>. The operatingprofit decrease was a result of several factorsincluding price competition, worsening economic condi-6
tions in Argentina, and margin erosion caused by a marketshift to lower-priced products.We are committed to expanding our reach in this Segmentand remain confident about the sales opportunitiesthat exist for our 52 company-operated stores and distributionoutlets in more than 20 countries. Our ability totransfer advanced technologies from our domestic operationsenables us to maintain a leadership position inmany of the markets we serve by providing superior coatingsand a constant flow of new product introductions.Successful market expansion and penetration occurred inarchitectural, industrial, marine, aerosol and chemicalcoatings markets. Ronseal, our operation in the UnitedKingdom, successfully introduced an enamel paint lineand an exterior stain line, achieving substantial gallonsales growth in <strong>2001</strong>.Management PromotionsThis past year, three important management promotionswere announced. Sean P. Hennessy was promoted to theposition of Senior Vice President – Finance, Treasurer andChief Financial Officer. Sean has had an impressive 17-yearcareer with <strong>Sherwin</strong>-<strong>Williams</strong> and has served in a wide rangeof financial and operating roles. Timothy A. Knight waspromoted to President & General Manager, DiversifiedBrands Division. Tim has been a sales and marketing teamleader throughout his seven-year career with the companyand is well suited for this division assignment. Harvey P.Sass was promoted to President & General Manager, WoodCare Division. Harvey has made significant contributionsto our wood care business over his 14 years with thecompany, most notably in the area of sales and marketing.These changes strengthen our company and exemplify theimportance we place on the retention and development ofour strongest assets – our people.Outlook for 2002Financial forecasting has become increasingly difficultin the face of such uncertain economic times. Overall, weexpect market conditions in 2002 to be flat to up slightlyover <strong>2001</strong> with pockets of strength domestically temperedby a continued weakness in foreign currency and the economyas a whole. However, The <strong>Sherwin</strong>-<strong>Williams</strong>Company has remained strong, stable and secure throughall phases of the economic cycle, beginning its 23rd consecutiveyear of anticipated dividend growth forshareholders and delivering the kind of performanceexpected from the market leader.Carrying the moniker “America’s Paint Company” is abadge of honor that the 25,000 employees of our companywear proudly and responsibly. We salute and thank eachand every one of them for their dedication and hard work,and know that they join us in thanking our loyal customers,our outstanding suppliers and our trusting shareholders.Christopher M. ConnorChairman and Chief Executive OfficerJoseph M. ScaminacePresident and Chief Operating Officer7
Alfred LewisCity Manager, Paint Stores GroupChicago, Ill.With more than 2,500stores in North America,<strong>Sherwin</strong>-<strong>Williams</strong> has morestores than the next ninepaint store companiescombined.
paint Stores segment<strong>Sherwin</strong>-<strong>Williams</strong> stores are the exclusive outletsfor <strong>Sherwin</strong>-<strong>Williams</strong> ® branded architectural and industrialpaints, stains and products. In <strong>2001</strong>, our Paint Stores Groupadded or acquired 85 stores, bringing the total to 2,573 companyoperatedoutlets in North America. These stores supply a diversecustomer base, including architectural and industrial painting contractors,residential and commercial builders and property managers,OEM product finishers, and do-it-yourself homeowners.PAINT STORES63% of Net External SalesThis unique store network enables us to maintain closeworking relationships with the end users of our products.Staying close to customers helps us to better anticipate andsatisfy the diverse needs of each market we serve. In recentyears, we have sharpened the focus of our product developmentand store merchandising efforts on the needs ofsome key customer segments. This customer-focusedapproach helps ensure the success of our new products.Our new Cashmere interior wall paint is a good example.Its ease of application saves residential paintingcontractors time and effort. Its smooth, stipple-free finishappeals to upscale homeowners. This combination of benefitsmade Cashmere paint an overnight success and willpropel its growth and popularity for yearsto come.Other examples include Harmony ® ,a low-odor, low-VOC wall paintthat minimizes disruption inoccupied areas; AquaClad Water-Based Alkyd, a onecoatwaterborne industrial andmarine topcoat; and aSher-Wood ® productline extension to helpproduction wood finisherscomply with ever-tighteningenvironmental regulations. Each of the21 new products introduced by the PaintStores Group in <strong>2001</strong> builds on our reputation as an innovatorand technology leader.Color is as fundamental to our business as producttechnology. In <strong>2001</strong>, we launched Color Excellence , anongoing program to establish <strong>Sherwin</strong>-<strong>Williams</strong> paintstores as the industry leader in color selection and delivery.The Color Excellence program is an end-to-endprocess-control initiative that improves color accuracy anduniformity by improving batch-to-batch manufacturingconsistency, container fill level accuracy, and store tintingequipment calibration. The Color Excellence program setsthe stage for the introduction of a new color system,including an exclusive color palette by Martha Stewart, inthe spring of 2002.In <strong>2001</strong>, we also initiated key changes to the structureand focus of our Chemical Coatings business. Recognizingthe increasing globalization of the OEM product finishingindustry, we organized teams of technical, marketing andsales specialists to serve specific user markets and expandedour supply capabilities beyond North America. This neworganization offers customers aroundthe world professionalconsultation based ona thorough understandingand depth ofexperience in theirspecific industry, combinedwith a vasttechnological resource.We will continueto explore anddevelop e-businessapplications that providevalue to our customers.For example, customers can now search through thousandsof wallpaper patterns and place orders on-line. In 2002, wewill launch our on-line business center, offering wholesalecustomers password-protected 24/7 access to order history,account status, pricing, on-line ordering features and otheraccount-management tools.9
Fred KoneckiCase PackerChicago, Ill.Our Consumer Segment sellsproducts under familiarbrands such as Dutch Boy ® ,Pratt & Lambert ® , Minwax ® ,Krylon ® and Thompson’s ® WaterSeal ® through top retailoutlets nationwide.
Consumer segmentThe three operating units within our ConsumerSegment – the Consumer Division, the Wood Care Divisionand the Diversified Brands Division – producesome of the most powerful brand names in the coatings industry.Private label manufacturing and licensed brand programs haveextended our reach among home centers, hardware stores, massmerchandisers, industrial distributors and independent paint storesthroughout North America.CONSUMER22% of Net External SalesConsumer Division – With 10 manufacturing facilitiesand eight distribution centers, the Consumer Divisionhas the resources to serve both external customers and<strong>Sherwin</strong>-<strong>Williams</strong> paint stores. We manufacture and marketwell-known brands like Dutch Boy ® , Pratt & Lambert ® andMartin Senour ® . We also supply private label products to leadingretailers.Successful product launches in <strong>2001</strong> included the Dutch Boy ®Dimension ® line of products for faux decorating; the MarthaStewart One Coat Program; and the Pratt & Lambert ® Ovation line of faux decorating products.The Consumer Division launched severalkey operations initiatives designedto reduce costs and maximize efficiencies.These include a suppliercollaboration program that relies onclose interaction with raw materials suppliers,a purchasing program thatleverages our buying power, and a supplierdiversity program.We also implemented Six Sigma, astatistical approach to process improvement,as part of our OperationalExcellence initiative. We are committedto establishing measurableoperational procedures and a cultureof continuous improvement.Wood Care Division –Headquartered in Upper SaddleRiver, N.J., the Wood CareDivision is responsible for our Minwax ® , Thompson’s ®Water Seal ® , Formby’s ® , DuraSeal ® and Fabulon ® productlines. Constant product innovation and technologicaladvancement differentiates our Wood Care products andhelps build and strengthen our brands.Our products are developed for performance, convenienceand lasting beauty. In <strong>2001</strong>, we introduced Minwax ®Stainable Wood Filler, an interior/exterior wood filler forwood finishing repairs. It is a latex formula that stains canpenetrate as well as natural wood. We also added Minwax ®Super Fast-Drying Polyurethane for Floors, an oil-based protectiveclear finish designed for use with hardwood floors.Because of its fast drying time and formulation that doesn’trequire sanding between coats, consumerscan begin and finish aproject in a single day.Diversified Brands Division– The Diversified BrandsDivision produces aerosol paintsand chemicals, paint brushes androllers, and caulks and sealants. Ourbrands include Krylon ® and Dupli-Color ® spray paints; Rubberset ® and<strong>Sherwin</strong>-<strong>Williams</strong> ® brushes androllers; and White Lightning ® caulksand sealants. Additionally, we supplyprivate label spray paint toseveral mass merchandisers.We are the largest manufacturer andmarketer of aerosol paint in the country. In<strong>2001</strong>, we launched several key products intothis market. Dupli-Color ® Mirage ® is a multicoloreffect spray paint for automotive retailuse that is gaining popularity among do-it-yourselfersand professionals alike. The Krylon ProductsGroup introduced several new products under theKrylon ® brand for the craft market and developed targetedprograms for contractors.We also launched a complete line of extension poles foruse with our paint rollers.11
Automotive finishes segmentThe <strong>Sherwin</strong>-<strong>Williams</strong> name has becomesynonymous with high-quality, high-performanceinterior and exterior automotive finishes. It’s why inaddition to serving traditional automotive, fleet and heavydutytruck markets, nearly 20 NASCAR teams selected us astheir paint supplier in <strong>2001</strong>. As one racing team ownerAUTOMOTIVE FINISHES9% of Net External Salesremarked recently, “We couldn’t help but notice a big differencein the appearance of the cars. The color … the shine … the vehicles painted with<strong>Sherwin</strong>-<strong>Williams</strong> ® automotive paint truly stood apart from the rest. And once we heardof the superior support and service that <strong>Sherwin</strong>-<strong>Williams</strong> provided the other NASCARteams, we knew it was time to make a switch.”While being a part of the high-profile racing circuit iscertainly rewarding, <strong>Sherwin</strong>-<strong>Williams</strong> earned its stripes inautomotive markets long before racing achieved its currentpopularity. In fact, <strong>Sherwin</strong>-<strong>Williams</strong> entered the market in1922 with a lacquer productunder the trade nameOpex ® . Since then,our Automotive FinishesSegment hasextended its reachthrough 174 company-operatedbranches in the UnitedStates, Canada,Jamaica and Chile,along with a comprehensivedistributionplatform consisting ofthousands of automotive refinishdistributors. Our products also have a presence in nearly30 countries through wholly-owned subsidiaries and foreignlicensing agreements. The major brands we offer are<strong>Sherwin</strong>-<strong>Williams</strong> ® , Martin Senour ® , Western ® , Lazzuril ,Excelo , Baco and ScottWarren .Our customer-driven service is apparent in all aspects ofour organization. Our automotive learning centers havetrained thousands of customers and employees on curricularanging from product specifications to color to businessmanagement. The 350,000-square-foot World AutomotiveCenter in Warrensville Heights, Ohio, is a state-of-the artresearch and development facility that can also replicate virtuallyany refinishing environment – from airflow conditionsto climate variations. And, with 280 employees in the keyautomotive finishing disciplines on-site together, customersare assured of the most accurate and timelyservice possible.At year-end, ourcustomer loyaltyprogram, the A-Plus Club, had anenrollment of morethan 750 customermembers, who receivevaluable marketing andbusiness managementservices as part of theirmembership.The latest in automotive finishing e-technologyis also available to <strong>Sherwin</strong>-<strong>Williams</strong> customers atwww.sherwin-automotive.com. Customers can access automotivecolor formula mixing information through ourFormula Finder, as well as purchase products on-line at oure-store, and remain up-to-date on the latest in color andproduct technology. The Automotive Finishes Segment of<strong>Sherwin</strong>-<strong>Williams</strong> will continue to develop the most technologicallyadvanced, productive, user-friendly productsavailable, while continuing to streamline and consolidateeach refinishing system.13
JocelioVerissimo SilvaProduction Chief<strong>Sherwin</strong>-<strong>Williams</strong> do BrasilOur International Divisionis strengthened by a veryloyal, dedicatedworkforce of morethan 2,100 employees.
International Coatings segmentShared domestic technologies – combined withsignificant manufacturing capabilities, expanded distributionchannels and a growing presence in the markets weserve – fuels optimism in our International Coatings Segment.While our financial performance was hurt by unfavorable currencyexchange rates and weak economic conditions in South America,our business is fundamentally sound and poised for growth.INTERNATIONAL COATINGS6% of Net External SalesThe International Coatings Segment distributes <strong>Sherwin</strong>-<strong>Williams</strong> brand products and products marketed underwell-recognized regional brands in more than 20 countries.We operate through wholly-owned subsidiaries, joint ventures,licensing agreements and independent distributors,along with 52 company-operated stores in Chile and Brazil.CHILE – In Chile, we provide coatings for virtually allretail and wholesale applications. These include Architectural,Industrial, Marine, Chemical Coatings and Aerosols,where we are the market leader with our Marson brand.We have increased market share and market penetrationin each of these areas and are confident of future growth.We will continue to open company stores in support of allthese markets. Sales into Industrial and Marine markets,such as fishing and copper mining, benefited fromthe introduction of new coatings technologies –transferred from domestic operations. Furtherexpansion in Industrial will occur with theintroduction of new products for theindustrial flooring market from thePaint Store Segment’s General Polymersbusiness unit.ARGENTINA – The additionof two new major dealerchains and expansion ofour home center businesswere bright spots inan otherwise depressedmarket hit by an unemploymentrate of 22%, afourth consecutive year of recession and, in 2002, a significantcurrency devaluation. While we anticipate gallon volume tocontinue shrinking, we expect to gain market share. And, thestrong distribution we enjoy with the dealer chains will continueto present future growth and sales opportunities.BRAZIL – This is our largest subsidiary. Our strong portfolioof brands positions us well in every coatings category we serve.We are the market leader in Aerosols with our Colorgin brand,which is distributed through home centers, mass retailers andhardware stores. Our Sumaré brand has helped us achieve marketleadership in Industrial and Marine, which is sold directlyto customers as well as through our company stores. We willcontinue to support this distribution method with the openingof new company stores. Many of the Sumaré product technologiesin use were developed from the domestic market. Wealso manufacture and distribute products for the powder coatingsand chemical coatings markets. In our ArchitecturalCoatings business, numerous new products were successfullyintroduced for hospitals and kitchens and baths, along with texturepaints and otherspecialty coatings. Theseproducts are primarilysold through home centers,independent dealersand hardware stores.UNITED KINGDOM –The launch of our Tri-Flow Metal Care enamel paint was verysuccessful. Continuedgrowth of this line isexpected in Europe. RonsealLimited willcontinue its focus onupgrading our interiorWoodcare line to increase awareness and preference in all sectors.The introduction by Ronseal Limited of exterior stains inthe Gardencare line helped propel significant gallon salesincreases for the year and will provide solid growth opportunitiesamong existing distribution and major home centers.15
America’s paint companyamerica’sWhile <strong>2001</strong> proved to be a challenging year for our company and our nation,the men and women of <strong>Sherwin</strong>-<strong>Williams</strong> were again at their best. If adversitytruly introduces us to ourselves, then you’ll like the people you meet at<strong>Sherwin</strong>-<strong>Williams</strong>. Their gifts of time, money, items of need, support and prayersPAINTcompanyfollowing the events of Sept. 11 were particularly inspiring and worthy of America’sPaint Company. <strong>Sherwin</strong>-<strong>Williams</strong> employees dispatched countless dustmasks, five-gallon pails, respirators, gloves, buckets and other needed suppliesto New York, Pennsylvania and the Pentagon. Yet, these gifts cannot be measuredmerely in hours, dollars or cartons – but equally, in terms of thoughts,words and deeds. We are proud of, and thankful to, the many dedicated<strong>Sherwin</strong>-<strong>Williams</strong> employees who stood so tall in our country’s hour of need.
TITUSVILLE,FLA. –➛A shortage of Americanflags didn’t stop theemployees of <strong>Sherwin</strong>-<strong>Williams</strong> store #2197from displaying theirpatriotism and supportfor the victims of Sept.11 and their families.Store employees painted their own Stars and Stripes ona 9-by-12-foot canvas drop cloth.➛➛RIO RANCHO, N.M. – More than 1,200 gallons of<strong>Sherwin</strong>-<strong>Williams</strong> ® paint were used to cover seven acresof soccer fields at the Rio Rancho Sports Complex. Commercialpainting contracting firm JTC Inc. painted theflag with Snow White A-100 ® Exterior Latex Flat andSetfast ® Acrylic Latex Traffic Marking for the red andblue areas.ROCK ISLAND,ILL.–The roof of theThoms ProestlerCo. warehouse isadorned with an Old Glory 274 feet long by 156 feetwide, with a total area of 42,744 square feet. <strong>Sherwin</strong>-<strong>Williams</strong> donated the 150 gallons of paint needed for theproject, and Jim Phillips, owner of Excel Painting andWallcoverings, donated more than 100 labor hours. Visibleonly from the air, the flag is intended to show supportfor pilots and the airline industry. The red and white areaswere painted with <strong>Sherwin</strong>-<strong>Williams</strong> ® Setfast ® AcrylicLatex Traffic Marking Paint, and the blue areas werepainted with <strong>Sherwin</strong>-<strong>Williams</strong> ® Metalatex ® Semi-Gloss Coating.WASHINGTON,D.C.–<strong>Sherwin</strong>-<strong>Williams</strong> donated 10,000gallons of paint for the restoration of sections of the Pentagondamaged by the Sept. 11 terrorist attacks. The ideafor the donation came from <strong>Sherwin</strong>-<strong>Williams</strong> computerprogrammer/analystKim Falk. In a letter toSecretary of DefenseDonald Rumsfeld,<strong>Sherwin</strong>-<strong>Williams</strong>Chairman and CEOChristopher M. Connorexplained that thecompany wanted tohonor all who werelost in the attacks andsupport the governmentin its restorationof the Pentagon.➛CHEYENNE,WYO.–Scott Cloudy, a <strong>Sherwin</strong>-<strong>Williams</strong>store manager in Cheyenne, displayed his patriotism bypainting the American flag on his garage door. He usedwhite <strong>Sherwin</strong>-<strong>Williams</strong> ® DTM Acrylic Coating and Sher-Cryl Safety Red for the stripes, All Surface Enamel Latexin Regalia Blue for the blue field, and Krylon ® spray paintfor the white stars.➛17
stores map6 221215 7571Alaska34 41024 1 1063 114 114 1 39 2Hawaii92 1628 3 15 1Paint StoresAutomotive Branches7717 139212 107742 2483621 571339 156268 186 1456438817340 268 4571386381571419101678 3 39 4118 61046 2 32 214835 372 510156241 126 Puerto Rico2 Virgin Islands14 Jamaica19Today, more than 90% of the U.S. population liveswithin a 50-mile radius of a <strong>Sherwin</strong>-<strong>Williams</strong> PaintStore. For the location of their local store, customerscan call 1-800-4-sherwin, or visit our website (www.sherwin-williams.com). The web site alsooffers approximately 10,000 web pages of valuablecoatings information. It’s a comprehensiveresource for our most sophisticated paint customersas well as an easy-to-use project guide forthe do-it-yourselfer.331918
SUBSIDIARIESForeignCoatings S.r.L.Compañia <strong>Sherwin</strong>-<strong>Williams</strong>, S.A. de C.V.Eurofinish S.r.L.Kriesol, S.A.Productos Quimicos y Pinturas, S.A. de C.V.Proquipsa, S.A. de C.V.Quetzal Pinturas, S.A. de C.V.Ronseal (Ireland) LimitedRonseal LimitedScottWarren S.p.A.<strong>Sherwin</strong>-<strong>Williams</strong> (Caribbean) N.V.<strong>Sherwin</strong>-<strong>Williams</strong> (West Indies) Limited<strong>Sherwin</strong>-<strong>Williams</strong> Argentina I.y C.S.A.<strong>Sherwin</strong>-<strong>Williams</strong> Canada Inc.<strong>Sherwin</strong>-<strong>Williams</strong> Cayman Islands Limited<strong>Sherwin</strong>-<strong>Williams</strong> Chile S.A.<strong>Sherwin</strong>-<strong>Williams</strong> do Brasil Industria e Comercio Ltda.<strong>Sherwin</strong>-<strong>Williams</strong> Foreign Sales Corporation Limited<strong>Sherwin</strong>-<strong>Williams</strong> Japan Co., Ltd.<strong>Sherwin</strong>-<strong>Williams</strong> Singapore PTE, Ltd.The <strong>Sherwin</strong>-<strong>Williams</strong> Company Resources LimitedDomesticContract Transportation Systems Co.DIMC, Inc.Dupli-Color Products Company<strong>Sherwin</strong>-<strong>Williams</strong> Automotive Finishes Corp.<strong>Sherwin</strong>-<strong>Williams</strong> Realty Holdings, Inc.SWIMC, Inc.The <strong>Sherwin</strong>-<strong>Williams</strong> Acceptance CorporationThompson Minwax International Corp.Cautionary Statement Regarding Forward-Looking InformationCertain statements contained in“Management’s Discussion andAnalysis of Financial Condition andResults of Operations,” “Letter toShareholders,” and elsewhere in thisreport constitute “forward-lookingstatements” within the meaning ofSection 27A of the Securities Act of1933 and Section 21E of the SecuritiesExchange Act of 1934. Theseforward-looking statements are basedupon management’s current expectations,estimates, assumptions andbeliefs concerning future events andconditions and may discuss, amongother things, anticipated future performance(including sales andearnings), expected growth and futurebusiness plans. Any statement that isnot historical in nature is a forwardlookingstatement and may beidentified by the use of words andphrases such as “expects,” “anticipates,”“believes,” “will likely result,”“will continue,” “plans to,” and similarexpressions. Readers are cautionednot to place undue reliance on anyforward-looking statements. Forwardlookingstatements are necessarily subjectto risks, uncertainties and otherfactors, many of which are outside thecontrol of the Company, that couldcause actual results to differ materiallyfrom such statements. These risks,uncertainties and other factors includesuch things as: general business conditions,strengths of retail economiesand the growth in the coatings industry;competitive factors, includingpricing pressures and product innovationand quality; changes in rawmaterial availability and pricing;changes in the Company’s relationshipswith customers and suppliers;the ability of the Company to successfullyintegrate past and futureacquisitions into its existing operations,as well as the performance ofthe businesses acquired; the ability ofthe Company to successfully completeplanned divestitures; changes in generaldomestic economic conditionssuch as inflation rates, interest ratesand tax rates; risk and uncertaintiesassociated with the Company’s expansioninto foreign markets, includinginflation rates, recessions, foreign currencyexchange rates, foreigninvestment and repatriation restrictionsand other external economic andpolitical factors; the achievement ofgrowth in developing markets, such asMexico and South America; increasinglystringent domestic and foreigngovernmental regulations includingthose affecting the environment; inherentuncertainties involved in assessingthe Company’s potential liability forenvironmental remediation-relatedactivities; the nature, cost, quantityand outcome of pending and future litigationand other claims, including thelead pigment and lead-based paint litigationand the affect of any legislationand administrative regulations relatingthereto; and unusual weatherconditions.Any forward-looking statementspeaks only as of the date on whichsuch statement is made, and the Companyundertakes no obligation toupdate any forward-looking statement,whether as a result of new information,future events or otherwise.19
FINANCIAL SUMMARY(Millions of Dollars Except Per Share Data)<strong>2001</strong> 2000 1999 1998 1997OperationsNet sales . . . . . . . . . . . . . . . . . . . . . . . . . . $ 5,066 $ 5,212 $ 5,004 $ 4,934 $ 4,881Cost of goods sold . . . . . . . . . . . . . . . . . . . 2,846 2,904 2,755 2,804 2,784Selling and administrative expenses . . . . . . . 1,730 1,740 1,673 1,598 1,574Impairment of long-lived assets . . . . . . . . . 352Interest expense . . . . . . . . . . . . . . . . . . . . . 55 62 61 72 81Income before income taxes . . . . . . . . . . . . 424 143 490 440 427Net income . . . . . . . . . . . . . . . . . . . . . . . . 263 16 304 273 261Net income before impairment (A) . . . . . . . 263 310 304 273 261Financial PositionInventories . . . . . . . . . . . . . . . . . . . . . . . . . $ 633 $ 704 $ 703 $ 683 $ 722Accounts receivable - net . . . . . . . . . . . . . . 523 594 606 605 546Working capital . . . . . . . . . . . . . . . . . . . . . 366 436 437 458 417Property, plant and equipment - net . . . . . . 673 722 712 719 692Total assets . . . . . . . . . . . . . . . . . . . . . . . . 3,628 3,751 4,033 4,051 4,036Long-term debt . . . . . . . . . . . . . . . . . . . . . 504 621 622 730 844Total debt . . . . . . . . . . . . . . . . . . . . . . . . . 615 740 742 848 1,005Shareholders’ equity . . . . . . . . . . . . . . . . . . 1,488 1,472 1,699 1,716 1,592Per Share InformationAverage shares outstanding (000’s) . . . . . . . 155,557 161,912 167,925 172,162 172,107Book value . . . . . . . . . . . . . . . . . . . . . . . . $ 9.66 $ 9.22 $ 10.25 $ 10.03 $ 9.21Net income before impairment - diluted (A) 1.68 1.90 1.80 1.57 1.50Net income - diluted . . . . . . . . . . . . . . . . . 1.68 .10 1.80 1.57 1.50Net income - basic . . . . . . . . . . . . . . . . . . . 1.69 .10 1.81 1.58 1.51Cash dividends . . . . . . . . . . . . . . . . . . . . . .58 .54 .48 .45 .40Financial RatiosReturn on sales (A) . . . . . . . . . . . . . . . . . . 5.2% 5.9% 6.1% 5.5% 5.3%Asset turnover (A) . . . . . . . . . . . . . . . . . . . 1.4x 1.3x 1.2x 1.2x 1.2xReturn on assets (A) . . . . . . . . . . . . . . . . . . 7.3% 7.5% 7.5% 6.7% 6.5%Return on equity (A)(B) . . . . . . . . . . . . . . . 17.9% 18.2% 17.7% 17.1% 18.6%Dividend payout ratio (A) . . . . . . . . . . . . . 34.6% 28.5% 26.6% 28.5% 26.5%Total debt to capitalization . . . . . . . . . . . . . 29.3% 33.5% 30.4% 33.1% 38.7%Current ratio . . . . . . . . . . . . . . . . . . . . . . . 1.3 1.4 1.4 1.4 1.4Times interest earned (C) . . . . . . . . . . . . . . 8.8x 9.0x 9.0x 7.1x 6.3xWorking capital to sales . . . . . . . . . . . . . . . 7.2% 8.4% 8.7% 9.3% 8.5%Effective income tax rate (A) . . . . . . . . . . . 38.0% 37.5% 38.0% 38.0% 39.0%GeneralCapital expenditures . . . . . . . . . . . . . . . . . $ 83 $ 133 $ 134 $ 146 $ 164Total technical expenditures (D) . . . . . . . . . 86 84 78 73 63Advertising expenditures . . . . . . . . . . . . . . 236 276 265 283 296Repairs and maintenance . . . . . . . . . . . . . . 48 48 46 45 45Depreciation . . . . . . . . . . . . . . . . . . . . . . . 109 109 105 98 90Amortization of intangible assets . . . . . . . . 39 51 50 50 49Shareholders of record . . . . . . . . . . . . . . . . 10,281 10,813 11,475 11,929 11,964Number of employees . . . . . . . . . . . . . . . . 25,789 26,095 25,697 24,822 24,964Sales per employee (000’s) . . . . . . . . . . . . . $ 196 $ 200 $ 195 $ 199 $ 196Sales per dollar of assets . . . . . . . . . . . . . . . 1.40 1.39 1.24 1.22 1.21(A) Based on net income before the impairment of long-lived assets charge in 2000, net of tax. See Note 2, page 35.(B) Based on shareholders’ equity at beginning of year and net income before impairment.(C) Ratio of income before income taxes excluding the charge for impairment in 2000 and interest expense to interest expense.(D) See Note 1, page 34, for a description of technical expenditures.20
Management’s Discussion and Analysis of FinancialCondition and Results of OperationsFinancial Condition – <strong>2001</strong>Net operating cash flow generated by the Company during<strong>2001</strong> was $561.6 million primarily as a result of netincome from operations and reductions in working capitalwhich were partially offset by an unusual tax-related paymentof $65.7 million that was made to the U.S. InternalRevenue Service for contested tax issues plus accrued interest.The unusual tax-related payment was made to preventthe imposition of above-market interest charges while contestedtax issues are being resolved. Working capitalreductions occurred as a result of an increased focus bymanagement to improve collections of accounts receivableand accelerate inventory turnover to coincide with lowersales demand. The operating cash flow provided the majorityof funds to invest $82.6 million in property, plant andequipment, reduce total debt by $123.1 million, purchasetreasury stock of $157.1 million, increase the annual dividendto $91.0 million, and complete acquisitions ofbusinesses of $15.2 million. The Company ended the yearwith $118.8 million in cash and cash equivalents. The Company’scurrent ratio decreased to 1.32 at December 31, <strong>2001</strong>from 1.39 at the end of 2000. The Company’s ConsolidatedBalance Sheets and Statements of Consolidated Cash Flows,on pages 30 and 31 of this report, provide more detailed informationon the Company’s financial position and cash flows.Goodwill, which represents the excess of cost over thefair value of net assets acquired in purchase business combinations,decreased $33.2 million in <strong>2001</strong>. Intangible assets,which represent items such as trademarks and patents,decreased $11.6 million in <strong>2001</strong>. These decreases were dueto amortization expense and foreign currency translationadjustments, partially offset by increases resulting fromacquisitions completed in <strong>2001</strong>. During <strong>2001</strong>, the FinancialAccounting Standards Board (FASB) issued Statement ofFinancial Accounting Standards (SFAS) No. 142, “Goodwilland Other Intangible Assets,” which supersedes APBONo. 17, “Intangible Assets.” See Note 1 on pages 34 and35 of this report for a description of SFAS No. 142. TheCompany has adopted or will adopt SFAS No. 142 in therequired periods. Application of the non-amortization provisionsof the statement for goodwill and intangible assetsacquired before July 1, <strong>2001</strong> is expected to increase netincome approximately $24.7 million for the full year 2002.Deferred pension assets of $393.6 million at December31, <strong>2001</strong> represent the excess of the fair market value ofthe assets in the Company’s defined benefit pension plansover the actuarially-determined projected benefit obligations.The <strong>2001</strong> increase in deferred pension assets of $29.2million represents primarily the recognition of the currentyear net pension credit, described in Note 6 on pages 36 to38 of this report. The assumed discount rate used to computethe actuarial present value of projected benefitobligations was decreased from 7.00 percent to 6.75 per-cent at December 31, <strong>2001</strong> due to decreased rates of highquality,long-term investments. The decrease in the actualreturn on plan assets during <strong>2001</strong> was primarily the resultof returns on equity investments that were below theassumed return of 8.5 percent.A decrease in Other assets of $13.0 million was due primarilyto the amortization of capitalized costs incurredrelated to designing, developing, obtaining and implementinginternal use software in accordance with Statementof Position 98-1, “Accounting for the Cost of ComputerSoftware Developed or Obtained for Internal Use.” In addition,a reduction in assets related to certain marketingprograms of the Company also contributed to the decreasein Other assets.Net property, plant and equipment decreased $49.7 millionto $672.7 million at December 31, <strong>2001</strong> due todepreciation expense of $109.2 million, impairment chargeson assets held for disposal of $6.4 million and foreign currencytranslation adjustments partially offset by capitalexpenditures of $82.6 million and acquisitions. Capitalexpenditures during <strong>2001</strong> in the Paint Stores Segment wereprimarily attributable to opening new paint stores and storerelocations along with normal replacement and upgradingof store equipment. In the Consumer and InternationalCoatings Segments, capital expenditures during <strong>2001</strong> wereprimarily related to efficiency improvements in productionfacilities and information systems hardware. Capital expendituresin the Automotive Finishes Segment during <strong>2001</strong>primarily related to improvements and upgrades to theautomotive technology center. In 2002, the Companyexpects that its most significant capital expenditures willrelate to various capacity and productivity improvementprojects at manufacturing and distribution facilities, newstore openings, new point-of-sale equipment and new orupgraded information systems hardware. The Companydoes not anticipate the need for any specific long-term externalfinancing to support these capital programs.There were no short-term borrowings outstanding underthe Company’s commercial paper program at December 31,<strong>2001</strong>. During the year, borrowings were made under theCompany’s commercial paper program that is fully backedby and limited to the borrowing availability under the Company’srevolving credit agreements. The aggregatemaximum borrowing capacity under the current revolvingcredit agreements as of December 28, <strong>2001</strong> is $750.6 million.The current portion of long-term debt increased $98.9million due primarily to the reclassification of $100.0 millionof 6.5% Notes due February 1, 2002. Current portionof long-term debt at December 31, <strong>2001</strong> also included currentmaturities of $11.9 million related to variouspromissory notes and other obligations.Long-term debt decreased $117.2 million to $503.5 millionat December 31, <strong>2001</strong>, resulting primarily from21
MANAGEMENT’S DISCUSSION AND ANALYSIS OF FINANCIALCONDITION AND RESULTS OF OPERATIONSreclassification to current debt maturities of $111.9 millionand early redemption of $10.0 million of the Company’s9.875% Debentures. The Company expects to remain in aborrowing position throughout 2002.The increase in the Company’s long-term postretirementbenefit liability occurred due to the excess of the net postretirementbenefit expense over the costs for benefit claimsincurred. The current portion of the accrued postretirementliability, amounting to $14.9 million at December 31, <strong>2001</strong>,is included in Other accruals. The assumed discount rateused to calculate the actuarial present value of the postretirementbenefit obligations was decreased from 7.00percent to 6.75 percent at December 31, <strong>2001</strong> due to thereduced rates of high-quality, long-term investments. Theassumed health care cost trend rates were revised during2000 for years <strong>2001</strong> through 2009. The revised rates reflectescalating health care costs that continued to exceed thepreviously established rates. The trend rate for <strong>2001</strong> was amore representative 9.5 percent annual increase. The ratefor 2002 is 8.9 percent decreasing gradually to 5.5 percentin 2010. See Note 6, on pages 36 to 38 of this report, forfurther information on the Company’s postretirement benefitobligations.The decrease of $48.9 million in Other long-term liabilitiesduring <strong>2001</strong> was due primarily to the previouslymentioned unusual tax-related payment of $65.7 millionmade to prevent the imposition of above-market interestcharges while contested issues are being resolved. Partiallyoffsetting this decrease was an increase in certain tax liabilitiesresulting from timing items. See Note 9, on page 39of this report, for information concerning the Company’sOther long-term liabilities.Shareholders’ equity increased $15.9 million during<strong>2001</strong> to $1,487.8 million due primarily to net income of$263.2 million and net increases in common stock andother capital of $43.1 million due to the tax impact of certainEmployee Stock Purchase and Savings Plan (ESOP)transactions and stock option activity. Partially offsettingsuch increases were cash dividends paid of $91.0 million,purchases of 6.7 million shares of Company common stockfor treasury at a cost of $157.1 million, and other comprehensivelosses related to foreign currency translations of$40.9 million. The Company acquires its own commonstock for general corporate purposes and, depending on itsfuture cash position and market conditions, it may acquireadditional shares in the future. In July <strong>2001</strong>, the Company’sBoard of Directors rescinded the previous authorizationlimit for treasury stock purchases and issued a new authorizationfor the Company to purchase, in the aggregate, 20.0million shares of its common stock. During the third andfourth quarters of <strong>2001</strong>, the Company acquired 3.0 millionshares of its common stock through open marketpurchases for treasury purposes. The Company had remainingauthorization at December 31, <strong>2001</strong> to purchase 17.0million shares of its common stock.The <strong>2001</strong> annual dividend of $.58 per share approximatedour payout ratio target of 30.0 percent of the prioryear’s earnings (based on net income before the impairmentof long-lived assets charge in 2000, net of tax). This annualdividend represented the twenty-second consecutive yearthat the dividend has increased and a compounded annualrate of increase of 23.5 percent since the dividend was reinstatedin the fourth quarter of 1979. At a meeting held onFebruary 6, 2002, the Board of Directors increased thequarterly dividend to $.15 per share.The changes in Cumulative other comprehensive lossconsisted solely of foreign currency translation adjustmentsfor all years presented in the Company’s ConsolidatedBalance Sheets. The increases in <strong>2001</strong> of $40.9 million andin 2000 of $18.0 million were attributable to weakness inseveral foreign operation’s functional currencies, while the1999 increase of $100.7 million occurred primarily due tothe devaluation of the Brazilian real. In January 2000, theBrazilian Central Bank eliminated its governmental policyof supporting and tightly managing the trading band of thereal and allowed it to trade freely in the open market againstother currencies. In January 2002, the Argentine governmentannounced plans to discontinue its currency boardpolicy of maintaining a one-to-one fixed exchange ratebetween the peso and U.S. dollar and will attempt to implementa controlled devaluation during 2002. Due to theuncertainty associated with this new currency policy, managementis unable at this time to accurately estimate thefuture impact of the foreign currency translation of theArgentine peso on comprehensive income. The change inthe currency translation rate of the Argentine peso is notexpected to have a material impact on the results of operationsof the International Coatings Segment.The Company’s past operations included the manufactureand sale of lead pigments and lead-based paints. TheCompany, along with other companies, is a defendant in anumber of legal proceedings, including purported classactions, separate actions brought by the State of RhodeIsland, and actions brought by various counties, cities,school districts and other government-related entities, arisingfrom the manufacture and sale of lead pigments andlead-based paints. The plaintiffs are seeking recovery basedupon various legal theories, including negligence, strict liability,breach of warranty, negligent misrepresentations andomissions, fraudulent misrepresentations and omissions,concert of action, civil conspiracy, violations of unfair tradepractices and consumer protection laws, enterprise liability,market share liability, nuisance, unjust enrichment andother theories. The plaintiffs seek various damages andrelief, including personal injury and property damage, costsrelating to the detection and abatement of lead-based paint22
MANAGEMENT’S DISCUSSION AND ANALYSIS OF FINANCIALCONDITION AND RESULTS OF OPERATIONSfrom buildings, costs associated with a public educationcampaign, medical monitoring costs and others. The Companybelieves that the litigation is without merit and isvigorously defending such litigation. The Company expectsthat additional lead pigment and lead-based paint litigationwill be filed against the Company in the future assertingsimilar or different legal theories and seeking similar or differenttypes of damages and relief.Litigation is inherently subject to many uncertainties.Adverse court rulings or determinations of liability, amongother factors, could affect the lead pigment and lead-basedpaint litigation against the Company and encourage anincrease in the number and nature of future claims and proceedings.In addition, from time to time, various legislationand administrative regulations have been enacted or proposedto impose obligations on present and formermanufacturers of lead pigments and lead-based paintsrespecting asserted health concerns associated with suchproducts and to overturn court decisions in which the Companyand other manufacturers have been successful. Dueto the uncertainties involved, management is unable to predictthe outcome of the lead pigment and lead-based paintlitigation, the number or nature of possible future claimsand proceedings, or the affect that any legislation and/oradministrative regulations may have on the litigation oragainst the Company. In addition, management cannot reasonablydetermine the scope or amount of the costs andpotential liabilities related to such litigation, or any suchlegislation and regulations. The Company has not accruedany amounts for such litigation. Any costs that may beincurred or potential liabilities that may result from suchlitigation or such legislation and regulations cannot reasonablybe estimated. However, based upon, among otherthings, the outcome of such litigation to date, managementdoes not currently believe that the costs or potential liabilitiesultimately determined to be attributable to theCompany arising out of such litigation will have a materialadverse effect on the Company’s results of operations,liquidity or financial condition.The operations of the Company, like those of other companiesin our industry, are subject to various federal, stateand local environmental laws and regulations. These lawsand regulations not only govern our current operations andproducts, but also impose potential liability on the Companyfor past operations which were conducted utilizingpractices and procedures that were considered acceptableunder the laws and regulations existing at that time. TheCompany expects environmental laws and regulations toimpose increasingly stringent requirements upon the Companyand our industry in the future. The Company believesthat it conducts its operations in compliance with applicableenvironmental laws and regulations and hasimplemented various programs designed to protect the environmentand promote continued compliance.Depreciation of capital expenditures and other expensesrelated to ongoing environmental compliance measuresare included in the normal operating expenses of conductingbusiness. The Company’s capital expenditures,depreciation and other expenses related to ongoing environmentalcompliance measures were not material to theCompany’s financial condition, results of operations or liquidityduring <strong>2001</strong>, and the Company does not expect thatsuch capital expenditures and other expenses will be materialto the Company’s financial condition, results ofoperations or liquidity in 2002.The Company is involved with environmental compliance,investigation and remediation activities at some of itscurrent and former sites (including sites which were previouslyowned and/or operated by businesses acquired by theCompany). The Company, together with other parties, hasalso been designated a potentially responsible party underfederal and state environmental protection laws for the investigationand remediation of environmental contaminationand hazardous waste at a number of third-party sites, primarilySuperfund sites. The Company may be similarly designatedwith respect to additional third-party sites in the future.The Company accrues for environmental-related activitiesrelating to its past operations and third-party sites,including Superfund sites, for which commitments or cleanupplans have been developed and for which costs can bereasonably estimated. These estimated costs are determinedbased on currently available facts regarding each site. TheCompany continuously assesses its potential liability forinvestigation and remediation-related activities and adjustsits environmental-related accruals as information becomesavailable upon which more accurate costs can be reasonablyestimated and as additional accounting guidelines areissued which require changing the estimated costs or theprocedure utilized in estimating such costs. Actual costsincurred may vary from these estimates due to the inherentuncertainties involved including, among others, the numberand financial condition of parties involved with respectto any given site, the volumetric contribution which maybe attributed to the Company relative to that attributed toother parties, the nature and magnitude of the wastesinvolved, the various technologies that can be used for remediationand the determination of acceptable remediationwith respect to a particular site. The Company’s environmental-relatedcontingent liabilities are expected to beresolved over an extended period of time.Pursuant to a Consent Decree entered into with the UnitedStates of America in 1997, on behalf of theEnvironmental Protection Agency, filed in the United StatesDistrict Court for the Northern District of Illinois, the Companyhas agreed, in part, to (i) conduct an investigation atits southeast Chicago, Illinois facility to determine the23
MANAGEMENT’S DISCUSSION AND ANALYSIS OF FINANCIALCONDITION AND RESULTS OF OPERATIONSnature, extent and potential impact, if any, of environmentalcontamination at the facility and (ii) implement remedialaction measures, if required, to address any environmentalcontamination identified pursuant to the investigation.While the Company continues to investigate this site, certaininitial remedial actions have occurred at this site.In 1999, the Company entered into a settlement agreementwith PMC, Inc. settling a lawsuit brought by PMCregarding the Company’s former manufacturing facility inChicago, Illinois which was sold to PMC in 1985. Pursuantto the terms of the settlement agreement, the Companyagreed, in part, to investigate and remediate, as necessary,certain soil and/or groundwater contamination caused byhistorical disposals, discharges, releases and/or events occurringat this facility. In 2000, the Company entered into aConsent Decree with the People of the State of Illinois settlingan action brought by the State of Illinois against theCompany regarding the PMC facility. Under the ConsentDecree, the Company agreed, in part, to investigate andremediate, as necessary, certain soil and/or groundwatercontamination caused by historical disposals, discharges,releases and/or events occurring at this facility. The Companyis currently conducting its investigation of this facility.With respect to the Company’s southeast Chicago, Illinoisfacility and the PMC facility, the Company hasevaluated its potential liability and, based upon its investigationsto date, has accrued appropriate amounts. However,due to the uncertainties surrounding these facilities, theCompany’s ultimate liability may result in costs that aresignificantly higher than currently accrued. In such event,the recording of the liability may result in a material impacton net income for the annual or interim period during whichthe additional costs are accrued. The Company expects thecontingent liabilities related to these facilities to be resolvedover an extended period of time.The Company does not believe that any potential liabilityultimately attributed to the Company for itsenvironmental-related matters will have a material adverseeffect on the Company’s financial condition, liquidity, cashflow or, except as set forth in the preceding paragraph, netincome. See Note 9, on page 39 of this report, for discussionof the environmental-related accruals included in theCompany’s Consolidated Balance Sheets.The Company is exposed to market risk associated withinterest rates and foreign currency exposure. The Companyutilizes derivative instruments as part of its overallfinancial risk management policy, but does not use derivativeinstruments for speculative or trading purposes. TheCompany has partially hedged risks associated with fixedinterest rate debt by entering into various interest rate swapagreements (see Note 7, on page 38 of this report). TheCompany does not believe that any potential loss relatedto interest rate exposure will have a material adverse effecton the Company’s financial condition, results of operationsor cash flows. The Company also entered into foreign currencyoption and forward contracts to hedge against valuechanges in foreign currency (see Note 4, on page 35 of thisreport). The Company believes it may experience continuinglosses from foreign currency translation. However, theCompany does not expect currency translation, transactionor hedging contract losses to have a material adverse effecton the Company’s financial condition, results of operationsor cash flows.Results of Operations – <strong>2001</strong> vs 2000Consolidated net sales decreased 2.8 percent to $5.1 billionin <strong>2001</strong>. The most significant factors impacting salesduring the year came from the previously announced discontinuedpaint programs at certain customers in theConsumer Segment, continuing poor domestic and SouthAmerican economic conditions and continuing weaknessin foreign currency exchange rates. Excluding the effects ofthe previously announced discontinued paint programs,consolidated net sales would have been down 1.2 percentfor the year.Net external sales in the Paint Stores Segment during<strong>2001</strong> increased 0.7 percent to $3.21 billion as higher architecturalpaint sales offset sales shortfalls in the productfinishes and associated product categories. Sales in this Segmentcontinued to be impacted by the sluggish domesticeconomy and weakness in product finishes sales. Sales toprofessional painters and industrial maintenance usersshowed gains for the year. Comparable-store sales decreased1.3 percent in <strong>2001</strong>. This Segment ended <strong>2001</strong> with 2,573stores in operation compared to 2,488 stores in operationat the end of the prior year. The objective of the Paint StoresSegment is to expand its store base an average of roughlythree percent each year. In <strong>2001</strong>, the Segment added 85 netnew stores through new store openings or acquisition andexpects to add approximately 50 net new stores in 2002.External sales in the Consumer Segment decreased 9.0percent during <strong>2001</strong> to $1.1 billion. Excluding the previouslyannounced discontinued paint programs at certaincustomers, external sales for this Segment would havedecreased 2.4 percent for the year. Sales comparisons willbe impacted in the Consumer Segment for 2002 by the anticipatedloss of sales caused by the disposition of the CleaningSolutions Group business. This Segment also continues tobe impacted by the sluggish domestic economy, which isexpected to continue through 2002. The Segment’s plans for2002 include new product introductions and expansion ofits presence at certain retailers and new customer accountsin preparation of an eventual economic recovery. The pendingoutcome of a bankruptcy filing for reorganization by alarge retail customer may have an adverse effect on sales ofthis Segment. Management is unable to determine the poten-24
MANAGEMENT’S DISCUSSION AND ANALYSIS OF FINANCIALCONDITION AND RESULTS OF OPERATIONStial impact on sales at this time.External sales in the Automotive Finishes Segmentdecreased 5.9 percent during <strong>2001</strong> to $464.2 million dueprimarily to the continuing negative impact of the softdomestic economy on this Segment’s OEM sales that couldnot be offset by higher collision repair sales throughout theyear. The Company expects that stronger collision repairsales, an increase in the number of automotive branchesand sales from new product and color introductions willresult in a sales increase for this Segment in 2002.External sales in the International Coatings Segmentdecreased 8.9 percent to $279.6 million. The sales decreases,in U.S. dollars, were due primarily to unfavorablecurrency exchange rates. Excluding the effects of currencyexchange fluctuations relative to last year, net sales for theSegment increased 5.2 percent for <strong>2001</strong>. Net sales for theyear, in local currencies, continued to be impacted by competitivepricing and a shift in sales to lower priced productsdue to continued poor market and macroeconomic conditionsin Brazil and Argentina. The Company expects torealize only minimal sales volume improvements in theInternational Coatings Segment in 2002 as economic conditionsare not expected to improve in most South Americancountries in which we operate, especially in Argentinawhere a government controlled currency devaluation isbeing implemented during the beginning of 2002.Consolidated gross profit as a percent of sales decreasedto 43.8 percent from 44.3 percent in 2000. The Company’sgross profit margin was impacted by raw material costincreases, inflated energy costs and higher distribution costsduring the first half of the year for <strong>2001</strong> versus 2000. Additionally,gross profit was impacted by rising health care andother employee benefit costs. The Paint Stores Segment’s<strong>2001</strong> gross profit margin was flat versus 2000 as a favorablepaint product sales mix and selective selling priceincreases were offset by a charge of $2.1 million for thecosts associated with closing a manufacturing facility in theChemical Coatings Division. Gross profit margin in theConsumer Segment was below last year due to the salesshortfall and competitive pricing pressures that prohibitedselling price increases sufficient to offset higher year-overyearraw material, distribution and energy costs earlier inthe year. Gross profit margin was essentially flat versus lastyear in the Automotive Finishes Segment. Selective sellingprice increases, a favorable product sales mix, and provisionsfor qualified exit costs recorded in 2000 improved themargin comparison in this Segment, while lower productionvolume and higher raw material, distribution andenergy costs earlier in the year offset these improvements.Gross profit margin in the International Coatings Segmentdecreased primarily due to price competition and a marketshift in product sales to lower priced products in the faceof higher U.S. dollar denominated raw material costs.Consolidated selling, general and administrative expenses(SG&A) for <strong>2001</strong> were $1,729.9 million, which was$10.5 million below last year’s spending level. As a percentof sales, SG&A increased to 34.1 percent from 33.4 percentin 2000 due primarily to lower sales. Overall, SG&A in allSegments is being impacted by rising health care and otheremployee benefit costs. The Paint Stores Segment’s SG&Aratio was slightly unfavorable compared to last year primarilydue to incremental increases in expenses associatedwith the 85 stores added through new store openings oracquisition. In spite of the sluggish market conditions, thePaint Stores Segment continues to invest in its business byopening or acquiring stores and maintaining customer service.A slightly favorable SG&A ratio in the ConsumerSegment for <strong>2001</strong> as compared to last year was primarily aresult of certain SG&A cost reductions in response to lowersales activity. In dollar spending, Consumer Segment SG&Afor <strong>2001</strong> was approximately $37.0 million below last year.The Automotive Finishes Segment’s SG&A was higher forthe year as the Segment continued some incremental spendingin order to maintain its market share and customerservice levels in a competitive market. The InternationalCoatings Segment’s SG&A was favorable for the year dueprimarily to weaker foreign currencies and the effect on statingSG&A in U.S. dollars. As a percent of sales, thisSegment’s SG&A ratio increased due to lower sales volume.Consolidated segment operating profit for <strong>2001</strong>increased to $424.4 million or 8.4 percent of sales comparedto $143.4 million or 2.8 percent of sales in 2000.During the fourth quarter of 2000, the Company recognizedan asset impairment charge of $352.0 million againstsegment operating profit in the Consumer Segment toreduce the carrying values of certain long-lived assets, primarilygoodwill, to their estimated fair values. Excludingthe asset impairment charge, consolidated segment operatingprofit would have been $495.4 million in 2000 or 9.5percent of sales. Segment operating profit of the Paint StoresSegment decreased to $390.5 million or 12.2 percent ofsales as a favorable paint product sales mix and selectiveselling price increases could not offset the expense associatedwith closing a manufacturing facility in the ChemicalCoatings Division and the incremental expenses related tonew store openings. The Consumer Segment’s operatingprofit declined to $108.2 million or 9.8 percent of externalsales due primarily to the sales shortfall and competitivepricing pressures that prohibited selling price increases sufficientto offset higher year-over-year raw material,distribution and energy costs earlier in the year. Segmentoperating profit of the Automotive Finishes Segmentdecreased to $51.2 million or 11.0 percent of external salesprimarily due to lower production volume and higher rawmaterial, distribution and energy costs earlier in the yearand incremental SG&A spending in order to maintain its25
MANAGEMENT’S DISCUSSION AND ANALYSIS OF FINANCIALCONDITION AND RESULTS OF OPERATIONSmarket share and customer service levels in a competitivemarket. Segment operating profit of the International CoatingsSegment decreased to $4.9 million or 1.8 percent ofexternal sales primarily due to increased price competitionand a market shift in product sales to lower priced productsin the face of higher U.S. dollar denominated raw materialcosts. There are certain risks in transacting businessinternationally, such as changes in applicable laws and regulatoryrequirements, political instability, general economicand labor conditions, fluctuations in currency exchangerates and expatriation restrictions, which could adverselyaffect the financial condition or results of operation of theCompany’s consolidated foreign subsidiaries. Corporateexpenses decreased in <strong>2001</strong> primarily due to the reductionin certain information systems expenses and decreasedinterest expense which were partially offset by increasesin certain unallocated employee benefit expenses. Referto Note 16, on pages 44 through 46 of this report, foradditional reportable segment information.Interest expense decreased in <strong>2001</strong> primarily due tolower average short-term debt outstanding and rates.However, interest coverage decreased to 8.8 times in <strong>2001</strong>versus 9.0 times in 2000, excluding the effects of the assetimpairment charge, due primarily to lower income beforeincome taxes in <strong>2001</strong>. Fixed charge coverage, which iscalculated using interest and rent expense, decreased to 5.2times in <strong>2001</strong> from 5.7 times in 2000, excluding the effectsof the asset impairment charge.Interest and net investment income decreased in <strong>2001</strong>primarily due to lower average balances of cash and cashequivalents, partially offset by higher average yields. Otherexpense - net for <strong>2001</strong> was essentially flat with 2000, as gainsfrom the sale of certain assets were partially offset by provisionsfor environmental matters in <strong>2001</strong>. See Note 4, on page35 of this report, for further detail on Other expense - net.As shown in Note 13, on page 43 of this report, the effectiveincome tax rate increased to 38.0 percent in <strong>2001</strong> from37.5 percent in 2000, excluding the effects of the asset impairmentcharge, due to the impact of certain investment vehicles.Net income increased in <strong>2001</strong> to $263.2 million from$16.0 million in 2000. Net income per share-dilutedincreased to $1.68 per share compared to $.10 per sharelast year. See Note 15, on page 44 of this report, for detailedcomputations. Excluding the effects of the asset impairmentcharge in 2000, net income for 2000 was $309.7 millionand net income per share-diluted was $1.90 per share.Results of Operations – 2000 vs 1999Consolidated net sales increased 4.2 percent to $5.2 billionin 2000, primarily due to increased sales in the PaintStores, Automotive Finishes and International CoatingsSegments that were partially offset by decreased sales in theConsumer Segment.Net external sales in the Paint Stores Segment during2000 increased 6.1 percent to $3.2 billion as higher volumesales of paint products outpaced increases in the stores’other product lines (wallcoverings, floorcoverings, sprayequipment and associated products) with sales to professionalpainters and industrial users showing the greatestgains. Comparable-store sales increased 3.7 percent in 2000.In 2000, the Segment added 92 net new stores and endedthe year with 2,488 stores in operation compared to 2,396stores in operation at the end of 1999.External sales in the Consumer Segment decreased 0.4percent during 2000 to $1.2 billion primarily due to a sluggishdomestic do-it-yourself market. New product launches,sales to new customers and increased sales to certain existingcustomers could not offset the effects of the sluggishretail market.External sales in the Automotive Finishes Segmentincreased 4.8 percent during 2000 to $493.4 million dueprimarily to the sales of vehicle refinish products. The softdomestic economy during the fourth quarter of 2000 negativelyimpacted this Segment’s OEM sales.External sales in the International Coatings Segment for2000 increased 2.6 percent to $307.0 million due primarilyto increased gallons sold. Sales in local currencies wereup 6.5 percent, while U.S. dollar comparisons were affectedby currency conversions. Net sales for 2000 continuedto be impacted by a shift in sales to lower priced productsand competitive pricing due to poor market conditions inSouth America, particularly in Argentina.Consolidated gross profit as a percent of sales decreasedin 2000 to 44.3 percent from 44.9 percent in 1999. TheCompany’s gross profit margin was impacted by raw materialcost increases, inflated energy costs and higherdistribution costs. The Paint Stores Segment’s 2000 grossprofit margin was slightly higher than 1999 primarily dueto increased paint volume sales, a favorable product salesmix and selective selling price increases. Gross profit marginin the Consumer Segment for 2000 was lower than 1999as competitive pricing pressures prohibited selling priceincreases sufficient to offset increased raw material costsand higher distribution costs. In addition, costs associatedwith new product launches and new customer start-upscould not be offset by volume related manufacturing efficienciesand certain cost reductions. Gross profit margindecreased in the Automotive Finishes Segment during 2000and was also unfavorably impacted by increased raw materialcosts. Gross profit margin in the International CoatingsSegment decreased primarily due to price competition,increased raw material costs and an unfavorable productsales mix to lower margin products in 2000.SG&A expenses for 2000 remained flat as a percent ofsales at 33.4 percent. Increased expenses in 2000 related tonew store openings, new products, new customers and the26
MANAGEMENT’S DISCUSSION AND ANALYSIS OF FINANCIALCONDITION AND RESULTS OF OPERATIONSconsolidation of two research facilities and division administrativefunctions into the automotive technology center.Offsetting these increased expenses was the reduction incosts in 2000 due to the completion in 1999 of the Company’sYear 2000 compliance project. The Paint StoresSegment’s 2000 SG&A ratio was slightly unfavorable comparedto 1999 primarily due to increased expenses relatedto 92 net new store openings. The Paint Stores Segmentcontinued its investment in expanding its business in spiteof the soft domestic economy during the latter part of 2000.A slightly favorable SG&A ratio in the Consumer Segmentfor 2000 as compared to 1999 was primarily a result of certainadministrative cost reductions partially offset bydecreased sales and increased costs of new product launchesand new customer start-ups. The Automotive FinishesSegment’s SG&A ratio in 2000 was also slightly favorablecompared to 1999 primarily due to higher sales volume partiallyoffset by severance and moving costs associated withthe consolidation of the Segment’s research and administrativefunctions into the newly purchased automotivetechnology center. The International Coatings Segment’sSG&A ratio for 2000 was unfavorable primarily due tohigher commissions in Brazil relating to increased sales, partiallyoffset by overall sales increases.During the fourth quarter of 2000, the Company recognizedan asset impairment charge of $352.0 million($293.6 million after-tax or $1.80 per diluted share) in theConsumer Segment to reduce the carrying values of certainlong-lived assets, primarily goodwill, to their estimatedfair values. Cash flow in 2000 was not affected by thisaccounting charge which is more fully described in Note 2on page 35 of this report. Accordingly, consolidated segmentoperating profit for 2000 was reduced to 2.8 percentof sales compared to 9.8 percent of sales in 1999.Excluding the asset impairment charge, consolidated segmentoperating profit in 2000 increased 1.1 percent butdeclined as a percent of sales to 9.5 percent from 9.8 percentin 1999. Segment operating profit of the Paint StoresSegment for 2000 increased 9.2 percent to 12.9 percent ofsales, as increased paint volume sales, a favorable productmix and selective selling price increases more than offsetincreased expenses related to new store openings. TheConsumer Segment’s 2000 operating profit, excluding theeffects of the asset impairment charge, declined 8.0 percentprimarily due to competitive pricing pressures thatdid not allow recovery of all increased raw material costsand higher distribution costs. Segment operating profitduring 2000 for the Automotive Finishes Segmentdecreased $5.3 million or 7.9 percent primarily due toincreased raw material costs and disposition and terminationof operations expenses of $6.8 million for tworesearch centers idled by the consolidation into the newautomotive technology center. See Note 5, on page 36 ofthis report, for additional disposition and termination ofoperations information. Segment operating profit of theInternational Coatings Segment decreased in 2000 to$17.7 million from $33.9 million in 1999 primarily due toincreased price competition, increased raw material costsand an unfavorable product sales mix to lower marginproducts. Corporate expenses decreased in 2000 primarilydue to the reduction in certain information systemsexpenses, including the completion of the Company’s Year2000 compliance project in 1999, partially offset byincreased interest expense and certain unallocatedemployee benefit expenses. Refer to Note 16, on pages 44through 46 of this report, for additional reportable segmentinformation.Interest expense increased slightly in 2000 primarily dueto higher average short-term debt outstanding and rates,partially offset by lower average long-term debt outstanding.As a result, interest coverage, excluding the effects ofthe asset impairment charge, remained unchanged from1999 at 9.0 times. Interest coverage in 2000, after recordingthe effects of the asset impairment charge, decreased to3.3 times. Fixed charge coverage, excluding the effects of theasset impairment charge, which is calculated using interestand rent expense, decreased to 5.7 times in 2000 from 5.8times in 1999. Fixed charge coverage in 2000, after recordingthe effects of the asset impairment charge, was 2.4 times.Interest and net investment income decreased in 2000primarily due to lower average cash and short-term investmentbalances, partially offset by higher average yields. SeeNote 4, on page 35 of this report, for further detail on Otherexpense - net. As shown in Note 13, on page 43 of thisreport, the effective income tax rate was 88.9 percent in2000 due to the effect of a portion of the asset impairmentcharge that was not deductible for tax purposes. Excludingthe effects of the asset impairment charge, the effectivetax rate declined to 37.5 percent from 38.0 percent in 1999.Net income decreased in 2000 to $16.0 million from$303.9 million in 1999 due primarily to the effects of theasset impairment charge. Net income per share-diluted for2000 was reduced to $.10 per share from $1.80 in 1999.See Note 15, on page 44 of this report, for detailed computations.Excluding the effects of the asset impairmentcharge, net income for 2000 increased 1.9 percent to $309.7million, and net income per share-diluted increased 5.6 percentto $1.90 per share.27
REPORT OF MANAGEMENTShareholdersThe <strong>Sherwin</strong>-<strong>Williams</strong> CompanyWe have prepared the accompanyingconsolidated financial statementsand related information included hereinfor the years ended December 31,<strong>2001</strong>, 2000 and 1999. The primaryresponsibility for the integrity of thefinancial information rests with management.This information is preparedin accordance with accounting principlesgenerally accepted in the UnitedStates, based upon our best estimatesand judgments and giving due considerationto materiality.The Company maintains accountingand control systems which aredesigned to provide reasonable assurancethat assets are safeguarded fromloss or unauthorized use and whichproduce records adequate for preparationof financial information. Thereare limits inherent in all systems ofinternal control based on the recognitionthat the cost of such systemsshould not exceed the benefits to bederived. We believe our systems providethis appropriate balance.The Board of Directors pursues itsresponsibility for these financial statementsthrough the Audit Committee,composed exclusively of independentdirectors. The Committee meets periodicallywith management, internalauditors and our independent auditorsto discuss the adequacy of financialcontrols, the quality of financialreporting and the nature, extent andresults of the audit effort. Both theinternal auditors and independentauditors have private and confidentialaccess to the Audit Committee at alltimes.C. M. ConnorChairman and ChiefExecutive OfficerS. P. HennessySenior Vice President - Finance,Treasurer and Chief FinancialOfficerJ. L. AultVice President -Corporate ControllerREPORT OF INDEPENDENT AUDITORSShareholders and Board of DirectorsThe <strong>Sherwin</strong>-<strong>Williams</strong> CompanyCleveland, OhioWe have audited the accompanyingconsolidated balance sheets of The<strong>Sherwin</strong>-<strong>Williams</strong> Company and subsidiariesas of December 31, <strong>2001</strong>,2000 and 1999, and the related statementsof consolidated income,shareholders' equity and cash flowsfor each of the three years in the periodended December 31, <strong>2001</strong>. Thesefinancial statements are the responsibilityof the Company's management.Our responsibility is to express anopinion on these financial statementsbased on our audits.We conducted our audits in accordancewith auditing standards generallyaccepted in the United States.Those standards require that we planand perform the audit to obtain reasonableassurance about whether thefinancial statements are free of materialmisstatement. An audit includesexamining, on a test basis, evidencesupporting the amounts and disclosuresin the financial statements. Anaudit also includes assessing theaccounting principles used and significantestimates made by management,as well as evaluating the overallfinancial statement presentation.We believe that our audits provide areasonable basis for our opinion.In our opinion, the consolidatedfinancial statements referred to abovepresent fairly, in all material respects,the consolidated financial position ofThe <strong>Sherwin</strong>-<strong>Williams</strong> Company andsubsidiaries at December 31, <strong>2001</strong>,2000 and 1999, and the consolidatedresults of their operations and theircash flows for each of the three yearsin the period ended December 31,<strong>2001</strong>, in conformity with accountingprinciples generally accepted in theUnited States.Cleveland, OhioJanuary 25, 200228
STATEMENTS OF CONSOLIDATED INCOME(Thousands of Dollars Except Per Share Data)Year ended December 31,<strong>2001</strong> 2000 1999Net sales . . . . . . . . . . . . . . . . . . . . . . . . . . . . . . . . . . . . . . . . . . . . . . $ 5,066,005 $5,211,624 $5,003,837Cost of goods sold . . . . . . . . . . . . . . . . . . . . . . . . . . . . . . . . . . . . . . . 2,846,376 2,904,013 2,755,323Gross profit . . . . . . . . . . . . . . . . . . . . . . . . . . . . . . . . . . . . . . . . . . . . 2,219,629 2,307,611 2,248,514Percent to net sales . . . . . . . . . . . . . . . . . . . . . . . . . . . . . . . . . . . . 43.8% 44.3% 44.9%Selling, general and administrative expenses . . . . . . . . . . . . . . . . . . . 1,729,855 1,740,367 1,673,449Percent to net sales . . . . . . . . . . . . . . . . . . . . . . . . . . . . . . . . . . . . 34.1% 33.4% 33.4%Impairment of long-lived assets . . . . . . . . . . . . . . . . . . . . . . . . . . . . . 352,040Operating income . . . . . . . . . . . . . . . . . . . . . . . . . . . . . . . . . . . . . . . 489,774 215,204 575,065Percent to net sales . . . . . . . . . . . . . . . . . . . . . . . . . . . . . . . . . . . . 9.7% 4.1% 11.5%Interest expense . . . . . . . . . . . . . . . . . . . . . . . . . . . . . . . . . . . . . . . . 54,627 62,026 61,168Interest and net investment income . . . . . . . . . . . . . . . . . . . . . . . . . . (4,087) (4,981) (5,761)Other expense - net . . . . . . . . . . . . . . . . . . . . . . . . . . . . . . . . . . . . . . 14,785 14,753 29,540Income before income taxes . . . . . . . . . . . . . . . . . . . . . . . . . . . . . . . 424,449 143,406 490,118Income taxes . . . . . . . . . . . . . . . . . . . . . . . . . . . . . . . . . . . . . . . . . . 161,291 127,380 186,258Net income . . . . . . . . . . . . . . . . . . . . . . . . . . . . . . . . . . . . . . . . . . . . $ 263,158 $ 16,026 $ 303,860Net income per share:Basic . . . . . . . . . . . . . . . . . . . . . . . . . . . . . . . . . . . . . . . . . . . . . . . $ 1.69 $ .10 $ 1.81Diluted . . . . . . . . . . . . . . . . . . . . . . . . . . . . . . . . . . . . . . . . . . . . . $ 1.68 $ .10 $ 1.80See notes to consolidated financial statements.29
CONSOLIDATED BALANCE SHEETS(Thousands of Dollars)December 31,<strong>2001</strong> 2000 1999AssetsCurrent assets:Cash and cash equivalents . . . . . . . . . . . . . . . . . . . . . . . . . . . . . . $ 118,814 $ 2,896 $ 18,623Accounts receivable, less allowance . . . . . . . . . . . . . . . . . . . . . . . 523,278 594,162 606,046Inventories:Finished goods . . . . . . . . . . . . . . . . . . . . . . . . . . . . . . . . . . . . 530,916 597,472 591,912Work in process and raw materials . . . . . . . . . . . . . . . . . . . . . 101,847 106,255 111,476632,763 703,727 703,388Deferred income taxes . . . . . . . . . . . . . . . . . . . . . . . . . . . . . . . . 104,672 104,662 108,899Other current assets . . . . . . . . . . . . . . . . . . . . . . . . . . . . . . . . . . 127,418 146,092 141,143Total current assets . . . . . . . . . . . . . . . . . . . . . . . . . . . . . . . . . 1,506,945 1,551,539 1,578,099Goodwill . . . . . . . . . . . . . . . . . . . . . . . . . . . . . . . . . . . . . . . . . . . . 672,397 705,547 1,039,555Intangible assets . . . . . . . . . . . . . . . . . . . . . . . . . . . . . . . . . . . . . . . 247,489 259,085 274,924Deferred pension assets . . . . . . . . . . . . . . . . . . . . . . . . . . . . . . . . . 393,587 364,351 334,094Other assets . . . . . . . . . . . . . . . . . . . . . . . . . . . . . . . . . . . . . . . . . . 134,819 147,769 94,464Property, plant and equipment:Land . . . . . . . . . . . . . . . . . . . . . . . . . . . . . . . . . . . . . . . . . . . . . 64,447 65,546 62,517Buildings . . . . . . . . . . . . . . . . . . . . . . . . . . . . . . . . . . . . . . . . . . 441,418 431,524 431,802Machinery and equipment . . . . . . . . . . . . . . . . . . . . . . . . . . . . . 1,024,701 980,560 913,346Construction in progress . . . . . . . . . . . . . . . . . . . . . . . . . . . . . . 34,070 52,779 40,2621,564,636 1,530,409 1,447,927Less allowances for depreciation . . . . . . . . . . . . . . . . . . . . . . . . . 891,948 808,030 736,251672,688 722,379 711,676Total Assets . . . . . . . . . . . . . . . . . . . . . . . . . . . . . . . . . . . . . . . . . . $ 3,627,925 $ 3,750,670 $ 4,032,812Liabilities and Shareholders’ EquityCurrent liabilities:Short-term borrowings . . . . . . . . . . . . . . . . . . . . . . . . . . . . . . . . $ 106,854Accounts payable . . . . . . . . . . . . . . . . . . . . . . . . . . . . . . . . . . . . $ 454,410 448,799 $ 458,919Compensation and taxes withheld . . . . . . . . . . . . . . . . . . . . . . . . 141,640 137,211 140,934Current portion of long-term debt . . . . . . . . . . . . . . . . . . . . . . . . 111,852 12,920 119,949Other accruals . . . . . . . . . . . . . . . . . . . . . . . . . . . . . . . . . . . . . . 326,854 334,891 335,691Accrued taxes . . . . . . . . . . . . . . . . . . . . . . . . . . . . . . . . . . . . . . . 106,597 74,568 85,396Total current liabilities . . . . . . . . . . . . . . . . . . . . . . . . . . . . . . 1,141,353 1,115,243 1,140,889Long-term debt . . . . . . . . . . . . . . . . . . . . . . . . . . . . . . . . . . . . . . . 503,517 620,675 621,957Postretirement benefits other than pensions . . . . . . . . . . . . . . . . . . . 209,963 208,673 206,591Other long-term liabilities . . . . . . . . . . . . . . . . . . . . . . . . . . . . . . . . 285,328 334,215 364,843Shareholders’ equity:Preferred stock - convertible, participating, no par value:168,305 shares outstanding at December 31, <strong>2001</strong> . . . . . . . . . . 168,305Unearned ESOP compensation . . . . . . . . . . . . . . . . . . . . . . . . . . (168,305)Common stock - $1.00 par value: 153,978,356, 159,558,335and 165,663,601 shares outstanding at December 31, <strong>2001</strong>,2000 and 1999, respectively . . . . . . . . . . . . . . . . . . . . . . . . . . 208,031 206,848 206,309Other capital . . . . . . . . . . . . . . . . . . . . . . . . . . . . . . . . . . . . . . . 200,643 158,650 150,887Retained earnings . . . . . . . . . . . . . . . . . . . . . . . . . . . . . . . . . . . . 2,120,927 1,948,753 2,020,851Treasury stock, at cost . . . . . . . . . . . . . . . . . . . . . . . . . . . . . . . . (837,284) (678,778) (533,891)Cumulative other comprehensive loss . . . . . . . . . . . . . . . . . . . . . (204,553) (163,609) (145,624)Total shareholders’ equity . . . . . . . . . . . . . . . . . . . . . . . . . . . . 1,487,764 1,471,864 1,698,532Total Liabilities and Shareholders’ Equity . . . . . . . . . . . . . . . . . . . . $ 3,627,925 $ 3,750,670 $ 4,032,812See notes to consolidated financial statements.30
STATEMENTS OF CONSOLIDATED CASH FLOWS(Thousands of Dollars)Year ended December 31,<strong>2001</strong> 2000 1999Operating ActivitiesNet income . . . . . . . . . . . . . . . . . . . . . . . . . . . . . . . . . . . . . . . . . . $ 263,158 $ 16,026 $ 303,860Adjustments to reconcile net income to net operating cash:Impairment of long-lived assets . . . . . . . . . . . . . . . . . . . . . . . . . . 352,040Depreciation . . . . . . . . . . . . . . . . . . . . . . . . . . . . . . . . . . . . . . . . 109,187 108,906 105,350Deferred income taxes . . . . . . . . . . . . . . . . . . . . . . . . . . . . . . . . 15,677 (26,886) 21,170Provisions for qualified exit costs . . . . . . . . . . . . . . . . . . . . . . . . 5,302 3,304 6,331Impairment charges-net on assets held for disposal . . . . . . . . . . . 6,402 4,719 1,309Provisions for environmental-related matters . . . . . . . . . . . . . . . . 5,609 16,334Amortization of intangible assets . . . . . . . . . . . . . . . . . . . . . . . . . 38,911 51,124 50,394Defined benefit pension plans net credit . . . . . . . . . . . . . . . . . . . . (29,366) (29,629) (28,083)Income tax effect of ESOP on other capital . . . . . . . . . . . . . . . . . 22,902Net increase in postretirement liability . . . . . . . . . . . . . . . . . . . . . 2,990 3,682 3,428Foreign currency related losses . . . . . . . . . . . . . . . . . . . . . . . . . . 2,277 2,115 3,333Other . . . . . . . . . . . . . . . . . . . . . . . . . . . . . . . . . . . . . . . . . . . . . 1,101 9,980 15,546Change in working capital accounts:Decrease (increase) in accounts receivable . . . . . . . . . . . . . . . . . . 61,497 21,264 (28,212)Decrease (increase) in inventories . . . . . . . . . . . . . . . . . . . . . . . . 72,132 6,188 (24,420)Increase (decrease) in accounts payable . . . . . . . . . . . . . . . . . . . . 10,233 (21,790) 60,487Increase (decrease) in accrued taxes . . . . . . . . . . . . . . . . . . . . . . . 31,468 (11,744) 6,019Other . . . . . . . . . . . . . . . . . . . . . . . . . . . . . . . . . . . . . . . . . . . . . 17,035 (22,645) 3,650Unusual tax-related payment . . . . . . . . . . . . . . . . . . . . . . . . . . . . . (65,677)Increase in long-term accrued taxes . . . . . . . . . . . . . . . . . . . . . . . . . 419 10,005 15,715Payments for environmental - related matters . . . . . . . . . . . . . . . . . (17,565) (9,105) (15,808)Payments for qualified exit costs . . . . . . . . . . . . . . . . . . . . . . . . . . . (3,326) (6,173) (15,529)Other . . . . . . . . . . . . . . . . . . . . . . . . . . . . . . . . . . . . . . . . . . . . . . . 11,280 1,963 (13,808)Net operating cash . . . . . . . . . . . . . . . . . . . . . . . . . . . . . . . . . . . 561,646 463,344 487,066Investing ActivitiesCapital expenditures . . . . . . . . . . . . . . . . . . . . . . . . . . . . . . . . . . . . (82,572) (132,778) (134,171)Acquisitions of businesses . . . . . . . . . . . . . . . . . . . . . . . . . . . . . . . . (15,162) (60,108) (15,427)Increase in other investments . . . . . . . . . . . . . . . . . . . . . . . . . . . . . (16,614) (51,163) (23,435)Proceeds from sale of assets . . . . . . . . . . . . . . . . . . . . . . . . . . . . . . 9,866 7,670 9,409Other . . . . . . . . . . . . . . . . . . . . . . . . . . . . . . . . . . . . . . . . . . . . . . . 13,590 (16,659) (298)Net investing cash . . . . . . . . . . . . . . . . . . . . . . . . . . . . . . . . . . . (90,892) (253,038) (163,922)Financing ActivitiesNet (decrease) increase in short-term borrowings . . . . . . . . . . . . . . . (106,854) 106,854Increase in long-term debt . . . . . . . . . . . . . . . . . . . . . . . . . . . . . . . 8,487Payments of long-term debt . . . . . . . . . . . . . . . . . . . . . . . . . . . . . . (16,210) (116,344) (98,982)Payments of cash dividends . . . . . . . . . . . . . . . . . . . . . . . . . . . . . . (90,984) (88,124) (80,954)Proceeds from stock options exercised . . . . . . . . . . . . . . . . . . . . . . . 17,798 6,419 7,107Treasury stock purchased . . . . . . . . . . . . . . . . . . . . . . . . . . . . . . . . (157,088) (146,857) (145,806)Other . . . . . . . . . . . . . . . . . . . . . . . . . . . . . . . . . . . . . . . . . . . . . . . (786) 3,898 (2,225)Net financing cash . . . . . . . . . . . . . . . . . . . . . . . . . . . . . . . . . . . (354,124) (225,667) (320,860)Effect of exchange rate changes on cash . . . . . . . . . . . . . . . . . . . . . (712) (366) (2,794)Net increase (decrease) in cash and cash equivalents . . . . . . . . . . . . 115,918 (15,727) (510)Cash and cash equivalents at beginning of year . . . . . . . . . . . . . . . . 2,896 18,623 19,133Cash and cash equivalents at end of year . . . . . . . . . . . . . . . . . . . . $ 118,814 $ 2,896 $ 18,623Income taxes paid . . . . . . . . . . . . . . . . . . . . . . . . . . . . . . . . . . . . . $ 129,435 $ 156,514 $ 153,890Interest paid . . . . . . . . . . . . . . . . . . . . . . . . . . . . . . . . . . . . . . . . . . 55,769 64,400 61,868See notes to consolidated financial statements.31
STATEMENTS OF CONSOLIDATED SHAREHOLDERS’ EQUITY(Thousands of Dollars Except Per Share Data)CumulativeUnearnedOtherPreferred ESOP Common Other Retained Treasury ComprehensiveStock Compensation Stock Capital Earnings Stock Loss TotalBalance at January 1, 1999 . . . . . . $ 205,701 $ 143,686 $ 1,797,945 $(386,465) $ (44,927) $1,715,940Comprehensive income:Net income . . . . . . . . . . . . . . . 303,860 303,860Other comprehensive loss . . . . . (100,697) (100,697)Comprehensive income . . . . . 203,163Treasury stock purchased . . . . . . . . (145,806) (145,806)Stock issued (tendered)for exercise of options . . . . . . . . 463 8,597 (252) 8,808Stock tendered in connectionwith restricted stock grants . . . . (1,368) (1,368)Restricted stock grants(net activity) . . . . . . . . . . . . . . . 145 (69) 76Stock acquired for trust . . . . . . . . . (1,327) (1,327)Cash dividends — $.48 per share . . (80,954) (80,954)Balance at December 31, 1999 . . . . 206,309 150,887 2,020,851 (533,891) (145,624) 1,698,532Comprehensive income:Net income . . . . . . . . . . . . . . . 16,026 16,026Other comprehensive loss . . . . . (17,985) (17,985)Comprehensive loss . . . . . . . . (1,959)Treasury stock purchased . . . . . . . . (146,857) (146,857)Stock issued (tendered)for exercise of options . . . . . . . . 534 8,121 (365) 8,290Restricted stock grants(net activity) . . . . . . . . . . . . . . . 5 3,176 3,181Stock acquired for trust . . . . . . . . . (1,199) (1,199)Treasury stock transferred to trust . (2,335) 2,335Cash dividends — $.54 per share . . (88,124) (88,124)Balance at December 31, 2000 . . . . 206,848 158,650 1,948,753 (678,778) (163,609) 1,471,864Comprehensive income:Net income . . . . . . . . . . . . . . . 263,158 263,158Other comprehensive loss . . . . . (40,944) (40,944)Comprehensive income . . . . . 222,214Treasury stock purchased . . . . . . . . (157,088) (157,088)Issuance of preferred stockto pre-fund ESOP . . . . . . . . . . . $ 250,000 $(250,000)Income tax effect of ESOP . . . . . . . 22,902 22,902Redemption of preferred stock . . . . (81,695) 81,695Stock issued (tendered)for exercise of options . . . . . . . . 1,031 19,947 (532) 20,446Stock tendered in connectionwith restricted stock grants . . . . (886) (886)Restricted stock grants(net activity) . . . . . . . . . . . . . . . 152 979 1,131Stock acquired for trust . . . . . . . . . (1,835) (1,835)Cash dividends — $.58 per share . . (90,984) (90,984)Balance at December 31, <strong>2001</strong> . . . . $ 168,305 $(168,305) $ 208,031 $ 200,643 $ 2,120,927 $(837,284) $ (204,553) $1,487,764See notes to consolidated financial statements.32
NOTES TO CONSOLIDATED FINANCIAL STATEMENTS(Thousands of Dollars Unless Otherwise Indicated)Note 1 – Significant AccountingPoliciesConsolidation. The consolidated financial statementsinclude all controlled subsidiaries. Inter-company accountsand transactions have been eliminated.Use of estimates. The preparation of consolidated financialstatements in conformity with accounting principlesgenerally accepted in the United States requires managementto make estimates and assumptions that affect theamounts reported in the consolidated financial statementsand accompanying notes. Actual results could differ fromthose estimates.Nature of operations. The Company is engaged in themanufacture, distribution and sale of coatings and relatedproducts to professional, industrial, commercial and retailcustomers primarily in North and South America.<strong>Report</strong>able segments. See Note 16.Cash flows. The Company considers all highly liquidinvestments with a maturity of three months or less whenpurchased to be cash equivalents.Fair value of financial instruments. The following methodsand assumptions were used by the Company in estimatingits fair value disclosures for financial instruments:Cash and cash equivalents: The carrying amountsreported in the consolidated balance sheets for cash andcash equivalents approximate fair value.Short-term investments: The carrying amounts reportedin the consolidated balance sheets for marketable debtand equity securities are based on quoted market pricesand approximate fair value.Investments in securities: The Company maintains certainlong-term investments, classified as available forsale securities, in a fund to provide for payment of healthcare benefits of certain qualified employees. The estimatedfair values of these securities, included in Otherassets, of $10,182, $15,913, and $21,093 at December31, <strong>2001</strong>, 2000, and 1999, respectively, are based onquoted market prices.Long-term debt (including current portion): The fair valuesof the Company’s publicly traded debentures, shownbelow, are based on quoted market prices. The fair valuesof the Company’s non-traded debt, also shown below,are estimated using discounted cash flow analyses, basedon the Company’s current incremental borrowing ratesfor similar types of borrowing arrangements. See Note 7for the fair value of interest rate swap contracts.December 31,<strong>2001</strong> 2000 1999Carrying Fair Carrying Fair Carrying FairAmount Value Amount Value Amount ValuePubliclytradeddebt ........ $603,762 $598,529 $613,709 $592,113 $726,017 $698,031Non-tradeddebt ........ 13,184 12,571 19,886 17,752 15,889 14,792Derivative instruments: The Company adoptedStatement of Financial Accounting Standards (SFAS)No. 133, “Accounting for Derivative Instruments andHedging Activities,” as amended, effective January1, <strong>2001</strong> with no impact on the Company’s results ofoperations, liquidity or financial condition. SFAS No.133 requires all derivative instruments to be recordedas either assets or liabilities at fair value. Gains orlosses resulting from changes in the values of thosederivative instruments may be recognized immediatelyor deferred depending on the use of thederivative or whether it’s designated as a hedge. TheCompany utilizes derivative instruments as part ofits overall financial risk management policy. TheCompany does not use derivative instruments forspeculative or trading purposes. The Companyentered into interest rate swap contracts during <strong>2001</strong>primarily to hedge against interest rate risks. See Note7. The Company also entered into option and forwardcurrency exchange contracts in <strong>2001</strong> primarilyto hedge against foreign currency risk exposure. SeeNote 4.Non-traded investments: It was not practicable toestimate the fair value of the Company’s investmentin certain non-traded investments because of the lackof quoted market prices and the inability to estimatefair values without incurring excessive costs. The carryingamounts, included in Other assets, of $13,771,$25,143, and $15,860 at December 31, <strong>2001</strong>, 2000,and 1999, respectively, represent the Company’s bestestimate of current economic values of these investments.Investment in life insurance. The Company invests inbroad-based corporate owned life insurance. The cash surrendervalues of the policies, net of policy loans, areincluded in Other assets. The net expense associated withsuch investment is included in Other expense - net. Suchexpense was immaterial to Income before income taxes.Impairment of long-lived assets. The Company evaluatesthe recoverability of long-lived assets and the related estimatedremaining lives at each balance sheet date. TheCompany records an impairment or change in useful lifewhenever events or changes in circumstances indicate thatthe carrying amount may not be recoverable or the usefullife has changed in accordance with SFAS No. 121,“Accounting for the Impairment of Long-Lived Assets andfor Long-Lived Assets to be Disposed of.” See Note 2. SeeImpact of recently issued accounting standards below forinformation on SFAS No. 144, “Accounting for the Impairmentor Disposal of Long-Lived Assets.”Goodwill. Goodwill represents the cost in excess of fairvalue of net assets acquired in business combinations accountedfor by the purchase method and is amortized on a33
NOTES TO CONSOLIDATED FINANCIAL STATEMENTS(Thousands of Dollars Unless Otherwise Indicated)straight-line basis over the expected period of benefit rangingfrom 10 to 40 years for acquisitions prior to July 1, <strong>2001</strong>.Accumulated amortization of goodwill was $104,746,$84,827 and $107,365 at December 31, <strong>2001</strong>, 2000, and1999, respectively. See Note 2. The Company adopted SFASNo. 141, “Business Combinations,” which supersedesAccounting Principles Board Opinion (APBO) No. 16, asrequired on July 1, <strong>2001</strong>. SFAS No. 141 eliminates the pooling-of-interestsmethod of accounting for businesscombinations and changes the criteria to recognize intangibleassets apart from goodwill. The adoption of this statementhad no impact on the Company’s results of operations, liquidityor financial condition. See Impact of recently issuedaccounting standards below for information on SFAS No.142, “Goodwill and Other Intangible Assets.”Intangibles. Intangible assets include non-competecovenants, operating rights, patents, and trademarks. Theseassets are amortized on a straight-line basis over the expectedperiod of benefit ranging from 2 to 40 years.Accumulated amortization of intangible assets, net of writeoffsof fully amortized intangible assets in <strong>2001</strong>, was$87,897, $129,320, and $119,125 at December 31, <strong>2001</strong>,2000, and 1999, respectively.Property, plant and equipment. Property, plant and equipmentis stated on the basis of cost. Depreciation is providedprincipally by the straight-line method. The major classesof assets and ranges of depreciation rates are as follows:Buildings ......................................... 2% - 6-2/3%Machinery and equipment .............. 4% - 20%Furniture and fixtures ..................... 5% - 33-1/3%Automobiles and trucks ................ 10% - 33-1/3%Letters of credit. The Company occasionally enters intostandby letter of credit agreements to guarantee variousoperating activities. These agreements, which expire in2002, provide credit availability to the various beneficiariesif certain contractual events occur. Amounts outstandingunder these agreements totaled $14,400, $12,230, and$14,177 at December 31, <strong>2001</strong>, 2000, and 1999, respectively.Foreign currency translation. All consolidated non-highlyinflationary foreign operations use the local currency ofthe country of operation as the functional currency andtranslate the local currency asset and liability accounts atyear-end exchange rates while income and expense accountsare translated at average exchange rates. The resulting translationadjustments are included in Cumulative othercomprehensive loss, a component of Shareholders’ equity.Comprehensive income. Cumulative other comprehensiveloss consisted solely of foreign currency translation adjustmentsfor all years presented.Revenue recognition. Substantially all revenues are recognizedwhen products are shipped and title has passed tounaffiliated customers.Technical expenditures. Total technical expendituresinclude research and development costs, quality control,product formulation expenditures and other similar items.Research and development costs included in technicalexpenditures were $37,193, $33,927, and $27,200 for<strong>2001</strong>, 2000, and 1999, respectively.Advertising expenses. The cost of advertising is expensedas incurred. The Company incurred $236,259, $276,078,and $265,411 in advertising costs during <strong>2001</strong>, 2000, and1999, respectively.Environmental matters. Capital expenditures for ongoingenvironmental compliance measures are recorded in the consolidatedbalance sheets, and related expenses are includedin the normal operating expenses of conducting business.The Company is involved with environmental compliance,investigation and remediation activities at some of its currentand former sites and at a number of third-party sites.The Company accrues for certain environmental remediation-relatedactivities for which commitments or clean-upplans have been developed and for which costs can be reasonablyestimated. All accrued amounts are recorded on anundiscounted basis. Accrued environmental remediationrelatedexpenses include direct costs of remediation andindirect costs related to the remediation effort, such as compensationand benefits for employees directly involved in theremediation activities and fees paid to outside engineering,consulting and law firms. See Notes 4 and 9.Stock-based compensation. The Company uses theintrinsic value method of accounting for stock-based compensationin accordance with APBO No. 25. See Note 12for pro forma disclosure of net income and earnings pershare under the fair value method of accounting for stockbasedcompensation as prescribed by SFAS No. 123,“Accounting for Stock-Based Compensation.”Earnings per share. Shares of preferred stock held in anunallocated account of the ESOP (see Note 10) and commonstock held in a revocable trust (see Note 11) are notconsidered outstanding shares for basic or diluted netincome per share calculations. All references to “shares orper share information” throughout this report relate tocommon shares, unless otherwise indicated. Basic netincome per share is computed based on the weighted-averagenumber of shares outstanding during the year. Dilutednet income per share is computed based on the weightedaveragenumber of shares outstanding plus all dilutivesecurities potentially outstanding during the year. See Note15. All references to net income or losses per share throughoutthis report are stated on a diluted per share basis, unlessotherwise indicated.Impact of recently issued accounting standards. During<strong>2001</strong>, the FASB issued SFAS No. 142, “Goodwill and OtherIntangible Assets,” which supersedes APBO No. 17, “IntangibleAssets.” Goodwill and intangible assets deemed to34
NOTES TO CONSOLIDATED FINANCIAL STATEMENTS(Thousands of Dollars Unless Otherwise Indicated)have indefinite lives will no longer be amortized but will besubject to impairment tests in accordance with SFAS No.142. Other intangible assets will continue to be amortizedover their useful lives. This statement is effective for fiscalyears beginning after December 15, <strong>2001</strong> for goodwill andintangible assets acquired before July 1, <strong>2001</strong>. However, thisstatement was effective July 1, <strong>2001</strong> for all goodwill andintangible assets acquired after June 30, <strong>2001</strong>. The Companyhas adopted or will adopt SFAS No. 142 in the requiredperiods. Application of the non-amortization provisions ofthe statement is expected to increase net incomeapproximately $24.7 million for the full year 2002. Prior tothe end of the first and second quarters of 2002, theCompany will perform the required impairment tests ofintangible assets deemed to have indefinite lives and the firststep in testing goodwill for impairment, respectively, as ofJanuary 1, 2002. Management has not yet determined theeffect on the Company’s results of operations, financial conditionor liquidity of any potential impairments resulting fromsuch tests. Also during <strong>2001</strong>, the FASB issued SFAS No. 144,“Accounting for the Impairment or Disposal of Long-LivedAssets,” which supercedes SFAS No. 121 and parts of APBONo. 30. SFAS No. 144 is effective for fiscal years beginningafter December 15, <strong>2001</strong>. This statement retains many of thefundamental provisions of SFAS No. 121 relating to assetsto be held and used, but excludes goodwill and intangibleassets that are not amortized. This statement also supercedesthe accounting and reporting provisions for the disposal ofa segment of a business found in APBO No. 30. The Companywill adopt this statement as required, and management doesnot believe the adoption will have a material effect on the Company’sresults of operations, financial condition or liquidity.Reclassification. Certain amounts in the 2000 and 1999consolidated financial statements have been reclassified toconform with the <strong>2001</strong> presentation.Note 2 – Impairment of Long-LivedAssetsDuring the fourth quarter of 2000, the Company recognizedan impairment charge of $352,040 ($293,628 aftertax or $1.80 per share) to reduce the carrying values of certainlong-lived assets to their estimated fair values. Chargesof $342,522 reduced goodwill while the remaining portionof the charge primarily reduced fixed assets. The impairedassets are part of the Consumer Segment related to the previousacquisitions of Thompson Minwax Holding Corp.and Pratt & Lambert United, Inc., and purchases of theassets of Sunshine Quality Products, Inc. and the Householdand Professional Products Division of Grow Group, Inc.Current losses, cash flow deficiencies and cash flow shortfallsfrom expectations indicated an impairment review wasnecessary. Undiscounted future cash flows estimated by managementestablished that impairment existed. The amountof impairment was estimated using a discounted cash flowvaluation technique incorporating a discount rate commensuratewith the risks involved for each group of assets.Note 3 – InventoriesInventories are stated at the lower of cost or market withcost determined principally on the last-in, first-out (LIFO)method which provides a better matching of current costsand revenues. The following presents the effect on inventories,net income and net income per share had theCompany used the first-in, first-out (FIFO) inventory valuationmethod adjusted for income taxes at the statutoryrate and assuming no other adjustments. This informationis presented to enable the reader to make comparisons withcompanies using the FIFO method of inventory valuation.<strong>2001</strong> 2000 1999Percentage of total inventorieson LIFO .......................................... 88% 89% 90%Excess of FIFO over LIFO .................. $ 112,669 $ 110,124 $ 97,953Decrease in net income due to LIFO .. (1,567) (7,916) (894)Decrease in net incomeper share due to LIFO...................... (.01) (.05) (.01)Note 4 – Other Expense - NetA summary of significant items included in Otherexpense - net is as follows:<strong>2001</strong> 2000 1999Dividend and royalty income .......... $ (3,922) $ (4,144) $ (4,692)Net (income) expense of financingand investing activities ................ (1,796) 10,926 7,084Provisions for environmentalmatters - net (see Note 9) ............ 5,609 15,402Disposition and terminationof operations expense - net(see Note 5) .................................. 7,304 6,968 3,830Foreign currency related losses ........ 2,277 2,115 3,333Other expense (income).................... 5,313 (1,112) 4,583$ 14,785 $ 14,753 $ 29,540The net (income) expense of financing and investingactivities represents the net realized gains or losses fromdisposing of fixed assets, the net gain or loss associated withthe investment in certain long-term asset funds, the net pretaxexpense associated with the Company’s investment inbroad-based corporate owned life insurance and other relatedfees.Foreign currency related losses include foreign currencytransaction losses and realized and unrealized gains andlosses from foreign currency option and forward contracts.All foreign currency option and forward contracts outstandingat December 31, <strong>2001</strong> have maturity dates of lessthan twelve months and are undesignated hedges with valuechanges being recognized currently in earnings in accordancewith SFAS No. 133. These derivative instrument35
NOTES TO CONSOLIDATED FINANCIAL STATEMENTS(Thousands of Dollars Unless Otherwise Indicated)values are included in either Other current assets or Otheraccruals on the balance sheet and were immaterial atDecember 31, <strong>2001</strong>. There were no foreign currency optionand forward contracts outstanding at December 31, 2000and 1999.Note 5 – Disposition and Terminationof OperationsThe Company is continually re-evaluating its operatingfacilities against its long-term strategic goals. Upon commitmentto a formal shutdown plan of an operating facility,provisions are made for all estimated qualified exit costs inaccordance with Emerging Issues Task Force No. 94-3,“Liability Recognition for Certain Employee TerminationBenefits and Other Costs to Exit an Activity” and otherrelated accounting guidance. Qualified exit costs includeprimarily post-closure rent expenses, incremental post-closurecosts and costs of employee terminations. Adjustmentsmay be made to prior provisions for qualified exit costs ifinformation becomes available upon which more accurateamounts can be reasonably estimated. Concurrently, property,plant and equipment is tested for impairment inaccordance with SFAS No. 121 and, if impairment exists,carrying value is reduced to estimated net fair value. Adjustmentsmay be made for subsequent revisions in estimatednet fair value, not to exceed original asset carrying valuebefore impairment.During the fourth quarter of <strong>2001</strong>, formal plans wereapproved to close two manufacturing facilities in the PaintStores and Consumer Segments. During 2000, two researchcenters in the Automotive Finishes Segment and a distributioncenter in the Consumer Segment were closed. In1999, two manufacturing facilities and a leased warehousewere closed in the Consumer Segment. Qualified exit costswere accrued and asset impairment charges recorded for allof these facilities. The following table summarizes dispositionand termination of operations activities.<strong>2001</strong> 2000 1999Qualified exit costs:Beginning accruals - January 1............ $ 17,903 $ 20,772 $ 29,970Provisions in Cost of goods sold ........ 4,400 1,055 3,810Adjustments to prior provisions inOther expense-net .......................... 902 2,249 2,521Actual expenditures charged to accrual (3,326) (6,173) (15,529)Ending accruals - December 31 .......... $ 19,879 $ 17,903 $ 20,772Impairment charges-net on assetsheld for disposal included inOther expense-net ............................ $ 6,402 $ 4,719 $ 1,309Impact on net income relating tothe disposition and terminationof operations:Decrease in net income .................. $ 7,608 $ 5,215 $ 4,966Decrease in net income per share .... $ 0.05 $ 0.03 $ 0.03Approximately 28 percent of the ending accrual for qualifiedexit costs at December 31, <strong>2001</strong> related to facilitiesshutdown in <strong>2001</strong> and 2000. The majority of expendituresrelated to these facilities are expected to be completed bythe end of 2003. The remaining portion of the ending accrualprimarily represents ongoing contractual expenses andpost-closure demolition expenses related to certain ownedfacilities that have been closed and are involved in ongoingenvironmental-related activities. The Company cannot reasonablyestimate when such matters will be concluded.Note 6 – Pension and Other BenefitsThe Company provides certain health care benefits foractive employees. The plans are contributory and containcost-sharing features such as deductibles and coinsurance.There were 16,512, 16,811, and 16,081 active employeesentitled to receive benefits under these plans as of December31, <strong>2001</strong>, 2000, and 1999, respectively. The cost ofthese benefits for active employees is recognized as claimsare incurred and amounted to $68,158, $58,782, and$52,640 for <strong>2001</strong>, 2000, and 1999, respectively. The Companyhas a fund, to which it no longer intends to contribute,that provides for payment of health care benefits of certainqualified employees. Distributions from the fund were$8,113, $7,410, and $6,421 in <strong>2001</strong>, 2000, and 1999,respectively.The Company provides pension benefits to substantiallyall employees through noncontributory defined benefitor defined contribution plans. The Company’s annual contributionfor its defined contribution pension plans, whichwas based on 5 percent of compensation for coveredemployees, was $35,991, $33,043, and $31,512 in <strong>2001</strong>,2000, and 1999, respectively. Beginning January 1, 2002,the annual contribution increased to 6 percent of compensationfor covered employees (see Note 10 for informationrelated to a reduction in other annual contributions). Assetsin employee accounts of the defined contribution pensionplan are invested in various mutual funds as directed by theparticipants. These mutual funds do not own a significantnumber of shares of the Company’s common stock.Employees of the Company who were hired prior toJanuary 1, 1993 and who are not members of a collectivebargaining unit, and certain groups of employees addedthrough acquisitions, are eligible for certain health careand life insurance benefits upon retirement from activeservice, subject to the terms, conditions and limitations ofthe applicable plans. There were 4,837, 4,855, and 4,831retired employees entitled to receive benefits as ofDecember 31, <strong>2001</strong>, 2000, and 1999, respectively. Theplans are unfunded.36
NOTES TO CONSOLIDATED FINANCIAL STATEMENTS(Thousands of Dollars Unless Otherwise Indicated)A summary of the obligation and assets of the defined benefit pension plans and postretirement health care and life insurancebenefits is as follows:Defined Benefit Pension Plans Other Postretirement Benefits<strong>2001</strong> 2000 1999 <strong>2001</strong> 2000 1999Benefit obligation:Balance at beginning of year . . . . . . . . . . . $ 194,879 $ 170,632 $ 169,099 $ 247,936 $ 225,686 $ 217,627Service cost . . . . . . . . . . . . . . . . . . . . . . . 2,952 2,990 3,237 3,753 3,821 4,215Interest cost . . . . . . . . . . . . . . . . . . . . . . . 13,092 12,504 11,516 16,301 15,649 14,467Actuarial loss (gain) . . . . . . . . . . . . . . . . . 5,339 8,957 (1,106) 14,012 15,930 966Plan amendments . . . . . . . . . . . . . . . . . . . 875 738Plan mergers . . . . . . . . . . . . . . . . . . . . . . 9,446Other - net . . . . . . . . . . . . . . . . . . . . . . . . 202 208 181Benefits paid . . . . . . . . . . . . . . . . . . . . . . . (13,491) (10,596) (12,295) (14,884) (13,150) (11,589)Balance at end of year . . . . . . . . . . . . . . . 203,848 194,879 170,632 267,118 247,936 225,686Plan assets:Balance at beginning of year . . . . . . . . . . . 554,454 523,453 492,384Actual return on plan assets . . . . . . . . . . . (1,551) 25,534 44,859Plan mergers . . . . . . . . . . . . . . . . . . . . . . 17,017Other - net . . . . . . . . . . . . . . . . . . . . . . . . (1,420) (954) (1,495)Benefits paid . . . . . . . . . . . . . . . . . . . . . . . (13,491) (10,596) (12,295)Balance at end of year . . . . . . . . . . . . . . . 537,992 554,454 523,453Excess (deficiency) of plan assetsover benefit obligation:Balance at end of year . . . . . . . . . . . . . . 334,144 359,575 352,821 (267,118) (247,936) (225,686)Unrecognized net asset . . . . . . . . . . . . . (1,279)Unrecognized actuarial loss (gain) . . . . . 56,734 2,080 (20,262) 51,134 37,752 21,993Unrecognized prior service cost (credit) . 2,345 2,320 2,404 (8,879) (11,689) (14,498)Net asset (liability) recognized in theconsolidated balance sheets . . . . . . . . . . . . $ 393,223 $ 363,975 $ 333,684 $(224,863) $(221,873) $(218,191)Net asset (liability) recognized in theconsolidated balance sheets consists of:Prepaid benefit cost . . . . . . . . . . . . . . . . $ 393,587 $ 364,351 $ 334,094Long-term accrued benefit liability . . . . . $(209,963) $(208,673) $(206,591)Amount included in current liabilities . . . (364) (376) (410) (14,900) (13,200) (11,600)$ 393,223 $ 363,975 $ 333,684 $(224,863) $(221,873) $(218,191)Weighted-average assumptionsas of December 31:Discount rate . . . . . . . . . . . . . . . . . . . . . 6.75% 7.00% 7.25% 6.75% 7.00% 7.25%Expected long-term rate of returnon assets . . . . . . . . . . . . . . . . . . . . . . . 8.50% 8.50% 8.50%Rate of compensation increase . . . . . . . . 4.50% 5.00% 5.00%Health care cost trend rate . . . . . . . . . . . 9.50% 6.00% 6.40%Net periodic benefit (credit) cost:Service and interest cost . . . . . . . . . . . . . . $ 16,044 $ 15,494 $ 14,753 $ 20,054 $ 19,470 $ 18,682Net amortization and deferral . . . . . . . . . . 943 (490) (699) (2,149) (2,814) (2,768)Expected return on assets . . . . . . . . . . . . . (46,353) (44,633) (42,137)Net periodic benefit (credit) cost . . . . . . . . $ (29,366) $ (29,629) $ (28,083) $ 17,905 $ 16,656 $ 15,91437
NOTES TO CONSOLIDATED FINANCIAL STATEMENTS(Thousands of Dollars Unless Otherwise Indicated)At December 31, <strong>2001</strong>, defined benefit pension planassets included 2,025,200 shares of the Company's commonstock with a market value of $55,693, which was 10.4percent of total plan assets. Dividends received during theyear from Company stock was $1,246.The assumed health care cost trend rate is 8.9 percent for2002 decreasing gradually to 5.5 percent for 2010 andthereafter. Assumed health care cost trend rates have a significanteffect on the amounts reported for the health careplans. A one-percentage-point change in assumed healthcare cost trend rates would have the following effects as ofDecember 31, <strong>2001</strong>:One-Percentage-PointIncrease (Decrease)Effect on total of service and interestcost components ...................................... $ 611 $ (592)Effect on the postretirement benefitobligation ................................................ $ 8,889 $ (8,576)Note 7 – Long-Term DebtDue Date <strong>2001</strong> 2000 19996.85% Notes .................. 2007 $ 199,839 $ 199,807 $ 199,7757.375% Debentures ........ 2027 149,914 149,910 149,9077.45% Debentures .......... 2097 149,414 149,408 149,4026.5% Notes .................... 2002 99,989 99,9789.875% Debentures ........ 2016 1,500 11,500 15,9005% to 8.5% ThroughPromissory Notes........ 2005 3,319 8,882 5,75210.25% Promissory Notepartially secured by Throughland and building........ 2003 1,108 1,179 1,243Long-term debt beforeSFAS No. 133adjustments ................ 505,094 620,675 621,957Fair value adjustmentsto 6.85% Notes inaccordance withSFAS No.133 .............. (1,577)$ 503,517 $ 620,675 $ 621,957Maturities of long-term debt are as follows for the nextfive years: $111,852 in 2002; $4,087 in 2003; $125 in2004; $215 in 2005, and zero in 2006.Interest expense on long-term debt was $44,582,$46,569, and $55,415 for <strong>2001</strong>, 2000, and 1999, respectively.During <strong>2001</strong>, the Company entered into four separateinterest rate swap contracts with a bank to hedge againstchanges in the fair value of a portion of the Company’s6.85% Notes. Each interest rate swap contract had a notionalamount of $25,000. The Company has agreed to receiveinterest at a fixed rate of 6.85% and pay interest at six-monthLondon Interbank Offered Rates plus points that vary bycontract. These contracts have been designated as perfectfair value hedges of the 6.85% Notes. Accordingly, changesin the fair value of these contracts are recorded as assets orliabilities and offset changes in the carrying value of the6.85% Notes. The fair value of the interest rate swap contractsrepresents unrealized losses of $1,577 at December31, <strong>2001</strong> and is included in Other long-term liabilities onthe balance sheet. The weighted average interest rate on thesecontracts was 3.98% at December 31, <strong>2001</strong>. Managementbelieves the risk of incurring losses related to credit risk ofthese contracts is remote. There were no interest rate swapagreements outstanding at December 31, 2000 and 1999.The Company has 364-day and multi-year amendedrevolving credit agreements. The current agreements witheffective dates of December 28, <strong>2001</strong> and January 3, <strong>2001</strong>reflect the following: 1) a 364-day agreement aggregating$112,200 expiring on December 27, 2002; and 2) a multiyearagreement aggregating $638,400, with $30,400,$190,400, and $417,600 expiring on January 3, 2003,2005, and 2006, respectively. There were no borrowingsoutstanding under any revolving credit agreement duringall years presented.At December 31, 2000, borrowings outstanding underthe commercial paper program totaled $106,854 and areincluded in Short-term borrowings on the balance sheet.The weighted-average interest rate related to these borrowingswas 6.6% at December 31, 2000. There were noborrowings outstanding under this program at December31, <strong>2001</strong> and 1999, respectively. The Company uses therevolving credit agreements to satisfy its commercial paperprogram’s dollar for dollar liquidity requirement. The aggregatemaximum borrowing capacity under the currentrevolving credit agreements as of December 28, <strong>2001</strong> limitsthe commercial paper program to a maximum borrowingcapability of $750,600.On October 6, 1997, the Company issued $50,000 ofdebt securities consisting of 5.5% notes, due October 15,2027, with provisions that the holders, individually or inthe aggregate, may exercise a put option on October 15,1999 and annually thereafter that would require the Companyto repay the securities. On October 15, 2000 and1999, individual debt security holders exercised put optionsrequiring the Company to repay $7,960 and $38,945 ofthese debt securities. The remaining balance of $3,095 atDecember 31, <strong>2001</strong> and 2000 and $11,055 at December31, 1999 of these debt securities are included in Currentportion of long-term debt on the balance sheets.On December 24, 1997, the Company filed a shelf registrationwith the Securities and Exchange Commissioncovering $150,000 of unsecured debt securities with maturitiesgreater than nine months from the date of issue. TheCompany may issue these securities from time to time inone or more series and will offer the securities on termsdetermined at the time of sale. There were no borrowingsoutstanding under this registration at December 31, <strong>2001</strong>,2000, and 1999.38
NOTES TO CONSOLIDATED FINANCIAL STATEMENTS(Thousands of Dollars Unless Otherwise Indicated)On August 18, 1998, the Company filed a universal shelfregistration statement with the Securities and Exchange Commissionto issue debt securities, common stock and warrantsup to $1,500,000. The registration was effective September8, 1998. There were no borrowings outstanding under thisregistration at December 31, <strong>2001</strong>, 2000, and 1999.Note 8 – Operating LeasesThe Company leases certain stores, warehouses, manufacturingfacilities, office space and equipment. Renewaloptions are available on the majority of leases and, undercertain conditions, options exist to purchase certain properties.Rental expense for operating leases was $141,072,$130,552, and $123,084 for <strong>2001</strong>, 2000, and 1999, respectively.Certain store leases require the payment of contingentrentals based on sales in excess of specified minimums. Contingentrentals included in rent expense were $13,479,$12,423, and $11,530 in <strong>2001</strong>, 2000, and 1999, respectively.Rental income, as lessor, from real estate leasingactivities and sublease rental income for all years presentedwas not significant.Following is a schedule, by year and in the aggregate, offuture minimum lease payments under noncancellable operatingleases having initial or remaining terms in excess ofone year at December 31, <strong>2001</strong>:2002 ................................................ $ 104,2752003 ................................................ 85,4302004 ................................................ 68,7352005 ................................................ 51,9872006 ................................................ 33,771Later years ........................................ 81,530Total minimum lease payments ........ $ 425,728Note 9 – Other Long-Term LiabilitiesIncluded in Other long-term liabilities at December 31,<strong>2001</strong>, 2000, and 1999 were accruals for extended environmental-relatedactivities of $111,003, $116,594 and$124,096, respectively. The accrual for extended environmental-relatedactivities represents the Company’sprovisions for estimated costs associated with some of itscurrent and former sites. Also, the Company, together withother parties, has been designated a potentially responsibleparty under federal and state environmental protection lawsfor the remediation of hazardous waste at a number ofthird-party sites, primarily Superfund sites. In general, theselaws provide that potentially responsible parties may beheld jointly and severally liable for investigation and remediationcosts regardless of fault. The Company provides for,and includes in Other long-term liabilities, its estimatedpotential long-term liability for investigation and remediationcosts with respect to such third-party sites.The Company initially provides for the estimated cost ofenvironmental-related activities relating to its current, formerand third-party sites when costs can be reasonablyestimated. These estimates are determined based on currentlyavailable facts regarding each site. If the best estimate of costscan only be identified as a range and no specific amount withinthat range can be determined more likely than any otheramount within the range, the minimum of the range isaccrued. Actual costs incurred may vary from these estimatesdue to the inherent uncertainties involved. The Companybelieves that any additional liability in excess of amountsprovided which may result from the resolution of such matterswill not have a material adverse effect on the financialcondition, liquidity or cash flow of the Company.Current environmental-related liabilities are included inOther accruals on the consolidated balance sheets.Note 10 – Stock Purchase Plan andPreferred StockAs of December 31, <strong>2001</strong>, 14,077 employees contributedto the Company’s Employee Stock Purchase and SavingsPlan (ESOP). Participants in the ESOP were allowed to contributeup to 11 percent of their annual compensation, upto 7 percent of which could be made on a pre-tax basis, topurchase common shares of the Company or invest in agovernment fund. Employees making contributions to purchaseCompany common stock received a matchingcontribution from the Company of 50 percent of theemployee’s pre and post-tax contributions, up to a maximumof 7 percent of their annual compensation, plus anadditional variable match based on the Company’s returnon equity (54 percent for the year ended <strong>2001</strong>). BeginningJanuary 1, 2002, participants will be allowed to contribute,on a pre-tax basis only, the lesser of 20 percent of theirannual compensation or the maximum dollar amountallowed under the Internal Revenue Code which may beinvested in a variety of mutual funds or Company commonstock. The Company will match such contributions up to6 percent of annual compensation with Company commonstock (see Note 6 for information related to an increase inother annual contributions). The ESOP was further amendedto provide all participants the ability to diversify prioremployee investments in Company common stock into avariety of mutual funds over a five year period. This rightto diversify was previously only available to participantsfifty-five years of age and older. The Company’s contributionto the ESOP charged to operations was $33,744,$28,070, and $36,535 for <strong>2001</strong>, 2000, and 1999, respectively.Additionally, the Company made contributions onbehalf of participating employees, representing amountsauthorized by employees to be withheld from their earnings,of $27,374, $26,636, and $22,581 in <strong>2001</strong>, 2000, and1999, respectively.At December 31, <strong>2001</strong>, there were 23,140,191 sharesof the Company’s common stock being held by the ESOP,representing 15.0 percent of the total number of voting39
NOTES TO CONSOLIDATED FINANCIAL STATEMENTS(Thousands of Dollars Unless Otherwise Indicated)shares outstanding. Shares of Company common stockcredited to each member’s account under the ESOP arevoted by the trustee under instructions from each individualplan member. Shares for which no instructions arereceived, along with any unallocated shares held in theESOP, are voted by the trustee in the same proportion asthose for which instructions are received.On April 18, <strong>2001</strong>, the Company issued 250,000 sharesof convertible participating serial preferred stock, no parvalue with cumulative quarterly dividends of ten dollars pershare, for $250,000 to the ESOP. The ESOP financed theacquisition of the preferred stock by borrowing $250,000from the Company at the rate of 8 percent per annum. Thisborrowing is payable over ten years in equal quarterly installments.Each share of preferred stock is entitled to one voteupon all matters presented to the Company’s shareholdersand generally vote with the common stock together as oneclass. The preferred stock will be held in an unallocatedaccount by the ESOP until compensation expense related tothe Company’s contributions is earned at which time contributionswill be credited to the members’ accounts. Thevalue of the preferred stock is redeemable and convertibleinto the Company’s common stock at the option of the ESOPbased on the relative fair value of the preferred and commonstock at time of conversion. The ESOP redeemed81,695 shares of preferred stock for cash in <strong>2001</strong>.Note 11 – Capital StockCommon CommonShares Sharesin Treasury OutstandingBalance at January 1, 1999.......................... 34,667,918 171,033,231Shares tendered as payment foroptions exercised................................ 8,392 (8,392)Shares issued for exerciseof stock options.................................. 462,598Shares tendered in connection withrestricted stock grants ........................ 44,236 (44,236)Net shares issued underrestricted stock grants ........................ 145,400Treasury stock purchased........................ 5,925,000 (5,925,000)Balance at December 31, 1999 .................... 40,645,546 165,663,601Shares tendered as payment foroptions exercised................................ 8,757 (8,757)Shares issued for exerciseof stock options.................................. 533,991Shares transferred to revocable trust ...... (165,000) 165,000Net shares issued underrestricted stock grants ........................ 4,500Treasury stock purchased........................ 6,800,000 (6,800,000)Balance at December 31, 2000 ................ 47,289,303 159,558,335Shares tendered as payment foroptions exercised ............................ 19,995 (19,995)Shares issued for exerciseof stock options .............................. 1,031,486Shares tendered in connection withrestricted stock grants .................... 42,970 (42,970)Net shares issued underrestricted stock grants .................... 151,500Treasury stock purchased .................... 6,700,000 (6,700,000)Balance at December 31, <strong>2001</strong> ................ 54,052,268 153,978,356An aggregate of 17,964,052 shares, 19,184,038 shares,and 19,722,529 shares of common stock at December 31,<strong>2001</strong>, 2000 and 1999, respectively, were reserved for futuregrants of restricted stock and the exercise and future grantsof stock options. Shares outstanding include 507,943shares, 432,518 shares, and 215,150 shares of commonstock held in a revocable trust at December 31, <strong>2001</strong>, 2000,and 1999, respectively. At December 31, <strong>2001</strong>, there were300,000,000 shares of common stock and 30,000,000shares of serial preferred stock authorized for issuance. Ofthe authorized serial preferred stock, 3,000,000 shares havebeen designated as cumulative redeemable serial preferredstock which may be issued pursuant to the Company’sshareholders’ rights plan if the Company becomes the targetof coercive and unfair takeover tactics and 1,000,000shares have been designated as convertible participatingserial preferred stock (see Note 10).40
NOTES TO CONSOLIDATED FINANCIAL STATEMENTS(Thousands of Dollars Unless Otherwise Indicated)Note 12 – Stock PlanThe Company’s 1994 Stock Plan permits the grantingof restricted stock, stock appreciation rights and stockoptions to eligible employees. The 1994 Stock Plan succeededthe 1984 Stock Plan which expired on February 15,1994. Although no further grants may be made under the1984 Stock Plan, all rights granted under such plan remain.The Company’s 1997 Stock Plan for Nonemployee Directorsprovides for the granting of restricted stock and stockoptions to members of the Board of Directors who are notemployees of the Company. There were 400,000 sharesauthorized as available for grant under the 1997 Stock Plan.Grants made pursuant to the 1997 Stock Plan are authorizedby the Board of Directors.Restricted stock grants, which generally require fouryears of continuous employment from the date of grantbefore vesting and receiving the shares without restriction,have been awarded to certain officers and key employeesunder the 1994 Stock Plan. The number of shares to bereceived without restriction is based on the Company’s performancerelative to a peer group of companies. Shares ofrestricted stock that vested and were delivered to officersand employees amounted to 116,000 and 120,400 during<strong>2001</strong> and 1999, respectively. No shares of restricted stockvested during 2000. At December 31, <strong>2001</strong>, there were388,000 shares of restricted stock outstanding. Unamortizeddeferred compensation expense with respect to therestricted stock grants amounted to $5,691, $3,036, and$4,249 at December 31, <strong>2001</strong>, 2000, and 1999, respectively,and is being amortized over the four-year vestingperiod. Deferred compensation expense aggregated $1,130,$3,180, and $77 in <strong>2001</strong>, 2000, and 1999, respectively. Nostock appreciation rights have been granted.A summary of restricted stock granted during <strong>2001</strong>,2000, and 1999 is as follows:<strong>2001</strong> 2000 1999Shares granted .......................................... 188,500 4,500 204,000Weighted-average fair value ofrestricted shares granted during year .... $ 25.72 $ 19.63 $ 23.77Non-qualified and incentive stock options have beengranted to certain officers and key employees under theplans at prices not less than fair market value of the shares,as defined by the plans, at the date of grant. The optionsgenerally become exercisable to the extent of one-third ofthe optioned shares for each full year following the date ofgrant and generally expire ten years after the date of grant.The number of options and any period of service requiredbefore the options may be exercised is determined by theBoard of Directors at the time of grant. No options may beexercised more than ten years from the date of the grant.The Company has elected to follow APBO No. 25,“Accounting for Stock Issued to Employees,” and relatedinterpretations, in accounting for its employee stock optionsbecause, as discussed below, the alternative fair valueaccounting provided for under SFAS No. 123, “Accountingfor Stock-Based Compensation,” requires use of highlysubjective assumptions in option valuation models. UnderAPBO No. 25, because the exercise price of the Company’semployee stock options is not less than fair market price ofthe shares at the date of grant, no compensation expense isrecognized in the financial statements. Pro forma informationregarding net income and earnings per share,determined as if the Company had accounted for itsemployee stock options under the fair value method of SFASNo. 123, is required by that statement. The fair value forthese options was estimated at the date of grant using aBlack-Scholes option pricing model with the followingweighted-average assumptions for all options granted:<strong>2001</strong> 2000 1999Risk-free interest rate................................ 4.00% 6.29% 5.34%Expected life of option.............................. 3 years 3 years 3 yearsExpected dividend yield of stock .............. 2.00% 2.00% 2.00%Expected volatility of stock ...................... 0.353 0.305 0.265The Black-Scholes option pricing model was developedfor use in estimating the fair value of traded options whichhave no vesting restrictions and are fully transferable.Because the Company’s employee stock options have characteristicssignificantly different from those of tradedoptions, and because changes in the subjective inputassumptions can materially affect the fair value estimate, itis management’s opinion that the existing models do notnecessarily provide a reliable single measure of the fair valueof its employee stock options.The amounts below represent the pro forma informationcalculated through use of the Black-Scholes model. Forpurposes of pro forma disclosures, the estimated fair valueof the options is amortized to expense over the options’vesting period.<strong>2001</strong> 2000 1999Pro forma net income ................ $253,892 $ 9,617 $ 297,107Pro forma net income per share:Basic ...................................... $ 1.63 $ .06 $ 1.77Diluted .................................. $ 1.62 $ .06 $ 1.7641
NOTES TO CONSOLIDATED FINANCIAL STATEMENTS(Thousands of Dollars Unless Otherwise Indicated)A summary of the Company’s stock option activity and related information for the years ended December 31, <strong>2001</strong>,2000 and 1999 is shown in the following table:<strong>2001</strong> 2000 1999Weighted- Weighted- Weighted-Average Average AverageOptioned Exercise Optioned Exercise Optioned ExerciseShares Price Shares Price Shares PriceOutstanding beginning of year .............................................. 12,588,310 $ 22.47 10,724,653 $ 22.78 6,259,702 $ 22.89Granted .................................................................................. 3,070,700 24.29 2,820,900 19.75 5,292,350 22.33Exercised ................................................................................ (1,031,486) 17.26 (533,991) 12.02 (462,598) 15.36Canceled ................................................................................ (498,348) 24.10 (423,252) 24.62 (364,801) 27.69Outstanding end of year ........................................................ 14,129,176 $ 23.19 12,588,310 $ 22.47 10,724,653 $ 22.78Exercisable at end of year ...................................................... 7,681,476 $ 23.75 5,923,537 $ 23.31 3,971,139 $ 21.09Weighted-average fair value of options granted during year .. $ 5.36 $ 4.72 $ 4.67Reserved for future grants ...................................................... 3,834,876 6,595,728 8,997,876Exercise prices for optioned shares outstanding as of December 31, <strong>2001</strong> ranged from $13.63 to $35.34. A summaryof these options by range of exercise prices is as follows:OutstandingExercisableWeighted-Weighted- Average Weighted-Average Remaining AverageRange of Optioned Exercise Contractual Optioned ExerciseExercise Prices Shares Price Life (years) Shares Price< $19.00 529,065 $ 16.56 3.62 469,055 $ 16.38$19.00 - $22.99 6,097,641 20.15 7.60 3,286,201 20.27$23.00 - $28.99 5,919,720 25.24 8.12 2,367,491 26.31> $28.99 1,582,750 29.43 6.18 1,558,729 29.4314,129,176 $23.19 7.46 7,681,476 $23.75Note 13 – Income TaxesDeferred income taxes reflect the net tax effects of temporarydifferences between the carrying amounts of assetsand liabilities for financial reporting purposes and theamounts used for income tax purposes using the enactedtax rates and laws that are currently in effect. Significantcomponents of the Company’s deferred tax assets and liabilitiesas of December 31, <strong>2001</strong>, 2000 and 1999 are asfollows:<strong>2001</strong> 2000 1999Deferred tax assets:Dispositions, environmental andother similar items .................. $ 54,856 $ 55,220 $ 56,123Other items (each less than 5%of total assets).......................... 107,726 98,107 94,196Total deferred tax assets...... $162,582 $153,327 $150,319Deferred tax liabilities:Depreciation and amortization .... $ 49,164 $ 35,691 $ 66,374Deferred employee benefit items .. 58,535 50,333 42,785Total deferred tax liabilities .... $107,699 $ 86,024 $109,159Significant components of the provisions for incometaxes are as follows:<strong>2001</strong> 2000 1999Current:Federal.......................................... $118,882 $125,393 $128,185Foreign ........................................ 9,893 6,211 11,787State and local .............................. 16,839 22,662 25,116Total current............................ 145,614 154,266 165,088Deferred:Federal.......................................... 15,374 (27,386) 14,388Foreign ........................................ (2,458) 6,213 3,851State and local .............................. 2,761 (5,713) 2,931Total deferred .......................... 15,677 (26,886) 21,170Total income tax expense.................. $161,291 $127,380 $186,258Significant components of income before income taxesas used for income tax purposes, are as follows:<strong>2001</strong> 2000 1999Domestic .......................................... $393,200 $ 90,412 $411,626Foreign ............................................ 31,249 52,994 78,492$424,449 $143,406 $490,11842
NOTES TO CONSOLIDATED FINANCIAL STATEMENTS(Thousands of Dollars Unless Otherwise Indicated)A reconciliation of the statutory federal income tax rateand the effective tax rate follows:<strong>2001</strong> 2000 1999Statutory tax rate .................................. 35.0% 35.0% 35.0%Effect of:State and local taxes .................... 3.0 7.7 3.7Investment vehicles ...................... 1.3 (7.3) (1.5)Impairment of long-lived assets .... 51.0Other - net .................................. (1.3) 2.5 0.8Effective tax rate.................................... 38.0% 88.9% 38.0%A portion of the impairment of long-lived assets chargein 2000 related to goodwill was not deductible for tax purposes.The effect on the statutory federal income tax rateis shown separately in the previous table. The state andlocal tax effect is not shown seperately. The remaining portionof the impairment charge created federal, state andlocal deferred tax benefits due to the significant temporarydifferences between the reduced financial carrying amountsand amounts used for tax purposes.The provisions for income taxes include estimated taxespayable on that portion of retained earnings of foreign subsidiariesexpected to be received by the Company. Aprovision was not made with respect to $11,473 of retainedearnings at December 31, <strong>2001</strong> that have been invested byforeign subsidiaries. It is not practicable to estimate theamount of unrecognized deferred tax liability for undistributedforeign earnings.Netted against the Company’s other deferred tax assetsare valuation reserves of $10,200, $9,082 and $16,211 atDecember 31, <strong>2001</strong>, 2000, and 1999, respectively, resultingfrom the uncertainty as to the realization of the taxbenefits from certain foreign net operating losses and certainother foreign assets.Note 14 – Summary of QuarterlyResults of Operations (Unaudited)<strong>2001</strong>Net Income Net Incomeper Share per ShareQuarter Net Sales Gross Profit Net Income – Basic – Diluted1st $ 1,158,370 $ 489,023 $ 36,924 $ .23 $ .232nd 1,407,514 608,537 90,480 .58 .583rd 1,366,768 601,039 90,321 .58 .584th 1,133,353 521,029 45,433 .29 .30Net income in the fourth quarter was decreased by$2,092 ($.01 per share) due to certain year-end adjustments.Gross profit increased by $18 ($12 after-tax, no per shareimpact) as a result of physical inventory adjustments of$4,418 ($2,872 after-tax, $.02 per share) offset by fourthquarter provisions for qualified exit costs associated withcertain facility closings of $4,400 ($2,860 after-tax, $.02per share). Selling and Administrative expenses decreased$11,735 ($7,628 after-tax, $.05 per share) due to the reductionof $10,368 ($6,739 after-tax, $.04 per share) in certainannual selling expenses related to lower sales, and certainother adjustments of $1,367 ($889 after-tax, $.01 pershare). Other expense–net increased $14,972 ($9,732 aftertax,$.06 per share) due primarily to the provisions for theestimated costs of environmental-related matters at current,former and third party sites of $5,609 ($3,645 after-tax,$.02 per share), impairment charges and adjustments toprior provisions related to facility closings of $7,304($4,748 after-tax, $.03 per share), and other year-endadjustments of $2,059 ($1,339 after-tax, $.01 per share).2000Net Income Net Income(Loss) per (Loss) perNet Income Share – Share -Quarter Net Sales Gross Profit (Loss) Basic Diluted1st $ 1,221,916 $ 516,244 $ 40,923 $ .25 $ .252nd 1,429,267 641,474 115,843 .71 .713rd 1,411,903 626,095 106,719 .66 .664th 1,148,538 523,798 (247,459) (1.55) (1.55)The fourth quarter net loss resulted from an after-taxcharge for the impairment of long-lived assets of $293,628or $1.84 per share ($1.80 per share for the year due to theeffect of dilution and higher average shares outstanding).Net income in the fourth quarter of $46,169, excluding theimpairment charge, was decreased by $484, no per shareimpact, due to certain year-end adjustments. Gross profitincreased by $8,666 ($5,633 after-tax, $.04 per share) primarilyas a result of physical inventory adjustments of$9,889 ($6,428 after-tax, $.04 per share) partially offset byfourth quarter provisions for qualified exit costs associatedwith certain facility closings of $1,055 ($686 after-tax,no per share impact). Administrative expenses increased$1,288 ($838 after-tax, $.01 per share) due to other yearendadjustments. Other expense-net increased $8,122($5,279 after-tax, $.03 per share) due primarily to fourthquarter impairment charges and adjustments to prior provisionsrelated to facility closings of $6,968 ($4,529after-tax, $.03 per share).43
NOTES TO CONSOLIDATED FINANCIAL STATEMENTS(Thousands of Dollars Unless Otherwise Indicated)Note 15 – Net Income per Share<strong>2001</strong> 2000 1999BasicAverage shares outstanding .... 155,557,085 161,911,789 167,924,660Net income.............................. $ 263,158 $ 16,026 $ 303,860Net income per share .............. $ 1.69 $ .10 $ 1.81DilutedAverage shares outstanding .... 155,557,085 161,911,789 167,924,660Non-vested restrictedstock grants ........................ 321,500 279,300 263,567Stock options -treasury stock method ........ 1,014,950 503,982 838,069Average sharesassuming dilution .............. 156,893,535 162,695,071 169,026,296Net income.............................. $ 263,158 $ 16,026 $ 303,860Net income per share .............. $ 1.68 $ .10 $ 1.80Note 16 – <strong>Report</strong>able SegmentInformationThe Company reports its segment information in fivereportable segments—the Paint Stores, Consumer, AutomotiveFinishes, International Coatings (collectively, the“Operating Segments”) and Administrative Segments—inaccordance with SFAS No. 131, “Disclosures about Segmentsof an Enterprise and Related Information.” SFAS No.131 requires an enterprise to report segment informationin the same way that management internally organizes itsbusiness for assessing performance and making decisionsregarding allocation of resources. See page 2 and pages 8through 15 of this report for more information aboutreportable segments.The Company’s chief operating decision maker has beenidentified as the Chief Executive Officer because he has finalauthority over performance assessment and resource allocationdecisions. Because of the global, diverse operationsof the Company, the chief operating decision maker regularlyreceives discrete financial information about eachreportable segment as well as a significant amount of additionalfinancial information about certain aggregateddivisions, business units and subsidiaries of the Company.The chief operating decision maker uses all such financialinformation for performance assessment and resource allocationdecisions. Factors considered in determining the fivereportable segments of the Company include the nature ofthe business activities, existence of managers responsiblefor the operating and administrative activities and informationpresented to the Board of Directors. The chiefoperating decision maker evaluates the performance of theOperating Segments and allocates resources based on profitor loss and cash generated from operations before incometaxes, excluding corporate expenses and financing gainsand losses. The accounting policies of the reportable segmentsare the same as those described in Note 1.The Paint Stores Segment consists of 2,573 companyoperatedspecialty paint stores in the United States, Canada,Virgin Islands, Puerto Rico and Mexico. Each division andbusiness unit of the Segment is engaged in the related businessactivity of selling the Company’s own manufacturedcoatings and related products to end-use customers. During<strong>2001</strong>, this Segment opened or acquired 85 net newstores, remodeled 6 and relocated 38. The net new storesconsisted of 83 stores in the United States, 2 in Canada,and 1 in Puerto Rico along with 1 closing in Mexico. In2000, there were 92 net new stores opened or acquired (79in the United States). In 1999, there were 73 net new storesopened (66 in the United States). This Segment also manufacturesoriginal equipment manufacturer (OEM) productfinishes sold through certain shared or dedicated paint storesand by direct outside sales representatives. In addition tostores, operations in Mexico include a manufacturing facility,distribution activities and outside selling functions todealers and other distributors.The Paint Stores Segment is the exclusive North Americanmarketer and seller of <strong>Sherwin</strong>-<strong>Williams</strong> ® brandedarchitectural coatings, industrial and marine products,OEM product finishes and related items produced by itsMexican operations, its product finishes manufacturing andby the Consumer Segment. The loss of any single customerwould not have a material adverse effect on the business ofthis Segment. A map on page 18 of this report shows thenumber of paint stores and their geographical location.The Consumer Segment develops, manufactures and distributesa variety of paint, coatings and related products tothird party customers and the Paint Stores Segment.Approximately 44 percent of the total sales of the ConsumerSegment in <strong>2001</strong>, including inter-segment transfers,represented products sold through the Paint Stores Segment.Sales and marketing of certain control-branded and privatelabeled products is performed by a direct sales staff. Theproducts distributed through third party customers areintended for resale to the ultimate end-user of the product.The Consumer Segment has sales to certain customers that,individually, may be a significant portion of the sales of theSegment. However, the loss of any single customer wouldnot have a material adverse effect on the overall profitabilityof the Segment. This Segment incurs most of the Company’scapital expenditures related to ongoing environmentalcompliance measures.The Automotive Finishes Segment develops, manufacturesand distributes a variety of motor vehicle finish,refinish and touch-up products primarily throughout Northand South America, the Caribbean Islands, and Italy. ThisSegment also licenses certain technology and trade namesworldwide. <strong>Sherwin</strong>-<strong>Williams</strong> ® branded automotive finishand refinish products are distributed throughout NorthAmerica solely through this Segment’s network of 124 company-operatedautomotive branches in the United States44
NOTES TO CONSOLIDATED FINANCIAL STATEMENTS(Thousands of Dollars Unless Otherwise Indicated)and 17 in Canada. Additional automotive branches inJamaica (14) and Chile (19) complete this Segment’s worldwidenetwork. At December 31, <strong>2001</strong>, this Segmentincluded 11 foreign wholly-owned subsidiaries in 8 foreigncountries and 10 licensing agreements in 14 foreign countries.A map on page 18 of this report shows the numberof branches and their geographical location.The International Coatings Segment develops, licenses,manufactures and distributes a variety of paint, coatingsand related products worldwide. The majority of the salesfrom licensees and subsidiaries occur in South America, theSegment’s most important international market. This Segmentsells its products through 33 company-operatedspecialty paint stores in Chile and 19 in Brazil, and byoutside selling functions to dealers and other distributors.At December 31, <strong>2001</strong>, this Segment included 12 foreignwholly-owned subsidiaries in 8 foreign countries, 4 foreignjoint ventures and 30 licensing agreements in 21 foreigncountries.The Administrative Segment includes the administrativeexpenses of the Company’s and certain consolidated subsidiaries’headquarters sites. This Segment includes interestexpense which is unrelated to retail real estate leasing activities,investment income, certain foreign currencytransaction losses related to dollar-denominated debt andforeign currency option and forward contracts, certainexpenses related to closed facilities and environmental-relatedmatters, and other expenses which are not directlyassociated with any Operating Segment. Administrativeexpenses do not include any significant foreign operations.Also included in the Administrative Segment is a real estatemanagement unit that is responsible for the ownership,management, leasing of non-retail properties held primarilyfor use by the Company, including the Company’sheadquarters site, and disposal of idle facilities. Sales of theAdministrative Segment represent external leasing revenueof excess headquarters space or leasing of facilities no longerused by the Company in its operations. Gains and lossesfrom the sale of property are not a significant operating factorin determining the performance of this Segment.Net external sales of all consolidated foreign subsidiarieswere $504 million, $540 million, and $497 million for<strong>2001</strong>, 2000, and 1999, respectively. Operating profits ofall consolidated foreign subsidiaries were $17 million, $32million, and $70 million for <strong>2001</strong>, 2000, and 1999, respectively.Domestic operations account for the remaining netsales and operating profits. Long-lived assets consist of netproperty, plant and equipment, goodwill, and intangibles.Long-lived assets of consolidated foreign subsidiaries totaled$211 million, $245 million, and $242 million at December31, <strong>2001</strong>, 2000, and 1999, respectively. The consolidatedtotal of long-lived assets for the Company was $1,593 million,$1,687 million, and $2,026 million at December 31,<strong>2001</strong>, 2000, and 1999, respectively. No single geographicarea outside the United States was significant relative toconsolidated net external sales or operating profits. Exportsales and sales to any individual customer were each lessthan 10 percent of consolidated sales to unaffiliated customersduring all years presented.In the reportable segment financial information thatfollows, operating profit is total revenue, including intersegmenttransfers, less operating costs and expenses.Identifiable assets are those directly identified with eachreportable segment. Administrative Segment assets consistprimarily of cash, investments, deferred pension assets,and headquarters property, plant and equipment. Theoperating margin for each Operating Segment is basedupon total external sales and inter-segment transfers.Domestic inter-segment transfers are accounted for at theapproximate fully absorbed manufactured cost plus distributioncosts. International inter-segment transfers areaccounted for at values comparable to normal unaffiliatedcustomer sales.45
NOTES TO CONSOLIDATED FINANCIAL STATEMENTS(Millions of Dollars)<strong>2001</strong> 2000 1999 1998 1997Net External SalesPaint Stores . . . . . . . . . . . . . . . . . . . . . . . $ 3,206 $ 3,185 $ 3,002 $ 2,822 $ 2,639Consumer . . . . . . . . . . . . . . . . . . . . . . . . 1,109 1,219 1,224 1,282 1,409Automotive Finishes . . . . . . . . . . . . . . . . . 464 493 471 474 476International Coatings . . . . . . . . . . . . . . . 280 307 299 348 350Administrative . . . . . . . . . . . . . . . . . . . . . 7 8 8 8 7Consolidated totals . . . . . . . . . . . . . . . . . . $ 5,066 $ 5,212 $ 5,004 $ 4,934 $ 4,881Operating ProfitsPaint Stores . . . . . . . . . . . . . . . . . . . . . . . $ 390 $ 411 $ 377 $ 347 $ 315Consumer . . . . . . . . . . . . . . . . . . . . . . . . 108 (210)* 155 125 167Automotive Finishes . . . . . . . . . . . . . . . . . 51 61 67 65 64International Coatings . . . . . . . . . . . . . . . 5 18 34 24 36Administrative:Interest expense . . . . . . . . . . . . . . . . . . (54) (60) (59) (70) (79)Corporate expenses and other . . . . . . . . (76) (77) (84) (51) (76)Income before income taxes . . . . . . . . . . . $ 424 $ 143* $ 490 $ 440 $ 427Identifiable AssetsPaint Stores . . . . . . . . . . . . . . . . . . . . . . . $ 954 $ 1,018 $ 930 $ 881 $ 832Consumer . . . . . . . . . . . . . . . . . . . . . . . . 1,296 1,360* 1,804 1,850 1,938Automotive Finishes . . . . . . . . . . . . . . . . . 329 349 279 275 274International Coatings . . . . . . . . . . . . . . . 261 298 294 356 312Administrative . . . . . . . . . . . . . . . . . . . . . 788 726 726 689 680Consolidated totals . . . . . . . . . . . . . . . . . . $ 3,628 $ 3,751* $ 4,033 $ 4,051 $ 4,036Capital ExpendituresPaint Stores . . . . . . . . . . . . . . . . . . . . . . . $ 36 $ 48 $ 49 $ 57 $ 56Consumer . . . . . . . . . . . . . . . . . . . . . . . . 18 40 40 37 57Automotive Finishes . . . . . . . . . . . . . . . . . 11 29 10 8 14International Coatings . . . . . . . . . . . . . . . 7 6 11 15 13Administrative . . . . . . . . . . . . . . . . . . . . . 11 10 24 29 24Consolidated totals . . . . . . . . . . . . . . . . . . $ 83 $ 133 $ 134 $ 146 $ 164DepreciationPaint Stores . . . . . . . . . . . . . . . . . . . . . . . $ 47 $ 45 $ 42 $ 38 $ 40Consumer . . . . . . . . . . . . . . . . . . . . . . . . 31 28 29 30 24Automotive Finishes . . . . . . . . . . . . . . . . . 9 9 8 8 7International Coatings . . . . . . . . . . . . . . . 6 6 6 6 6Administrative . . . . . . . . . . . . . . . . . . . . . 16 21 20 16 13Consolidated totals . . . . . . . . . . . . . . . . . . $ 109 $ 109 $ 105 $ 98 $ 90Operating Segment MarginsPaint Stores . . . . . . . . . . . . . . . . . . . . . . . 12.1% 12.9% 12.5% 12.3% 11.9%Consumer . . . . . . . . . . . . . . . . . . . . . . . . 5.5% (10.1%)* 7.6% 6.1% 8.0%Automotive Finishes . . . . . . . . . . . . . . . . . 10.2% 11.5% 13.3% 12.8% 12.5%International Coatings . . . . . . . . . . . . . . . 1.8% 5.9% 11.4% 6.9% 10.2%Operating segment totals . . . . . . . . . . . . . 9.3% 4.6%* 10.8% 9.8% 10.4%Intersegment TransfersPaint Stores . . . . . . . . . . . . . . . . . . . . . . . $ 9 $ 10 $ 8 $ 5Consumer . . . . . . . . . . . . . . . . . . . . . . . . 858 860 817 771 $ 666Automotive Finishes . . . . . . . . . . . . . . . . . 34 36 31 34 37International Coatings . . . . . . . . . . . . . . . 2Administrative . . . . . . . . . . . . . . . . . . . . . 9 11 12 11 9Segment totals . . . . . . . . . . . . . . . . . . . . . $ 910 $ 917 $ 868 $ 821 $ 714* Includes charge and reduction in asset value of $352 in 2000 for impairment of long-lived assets. See note 2.46
Directors, Officers, Operating PresidentsBoard of DirectorsJames C. Boland, 62*President and Chief Executive OfficerCAVS/Gund Arena CompanyJohn G. Breen, 67Retired, former Chairman, ChiefExecutive Officer and PresidentThe <strong>Sherwin</strong>-<strong>Williams</strong> CompanyDuane E. Collins, 65ChairmanParker-Hannifin CorporationChristopher M. Connor, 45Chairman and Chief Executive OfficerThe <strong>Sherwin</strong>-<strong>Williams</strong> CompanyDaniel E. Evans, 65Retired, former Chairman, ChiefExecutive Officer and SecretaryBob Evans Farms, Inc.Robert W. Mahoney, 65*Retired, former Chairman, ChiefExecutive Officer and PresidentDiebold, IncorporatedGary E. McCullough, 43Senior Vice President - AmericasWm. Wrigley Jr. CompanyA. Malachi Mixon, III, 61Chairman and Chief Executive OfficerInvacare CorporationCurtis E. Moll, 62*Chairman and Chief Executive OfficerMTD Products, Inc.Joseph M. Scaminace, 48President and Chief Operating OfficerThe <strong>Sherwin</strong>-<strong>Williams</strong> CompanyRichard K. Smucker, 53*President and Co-Chief ExecutiveOfficerThe J. M. Smucker CompanyCorporate OfficersChristopher M. Connor, 45**Chairman and Chief Executive OfficerJoseph M. Scaminace, 48**President and Chief Operating OfficerSean P. Hennessy, 44**Senior Vice President - Finance,Treasurer and Chief FinancialOfficerThomas E. Hopkins, 44**Senior Vice President - HumanResourcesConway G. Ivy, 60**Senior Vice President - CorporatePlanning and DevelopmentJohn L. Ault, 56**Vice President - Corporate ControllerCynthia D. Brogan, 50Vice President andAssistant TreasurerMark J. Dvoroznak, 43Vice President - Corporate Audit andLoss PreventionJames J. Sgambellone, 44Vice President - Taxes and AssistantSecretaryLouis E. Stellato, 51**Vice President, General Counsel andSecretaryRichard M. Weaver, 47Vice President - AdministrationOperating PresidentsThomas S. Brummett, 56President & General ManagerEastern DivisionPaint Stores GroupRobert J. Davisson, 41President & General ManagerSoutheastern DivisionPaint Stores GroupMichael A. Galasso, 54**President & General ManagerInternational DivisionTimothy A. Knight, 37President & General ManagerDiversified Brands DivisionBlair P. LaCour, 55President & General ManagerMid Western DivisionPaint Stores GroupJohn G. Morikis, 38**PresidentPaint Stores GroupRonald P. Nandor, 42**President & General ManagerAutomotive DivisionSteven J. Oberfeld, 49President & General ManagerSouth Western DivisionPaint Stores GroupHarvey P. Sass, 44President & General ManagerWood Care DivisionThomas W. Seitz, 53**President & General ManagerConsumer DivisionRobert A. Taylor, 48President & General ManagerChemical Coatings DivisionPaint Stores Group*Audit Committee Member**Executive Officer as defined by the Securities Exchange Act of 193447
SHAREHOLDER INFORMATION<strong>Annual</strong> MeetingThe annual meeting of shareholderswill be held at 9:00 A.M., April24, 2002 in the Landmark ConferenceCenter, 927 Midland Building,101 Prospect Avenue, N.W., Cleveland,Ohio.<strong>Investor</strong> <strong>Relations</strong>Conway G. IvyThe <strong>Sherwin</strong>-<strong>Williams</strong> Company101 Prospect Avenue, N.W.Cleveland, Ohio 44115-1075Internet: www.sherwin.comForm 10-kThe Company’s <strong>Annual</strong> <strong>Report</strong>on Form 10-K, filed with the Securitiesand Exchange Commission, isavailable without charge. To obtaina copy, contact the <strong>Investor</strong> <strong>Relations</strong>Office.Dividend ReinvestmentProgramA dividend reinvestment programis available to shareholders of commonstock. For information, contactour transfer agent, The Bank of NewYork.HeadquartersThe <strong>Sherwin</strong>-<strong>Williams</strong> Company101 Prospect Avenue, N.W.Cleveland, Ohio 44115-1075(216) 566-2000Independent AuditorsErnst & Young LLPCleveland, OhioStock Trading<strong>Sherwin</strong>-<strong>Williams</strong> Common Stock–Symbol, SHW–is traded on the NewYork Stock Exchange.Transfer Agent &RegistrarThe Bank of New YorkShareholder <strong>Relations</strong>Department-11EP.O. Box 11258Church Street StationNew York, NY 102861-866-537-8703E-mail address:Shareowner-svcs@Email.bony.comInternet: www.stockbny.comCommon Stock Trading Statistics<strong>2001</strong> 2000 1999 1998 1997High . . . . . . . . . . . . . . . . . . . . . . . . . . . . . . . . . . . $ 28.23 $ 27.625 $ 32.875 $ 37.875 $ 33.375Low . . . . . . . . . . . . . . . . . . . . . . . . . . . . . . . . . . . 19.73 17.125 18.750 19.438 24.125Close December 31 . . . . . . . . . . . . . . . . . . . . . . . . 27.50 26.313 21.000 29.375 27.750Shareholders of record . . . . . . . . . . . . . . . . . . . . . 10,281 10,813 11,475 11,929 11,964Shares traded (thousands) . . . . . . . . . . . . . . . . . . . 162,219 158,349 161,118 128,942 98,855Quarterly Stock Prices and Dividends<strong>2001</strong> 2000Quarter High Low Dividend Quarter High Low Dividend1st $ 27.25 $ 23.52 $ .145 1st $ 23.000 $ 17.125 $ .1352nd 26.51 19.73 .145 2nd 27.625 21.172 .1353rd 23.88 19.95 .145 3rd 24.625 19.875 .1354th 28.23 21.27 .145 4th 26.563 18.875 .13548