MS Thesis R. Hager - Hawaii National Marine Renewable Energy ...
MS Thesis R. Hager - Hawaii National Marine Renewable Energy ... MS Thesis R. Hager - Hawaii National Marine Renewable Energy ...
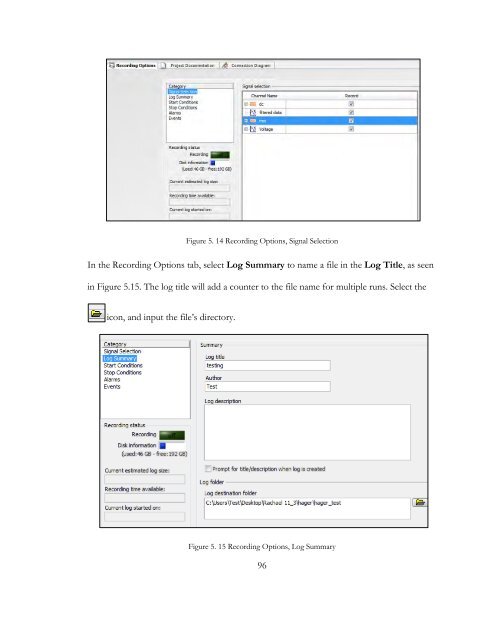
Figure 5. 14 Recording Options, Signal SelectionIn the Recording Options tab, select Log Summary to name a file in the Log Title, as seenin Figure 5.15. The log title will add a counter to the file name for multiple runs. Select theicon, and input the file’s directory.Figure 5. 15 Recording Options, Log Summary96
To create graphs and tables select the Data View tab. For a desired graph or table, selectData View>> Add Display, as seen in Figure 5.16; or expand theicon.Simply double-clicking theicon will initiate a Time XY graph.Figure 5. 16 Adding a Graph or TableIn order to select the desired signal for a graph or table, right-mouse click on the graph andselect Signal>> Add Signal, as seen in Figure 5.17. A window such as the one in Figure5.18 will appear to select the signal. As steps are created they are not automatically includedinto graphs or tables; they must be added.97
- Page 46 and 47: Mw k ieitS( D I) ijkrinjdS(46)3.3.3
- Page 48 and 49: Due to Kirchhoff decomposition, rec
- Page 50 and 51: TE KE PE 20L Asin(kx) 1 2(61)dV d
- Page 52 and 53: P I Iw dS (70)tnSIf the column
- Page 54 and 55: 221 2P gA C(77)max g2 3.8 Maximum
- Page 56 and 57: 4.2 AQWA Modeling ProcedureThe user
- Page 58 and 59: : Local data has changed, and the c
- Page 60 and 61: Figure 4. 5 Drawing in Design Modul
- Page 62 and 63: 12. Delete all lines inside the cur
- Page 64 and 65: 22. Edit the details of the slice u
- Page 66 and 67: Figure 4. 15 Details of the Part7.
- Page 68 and 69: Figure 4. 17 Details of the Mesh4.2
- Page 70 and 71: Figure 4. 21 Detials of the Wave Di
- Page 72 and 73: 5. Highlight Diffraction + Froude-K
- Page 74 and 75: Table 4.1 Body Dimensions for Numer
- Page 76 and 77: concavity from concave down to conc
- Page 78 and 79: Figure 4. 29 Maximum Power Absorpti
- Page 80 and 81: Table 4. 3 Numerical ResultsBodyNo.
- Page 82 and 83: BodyNo.Bodyλ atT=2.1λ atT=1.0λ a
- Page 84 and 85: WAVEFigure 5. 1 Body Faces Wave Mak
- Page 86 and 87: The body connects to the aluminum p
- Page 88 and 89: also allowed for flexibility in cre
- Page 90 and 91: AB1 23 4 5 6 7CD8 9 10 11EFigure 5.
- Page 92 and 93: and minimum voltage range of the DA
- Page 94 and 95: Figure 5. 11 Deleting a Step from L
- Page 98 and 99: Figure 5. 17 Right-mouse Click on t
- Page 100 and 101: Zero-OffsetThe Zero-Offset step rem
- Page 102 and 103: Figure 5. 24 Filter Step Set-up, Co
- Page 104 and 105: 5.6 Data ProcessingFigure 5. 26 Wav
- Page 106 and 107: 5.8 Experimental DiscussionAs menti
- Page 108 and 109: 5.8.3 Suggestions for Future Resear
- Page 110 and 111: 110ikxxRekddzkgkn )cosh())(cosh(,
- Page 112 and 113: Proof M ij and B ij are Symmetric T
- Page 114 and 115: BIBILIOGRAPHYANSYS. (n.d.). ANSYS A
- Page 116: Trust, C. (2011). Capital, Operatin
Figure 5. 14 Recording Options, Signal SelectionIn the Recording Options tab, select Log Summary to name a file in the Log Title, as seenin Figure 5.15. The log title will add a counter to the file name for multiple runs. Select theicon, and input the file’s directory.Figure 5. 15 Recording Options, Log Summary96


