View - Singapore Technologies Engineering
View - Singapore Technologies Engineering
View - Singapore Technologies Engineering
- No tags were found...

Create successful ePaper yourself
Turn your PDF publications into a flip-book with our unique Google optimized e-Paper software.
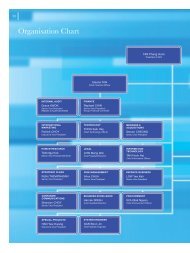
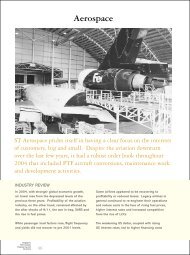
GROUP FINANCIAL PERFORMANCE1. ACQUISITION OF FOUNDERS INDUSTRIES PTE LTDOn 22 October 1999, ST Engg announced the proposedacquisition of the entire issued and paid-up share capitalof Chartered Industries of <strong>Singapore</strong> (Pte.) Limited(“CIS”) through its wholly-owned subsidiary, <strong>Singapore</strong><strong>Technologies</strong> Automotive Ltd (“ST Auto”), subject toshareholders’ approval.The acquisition was approved byshareholders at the Extraordinary General Meeting heldon 8 December 1999 and the acquisition was completedon 9 February 2000. Subsequent to the completion, STAuto and CIS changed their name to <strong>Singapore</strong><strong>Technologies</strong> Kinetics Pte Ltd (“ST Kinetics”) andFounders Industries Pte Ltd (“FIPL”) respectively.Theacquisition of FIPL has enabled the creation of a worldclassland systems group within ST Engg as well as theprovision of additional growth opportunities in its developmentas a successful global world-class engineering3. FINANCIAL PERFORMANCE3.1 SELECTED QUARTERLY FINANCIAL DATA2000 1999IN S$’000 EXCEPT PER SHARE AMOUNTS 1Q 2Q 3Q 4Q 1Q 2Q 3Q 4QTurnover 589,053 501,092 492,992 675,890 392,138 531,345 395,110 445,814Profit after taxafter minority interest 64,836 67,407 69,096 86,799 45,828 51,448 47,940 55,313Basic earnings per share (¢)Before extraordinary items(Note 1) 2.3 4.6 7.1 10.1 1.6 3.4 5.1 7.1Net tangible assetsper share (¢) (Note 2) 31.3 34.7 36.4 31.9 31.4 33.1 34.9 29.6Note 1: The quarterly data are unaudited.Note 2: Basic earnings per share and Net tangible assets per share are computed based on period-to-date figures.3.2 TURNOVERThe Group’s turnover grew by 28% or S$495 millionfrom S$1.76 billion in 1999 to S$2.26 billion in 2000.All sectors contributed to the increase in turnover.Themajor contribution came from Land Systems sector withan increase of S$229 million or 77% in turnover.The Aerospace sector grew 12% or S$100 million over1999.This was mainly due to higher sales generated bygroup.The enlarged ST Engg is also in a better position toreach out to customers requiring higher value-added andintegrated solutions due to the availability of greaterresources and critical business economies of scale.2. US RESTRUCTURING AND SECTORAL REPORTINGIn year 2000, ST Engg rationalised its group corporatestructure to position itself for growth and expansion inthe United States.The exercise involved the consolidationof ST Engg’s US operations for each of its fourStrategic Business Areas under a single umbrella toachieve critical mass within the United States.Subsequent to the restructuring, the Group reported itsresults by sector independent of its legal structure.Therationale for the change is to better reflect the businessfocus of the Group in the four main areas, namelyAerospace, Electronics, Land Systems and Marine.both Commercial Business Group (CBG) and MilitaryBusiness Group (MBG).The increased capacities in CBGand completion of more project milestones as well asincreased deliveries under maintenance contracts ofMBG contributed to the growth in turnover.Electronics sector’s turnover for 2000 increased by 16%or S$58 million to S$412 million.The increase in saleswas contributed by all three business groups, namely,Large-Scale Systems Group, Communication & SensorSystems Group and Software Systems Group.Turnover for Land Systems sector increased by 77% orS$229 million compared to 1999, of which S$199million was contributed by FIPL.The increased sales waslargely from Manufacturing, Upgrading & Repairsbusiness group due mainly to the inclusion of the munitionsand weapon sales of FIPL, increased revenue fromOrdnance after-sales services and STAR accident repairs.Turnover for Marine sector of S$358 million was 40% orS$102 million higher than that achieved in 1999.Theincrease was primarily due to the delivery of twoLanding Ship Tanks (LST) as well as the completion ofmore conversion projects in 2000 compared to deliveryof only one LST in 1999.3.3 PROFITOn a full year basis, the Group’s profit before taximproved by 37% or S$112.4 million to S$412.5 millionfrom S$300.1 million in 1999. Growth came fromall sectors.Aerospace sector achieved a 15% or S$29.2 million ofprofit before tax growth over that of 1999. Both CBGand MBG registered higher profit of S$2.6 million andS$26.6 million respectively. CBG registered a lowerprofit growth of S$2.6 million with higher contributionfrom Turbine Overhaul Services Pte Ltd and the biennialAsian Aerospace 2000 exhibition, but partially offset bylower margins due to sales mix, Dalfort’s poor performance,bad debts written off and higher provision forinventory. MBG’s higher profit of S$26.6 million was duemainly to higher turnover and investment income.Electronics sector’s profit before tax grew by 65% orS$18.4 million to S$46.6 million over 1999 profit beforetax. All three business groups contributed to theimprovement in profit as a result of higher sales andinterest income as well as better operational efficiency.Profit before tax for Land Systems sector grew 156% orS$51.6 million.The increase of the Manufacturing,Upgrading & Repairs business group was the result ofhigher sales with the inclusion of FIPL, better marginsand productivity gains, as well as higher interest income.Higher sales from Opel and electric vehicle businesses aswell as the inclusion of the profit from trading and testservices business of FIPL also contributed to theimproved profit.Profit before tax from Marine sector of S$63.9 millionwas higher than 1999 by 38% or S$17.5 million.Theincrease was mainly contributed by higher sales as well asimproved margin from all three business groups, butpartially offset by lower investment income due to fewerfunds matured and an increase in provision for diminutionfor a long-term investment.3.4 CASH AND CASH EQUIVALENTSThe Group had a healthy cash balance of S$2.6 billion, anincrease of 24% over 1999. Majority of the funds wereheld in liquid assets such as fixed deposits, floating ratenotes, placements with a related corporation and withprofessional fund managers on a guaranteed principalbasis.The increase was attributable to higher cash flowgenerated from operating activities.3.5 EARNINGS PER SHARE (EPS)Both basic and diluted EPS showed an improvement of42% over 1999. Basic EPS increased from 7.08 cents to10.12 cents in 2000 while diluted EPS increased from7.01 cents to 10.01 cents in 2000.3.6 CAPITAL EXPENDITURECapital expenditure amounted to S$57 million.Thedetails are shown in note 8 to the financial statements.3.7 DIVIDENDThe Directors are pleased to announce that gross dividendstotalling 95% (i.e. S$0.095 for each share of parvalue S$0.10) have been recommended for the year ended31 December 2000.The recommended dividends consistof a gross ordinary dividend of 25% (i.e. S$0.025) and agross special dividend of 70% (i.e. S$0.070).The recommendedspecial dividend reflected the Group’s commitmentto creating shareholders’ value through the EVAapproach to managing its business.The recommended dividendstake into consideration the Group’s present cashposition, positive cashflow generated from operations, taxcredit balances and projected capital requirements.3.8 ECONOMIC VALUE ADDED (EVA)EVA for the full year 2000 was S$189.3 million, anincrease of S$53.7 million or 40% over 1999.The weightedaverage cost of capital was 9.9% for 2000 and 1999.4. REVIEW OF BUSINESS ACTIVITIESAEROSPACEAerospace sector continued to see increased demandsfor MRO services and engineering services from boththe commercial and military business groups in year98 • visiongroup financial performance • 99