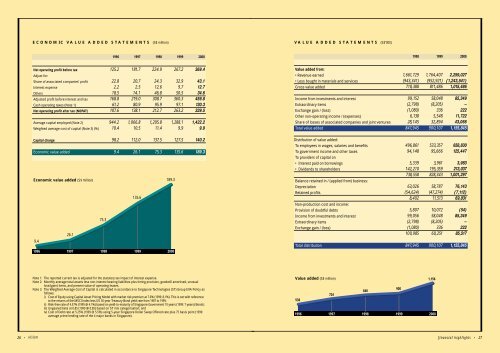
ECONOMIC VALUE ADDED STATEMENTS (S$ million)VALUE ADDED STATEMENTS (S$’000)1996 1997 1998 1999 20001998 1999 2000Net operating profit before tax 125.2 181.7 224.9 267.2 369.4Adjust for:Share of associated companies’ profit 22.8 20.7 24.3 32.9 43.1Interest expense 2.2 2.5 12.6 9.7 12.7Others 18.5 14.1 46.8 50.5 34.6Adjusted profit before interest and tax 168.8 219.0 308.7 360.3 459.8Cash operating taxes (Note 1) 61.2 80.9 95.9 97.1 130.3Net operating profit after tax (NOPAT) 107.6 138.1 212.7 263.2 329.5Average capital employed (Note 2) 944.2 1,066.8 1,205.8 1,288.1 1,422.2Weighted average cost of capital (Note 3) (%) 10.4 10.5 11.4 9.9 9.9Capital charge 98.2 112.0 137.5 127.5 140.2Economic value added 9.4 26.1 75.3 135.6 189.3Economic value added (S$ million)9.426.175.3135.6189.31996 1997 1998 1999 2000Value added from:• Revenue earned 1,661,729 1,764,407 2,259,027• Less bought in materials and services (943,341) (952,921) (1,243,541)Gross value added 718,388 811,486 1,015,486Income from investments and interest 99,152 58,048 85,349Extraordinary items (2,798) (8,205) –Exchange gain / (loss) (1,080) 336 222Other non-operating income / (expenses) 6,138 5,548 11,722Share of losses of associated companies and joint ventures 28,145 32,894 43,066Total value added 847,945 900,107 1,155,845Distribution of value added:To employees in wages, salaries and benefits 496,861 533,357 658,830To government income and other taxes 94,148 95,666 125,447To providers of capital on• Interest paid on borrowings 5,339 3,961 3,983• Dividends to shareholders 142,210 195,359 213,037738,558 828,343 1,001,297Balance retained in / (applied from) business:Depreciation 63,026 58,787 76,143Retained profits (54,624) (47,274) (7,112)8,402 11,513 69,031Non-production cost and income:Provision of doubtful debts 5,807 10,072 (54)Income from investments and interest 99,056 58,048 85,349Extraordinary items (2,798) (8,205) –Exchange gain / (loss) (1,080) 336 222100,985 60,251 85,517Total distribution 847,945 900,107 1,155,845Note 1: The reported current tax is adjusted for the statutory tax impact of interest expense.Note 2: Monthly average total assets less non-interest bearing liabilities plus timing provision, goodwill amortised, unusualloss/(gain) items, and present value of operating leases.Note 3: The Weighted Average Cost of Capital is calculated in accordance to <strong>Singapore</strong> <strong>Technologies</strong> (ST) Group EVA Policy asfollows:i) Cost of Equity using Capital Asset Pricing Model with market risk premium at 7.0% (1999: 8.1%). This is set with referenceto the returns of the MSCI Index less US 30-year Treasury Bond yield rate from 1987 to 1999;ii) Risk-free rate of 4.57% (1999 @ 4.1%) based on yield-to-maturity of <strong>Singapore</strong> Government 10 years (1999: 7 years) Bonds;iii) Ungeared beta at 0.85 (1999 @ 0.85) based on ST risk categorisation; andiv) Cost of Debt rate at 5.25% (1999 @ 5.5%) using 5-year <strong>Singapore</strong> Dollar Swap Offered rate plus 75 basis point (1999:average prime lending rate of the 4 major banks in <strong>Singapore</strong>).Value added (S$ million)1,1568489007245381996 1997 1998 1999 200026 • visionfinancial highlights • 27
• AEROSPACE• ELECTRONICS• LAND SYSTEMS• MARINEe-initiatives by chang cheow tecke-structuringour businessesWho can read the future of next generationproducts and systems?<strong>Singapore</strong> <strong>Technologies</strong> Electronics’ formidable reputation for developing cutting-edge electronics systemsinternationally has strategically placed us to serve your organisation further.We provide solutions for the commercial, defence and industrial sectors. Core businesses includeCommunication systems, Microwave systems, Traffic Management systems, Real-time systems, Training andSimulation systems, Intelligent Building Management systems and Intelligent Rail systems.With the combined experience and resources of ST Aero, ST Elect, ST Kinetics and ST Marine, <strong>Singapore</strong><strong>Technologies</strong> <strong>Engineering</strong> is a one stop provider of engineering solutions, from turnkey projects to customisedupgrades.www.stengg.comWe can.THE SLUMP IN INTERNET STOCKS IN 2000 SHOULDnot mislead anyone. It has always been a bubblewaiting to burst. Nevertheless, the e-revolutionwill remain a key factor in weaving togetherthe modern global economy.Traditional bricks and mortarcompanies, which were at first slow to respond to thee-transformation, are carrying the flag now.The aftermath ofthe shock has brought greater appreciation of the ‘www’creature and of the technology’s capability.The ‘click and mortar’ model hasevolved as different industriesshape their own e-models and dictatewhere their cash flows.Whilethere are reasons to be cautious ofpure dot-coms, many e-retailersare rapidly moving away frombusiness models that emphasisegenerating site traffic at greatexpense, in favour of targettingimproved customer retention andincreased sales per customer.The arrival of established companieson the Internet has broughtabout an erosion of the distinctionbetween the so-called “oldeconomy” and “new economy.”E-business is here to stay, becomingincreasingly commonplace.Investing in e-initiatives can becostly, so we have exercised care toensure that we maximise returns onour investments.We believe thatadopting the right technology ismore important than getting thelatest or most sophisticated technology.As technology changes, sowill we.We constantly monitor thedos and don’ts of e-business andassess how to find the right balancebetween re-engineering our businessesand web-enabling existingprocesses.Fundamentally, we aim to leverageon e-technology as a tool to webenableour processes and to shapethe changing business models withthe e-revolution. Any savings that wegenerate from e-business will beploughed back to further improveour business processes. Ultimately,we want to harvest a more costeffectivebusiness so as toposition ourselves ahead of the competitionin the globalmarketplace.Our e-initiativesencompass the threemain areas of CustomerRelationship Management,Supply ChainManagement andEnterprise Management.CUSTOMERRELATIONSHIPMANAGEMENTOur approach towardsCustomer RelationshipManagement (CRM) isto make it a “sticky”one. E-CRM helpssupport our goal ofbuilding long-term relationshipswith all our customers by providinga wider range of products andservices that add value to them.One important goal is to constantlyimprove our responsiveness toevery customer’s changing needs,regardless of their geographicallocation.”WE AIM TOLEVERAGE ONE-TECHNOLOGYAS A TOOL TOWEB-ENABLE OURPROCESSES ANDTO SHAPE THECHANGINGBUSINESS MODELSWITH THEE-REVOLUTION.“While e-transforming our businesses,we have had the opportunityto review our current value chain.This in turn has helped us todetermine vital points we needed tofocus upon to further enhance ourbusiness models. Recognising thatcritical mass and base load are equallyimportant, we have worked withpotential strategic partners to jointlydevelop our own CRM portals.Kicking this off was the Aerospacesector. It launched e-sasco.com inFebruary for our airframe maintenance,repair and overhaul services.Further refined and improved, it wascompleted in June.The Aerospacesector piloted the way for the otherthree sectors, which have rolled outtheir own CRM portals this year.SUPPLY CHAINMANAGEMENTWe are sparing noexpense and efforts tostreamline our processesin order to achieveour globalisation ambitions.Wehave cut outproduction bottlenecks,controlled stock levels,shortened fulfillmenttime and broadenedsupplier base.The resultwill be a significantfreeing of capital andreduction of costs.Our Supply ChainManagement (SCM)e-initiatives have threemain foci: to lower overall supplychain administrative costs, reduceprocurement costs of materials andservices; and improve working capitalmanagement through lowerinventory holdings.We have contracted HewlettPackard and i2 to further developWe take <strong>Engineering</strong> furtherFor more on Electronics Sector, turn to page 78e-initiatives • 29