Experiment CP-1: The Electrocardiogram (ECG) and the Pulse - iWorx
Experiment CP-1: The Electrocardiogram (ECG) and the Pulse - iWorx
Experiment CP-1: The Electrocardiogram (ECG) and the Pulse - iWorx
- No tags were found...

You also want an ePaper? Increase the reach of your titles
YUMPU automatically turns print PDFs into web optimized ePapers that Google loves.
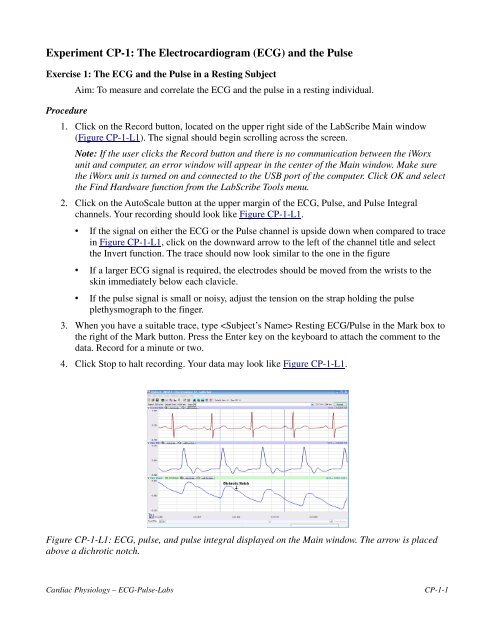
<strong>Experiment</strong> <strong>CP</strong>-1: <strong>The</strong> <strong>Electrocardiogram</strong> (<strong>ECG</strong>) <strong>and</strong> <strong>the</strong> <strong>Pulse</strong>Exercise 1: <strong>The</strong> <strong>ECG</strong> <strong>and</strong> <strong>the</strong> <strong>Pulse</strong> in a Resting SubjectProcedureAim: To measure <strong>and</strong> correlate <strong>the</strong> <strong>ECG</strong> <strong>and</strong> <strong>the</strong> pulse in a resting individual.1. Click on <strong>the</strong> Record button, located on <strong>the</strong> upper right side of <strong>the</strong> LabScribe Main window(Figure <strong>CP</strong>-1-L1). <strong>The</strong> signal should begin scrolling across <strong>the</strong> screen.Note: If <strong>the</strong> user clicks <strong>the</strong> Record button <strong>and</strong> <strong>the</strong>re is no communication between <strong>the</strong> <strong>iWorx</strong>unit <strong>and</strong> computer, an error window will appear in <strong>the</strong> center of <strong>the</strong> Main window. Make sure<strong>the</strong> <strong>iWorx</strong> unit is turned on <strong>and</strong> connected to <strong>the</strong> USB port of <strong>the</strong> computer. Click OK <strong>and</strong> select<strong>the</strong> Find Hardware function from <strong>the</strong> LabScribe Tools menu.2. Click on <strong>the</strong> AutoScale button at <strong>the</strong> upper margin of <strong>the</strong> <strong>ECG</strong>, <strong>Pulse</strong>, <strong>and</strong> <strong>Pulse</strong> Integralchannels. Your recording should look like Figure <strong>CP</strong>-1-L1.• If <strong>the</strong> signal on ei<strong>the</strong>r <strong>the</strong> <strong>ECG</strong> or <strong>the</strong> <strong>Pulse</strong> channel is upside down when compared to tracein Figure <strong>CP</strong>-1-L1, click on <strong>the</strong> downward arrow to <strong>the</strong> left of <strong>the</strong> channel title <strong>and</strong> select<strong>the</strong> Invert function. <strong>The</strong> trace should now look similar to <strong>the</strong> one in <strong>the</strong> figure• If a larger <strong>ECG</strong> signal is required, <strong>the</strong> electrodes should be moved from <strong>the</strong> wrists to <strong>the</strong>skin immediately below each clavicle.• If <strong>the</strong> pulse signal is small or noisy, adjust <strong>the</strong> tension on <strong>the</strong> strap holding <strong>the</strong> pulseplethysmograph to <strong>the</strong> finger.3. When you have a suitable trace, type Resting <strong>ECG</strong>/<strong>Pulse</strong> in <strong>the</strong> Mark box to<strong>the</strong> right of <strong>the</strong> Mark button. Press <strong>the</strong> Enter key on <strong>the</strong> keyboard to attach <strong>the</strong> comment to <strong>the</strong>data. Record for a minute or two.4. Click Stop to halt recording. Your data may look like Figure <strong>CP</strong>-1-L1.Figure <strong>CP</strong>-1-L1: <strong>ECG</strong>, pulse, <strong>and</strong> pulse integral displayed on <strong>the</strong> Main window. <strong>The</strong> arrow is placedabove a dichrotic notch.Cardiac Physiology – <strong>ECG</strong>-<strong>Pulse</strong>-Labs<strong>CP</strong>-1-1
5. Select Save As in <strong>the</strong> File menu, type a name for <strong>the</strong> file. Choose a destination on <strong>the</strong> computerin which to save <strong>the</strong> file, like your lab group folder). Designate <strong>the</strong> file type as *.iwxdata. Clickon <strong>the</strong> Save button to save <strong>the</strong> data file.Data Analysis1. Scroll through <strong>the</strong> recording <strong>and</strong> find a section of data with five or six exemplary <strong>ECG</strong>/pulsecycles in succession.2. Use <strong>the</strong> Display Time icons to adjust <strong>the</strong> Display Time of <strong>the</strong> Main window to show at leastfour complete <strong>ECG</strong>/<strong>Pulse</strong> cycles on <strong>the</strong> Main window. Four adjacent <strong>ECG</strong>/<strong>Pulse</strong> cycles can alsobe selected by:• Placing <strong>the</strong> cursors on ei<strong>the</strong>r side of a group of four complete <strong>ECG</strong>/<strong>Pulse</strong> cycles.• Clicking <strong>the</strong> Zoom between Cursors button on <strong>the</strong> LabScribe toolbar to exp<strong>and</strong> <strong>the</strong> segmentwith <strong>the</strong> four selected <strong>ECG</strong>/<strong>Pulse</strong> cycles to <strong>the</strong> width of <strong>the</strong> Main window.3. Click on <strong>the</strong> Analysis window icon in <strong>the</strong> toolbar (Figure <strong>CP</strong>-1-L2) or select Analysis from <strong>the</strong>Windows menu to transfer <strong>the</strong> data displayed in <strong>the</strong> Main window to <strong>the</strong> Analysis window(Figure <strong>CP</strong>-1-L3).Figure <strong>CP</strong>-1-L2: <strong>The</strong> LabScribe toolbar.4. Look at <strong>the</strong> Function Table that is above <strong>the</strong> uppermost channel displayed in <strong>the</strong> Analysiswindow. <strong>The</strong> names of <strong>the</strong> ma<strong>the</strong>matical functions used in <strong>the</strong> analysis, V2-V1 <strong>and</strong> T2-T1,appear in this table. <strong>The</strong> values for V2-V1 <strong>and</strong> T2-T1 from each channel are seen in <strong>the</strong> tableacross <strong>the</strong> top margin of each channel. In this exercise will only need to record <strong>the</strong> values forT2-T1.5. Once <strong>the</strong> cursors are placed in <strong>the</strong> correct positions for determining <strong>the</strong> time intervals on each<strong>ECG</strong>/<strong>Pulse</strong> cycle, <strong>the</strong> values of <strong>the</strong> time intervals can be recorded in <strong>the</strong> on-line notebook ofLabScribe by typing <strong>the</strong>ir names <strong>and</strong> values directly into <strong>the</strong> Journal, or on a separate data table.6. <strong>The</strong> functions in <strong>the</strong> channel pull-down menus of <strong>the</strong> Analysis window can also be used to enter<strong>the</strong> names <strong>and</strong> values of <strong>the</strong> parameters from <strong>the</strong> recording to <strong>the</strong> Journal. To use <strong>the</strong>sefunctions:• Place <strong>the</strong> cursors at <strong>the</strong> locations used to measure <strong>the</strong> amplitudes <strong>and</strong> period of <strong>the</strong><strong>ECG</strong>/<strong>Pulse</strong> cycle.• Transfer <strong>the</strong> names of <strong>the</strong> ma<strong>the</strong>matical functions used to determine <strong>the</strong> amplitudes <strong>and</strong> timeinterval to <strong>the</strong> Journal using <strong>the</strong> Add Title to Journal function in <strong>the</strong> <strong>ECG</strong> Channelpull-down menu.Cardiac Physiology – <strong>ECG</strong>-<strong>Pulse</strong>-Labs<strong>CP</strong>-1-2
• Transfer <strong>the</strong> values for <strong>the</strong> amplitudes <strong>and</strong> beat period to <strong>the</strong> Journal using <strong>the</strong> Add Ch. Datato Journal function in <strong>the</strong> <strong>ECG</strong> Channel pull-down menu.Figure <strong>CP</strong>-1-L3: <strong>ECG</strong>, pulse <strong>and</strong> pulse integral displayed on <strong>the</strong> Analysis window with cursors inplace to measure <strong>the</strong> R-<strong>Pulse</strong> interval with <strong>the</strong> T2-T1 function.7. 7 Use <strong>the</strong> mouse to click on <strong>and</strong> drag <strong>the</strong> cursors to specific points on <strong>the</strong> <strong>ECG</strong>/<strong>Pulse</strong> recordingto measure <strong>the</strong> following:• <strong>The</strong> beat period, which is <strong>the</strong> time interval between two adjacent R waves (Figure <strong>CP</strong>-1-L3).To measure <strong>the</strong> beat period, place one cursor on <strong>the</strong> peak of a R wave <strong>and</strong> <strong>the</strong> second cursoron <strong>the</strong> peak of <strong>the</strong> adjacent R wave. <strong>The</strong> value for T2-T1 on <strong>the</strong> <strong>ECG</strong> channel is <strong>the</strong> beatperiod. Measure <strong>the</strong> beat period for two additional pairs of R waves.• <strong>The</strong> R-<strong>Pulse</strong> interval, which is <strong>the</strong> time interval between <strong>the</strong> peak of <strong>the</strong> R wave <strong>and</strong> <strong>the</strong>peak of <strong>the</strong> pulse wave that follows <strong>the</strong> R wave (Figure <strong>CP</strong>-1-L3). To measure this interval,place one cursor on <strong>the</strong> peak of a R wave <strong>and</strong> <strong>the</strong> second cursor on <strong>the</strong> peak of <strong>the</strong> pulsewave to its right. <strong>The</strong> value for T2-T1 on any channel is this interval. Measure this intervalfor two additional <strong>ECG</strong>/<strong>Pulse</strong> cycles.8. Calculate <strong>the</strong> following values <strong>and</strong> record your results into <strong>the</strong> Journal or on a separate datatable:• <strong>The</strong> average beat period, in seconds/beat.• <strong>The</strong> heart rate, which is expressed in beats per minute <strong>and</strong> calculated from <strong>the</strong> average beatperiod by using <strong>the</strong> following equation:▪Heart Rate (beats/minute) = 60 seconds/minute/# seconds/beat• <strong>The</strong> average R-<strong>Pulse</strong> interval.Cardiac Physiology – <strong>ECG</strong>-<strong>Pulse</strong>-Labs<strong>CP</strong>-1-3
Questions1. What electrical <strong>and</strong> mechanical events take place during <strong>the</strong> R wave?2. What events take place in <strong>the</strong> cardiovascular system during <strong>the</strong> R <strong>and</strong> pulse waves?3. <strong>The</strong> signal recorded on <strong>the</strong> <strong>Pulse</strong> channel is rate of change of <strong>the</strong> blood pressure entering <strong>the</strong>subject’s finger tip. When this signal is integrated, <strong>the</strong> waveform displayed on <strong>Pulse</strong> Integralchannel is similar to an arterial pressure curve. Is <strong>the</strong>re a short plateau or dip during each cycledisplayed on <strong>the</strong> <strong>Pulse</strong> Integral channel? This plateau or dip is called <strong>the</strong> dichrotic notch. If youoptimized <strong>the</strong> tension on <strong>the</strong> plethysmograph strap to record a large, clean pulse wave fromyour subject, you should see a dichrotic notch on <strong>the</strong> <strong>Pulse</strong> Integral channel.4. What event recorded on <strong>the</strong> <strong>ECG</strong> channel corresponds to <strong>the</strong> dichrotic notch? What causes adichrotic notch?Exercise 2: <strong>The</strong> <strong>ECG</strong> <strong>and</strong> <strong>the</strong> <strong>Pulse</strong> in O<strong>the</strong>r SubjectsProcedureAim: To measure <strong>and</strong> correlate <strong>the</strong> <strong>ECG</strong> <strong>and</strong> <strong>the</strong> pulse in o<strong>the</strong>r subjects.Repeat Exercise 1 on o<strong>the</strong>r subjects.Data AnalysisAnalyze <strong>the</strong> data for each subject using <strong>the</strong> same techniques used in Exercise 1.Questions1. Is <strong>the</strong> time interval between <strong>the</strong> R wave <strong>and</strong> <strong>the</strong> peak of <strong>the</strong> pulse wave <strong>the</strong> same for eachsubject? Does this time interval differ with heart rate?2. Do you see any differences in <strong>the</strong> size or shape of dichrotic notches from different subjects?Remember: <strong>the</strong> tension on <strong>the</strong> plethysmograph strap affects <strong>the</strong> shape of <strong>the</strong> pulse recording.3. Is <strong>the</strong> time interval between <strong>the</strong> peak of <strong>the</strong> pulse wave <strong>and</strong> <strong>the</strong> bottom of <strong>the</strong> dichrotic notch <strong>the</strong>same for each subject?4. What factors would affect <strong>the</strong> shape or position of <strong>the</strong> dichrotic notch?Exercise 3: <strong>The</strong> Effect of Cold on <strong>the</strong> <strong>Pulse</strong>ProcedureAim: To measure <strong>the</strong> effects of cold on <strong>the</strong> pulse <strong>and</strong> heart rate.1. Attach <strong>the</strong> plethysmograph to <strong>the</strong> middle finger of <strong>the</strong> subject’s left h<strong>and</strong>. Instruct <strong>the</strong> subject tosit quietly with <strong>the</strong>ir h<strong>and</strong>s in <strong>the</strong>ir lap.2. Click on <strong>the</strong> Record button. <strong>The</strong> signal should begin scrolling across <strong>the</strong> screen.3. Click on <strong>the</strong> AutoScale button at <strong>the</strong> upper margin of <strong>the</strong> <strong>ECG</strong>, <strong>Pulse</strong>, <strong>and</strong> <strong>Pulse</strong> IntegralCardiac Physiology – <strong>ECG</strong>-<strong>Pulse</strong>-Labs<strong>CP</strong>-1-4
channels. Your recording should look like Figure <strong>CP</strong>-1-L3. Use <strong>the</strong> same techniques used inExercise 1 to display <strong>the</strong> signals properly.4. When you have a suitable trace, type RoomTemp<strong>ECG</strong>/<strong>Pulse</strong> in <strong>the</strong> Mark boxto <strong>the</strong> right of <strong>the</strong> Mark button. Press <strong>the</strong> Enter key on <strong>the</strong> keyboard to attach <strong>the</strong> comment to<strong>the</strong> data. Record for a minute or two.5. Type Cold <strong>ECG</strong>/<strong>Pulse</strong> in <strong>the</strong> Mark box to <strong>the</strong> right of <strong>the</strong> Mark button. Place a bag containing amixture of ice <strong>and</strong> cold water on <strong>the</strong> subject’s left forearm. At <strong>the</strong> same time, press <strong>the</strong> Enterkey on <strong>the</strong> keyboard to attach <strong>the</strong> comment to <strong>the</strong> data. Record for two minutes while <strong>the</strong> coldpack is on <strong>the</strong> subject’s forearm.6. Type Remove in <strong>the</strong> Mark box. Simultaneously remove <strong>the</strong> ice bag <strong>and</strong> press <strong>the</strong> Enter key on<strong>the</strong> keyboard.7. Record for an additional two minutes; <strong>the</strong>n, click Stop to halt recording.8. Select Save in <strong>the</strong> File menu on <strong>the</strong> LabScribe window.Data Analysis1. Scroll through <strong>the</strong> recording <strong>and</strong> find a section of data with four or five exemplary <strong>ECG</strong>/<strong>Pulse</strong>cycles, in succession, that were recorded at room temperature.2. Use <strong>the</strong> Display Time icons, or <strong>the</strong> cursors <strong>and</strong> <strong>the</strong> Zoom between Cursors button, to adjust <strong>the</strong>Display Time of <strong>the</strong> Main window to show at least four complete <strong>ECG</strong>/<strong>Pulse</strong> cycles on <strong>the</strong>Main window.3. Click on <strong>the</strong> Analysis window icon in <strong>the</strong> toolbar (Figure <strong>CP</strong>-1-L2) to transfer <strong>the</strong> datadisplayed in <strong>the</strong> Main window to <strong>the</strong> Analysis window (Figure <strong>CP</strong>-1-L4).4. Look at <strong>the</strong> Function Table in <strong>the</strong> Analysis window <strong>and</strong> make sure <strong>the</strong> ma<strong>the</strong>matical functionsused in <strong>the</strong> analysis, V2-V1 <strong>and</strong> T2-T1, appear.5. Once <strong>the</strong> cursors are placed in <strong>the</strong> correct positions for determining <strong>the</strong> amplitude <strong>and</strong> timeintervals, transfer <strong>the</strong> names <strong>and</strong> values of <strong>the</strong> parameters measured in <strong>the</strong> Analysis window to<strong>the</strong> Journal using one of <strong>the</strong> two techniques described in Exercises 1, or transfer <strong>the</strong> values to aseparate data table.6. Use <strong>the</strong> mouse to click on <strong>and</strong> drag <strong>the</strong> cursors to specific points on <strong>the</strong> <strong>ECG</strong>/<strong>Pulse</strong> recording tomeasure <strong>the</strong> following:• <strong>The</strong> pulse wave amplitude. To measure <strong>the</strong> pulse wave amplitude, place one cursoron <strong>the</strong> baseline that precedes <strong>the</strong> pulse wave <strong>and</strong> <strong>the</strong> second cursor on <strong>the</strong> peak of <strong>the</strong>pulse wave. <strong>The</strong> value for V2-V1 on <strong>the</strong> <strong>Pulse</strong> channel is this amplitude. Determine <strong>the</strong>pulse amplitude for three pulse waves.• <strong>The</strong> beat period. Measure <strong>the</strong> time between two adjacent R waves using <strong>the</strong> sametechnique employed in Exercises 1 <strong>and</strong> 2. Determine <strong>the</strong> beat period forthree.<strong>ECG</strong>/<strong>Pulse</strong> cycles.• <strong>The</strong> R-<strong>Pulse</strong> interval. Measure <strong>the</strong> time between <strong>the</strong> peak of <strong>the</strong> R wave <strong>and</strong> <strong>the</strong> peakof <strong>the</strong> pulse wave using <strong>the</strong> same technique employed in Exercises 1 <strong>and</strong> 2. Determinethis interval for three <strong>ECG</strong>/<strong>Pulse</strong> cycles.Cardiac Physiology – <strong>ECG</strong>-<strong>Pulse</strong>-Labs<strong>CP</strong>-1-5
Figure <strong>CP</strong>-1-L4: <strong>ECG</strong>, pulse <strong>and</strong> pulse integral displayed on <strong>the</strong> Analysis window with cursors inplace to measure <strong>the</strong> pulse amplitude with V2-V1 function.7. Repeat Steps 5 <strong>and</strong> 6 for <strong>the</strong> data at 1 <strong>and</strong> 2 minutes into <strong>the</strong> cooling period, <strong>and</strong> at 1 <strong>and</strong> 2minutes into <strong>the</strong> rewarming period8. Calculate <strong>the</strong> following values <strong>and</strong> type your results into <strong>the</strong> Journal or on a separate data table:• <strong>The</strong> average pulse wave amplitude while <strong>the</strong> forearm was at room temperature, cooled for 1<strong>and</strong> 2 minutes, or rewarmed for 1 <strong>and</strong> 2 minutes.• <strong>The</strong> heart rate while <strong>the</strong> forearm was at room temperature, cooled for 1 <strong>and</strong> 2 minutes, orrewarmed for 1 <strong>and</strong> 2 minutes.• <strong>The</strong> average R-<strong>Pulse</strong> interval while <strong>the</strong> forearm was at room temperature, cooled for 1 <strong>and</strong> 2minutes, or rewarmed for 1 <strong>and</strong> 2 minutes.Questions1. What effect does cooling have on <strong>the</strong> amplitude of <strong>the</strong> pulse wave?2. Does cooling of <strong>the</strong> forearm affect <strong>the</strong> heart rate, or <strong>the</strong> time interval between <strong>the</strong> R wave <strong>and</strong><strong>the</strong> peak of <strong>the</strong> pulse wave?3. Through what mechanism does cooling affect <strong>the</strong> peripheral circulation?4. What o<strong>the</strong>r factors may affect peripheral circulation?Exercise 4: <strong>The</strong> Effect of Heat on <strong>the</strong> <strong>Pulse</strong>ProcedureAim: To measure <strong>the</strong> effects of heat on <strong>the</strong> pulse <strong>and</strong> heart rate.1. Move <strong>the</strong> plethysmograph to <strong>the</strong> middle finger of <strong>the</strong> subject’s right h<strong>and</strong>.2. Follow <strong>the</strong> directions used in Exercise 3 to do an experiment on <strong>the</strong> right forearm of <strong>the</strong> subjectwith a bag of warm water. Mark <strong>the</strong> recording to indicate when <strong>the</strong> bag of warm water wasCardiac Physiology – <strong>ECG</strong>-<strong>Pulse</strong>-Labs<strong>CP</strong>-1-6
applied <strong>and</strong> removed from <strong>the</strong> forearm.Questions1. What effect does warming have on <strong>the</strong> amplitude of <strong>the</strong> pulse wave?2. Does warming of <strong>the</strong> forearm affect <strong>the</strong> heart rate, or <strong>the</strong> time interval between <strong>the</strong> R wave <strong>and</strong><strong>the</strong> peak of <strong>the</strong> pulse wave?3. Through what mechanism does warming affect <strong>the</strong> peripheral circulation?Cardiac Physiology – <strong>ECG</strong>-<strong>Pulse</strong>-Labs<strong>CP</strong>-1-7