Geochemical Techniques for Detection of Blind ... - Geoscience BC
Geochemical Techniques for Detection of Blind ... - Geoscience BC
Geochemical Techniques for Detection of Blind ... - Geoscience BC

You also want an ePaper? Increase the reach of your titles
YUMPU automatically turns print PDFs into web optimized ePapers that Google loves.
ACKNOWLEDGEMENTSWe thank <strong>Geoscience</strong> <strong>BC</strong> <strong>for</strong> the financial support which made this project possible. We also would like to thank Gold FieldsCanada Exploration and Consolidated Woodjam Copper Corp. <strong>for</strong> allowing access the Woodjam property and providing the basemap data used <strong>for</strong> preparing this report. We appreciated the logistical field support provided by Gold Fields Canada and extenda special thanks to R. Sherlock, A. Rainbow, J. Blackwell and M. Eckfeldt <strong>of</strong> Gold Fields Canada and A. Annejohn <strong>for</strong> their supportduring planning, fieldwork and report writing <strong>of</strong> this project.Activation Laboratories Ltd., ALS Ltd. and ACME Labs are thanked <strong>for</strong> their generous contributions which allows us to include theextensive dataset provided with this report.Finally we thank Arne Toma <strong>for</strong> the layout <strong>of</strong> this report and Sara Jenkins <strong>for</strong> the cover image.This is MDRU Publication Number 327.© 2013 by MDRU and The University <strong>of</strong> British Columbia. All rights reserved.No part <strong>of</strong> this document may be reproduced or transmitted in any <strong>for</strong>m or by any means, electronic, mechanical, photocopying,recording, or otherwise, without prior written permission <strong>of</strong> the authors.Recommended citation:Bissig, T., Heberlein, D.R., and Dunn, C., 2013, <strong>Geochemical</strong> <strong>Techniques</strong> <strong>for</strong> <strong>Detection</strong> <strong>of</strong> <strong>Blind</strong> Porphyry Copper-GoldMineralization under Basalt Cover, Woodjam Property, South-Central British Columbia (NTS 093A/03, /06): <strong>Geoscience</strong> <strong>BC</strong> Report2013-17.
<strong>Geochemical</strong> <strong>Techniques</strong> <strong>for</strong> <strong>Detection</strong> <strong>of</strong> <strong>Blind</strong>Porphyry Copper-Gold Mineralization under BasaltCover, Woodjam Property, South-Central BritishColumbia (NTS 093A/03, /06)Thomas Bissig 1 , David R. Heberlein 2 and Colin Dunn 31Mineral Deposit Research Unit, Department <strong>of</strong> Earth Ocean and Atmospheric Sciences, The University <strong>of</strong> British Columbia2020 – 2207 Main Mall, Vancouver, <strong>BC</strong>, V6T 1Z4, Canada. Email: tbissig@eos.ubc.ca.2Heberlein Geoconsulting, Suite 303-108 West Esplanade, North Vancouver, <strong>BC</strong>.3Colin Dunn Consulting Inc., 8756 Pender Park Drive, North Saanich, <strong>BC</strong>.ABSTRACTMiocene to Pleistocene basaltic rocks <strong>of</strong> the Chilcotin Group cover bedrock prospective <strong>for</strong> porphyry Cu-Au mineralizationover a large area <strong>of</strong> south-central British Columbia and has provided significant challenges to exploration in these areas. Thisreport presents the findings <strong>of</strong> a study aimed at identifying deep penetrating geochemical techniques potentially capable <strong>of</strong>detecting mineralization under basalt cover.Samples have been collected over known porphyry style Cu-Au mineralization at the Deerhorn and Three Firs prospects inthe Woodjam area (Minfile No. 093A 078). In both areas, Chilcotin Group basalt cover occurs adjacent to concealed mineralizationand at Three Firs an angled drill hole intersected basalt be<strong>for</strong>e hitting mineralization. A variety <strong>of</strong> sample media have beencollected, including Ae-horizon and B-horizon soils, spruce bark and spruce twigs as well as a limited number <strong>of</strong> clay andcarbonate amygdules in basalt. Electrical conductivity, pH, H + and H + a measurements were per<strong>for</strong>med on Ae- or upper B-horizonsoils whereas B-horizon soils have been analyzed using seven different leach techniques.The results <strong>of</strong> this study indicate that detection <strong>of</strong> mineralization under basalt cover is feasible. Partial leach techniques onB-horizon soils, such as Bioleach, Enzyme Leach, or Ionic Leach digestions gave good contrast anomalies in soils attributable tomineralization concealed by glaci<strong>of</strong>luvial sediments and/or basalt. Elements that yielded compelling anomalies over mineralizedareas in B-horizon soils at Deerhorn, Three Firs or both include: As, Cu, Zn, Ni, Se, W, Ag, REE, Tl. Results from more aggressiveleaches (4 acid, aqua regia) are influenced by the type <strong>of</strong> cover (e.g., basalt vs. glaci<strong>of</strong>luvial sediment) and thus, the 4 acidtechnique can help in delineating geological units. Soil pH, H + , H + a and electrical conductivity data are generally consistent withthe soil geochemistry. Inverse Difference Hydrogen (IDH) values are relatively low directly above mineralization and high at eithermargin, defining rabbit ear anomalies, irrespective <strong>of</strong> the type <strong>of</strong> cover. Spruce bark and twig geochemistry yield compellingsignals <strong>for</strong> alkali metals Rb, Cs and K which are elevated above mineralization and are interpreted to reflect potassic alterationwhich is genetically and spatially closely related to porphyry style Cu-Au mineralization. At Three Firs spruce geochemistryreturned elevated Rb and Cs over basalt cover and suggest the presence <strong>of</strong> potassic-altered rocks underneath. Limited datasuggest that clay amygdules in basalt covering mineralization contain elevated Ag, Au, V, Cu and In, whereas calcite amygduleshave elevated Mn and As.Given that Chilcotin group basalts are vesicular and commonly affected by columnar jointing they are likely conducive tovertical ion transport from oxidizing sulfide bodies at depth. Deep penetrating exploration geochemistry should yield resultscomparable to areas where mineralization is covered by unconsolidated glaci<strong>of</strong>luvial sediments.1
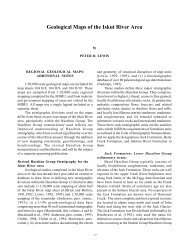
INTRODUCTIONThis report summarizes the results <strong>of</strong> the <strong>Geoscience</strong><strong>BC</strong> project entitled: “Seeing through Chilcotin basalts: thegeochemical signal <strong>of</strong> what is hidden underneath (092P,093A, C)”. Field components <strong>of</strong> the study were undertaken inconjunction with another <strong>Geoscience</strong> <strong>BC</strong> project in the samearea entitled: “Evaluation <strong>of</strong> plant exudates to assist in mineralexploration and the development <strong>of</strong> simple and cost effectivefield procedures and analytical methods” (see Heberlein et al.,2013).Large areas prospective <strong>for</strong> porphyry and epithermal-stylemineralization in central British Columbia are covered by eitherglaci<strong>of</strong>luvial sediments or young basalt units, most importantly<strong>of</strong> the Miocene to Pleistocene Chilcotin Group (Figure 1).Other recently completed <strong>Geoscience</strong> <strong>BC</strong>-funded projects havedemonstrated that geochemical methods can assist in seeingthrough exotic cover (e.g., Cook and Dunn, 2007; Dunn et al.,2007; Barnett and Williams, 2009; Heberlein, 2010; Heberleinand Samson, 2010; Heberlein and Dunn, 2011). In areas wherebasaltic lavas cover the bedrock, application <strong>of</strong> explorationgeochemistry techniques has received relatively little attentionin investigating the underlying bedrock, in part due to a lack <strong>of</strong>basalt covered sites in <strong>BC</strong> with well-known mineralization, wheredeep-penetrating geochemical methods could be tested. Thepresent study is aimed at establishing a geochemical strategyto ‘see through’ the basalt cover, using a variety <strong>of</strong> analyticaltechniques on different sample media. Porphyry mineralizationat the Woodjam property (Figure 1), the study site chosen <strong>for</strong>this project, occurs in close proximity to basalt cover and mayalso be present underneath.CHILCOTIN BASALTThe Chilcotin Group comprises mostly olivine-phyricbasalts occurring as coherent lavas, with lesser tuffs andsedimentary units including sandstone, siltstone, shale andconglomerate (Bevier, 1983; Dohaney, 2009). Basalt flow units,Figure 1. Regional geology <strong>of</strong> central British Columbia and location <strong>of</strong> the Woodjam study area as well as the nearby major porphyry deposits <strong>of</strong> Gibraltar and MountPolley (after Massey et al., 2005); see inset <strong>for</strong> location within British Columbia2
considered to be part <strong>of</strong> the Chilcotin Group, include lavas <strong>of</strong>Late Oligocene, Miocene and locally Pleistocene, age (Bevier,1983). These units are not hydrothermally altered and weatherbrown and dark grey. They typically consist <strong>of</strong> highly vesiculatedcoherent lavas, featuring variable degrees <strong>of</strong> columnar jointing.Chemically, they cover a broad range <strong>of</strong> compositions, from alkaliolivine-basalt and basaltic andesite to less common hawaiite,mugearite and trachyandesite (Dohaney, 2009). Traditionally,Chilcotin basalt units have been mapped as extensive plateaus(e.g., Massey et al., 2005; Figure 1) and are best exposed in theincised valleys <strong>of</strong> present-day rivers. Recent work (Andrews andRussell, 2008; Dohaney, 2009) has established that most <strong>of</strong> thebasalt lavas actually followed low-lying topography and, in manyplaces where the Chilcotin Group is mapped, the basalt covermay be thin or absent making surface geochemical explorationin those areas potentially viable. Their near surface presence iscommonly indicated by angular boulders and colluvial debris.Chilcotin Group rocks are commonly covered by extensiveQuaternary glacial sediments.<strong>Geochemical</strong>ly, the Chilcotin Group basalt units aredistinctive from the underlying Triassic-age Nicola Group basaltflows and basalt-derived volcaniclastic sediments. In contrast tothe Nicola Group (Vaca, 2012), these units have higher Ti, Ta, Nb,Th, U (Figure 2A) and light rare earth element contents (Figure2B), do not have a clear-cut calc-alkalic arc signature, and plot inthe tholeiitic (i.e., MORB) fields (Figures 2C, D; Dohaney, 2009).Chilcotin Group basalts also have higher Ni (110 to 180 ppm) thanthe Nicola Group (1395 ppm) in the study area. The Nicola Groupand its along-strike equivalent Takla Group, host porphyry Cu-Aumineralization, including the Woodjam prospects (Figures 1, 3).Field sampling <strong>for</strong> this study was carried out over mineralizationhosted by the Nicola Group, partially covered by the ChilcotinGroup basalt units, the latter not known to be mineralized.Figure 2. Whole-rock geochemistry <strong>of</strong> basalt to basaltic andesite in the Woodjam area, south-central British Columbia. Blue symbols indicate Triassic Nicola Groupand red squares, Late Oligocene to Pliocene Chilcotin Group basalt sampled in the western part <strong>of</strong> the Woodjam property. Red diamonds indicate one sample takennortheast <strong>of</strong> the Deerhorn study area. The Nicola Group samples have an arc signature, whereas the Chilcotin and Deerhorn basalt units have a within-plate totholeiitic signature: A) and B) chondrite-normalized spider diagrams (chondrite values from Sun and McDonough, 1989); C) basalt classification diagram; D) Jensencation plot (Pearce et al., 1973; Jensen1976) <strong>for</strong> basalt classification (diagrams modified from Rollinson, 1993; data <strong>for</strong> Nicola Group basalt units from Vaca, 2012).Abbreviations: IAT, island-arc tholeiite; MORB, mid-ocean ridge basalt.3
Figure 3. Bedrock geology <strong>of</strong> the Woodjam South prospect, south-central British Columbia. (Modified from Blackwell et al. 2012; Rainbow et al. 2013). Map is in UTMNAD 83 projection, Zone 10. Red outlines denote surface projection <strong>of</strong> the +0.2 g/t Au equivalent mineralization. Specific drillhole and sample locations mentionedin the text are indicated. See Figure 4 <strong>for</strong> cross section A-A’.BENEFITS TO THE MINING INDUSTRYThis study is designed to test whether a geochemicalsignal <strong>of</strong> mineralization located beneath Chilcotin basalt isdetectable using soil and vegetation geochemistry. It also aimsto provide the mineral exploration community with a betterunderstanding <strong>of</strong> different sampling media that can be used<strong>for</strong> geochemical exploration in regions with basalt cover. Thestudy provides comparisons <strong>of</strong> element concentrations in soilsand plants (spruce) subjected to various digestion methods andassesses the relative capabilities <strong>of</strong> each medium <strong>for</strong> recordingthe secondary geochemical-dispersion patterns <strong>of</strong> the geology,including blind mineral deposits, under cover. It also examinesthe trace-element composition <strong>of</strong> coatings and materials withinvesicles in the basalt units to determine if mineralization signalsare preserved; a selection <strong>of</strong> results is reported herein and thefull data tables are provided electronically.PROJECT AREATest sites selected <strong>for</strong> this study lie within Gold FieldsCanada Exploration and Consolidated Woodjam Copper Corp.’sWoodjam property, which is located in the Cariboo MiningDistrict <strong>of</strong> central <strong>BC</strong> (NTS map areas 093A/03/ 06; Figure 3). Theproperty, which consists <strong>of</strong> 178 mineral claims totalling 58 470ha, lies about 50 km to the northeast <strong>of</strong> Williams Lake. Horsefly,the nearest settlement and logistical base <strong>for</strong> the fieldwork, iswithin the property boundary and is accessible by a paved roadfrom Williams Lake.The two test sites, known as Deerhorn and Three Firs4
(<strong>for</strong>merly known as Megalloy; Figure 3), lie 8 km to the southeastand 12 km south, respectively, <strong>of</strong> Horsefly; both are readilyaccessible via a network <strong>of</strong> well-maintained logging roads.Within those areas, an east-oriented and an east-northeastorientedsample traverse pass from glacio-fluvial sedimentcoveredareas into glaci<strong>of</strong>luvial sediment and/or basalt-coveredareas (Figure 3). On both transects, mineralization is knownto underlie the unconsolidated sediments near the transitionto basalt-covered areas. At the time <strong>of</strong> writing, no mineralizedzone directly underlying basalt cover had been defined bydrilling, although at Three Firs one <strong>of</strong> three angled drill holes(MAG12-04; Figure 3; Consolidated Woodjam Copper Corp.,2012a) passes through about 60 m <strong>of</strong> glaci<strong>of</strong>luvial material andabout 30 m <strong>of</strong> basalt into mineralized bedrock. The top <strong>of</strong> thebedrock, which is fragmental and clay rich, contains Fe and Mnoxides just below the basalt; this can be interpreted either as apaleo-regolith or a fault gouge.SURFICIAL ENVIRONMENTThe project area lies at the boundary between theFraser Plateau and Quesnel Highland physiographic regions <strong>of</strong>central <strong>BC</strong> (Holland, 1964). The terrain in the study areas hascharacteristics <strong>of</strong> both regions. The Deerhorn test site (Figure3) lies at a fairly sharp transition between relatively flat, rollingtopography typical <strong>of</strong> the Fraser Plateau on the western side<strong>of</strong> the mineralized zone, and low hills <strong>of</strong> the Quesnel Highlandto the east. Elevations across the Deerhorn sample traverses,which cross the transition, vary from 900 m at the west to 1030m at the highest point, close to the eastern end. A number<strong>of</strong> small lakes and ponds are dotted throughout the area; thelargest <strong>of</strong> these is Mica Lake, which lies on the southwesternside <strong>of</strong> the mineralized zone. Lakes are linked by small streamsand boggy depressions, which <strong>for</strong>m part <strong>of</strong> a dendritic drainagepattern connecting with the Horsefly River about 5 km to thenortheast <strong>of</strong> Deerhorn.Three Firs lies in a similar physiographic setting toDeerhorn (Figure 3). More than half <strong>of</strong> the Three Firs sampletraverse crosses relatively flat terrain typical <strong>of</strong> the FraserPlateau, where elevations range from 975 to 1000 m. At theselower elevations, a number <strong>of</strong> swamps and small creeks definea northwest-flowing dendritic drainage pattern, which mergeswith Woodjam Creek some 8 km to the northwest. The terraingradually rises eastward into the rounded hills <strong>of</strong> the QuesnelHighland, where the maximum elevation at the eastern end <strong>of</strong>the line is 1140 m.Quaternary glacial deposits cover the mineralization atboth study areas. To the east <strong>of</strong> Deerhorn, surficial depositsconsist <strong>of</strong> an intermittent till veneer, which mantles the hillsidesand becomes thicker in topographic depressions. The maximumthickness <strong>of</strong> the till is unknown but the presence <strong>of</strong> outcrops onthe northern flank <strong>of</strong> the hillside east <strong>of</strong> Deerhorn suggests thatit is likely to be no more than a few metres thick at that location.Glacial land<strong>for</strong>ms, such as drumlinoid features, are presentin this area and east <strong>of</strong> the sample traverse. Their long axesindicate a west-northwesterly ice-flow direction. Cover thickensrapidly westward onto the lowlands and drilling at Deerhorn hasshown that the bedrock surface is buried beneath up to 60 m<strong>of</strong> till and glaci<strong>of</strong>luvial sediments (Skinner, 2010; Del Real et al.,2013a, b). Surficial deposits on the eastern shore <strong>of</strong> Mica Lakeand southern limit <strong>of</strong> the projected mineralized zone (Figure 3)consist <strong>of</strong> well-sorted sand and gravel <strong>of</strong> probable glaci<strong>of</strong>luvialorigin; the distribution <strong>of</strong> these deposits is unknown. A hillconsisting <strong>of</strong> basaltic rocks assigned to the Chilcotin Group liesto the east-northeast <strong>of</strong> the mineralized zone (Figure 3). Samplescollected along the east- and northeast-oriented traverse largelycome from this basalt-covered area. The depth to bedrock belowthe basalt flows and potential presence <strong>of</strong> mineralization belowthis basalt is unknown.At Three Firs, the cover environment comprises a Tertiarybasalt unit beneath the glacial deposits in the western part <strong>of</strong>the sample traverse. Drilling has indicated that the basalt maycover a part <strong>of</strong> the mineralized zone. The basalt consists <strong>of</strong> afresh, black, highly vesicular flow unit up to 20 m thick. NicolaGroup rocks at its lower contact are fragmented and intenselyclay-altered over several metres in what is either a gougefilledfault zone or a paleoregolith. The extent <strong>of</strong> basalt coveris unknown, although its distribution is most likely restrictedto paleovalleys rather than <strong>for</strong>ming a continuous cap over themineralized area. This would be typical <strong>of</strong> other occurrences <strong>of</strong>Chilcotin Group flows in the region (Dohaney, 2009). Surficialdeposits at Three Firs consist predominantly <strong>of</strong> glacial till, which<strong>for</strong>ms a blanket 40–100 m thick. There is no outcrop in thevicinity <strong>of</strong> the mineralization. Till cover appears to thin graduallyeastward and outcrops <strong>of</strong> a distinctive ‘turkey-track’ feldsparporphyritic andesite become widespread in the east-central part<strong>of</strong> the sample traverse. On the hillside, at the eastern end <strong>of</strong> thetraverse, till cover is present as a thin veneer <strong>of</strong> no more than ametre or two thick.REGIONAL GEOLOGICAL SETTINGThe Woodjam prospect lies in the southern part <strong>of</strong> thehighly prospective Quesnel terrane: a Late Triassic to Early Jurassicmagmatic arc complex, which extends <strong>for</strong> most <strong>of</strong> the length <strong>of</strong>the Canadian Cordillera. It is flanked to the east by assemblages<strong>of</strong> Proterozoic and Paleozoic carbonate and siliciclastic rocks <strong>of</strong>ancestral North American affinity, but is separated from themby a sliver <strong>of</strong> oceanic basalt and chert <strong>of</strong> the Slide Mountainterrane (Schiarizza et al., 2009, 2013). Oceanic rocks <strong>of</strong> the LatePaleozoic to Early Mesozoic Cache Creek terrane bound theQuesnel terrane to the west. The southern part <strong>of</strong> the Quesnelterrane hosts a number <strong>of</strong> important Cu-Au porphyry deposits;nearby examples include Gibraltar and Mount Polley.In the Woodjam area, the Quesnel terrane is representedby Middle to Upper Triassic volcano-sedimentary rocks <strong>of</strong> theNicola Group (Figures 1, 3). Locally, this consists <strong>of</strong> a shallownorthwest-dipping sequence <strong>of</strong> volcanic and volcanic-derived5
sedimentary rocks, which include augite-phyric basalt flows andpolymictic breccias containing latite, trachyte and equivalentvolcanic clasts (Gold Fields Canada Exploration, unpublisheddata, 2012). Sandstone and conglomerate are intercalated withthe volcanic units. A suite <strong>of</strong> more or less coeval intrusions<strong>of</strong> alkaline to calcalkaline affinity intrudes the volcanic andsedimentary sequence. These intrusions include the EarlyJurassic Takomkane batholith, located to the south and east <strong>of</strong>the project area, and a number <strong>of</strong> smaller syenite, monzonite,quartz monzonite and monzodiorite stocks and dikes within theWoodjam property itself, many <strong>of</strong> which are associated with Cu-Au mineralization.The Woodjam South property contains several centres<strong>of</strong> Early Jurassic porphyry-style Cu-Mo-Au mineralization(Schiarizza, 2009; Sherlock et al., 2012; Mineral Deposit ResearchUnit, unpublished data, 2011). Style <strong>of</strong> mineralization, hostrocks and metal association vary from one mineralized centreto another; these include the Southeast, Takom, Megabuck,Deerhorn and Three Firs zones (Figure 3; Del Real et al., 2013a).The Southeast zone is at the most advanced stage <strong>of</strong> explorationand is currently undergoing advanced exploration drilling.Copper-molybdenum mineralization is hosted in intrusiverocks, which <strong>for</strong>m part <strong>of</strong> the Takomkane batholith. Deerhornis the next most advanced prospect and is currently at theadvanced exploration drilling stage. It is characterized by Cu-Aumineralization hosted in Nicola Group volcanic rocks and a series<strong>of</strong> small porphyry stocks and dikes (see below). The remainingprospects are all at the exploratory drilling stage. Three Firsrepresents a new discovery that was made early in 2012(Consolidated Woodjam Copper Corp., 2012a); it is currently inthe initial drill testing stage. Nicola Group rocks in much <strong>of</strong> thewestern part <strong>of</strong> the Woodjam South property area and an areato the east <strong>of</strong> Deerhorn are covered by younger Cenozoic basaltflows belonging to the Chilcotin Group. This younger volcanicand sedimentary rock cover masks prospective areas <strong>of</strong> theunderlying Nicola Group.GEOLOGY OF TEST AREASDeerhornDeerhorn is a blind zone <strong>of</strong> porphyry Cu-Au–stylemineralization, which was discovered by drilling a largechargeability anomaly in 2007 (Skinner, 2010). The mineralization,defined by the red +0.2 g/t Au equivalent outline in Figure 3, is thesurface projection <strong>of</strong> a pipe-like body containing a higher-gradeshoot, which plunges steeply to the southeast (Figure 4; DelReal et al. 2013b, Gold Fields Canada Exploration, unpublisheddata, 2012). Its dimensions are approximately 350 m in strike,100 m in width and 200 m in depth (Consolidated WoodjamCopper Corp., 2012b). Higher-grade mineralization is enclosedwithin a much more extensive lower-grade envelope defined byquartz and magnetite stockwork and veinlets, and disseminatedchalcopyrite mineralization. Low-grade mineralization iscoincident with an arcuate chargeability anomaly, which extendsnorthwest <strong>of</strong> the Deerhorn drill site and continues south andwest to the Megabuck East and Megabuck prospects.Geological mapping and reconstruction <strong>of</strong> the bedrockgeology from drilling by Gold Fields Canada Exploration (Figure3; Blackwell et al. 2012) indicate that the mineralization ishosted in a southwest-striking, northwest-dipping package <strong>of</strong>Nicola Group andesite and volcanic-derived sandstone. Highergrade mineralization is associated with a number <strong>of</strong> northweststrikingdike-like monzonite bodies (Figure 4), which cross thecontact between volcanic-derived sandstone in the southeastand andesite in the northwest <strong>of</strong> the mineralized zone. Theintrusion and volcano-sedimentary units are <strong>of</strong>fset by sets <strong>of</strong>west-northwest and northeast striking faults (Gold Fields CanadaExploration, unpublished data, 2012). Mineralization subcropsbeneath a variable cover <strong>of</strong> Quaternary glacial and glaci<strong>of</strong>luvialdeposits, which consist <strong>of</strong> a till blanket up to 40 m thick over themineralization and a sequence <strong>of</strong> overlying glaci<strong>of</strong>luvial sand andgravel exposed in road-cuts near the southeastern shore <strong>of</strong> MicaLake; the extent <strong>of</strong> these deposits is unknown. To the northeast<strong>of</strong> the mineralized area, coherent basalt flows, presumably <strong>of</strong>the Chilcotin Group, are present. The thickness <strong>of</strong> these basaltsis unknown but they appear to be directly underlying the soilpr<strong>of</strong>ile in at least part <strong>of</strong> the area.Three Firs (Megalloy)Bedrock geology <strong>of</strong> the Three Firs study area is not wellunderstood. Mineralization was only discovered at this prospectduring the spring <strong>of</strong> 2012 and, at the time <strong>of</strong> sampling <strong>for</strong> thisstudy, only three holes had encountered significant Cu-Aumineralization (Consolidated Woodjam Copper Corporation,2012a). What makes this study area appealing from a deeppenetrating–geochemistrystandpoint is the presence <strong>of</strong> a basaltunit, inferred to be part <strong>of</strong> the Chilcotin Group, which overliesat least part <strong>of</strong> the mineralized zone. The extent <strong>of</strong> the basaltis unknown and difficult to resolve from the interpretation<strong>of</strong> ground and airborne magnetic data (Gold Fields CanadaExploration, unpublished data, 2012). Drilling shows that itconsists <strong>of</strong> one or several coherent flows and <strong>for</strong>ms a cap atleast 20 m thick overlying the altered and mineralized NicolaGroup rocks. The known distribution <strong>of</strong> basalt and the surfaceprojections <strong>of</strong> the mineralized drill intersections are illustratedin Figure 3 (Gold Fields Canada Exploration, unpublished data,2012) and indicated <strong>for</strong> reference in the geochemical plots below.Overlying the basalt are Quaternary glacial sediments. Whereobserved in drill road exposures, these appear to consist <strong>of</strong> aboulder till containing abundant large rounded clasts (up to 1 min diameter) <strong>of</strong> distinctive ‘turkey-track’ andesite porphyry thatis known to outcrop near the eastern end <strong>of</strong> the sample traverseand immediately to the southeast. The size and composition <strong>of</strong>the boulders indicate that the till is locally derived and possibly<strong>for</strong>ms only a thin veneer across the eastern part <strong>of</strong> the surveyarea.6
Figure 4. Interpreted sections through mineralization at Deerhorn. A) geology, B) sulfide assemblages and mineralization. Taken from Del Real et al. (2013b).7
FIELD PROCEDURESSoilsAt each sample station, at least one hole was dug to adepth <strong>of</strong> about 50 cm to collect a few grams <strong>of</strong> the upper Aehorizon(eluviated greyish zone immediately below the organicrichAh-horizon) <strong>for</strong> pH and conductivity measurements and theupper B-horizon (Bf- or Bm-horizon) <strong>for</strong> a variety <strong>of</strong> geochemicalanalyses (Table 1). Sample locations are shown on Figure 3and the sample types illustrated in Figure 5. An angled sampletraverse over two mineralized zones into a basalt coveredarea has been chosen to illustrate the geochemical patterns atDeerhorn. The sample locations on which most <strong>of</strong> the figuresbelow are based on are indicated in red dots on Figure 3 whereasother locations only covered in some figures are shown in black.BasaltIn addition to whole-rock analyses <strong>for</strong> three ChilcotinGroup basalt samples, eight samples <strong>of</strong> vesicle infill (amygduleshereafter) have been separated (Figure 6). These are both fromChilcotin basalt - proximal and apparently overlying sulphidemineralization at the Three Firs zone, and from drill core(WNX12-15) from an inferred background area located some 2km to the north <strong>of</strong> known mineralization (Figure 3).The amygdules consists <strong>of</strong> clay (poorly crystallinevermiculite) and carbonate (magnesian calcite). Infill wasextracted from the rock using hardened-steel tools or, in thecase <strong>of</strong> carbonate infill, hand-picked from the crushed rock.More than 0.5 g <strong>of</strong> material was collected and analyzed at ALSMinerals Limited (Vancouver) using their low detection limitaqua regia multielement method (ME-MS41L package). Theintention <strong>of</strong> this analytical work is to test the potential <strong>for</strong> clayand carbonate amygdules to record a geochemical signal fromunderlying mineralization; the results are shown in Figure 7.ANALYTICAL METHODSSamples from B-horizon soils crossing the two zones <strong>of</strong>mineralization at Woodjam (Deerhorn and Three Firs) weresubmitted <strong>for</strong> comparative analysis by several commerciallyavailable total, partial and selective extraction techniques. Thelist below provides a summary <strong>of</strong> the various analytical methodsemployed. Note that Mobile Metal Ion (MMI) results are onlydiscussed in an appendix to this report as no samples over basaltcover have been analyzed by this method:• Four-acid near-total digestion/ICP-MS: the sampleis digested with perchloric, nitric, hydr<strong>of</strong>luoric andhydrochloric acids, which dissolve the silicate portion,including most <strong>of</strong> the resistate minerals.• Aqua regia digestion/ICP-MS: a partial leach consisting<strong>of</strong> 1:3 HNO 3:HCl (acid-leachable component, especiallysulphides, amorphous oxides, carbonates and organicmatter).• Ionic Leach: a proprietary sodium cyanide leach bufferedto pH 8.5 using the chelating agents ammonium chloride,citric acid and ethylenediaminetetraacetic acid (EDTA).These bind onto labile ions extracted into solution by theTable 1. Sample media and analytical methods employed. In addition to those listed, Ah-horizon and spruce bark and twigs were collected (see Heberlein et al.,2013) at the Woodjam prospect south-central <strong>BC</strong>.Sample medium Analytical package Laboratory # samples DescriptionB-Horizon (upper) ME-MS41 ALS 1 70 Standard Aqua Regia leach (AR)B-Horizon (upper) ME-MS41L ALS 70 Ultra Trace AR high sensitivityB-Horizon (upper) ME-MS61 ALS 70 4 acid strong leach (near total digestion)B-Horizon (upper) Au-ST43L Aqua Regia ALS 70 Super-trace level gold (0.01 ppb)B-Horizon (upper) Ionic Leach ALS 70 Sodium cyanide leach buffered to pH 8.5B-Horizon (upper) Enzyme Leach Actlabs 2 70 Proprietary weak leach (amorphous oxidecoatings)B-Horizon (upper) SGH-GC-MS Actlabs 50 Proprietary weak leach-organic compoundsB-Horizon (upper) OSG-HR-GC Actlabs 50 Proprietary weak leach-sulfur compoundsB-Horizon (upper) Bioleach Actlabs 70 Proprietary weak leach-remnant from bacteriaB-Horizon 10-25 cmdepthMMI SGS 3 27 Proprietary weak leach-loosely bound surfacecoatingsVesicle infill ME-MS41L ALS 8 UltraTrace AR (high sensitivity)Basalt whole rock CCP-PKG01 ALS 3 Lithium borate fusion and completecharacterization1ALS Chemex (Vancouver)2Activation Laboratories, Ltd. (Ancaster, Ontario)3SGS Minerals Services (Lakefield, Ontario)8
Figure 5. Suite <strong>of</strong> samples collected at each sample station <strong>for</strong> this study(not shown are spruce twigs and bark), Woodjam prospect, south-centralBritish Columbia. The samples were collected together with those reported inHeberlein et al. (2013) and Ah results are discussed therein. MMI samples werenot collected over basalt but results are briefly discussed in the appendix to thisreport.Figure 6. Example <strong>of</strong> vesicular Chilcotin basalt, with beige-brown clay(vermiculite) infill and white calcite infill, from drillhole MAG¬12-04 (at 70.9 m)in the Three Firs zone, Woodjam prospect, south-central British Columbia. Thesetwo types <strong>of</strong> infill have been sepa¬rated and analyzed by inductively coupledplasma–mass spec¬trometry (ICP-MS) following an aqua regia digestion to test<strong>for</strong> a geochemical signature from underlying mineralization.sodium cyanide solution and keep them in solution.• Enzyme Leach: a proprietary method to selectivelyremove amorphous manganese-oxide coatings onsoil particles, and thereby release trace elements intosolution that are associated with these coatings.• Bioleach: Bioleach is a proprietory technology developedby Actlabs Ltd. to dissolve remnant proteins that bacteriahave left behind when they die. These proteins containelements related to concealed mineral deposits, andthey are considered to migrate upward by a variety<strong>of</strong> processes and become adsorbed on soil particles.Bioleach is designed to digest this soil component whichcan then be analyzed by ICP-MS.• Mobile Metal Ion TM (MMI): a proprietary methodrequiring no sample preparation or drying. Elements ina 50 g sample are extracted in weak solutions <strong>of</strong> organicand inorganic compounds (details not specified). MMIsolutions contain strong ligands, which detach and holdin solution metal ions loosely bound to soil particles.• Soil Gas Hydrocarbons (SGH) SM : a proprietary organicbasedgeochemical method, which detects 162 organiccompounds in the C 5 to C 17 carbon-number range. Thesecompounds provide a signature directly related tobacteriological interaction with sulphide mineralizationat depth. Interpretation using proprietary methods isundertaken by Activation Laboratories Ltd. (Ancaster,Ontario).• Organo-Sulphur Geochemistry (OSG): a proprietarymethod similar to SGH in its rationale, in that it involvesthe selective extraction <strong>of</strong> 105 organo-sulphur–basedcompounds in the C 7 –C 17 carbon series. It involves avery weak leach, almost aqueous, which isolates thecompounds by high-resolution capillary-column gaschromatography.FIELD MEASUREMENTSSoil pH and Electrical Conductivity MeasurementsSamples <strong>for</strong> soil pH and electrical conductivity (EC)measurements were collected from both study areas. Wherepossible, material was collected from the top centimetre <strong>of</strong> theleached Ae-horizon (in podzol pr<strong>of</strong>iles) and from the top <strong>of</strong> theB-horizon, where the Ae-horizon was either absent or poorlydeveloped (e.g., in brunisol pr<strong>of</strong>iles). At sample sites with poordrainage, where organic material comprises the upper part <strong>of</strong>the pr<strong>of</strong>ile, no sample was collected. Samples were placed inheavy-duty double-seal Ziploc® plastic bags.Conductivity measurements were made on a 1:1 slurry <strong>of</strong>soil in demineralized water using a VWR® conductivity meter.Soil pH readings were taken on the same slurry using a doublejunctionpHTestr® 30 handheld pH meter manufactured byOakton® Instruments. The instrument was calibrated daily usingstandard pH-buffer solutions at pH 4.01, 7.00 and 10.00. TwopH measurements were taken on each sample: the first one20 seconds after immersion <strong>of</strong> the electrode into the slurryand the second, 20 seconds after adding one drop <strong>of</strong> 5% aceticacid and stirring. The acidified pH (pHa) is an indication <strong>of</strong> thebuffer capacity <strong>of</strong> the soils and the closer the pHa values areto the original pH, the greater the buffering capacity. Readingswere recorded into an Excel® spreadsheet and converted to H +concentrations and inverse-difference hydrogen (IDH = 1/(H + a– H + : Smee, 2009) measurements <strong>for</strong> interpretation. IDH is theinverse <strong>of</strong> the difference between acidified and non-acidifiedH + concentrations in the soil and is a measure <strong>of</strong> the soil bufferingcapacity and is thought to be sensitive to remobilized carbonatearound the edges <strong>of</strong> reduced columns (Hamilton, 1998; Smee,2009).QUALITY CONTROLQuality control measures employed <strong>for</strong> this study includedthe collection <strong>of</strong> field duplicate samples <strong>for</strong> each sample type. Atotal <strong>of</strong> 9 field duplicates were collected <strong>for</strong> each sample type9
10Figure 7. Chemistry (aqua regia) <strong>of</strong> vesicle infill in Chilcotin basalt, Woodjam prospect, south-central British Columbia. The x-axis on the probability plots shows the normal score in units <strong>of</strong> standard deviation <strong>for</strong>: A)Au; B) Ag; C) As; D) V; E) Cu; F) Hg; G) In; H) Mn; I) Mo; J) Sb. Analytical values are given in parts per million (ppm).
at randomly selected sample sites. At each duplicate samplesite, material was collected using exactly the same proceduresas those used <strong>for</strong> the original sample and from within 5 m<strong>of</strong> the original sample’s location. Although some local-scalevariability in soil pH and conductivity as well as some elementsin B-horizon soil is apparent, the difference between originaland duplicate sites is usually less than the overall variability inthe apparent background (i.e. on either side <strong>of</strong> the influence<strong>of</strong> concealed mineralization) <strong>of</strong> the sampled pr<strong>of</strong>ile. Theexception is one sample location (DHB021) in the Deerhornnortheast-oriented sample line, where metal concentrations inthe original B-horizon sample are double to triple those <strong>of</strong> theduplicate sample, irrespective <strong>of</strong> the digestion method used.Conductivity and pH values are similar between the original andduplicate sites. Because the elevated concentrations <strong>for</strong> someelements, including As, Cu and LREE, were obtained on twodifferent aliquots sent to two different laboratories (ALS Ltd.,Vancouver, and Activation Laboratories Ltd., Ancaster, Ontario),the discrepancy between the original and duplicate samplesis interpreted to be predominantly the result <strong>of</strong> local-scalevariability in the soil rather than sampling or analytical error.The tabulated relative standard deviation <strong>of</strong> field duplicates issummarized <strong>for</strong> each element and analytical method in Table 2.RESULTSThe principal analytical results are described below.A complete analytical database can be obtained through<strong>Geoscience</strong> <strong>BC</strong>’s website with this report. For the following datapresentation background is defined as the median value <strong>for</strong>each element in a particular dataset. The response ratio (a.k.a.median leveling) is the value <strong>of</strong> a sample divided by the medianvalue, i.e., a response ratio <strong>of</strong> 4 indicates a concentration <strong>of</strong> aparticular element 4 times the background. The statistics <strong>of</strong>geochemical responses above mineralization at Three Firs arediscussed further at the end <strong>of</strong> this report.Basalt AmygdulesSome trace elements, including As, Sb, In and V arepresent in concentrations 5–8 times higher in clay-filledamygdules (vermiculite) near mineralization compared to similaramygdules in basalt over unmineralized Nicola Group (Figure 7).Gold, Ag, Mn and Cu values are also elevated in clay amygdulesover mineralization. Based on two samples from Three Firs, thecalcite amygdules appear to have higher As, Mn and Hg valuesthan the clay amygdules over the mineralization. Carbonatefilledamygdules were not present at the background basaltlocation. Carbonate amygdules sampled from basalt foundnear the eastern end <strong>of</strong> the northeastern transect at Deerhorn(DHB021, Figure 3) contain elevated Cu and Mo and As values(Figure 7). Soil samples at this locality are also anomalous <strong>for</strong> As,Cu, Ni and rare earth elements (see below).Deerhorn survey areaFor Deerhorn, a sample traverse from west <strong>of</strong> the depositacross two zones <strong>of</strong> buried mineralization into basalt coveredareas (Figure 3) has been chosen to illustrate the possiblemasking effects <strong>of</strong> cover material (i.e. till vs. basalt), as well asthe response to buried mineralization. Basalt cover is exposedat surface or buried beneath a thin cover <strong>of</strong> colluvium less than100 m east <strong>of</strong> the surface projection <strong>of</strong> mineralization; however,there is no evidence from drilling that basalt actually overliesmineralization at Deerhorn. Note that the mineralized zones(western and eastern mineralized zones hereafter) are definedby the surface projection <strong>of</strong> the 0.2 g/t Au equivalent gradecontour (Figure 3) but lower grade mineralization and sulfidesare likely also present between and outside the two zones.Soil pH and ConductivitySoil H + and conductivity results <strong>for</strong> Deerhorn are shownin Figures 8 and 9. Although there is considerable scatter inthe data, some general patterns are apparent. Hydrogenionconcentrations are highest (lowest pH) over Deerhornmineralization. The acidified H + (H + a) values are higher near themargins than directly above the mineralized zones, althoughelevated H + a values do also occur some distance away fromknown mineralization (Figures 8, 9). H + and H + a concentrationsare generally lower (higher pH) over basalt than in areas whereonly glacial sediments cover the bedrock (Figures 8, 9A) andpossibly reflect the more buffering character <strong>of</strong> the basalt.Elevated EC values occur at the margins <strong>of</strong> mineralizedzones as well as distally (Figures 8, 9A). In general, the IDHresults mimic the conductivity and H + a results quite well andthe highest values occur at the eastern margin <strong>of</strong> the easternmineralized zone. It is noteworthy that at site DHB021 (Figure3), there are coincident high EC and IDH values over basalt. Thissample site also coincides with apparently elevated Cu, Mo andAs in carbonate vesicle infill (Figure 7).Although the type <strong>of</strong> surface material (i.e., till vs. basalt)does seem to influence the soil pH, other parameters includingthe acidified H + , EC and IDH seem to be primarily controlled bythe oxidizing sulfides in the ore body at depth.B-horizon soil geochemistryFive partial leach techniques have been applied toB-horizon soil samples. The response <strong>of</strong> the different elementsvaries and depends on the sample dissolution technique. Weakleaches such as Enzyme Leach or Bioleach target the weaklybound or labile elements adsorbed onto iron and magnanesehydroxides or clay surfaces. Below, the response <strong>of</strong> a series <strong>of</strong>elements is discussed and illustrated. The responses <strong>of</strong> additionalelements can be explored through the digital data files providedthrough the <strong>Geoscience</strong> <strong>BC</strong> website.11
Table 2. Summary <strong>of</strong> standard deviations <strong>for</strong> field duplicates by element and analytical methods.12
13Figure 8. Soil pH and conductivity data <strong>for</strong> the Deerhorn survey area, Woodjam prospect, south-central British Columbia. Areas under basalt cover and surface projection <strong>of</strong> the mineralization defined by the 0.2 g/tAu equivalent contours (red outlines), are represented by graphs showing A) H + , concentration <strong>of</strong> hydrogen ions (~inverse <strong>of</strong> pH); B) H + a, concentration <strong>of</strong> hydrogen ions after addition <strong>of</strong> 1 drop <strong>of</strong> 10% HCl acid; c)electrical conductivity in μS/m; d) inverse difference hydrogen (IDH), 1/(H + a–H + ).
Figure 9. Soil pH data <strong>for</strong> the Deerhorn W to NE survey line presented as pr<strong>of</strong>iles. A) pH, pHa and electrical conductivity, B) IDH data.Basalt SignatureFigure 10 illustrates the responses <strong>for</strong> La, Th and Nb,elements that are not traditionally used <strong>for</strong> porphyry exploration.The reason <strong>for</strong> this choice is that these elements are present inconsiderably higher concentrations in Chilcotin Group basaltsthan in the underlying Nicola Group volcanic rocks (Figure 2)and there<strong>for</strong>e they may be useful indicators <strong>of</strong> the presence<strong>of</strong> basalt beneath the glacial sediment cover. The relativelyaggressive near total 4 acid digestion shows an overall narrowrange <strong>of</strong> concentrations <strong>for</strong> these elements. Most <strong>of</strong> the highestconcentrations are from samples over basalt. Lanthanum andTh are also highest over basalt in the aqua regia results. Thisis consistent with the chemistry <strong>of</strong> the substrate, although thechemical signal <strong>of</strong> the basalt is very subtle. Lanthanum, Th andNb are not anomalous in the vicinity <strong>of</strong> mineralization in the 4acid digestion results, with the possible exception <strong>of</strong> a spike inTh and La values above the eastern margin <strong>of</strong> the mineralizedzone. Weaker dissolution techniques, notably Bioleach butalso aqua regia and Enzyme Leach, show prominent responses<strong>for</strong> La and Th in one sample from over the eastern edge <strong>of</strong>the mineralization and at one sample location (DHB021) overbasalt in the eastern part <strong>of</strong> the line. Maximum response ratiovalues <strong>of</strong> 7 to 10 are observed. Niobium has considerably lowerconcentrations than Th in all digestions except <strong>for</strong> the 4 acidtechnique, indicating that Nb is likely contained in resistateminerals that are not attacked by weaker digestions, whereassome La and Th is probably weakly bound and more readilydissolved. The Ionic Leach method differs from all other partialleaches in that it exhibits a noisy signal with highly variable Laand Th concentrations but no pronounced anomalies.Mineralization SignatureFigures 11 and 12 illustrate the response <strong>of</strong> Cu, Zn, Ni,As, Ag and Sb. Copper has a strong response between thetwo mineralized zones in the 4 acid, aqua regia and Bioleachresults and a moderate response in Enzyme and Ionic Leaches.Elevated Cu values at the second sample location from the east(DHB021), above basalt, as well as over the eastern margin <strong>of</strong>the mineralization coincide with high La and Th concentrations(Figure 11). Zinc exhibits high values between the twomineralized zones in the 4 acid and aqua regia results; however,they only partially coincide with the sample locations wherehigh Cu concentrations are present (Figures 10, 11). Thesestrong leaches also yield a high value <strong>of</strong> Zn in the second samplefrom the west. In the weaker partial leach techniques, the Znsignal is less distinct. High values occur between two mineralizedcenters, over the western edge <strong>of</strong> basalt cover (which is within100 m <strong>of</strong> the eastern limit <strong>of</strong> known mineralization) and in the14
Figure 10. B-horizon soil geochemical results <strong>for</strong> La, Th and Nb at Deerhorn as function <strong>of</strong> analytical technique. See text <strong>for</strong> discussion.15
Figure 11. B-horizon soil geochemical results <strong>for</strong> Cu, Zn and Ni at Deerhorn as function <strong>of</strong> analytical technique. See text <strong>for</strong> discussion.16
Figure 12. B-horizon soil geochemical results <strong>for</strong> As, Sb and Ag at Deerhorn as function <strong>of</strong> analytical technique. See text <strong>for</strong> discussion.17
easternmost sample <strong>of</strong> the traverse (Figure 11). These high Znvalues typically occur near mineralization within 50 to 100 m <strong>of</strong>the high Cu values but do not coincide with the latter (Figure 11).The Ionic Leach technique has the highest contrast response <strong>for</strong>Zn compared to all the other techniques (Figure 11).Nickel shows a less clear response compared to Cu andZn, but the weak Ionic Leach and Enzyme Leach techniquesseem to produce the best results. Using these techniques, thehighest Ni values are observed between the mineralized areasand above the eastern limit <strong>of</strong> mineralization (Figure 11). Locally,high Ni values coincide with higher Zn values, except over thesecond sample location from the east (DHB021) where highNi coincides with elevated Cu (Figure 11). Bioleach, aqua regiaand 4 acid data do not exhibit a Ni signal over mineralized areasbut all show elevated values over basalt, the highest being thesecond sample location from the east (DHB021) where Cu, Laand Th are also elevated. This is consistent with the whole rockcompositions <strong>of</strong> the Nicola Group and the Chilcotin basalts. Thelatter have 110 to 180 ppm Ni, whereas the <strong>for</strong>mer have only 13to 95 ppm Ni.Arsenic has a similar response to Cu with highest valuesoccurring between the mineralized zones and at site DHB021(Figure 12). This signal is strongest in Bioleach and aqua regiabut also present in Enzyme Leach and the 4 acid results. Overallthe As response has the same pattern in all <strong>of</strong> these dissolutiontechniques except <strong>for</strong> Ionic Leach (Figure 12). Antimony wasbelow the detection level by Ionic Leach. Silver values arehighest between the mineralized areas in aqua regia and inIonic Leach (Figure 12). Bioleach, in contrast shows a differentresponse with high Ag values over the western and eastern edge<strong>of</strong> mineralization and also at site DHB021. The samples withthe most elevated Ag values in aqua regia digestion have valuesbelow detection in Bioleach.Antimony does not exhibit as clear a pattern as Cu, As, Zn,Ag or Ni. In the 4 acid results, it exhibits a broad bell shapedpattern with the highest values occurring above the easternmineralized zone and between the two zones, but clearly lowervalues towards the ends <strong>of</strong> the sample traverse (Figure 12). Aquaregia results show a noisy pattern <strong>for</strong> Sb with only slightly highervalues occurring between the mineralized zones and in thesecond sample from the east (Figure 12). Bioleach and EnzymeLeach show no clear response <strong>for</strong> this element and analyticalvalues are close to detection limit.A number <strong>of</strong> additional elements are significantly abovebackground over mineralization in Bioleach and other partialleach results (Figure 13). Selenium, Mo, and In in the Bioleachdata have about triple the background concentration overmineralization. Selenium and Tl, the latter only weakly elevatedover mineralization, are also high (7 and 3 times background,respectively) at sample site DHB021 (Figure 13). The highestvalues <strong>of</strong> W occur over mineralization but W concentrations areonly up to about twice the background (Figure 13).B-horizon: effect <strong>of</strong> Fe content on elementconcentrationsPartial leach techniques in soil geochemistry are aimedat dissolving weakly bound ions. Such ions may be adsorbed toFe oxides, Mn oxides, clays or organic matter. By normalizingto the Fe content in soil samples, areas with anomalously highcontents <strong>of</strong> certain metals can be distinguished from thosewhere high metal concentrations are due to increased Fecontent. A signal <strong>of</strong> mineralization recorded in the soil thus,can potentially be distinguished from those where Fe rich soilsare responsible <strong>for</strong> elevated metal contents, such as in areaswhere Fe is hydromorphically concentrated. Figure 14 illustratescomparative plots <strong>of</strong> Zn, Cu and Ni <strong>for</strong> aqua regia and Ionic Leachresults normalized by Fe <strong>for</strong> the Deerhorn sample transect. Theanalytical values <strong>for</strong> Fe in percent are taken from the 4 acidresults which is <strong>for</strong> all intents and purposes a near total Feconcentration.In the aqua regia results both Cu/Fe and Zn/Fe exhibita similar, albeit slightly enhanced, signal between the twomineralized zones and over the eastern mineralized zonewhen compared to the analytical concentrations (Figure 14).Nickel, on the other hand has a slightly attenuated signal overthe eastern part <strong>of</strong> the sample traverse, suggesting that itsconcentration is controlled by Fe. The Ionic Leach results alsoshow subtle, but potentially important differences betweenabsolute concentrations and metal/Fe ratios. Copper hasan overall attenuated signal when ratioed to Fe and at thesecond sample site from the east (DHB021) is only marginallyabove background, whereas the westernmost samples havesignificantly lower Cu/Fe values than those samples collectedabove mineralization. When absolute concentrations are lookedat this difference is not as apparent. Nickel, like Cu, has a slightlyattenuated pattern when ratioed to Fe, but elevated values aremaintained above the eastern mineralized zone as well as nearthe eastern end <strong>of</strong> the traverse. Nickel also is generally higherover Chilcotin basalt than over Nicola Group bedrock. Zinc doesnot seem to be strongly influenced by the Fe content <strong>of</strong> thesoils and the Zn/Fe ratios have a similar albeit slightly enhancedpattern compared to Zn concentrations by themselves.Soil Gas Hydrocarbons (SGH) and Organo SulfurGeochemistry (OSG)Neither SGH nor OSG present anomalies <strong>for</strong> particularelements but identify groups <strong>of</strong> hydrocarbons or organo-sulfurcompounds that are believed to be linked to sulfur oxidizingbacterial activity in sulfide mineralization. Figure 15 and briefdescriptions <strong>of</strong> the results are based on standard interpretationsprovided by Actlabs (Sutherland 2012a, b), which are alsoappended to this report. Results <strong>for</strong> low molecular weight SGHand OGS compound groups are presented in Figure 15A and15B, respectively. Note that the sample transects discussed inthis report contain fewer than the minimum number <strong>of</strong> samples18
Figure 13. Bioleach results <strong>for</strong> W, Se, Mo and Tl at Deerhorn. Selenium is clearly elevated over mineralization as well as over sample site DHB021, whereas W, whilealso elevated over mineralization, provides less contrast.recommended by Actlabs <strong>for</strong> these geochemical techniques andthe results presented here are only <strong>for</strong> comparison with theB-horizon soil geochemical results.Soil gas hydrocarbon results delineate an area <strong>of</strong> highervalues between the mineralized zones at Deerhorn. This zonecontains elevated low molecular weight SGH, commonly usedas pathfinder <strong>for</strong> Cu and coincides well with high Cu, Zn, Ag andAs in partial leach geochemical methods (Figure 15). Neitherhigh SGH nor pathfinder element values occur directly abovethe surface projection <strong>of</strong> the mineralization, but above its edgesin what may be interpreted as a rabbit-ear anomaly. The OSGresponse is similar to that <strong>of</strong> SGH and is consistent with aninterpretation as a rabbit-ear anomaly (Figure 15). Note thatboth SGH and OSG results show a relatively elevated value nearthe western limit <strong>of</strong> the basalt cover. This location coincides withelevated Zn values mentioned above (Figures 11, 14). The OGSresponse also exhibits an elevated value at the second samplesite (DHB021) from the east above basalt (Figure 15). Thislocation also has elevated values <strong>of</strong> Cu, Ni, As, Sb, La, Se, Tl andTh in some <strong>of</strong> the partial leach techniques (Figures 10-14).Vegetation resultsThe dataset indicates no unusually high concentrations <strong>of</strong>any elements. Many elements returned concentrations belowor close to the detection limits (DL) in the analysis <strong>of</strong> the dryspruce bark. In order to concentrate elements, spruce twigswere reduced to ash prior to analysis, resulting in many moreelements reported with concentrations above DL. Each plantspecies and type <strong>of</strong> tissue (i.e. bark, twigs, needles etc.) has adifferent capability to absorb and store elements.Spruce barkThe nitric acid then aqua regia digestion <strong>of</strong> the dryvegetation tissues, spruce bark in this case, is a near totaldigestion <strong>for</strong> all elements. The precision <strong>of</strong> the analyticalmethod is good to excellent <strong>for</strong> most elements except <strong>for</strong> Auand some <strong>of</strong> the high field strength elements (e.g. Hf, Nb, Ti, Zr)which generally have inferior precision.Copper is an element that is required <strong>for</strong> a plant’smetabolism and there<strong>for</strong>e concentrations <strong>of</strong> a few ppm Cuare typical and only excesses to those levels are likely to be19
Figure 14. B-horizon soil geochemical results <strong>of</strong> Cu/Fe, Ni/Fe and Zn/Fe compared to absolute concentrations <strong>of</strong> Cu, Ni and Zn at Deerhorn. A) Ionic Leach digestion,B) Aqua regia digestion.20
Figure 15. Summary <strong>of</strong> soil gas hydrocarbon (SGH) and organo sulfur compound (OGS) data <strong>for</strong> Deerhorn. A) Low molecular weight SGH used as copper pathfinder;B) Sulfur allotrope in OGS used as copper pathfinder. White stippled line indicates surface projection <strong>of</strong> the 0.2 g/t Au grade contour. Blue stippled line indicatestarget anomaly interpreted from the SGH and OGS data alone (Sutherland, 2012a, b) Extent <strong>of</strong> basalt cover is indicated.21
attributable to any concealed mineralization. In situations wherea geochemical signature is subtle, it is commonly difficult todistinguish a ‘mineralization’ from a ‘micro-nutrient’ signature.This is the case at Deerhorn where the highest Cu concentrationis located over mineralization, but at only one sample stationwhich by itself is not definitive (Figure 16).Gold concentrations are all below the detection limit (0.2ppb Au) except at one site over the western end <strong>of</strong> the concealedmineralization where 0.2 ppb Au was recorded. This is probablyjust a random result caused by degraded precision at lowestconcentrations, and is not considered to be a response to themineralization. Similarly a single Bi result from the same area witha concentration at the detection limit is considered <strong>for</strong>tuitous.In the general vicinity <strong>of</strong> the buried mineralization, Cs, Rb and Kconcentrations are above the detection limit and clearly elevatedin a number <strong>of</strong> samples (Figure 17). This suite <strong>of</strong> geochemicallyrelated alkali metals may be reflecting the presence <strong>of</strong> potassicalteration associated with the mineralization. Lead, S and Sealso have slightly elevated levels over the zone <strong>of</strong> mineralization(Figure 18), although concentrations are very low and in thecase <strong>of</strong> Se only reach twice the detection limit.A few elements (e.g. Ba, Mo, Ni, Sr, Zn) show a generaltrend <strong>of</strong> increasing enrichment toward the east. In the case <strong>of</strong>Ni this may be attributable to the basaltic substrate, which isexposed at the surface in this area, whereas none <strong>of</strong> the otherelements have inherently higher concentrations in the Chilcotinbasalt than in the Nicola Group. Some examples are shown inFigure 19. Note that the highest Ni concentration <strong>of</strong> all sprucebark samples at Deerhorn was detected in a single sample abovethe western mineralized zone where no basalt is known in thesubstrate, suggesting that Ni may be a useful pathfinder elementin spruce bark.Spruce twig ash, DeerhornBy reducing the spruce twigs to ash prior to analysis,elements are concentrated about 30-fold, since the ash yield isapproximately 3%. Consequently, the numbers reported fromthe analysis are substantially higher than <strong>for</strong> the dry spruce barkand concentrations <strong>of</strong> more elements are well above detectionlevels. However, there is the drawback that some elementsvolatilize during the ashing process – notably all the Hg, and some<strong>of</strong> the Cr and possibly As, S, Sb and Se. Fortunately, providedashing conditions are similar, the proportion <strong>of</strong> any element thatis lost is fairly consistent and so element distribution patternscan be meaningful. There is little variation among samples in theash yield (about 2.6 to 3.4%) making negligible difference to theoverall patterns, so the data have not been levelled to a dryweightbasis prior to plotting.Copper and As concentrations are erratic and are slightlyelevated over the western edge <strong>of</strong> the Chilcotin Basalt. Neither<strong>of</strong> these elements has a good response directly above oradjacent to mineralization. Although the highest Au value wasrecorded by a sample collected above the western part <strong>of</strong>mineralization it is only about twice the background and 20%Figure 16. Analytical results <strong>for</strong> Cu in spruce bark at Deerhorn. Vegetation samples have usually been taken within less than 10-15 m <strong>of</strong> the corresponding soilsamples.22
Figure 17. Analytical results <strong>for</strong> Cs, Rb and K in spruce bark at Deerhorn.Figure 18. Analytical results <strong>for</strong> Pb, S and Se in spruce bark at Deerhorn.- 30% higher than other samples along the line away from theburied mineralization (Figure 20).As documented <strong>for</strong> the spruce bark, ashed spruce twigsexhibit elevated Cs, Rb (Figure 20) and to a lesser extent K overmineralization. Thallium is elevated up to an order <strong>of</strong> magnitudeabove detection limit over the eastern part <strong>of</strong> mineralization(Figure 20). Platinum exhibits a single high value between themineralized zones (Figure 20).Three Firs survey areaAt the Three Firs prospect B-horizon soil and vegetationsamples were collected on an ENE to E oriented traverse. Incontrast to the Deerhorn line, Chilcotin Group basalts are notexposed at surface but they are present in the cover over thewesternmost five soil sample sites. One angled diamond holedrilled by Goldfields (MAG-12-04; Figure 3) intersected about 30m <strong>of</strong> basalt below about 60 m <strong>of</strong> glaci<strong>of</strong>luvial overburden be<strong>for</strong>eencountering sulfide-bearing bedrock <strong>of</strong> the Nicola Group. Thisdrill hole was repeated because the first hole (MAG-12-04) waslost at the lower basalt contact. MAG-12-04/04A and the parallelMAG-12-05 were all collared near the fifth sample site from thewest and were all drilled roughly parallel to the section line tothe east at an angle <strong>of</strong> approximately 60° (Figure 3). On thebasis <strong>of</strong> limited drilling, mineralization occurs to the east <strong>of</strong> thislocation and is covered by glaci<strong>of</strong>luvial sediments but potentiallyalso by basalt.Soil pH and Electrical ConductivitySoil H + and EC results <strong>for</strong> Three Firs are shown in Figures 21and 22. Although there is considerable scatter in the data, somegeneral patterns are apparent. Hydrogen-ion concentrationsare highest (lowest pH) over the western margin <strong>of</strong> projectedmineralization. The acidified H + (H + a) values are higher nearthe margins than directly above the mineralized zones atboth localities, although high H + a values also occur distal tomineralization (Figures 21, 22). Electrical conductivity is mostelevated over the mineralized zone but relatively low directlyadjacent to it (Figure 22). In general, the IDH results mimic theconductivity and H + a results quite well and the highest IDHvalues occur directly above mineralization and to the west <strong>of</strong>23
Figure 19. Analytical results <strong>for</strong> Mo, Ba and Ni in spruce bark at Deerhorn.it. At the western end <strong>of</strong> the line the presence <strong>of</strong> carbonatereacting with HCl acid was recorded in the field in the B-horizonsoil sample. This is consistent with the low H + , H + a and high IDHrecorded <strong>for</strong> the same location.B-horizon soil geochemistryBasalt SignatureAs observed at Deerhorn, La, Th and Nb do not show a clearsignal above mineralization when strong digestion techniques(aqua regia and 4 acid) are used (Figure 23). Given the extensiveglacial cover over the basalt, these elements are not presentat higher concentrations above basalt either. The Bioleach andEnzyme Leach techniques do exhibit Th and La concentrationsup to 4 to almost 9 times background above mineralization andover basalt at the western margin <strong>of</strong> the mineralization. EnzymeLeach also exhibits one elevated La value at the eastern limit<strong>of</strong> the mineralization whereas Th shows a single elevated value~ 250 m E <strong>of</strong> the eastern margin <strong>of</strong> the zone (Figure 23). IonicLeach, as observed at Deerhorn, does not yield an interpretablesignal <strong>for</strong> these elements.Figure 20. Analytical results <strong>for</strong> Au, Cs, Rb, Pt and Tl in ashed spruce twigs atDeerhorn.Mineralization SignatureThe 4 acid and aqua regia techniques did not produce adistinctive signal <strong>for</strong> Cu, Zn, As, Ni, Ag or Sb above mineralization(Figures 24, 25).Bioleach: Copper, Ni, As and Ag exhibit the best responseusing the Bioleach technique. The highest Cu, Ni, and Ag values<strong>for</strong> this method were recorded in samples taken directly overmineralization and in the case <strong>of</strong> Cu also at its western marginabove the basalt (Figures 24, 25). Arsenic shows elevated valuesjust west and east <strong>of</strong> the mineralized zone in what may beinterpreted as a rabbit-ear anomaly (Figure 25). Zinc shows high24
25Figure 21. Soil pH and conductivity data <strong>for</strong> the Three Firs survey area, Woodjam prospect, south-central British Columbia. Areas under basalt cover and surface projection <strong>of</strong> the mineralization, defined by the 0.2 g/t Auequivalent contours, are represented by graphs showing A) H + , concentration <strong>of</strong> hydrogen ions (~inverse <strong>of</strong> pH); B) H + a, concentration <strong>of</strong> hydrogen ions after addition <strong>of</strong> 1 drop <strong>of</strong> 10% HCl acid; C) electrical conductivityin μS/m; D) IDH, 1/(H + a–H + ). Note that the dataset includes sites between regular soil samples <strong>for</strong> which only pH data were collected.
Figure 22. Soil pH data <strong>for</strong> the Deerhorn W to NE survey line presented as pr<strong>of</strong>iles. A) pH, pHa and electrical conductivity, B) Inverse-difference hydrogen (IDH) data.Note, <strong>for</strong> consistency, only pH data <strong>for</strong> sites where B-horizon soil samples were also collected are shown.26
Figure 23. B-horizon soil geochemical results <strong>for</strong> La, Th and Nb at Three Firs as function <strong>of</strong> analytical technique. See text <strong>for</strong> discussion27
Figure 24. B-horizon soil geochemical results <strong>for</strong> Cu, Zn and Ni at Three Firs as function <strong>of</strong> analytical technique. See text <strong>for</strong> discussion.28
Figure 25. B-horizon soil geochemical results <strong>for</strong> As, Sb and Ag at Three Firs as function <strong>of</strong> analytical technique. See text <strong>for</strong> discussion.29
values at the western margin <strong>of</strong> the mineralized zone but alsosome unexplained elevated values in the eastern parts <strong>of</strong> thetransect (Figure 24).Enzyme Leach: Copper shows a similar pattern to Zn buthas a slightly enhanced response compared to Bioleach. Nickel,in contrast has a less pronounced response compared to theBioleach technique, but with the highest values still locatedabove mineralization and at its western margin (Figure 24). Aweak signal may also be interpreted <strong>for</strong> As, which has its highestvalues above and at the western margin <strong>of</strong> the mineralized zone(Figure 25). Zinc has a highly variable signal in the Enzyme Leachresults with elevated values over the western margin <strong>of</strong> the zonebut also <strong>for</strong> individual samples to the east.Ionic Leach: As <strong>for</strong> Enzyme Leach, the highest Znvalues occur 100-200 m E <strong>of</strong> the mineralized zone. It isunknown whether this variation in Zn values reflects bedrockcharacteristics. Copper in Ionic Leach exhibits its highest valuesabove basalt cover west <strong>of</strong> the mineralization, as well as overthe eastern margin <strong>of</strong> the mineralized zone, whereas Ni hasrelatively uni<strong>for</strong>m concentrations along the transect. Notethat <strong>for</strong> the sample collected above the western margin <strong>of</strong>the mineralization insufficient material was available <strong>for</strong> IonicLeach. Silver and As in Ionic and Enzyme Leach do not producerecognizable responses over mineralization (Figure 25).In addition to the elements described above, the halogensBr and I by both Bioleach and Enzyme Leach have clearlyelevated values <strong>of</strong> ~ 4 to 10 times background directly over themineralization (Figure 26). Bioleach results <strong>for</strong> W, Se and Tl alsoshow clearly elevated values over mineralization and a morecompelling result than at Deerhorn. Selenium has values <strong>of</strong> upto 10 times background but W and Tl also have good contrastwith 3 to 5 times background values over mineralization (Figure27). Molybdenum, in contrast to Deerhorn, does not show acompelling anomaly over mineralization (Figure 27).Figure 26. B-horizon soil Bioleach and Enzyme Leach results <strong>for</strong> Br and I at Three Firs. Sample sites over mineralization have 3 to 9 times the background concentrationsin these elements.30
Figure 27. B-horizon soil Bioleach results <strong>for</strong> W, Se, Mo and Tl at Three Firs. Sample sites over mineralization have to ~4 and 10 times the background concentrations<strong>of</strong> W and Se, respectively. Thallium has a response ratio <strong>of</strong> 3.3 and Mo is not considered anomalous over mineralization.B-horizon: effect <strong>of</strong> Fe content on elementconcentrationsAt Three Firs the difference between Cu concentrationsand Cu/Fe ratios is more evident than at Deerhorn (Figure 28).Copper concentrations in the aqua regia results are highest atthe second sample site from the west, whereas the Cu/Fe ratiois highest above mineralization. In the Ionic Leach results, Cu/Feis enhanced in several samples over basalt and mineralizationcompared to absolute Cu concentrations. In contrast to the Curesults, Zn/Fe and Ni/Fe show very similar patterns compared toZn and Ni concentrations in both the aqua regia and Ionic Leachresults (Figure 28).Soil Gas hydrocarbons (SGH) and Organo sulfurgeochemistry (OSG)The OGS and SGH responses are less clear than at Deerhornwith alternating high and low values observed (Figure 29).Elevated low-molecular weight SGH and OSG compounds occurdirectly above mineralization and are bordered by samples withlower values. Copper, Ni and Ag show a good response in thesame location. The second sample site from the west exhibits anelevated OSG compound value that coincides with elevated Cuin some <strong>of</strong> the partial leach results, whereas the high OSG valuesto the NE along the line roughly coincide with high Zn values.Based on the SGH and OSG response alone, Sutherland (2012a,31
Figure 28. B-horizon soil geochemical results <strong>of</strong> Cu/Fe, Ni/Fe and Zn/Fe compared to absolute concentrations <strong>of</strong> Cu, Ni and Zn at Three Firs. A)Ionic Leach digestion,B) Aqua Regia digestion.32
Figure 29. Summary <strong>of</strong> soil gas hydrocarbon (SGH) and organo sulfur compound (OGS) data <strong>for</strong> Three Firs. White stippled line indicates surface projection <strong>of</strong> the 0.2g/t Au grade contour. Blue stippled line indicates target anomaly interpreted from the SGH data alone (Sutherland, 2012 b) Extent <strong>of</strong> basalt cover is indicated. Notethat number <strong>of</strong> samples is too low to meet standard requirements <strong>for</strong> SGH and OGS surveys.b) interprets the most prospective target to be about 400 mnortheast <strong>of</strong> the known mineralization. This discrepancy canpotentially be attributed to the insufficient sample density <strong>for</strong>these methods at Three Firs but could also indicate the presence<strong>of</strong> unknown mineralization east <strong>of</strong> the drilled area.Vegetation resultsAs with the vegetation geochemistry at Deerhorn, thedataset indicates no unusually high concentrations <strong>for</strong> anyelements in the Three Firs survey area, but some relativeenrichments are notable. Many elements in dry spruce barkreturned concentrations below or close to the detection limits.Spruce barkThere are a few elements <strong>of</strong> note that exhibit enrichmentsin spruce bark over, or adjacent to, the zone <strong>of</strong> knownmineralization which may extend beneath the basalt coverto the west. Highest Cs and Rb concentrations occur right atthis contact and over the basalt (Figure 30). No other elementexhibits a distinct pattern <strong>of</strong> enrichment in the bark from stationsalong this line. These high values over basalt are interpreted toreflect buried mineralization, rather than the basalt chemistrybecause the Chilcotin and Nicola Group basalts have similar Rband Cs concentrations in the whole rock (Figure 2). Results arediscussed in more detail in Heberlein et al. (2013 and in press).33
to a lesser extent Rb, have high values; in the case <strong>of</strong> Cs up todouble the background over mineralization and adjacent areasto the west (Figure 31). More details are given in Heberlein etal. (2013 and in press).DISCUSSIONDeep penetrating geochemical techniques have beenapplied successfully in British Columbia over a number <strong>of</strong>porphyry Cu-Au deposits covered by glaci<strong>of</strong>luvial sediments(e.g., Heberlein, 2010; Heberlein and Samson, 2010; Heberleinand Dunn, 2011). These studies, however, did not testexploration geochemical methods in areas covered by youngervolcanic units. In much <strong>of</strong> south central British Columbia bedrockprospective <strong>for</strong> porphyry and/or epithermal mineralization iscovered by Miocene basalts which have deterred explorers fromworking in those areas. However, the results presented in thisreport suggest that, potentially, deep penetrating geochemicaltechniques can be successful in assisting in the search <strong>for</strong>concealed mineralization in basalt covered areas.Figure 30. Analytical results <strong>for</strong> Cs and Rb in spruce bark at Three Firs.Spruce twig ashAsh yields from the spruce twigs collected at ThreeFirs were similar to those at Deerhorn. Comparisons <strong>of</strong>concentrations in ash and concentrations in ash levelled to a dryweight basis showed there to be no significant differences in thepr<strong>of</strong>iles <strong>of</strong> elements, and consequently the ash data have beenused.The highest Au value is located directly over the zone <strong>of</strong>mineralization. In this area there are also elevated levels <strong>of</strong> Mo,Pb, Cr, REE, Se, Fe, Sr, Sb Cs and Rb. Figure 31 illustrates pr<strong>of</strong>iles<strong>for</strong> Rb, Cs, Au, Pb and Mo as examples. Lead shows a broad areaabove and to either side <strong>of</strong> mineralization with elevated values50 to 100% above background. Gold has a clearer contrast thanPb with the highest value over mineralization having more thandouble the concentration <strong>of</strong> the background. Over the edges <strong>of</strong>mineralization some samples may also be considered anomalousin Au with values up to 50% above background (Figure 31).Molybdenum also shows a reasonable response with the highestvalues reaching up to twice the background over the westernand eastern limits <strong>of</strong> mineralization in what may be interpretedas rabbit-ear anomaly. Adjacent to the mineralized aeras Cs, andPotential effect <strong>of</strong> substrate variationsChilcotin Group basalts, although widespread, are rarelywell exposed at surface due to cover <strong>of</strong> vegetation and glaci<strong>of</strong>luvialsediment. They are, however, chemically distinguishable fromthe underlying Triassic Nicola Group basaltic volcanic rocks thatcommonly host Cu-Au porphyry mineralization. Elements suchas the light REE, Th, (Figure 2) and Ni are more concentrated inChilcotin Group basalts than in underlying Triassic Nicola Grouprocks. These elements are commonly slightly more concentratedin soil and vegetation samples taken directly above basaltsubstrate than those taken above till where no Chilcotin Groupbasalt cover is present. Likewise, background soil pH is higherabove Chilcotin Group basalts than above till which reflectstheir more alkaline (buffering) and mafic composition. Where tillcovers Miocene basalt, and depending on the thickness <strong>of</strong> thetill, the geochemical signal <strong>of</strong> basalt is probably too subtle to bedetected in the soils and plants above. However, in the absence<strong>of</strong> good exposure, regional plant geochemistry (e.g. tree topgeochemistry) has the potential to help delineate the extent <strong>of</strong>basalt cover as long as till cover is <strong>of</strong> limited thickness. Nickelwould be an element <strong>of</strong> potential use in this context.Soil geochemistry can also indicate the extent <strong>of</strong> youngbasalt in areas where till cover on basalt is thin or absent butonly 4 acid digestion appears to be capable <strong>of</strong> geochemicallydetecting the difference between Nicola and Chilcotin Groupsignatures. Partial leach techniques such as aqua regia, Bioleach,Ionic Leach and Enzyme Leach, can detect weakly boundelements <strong>of</strong> exploration interest better and the geochemicalvariations observed in these datasets are interpreted to be theoutcome <strong>of</strong> secondary dispersion processes rather than due tothe substrate characteristics. Hence, by inference, partial leachtechniques are sensitive to buried mineralization irrespective <strong>of</strong>the type <strong>of</strong> cover.34
Figure 31. Analytical results <strong>for</strong> Au, Cs, Rb, Pb and Mo in ashed spruce twigs at Three Firs.35
<strong>Techniques</strong> and elements that can detectmineralizationThe geochemical results at Deerhorn and Three Firs showsome differences, but in general are comparable and consistent.At Three Firs IDH and EC define rabbit ear patterns with lowvalues above the western margin <strong>of</strong> the mineralization andhigh values to either side <strong>of</strong> it. At Deerhorn, high IDH and ECare observed above the eastern mineralized zone as well asat the second sample site from the east (site DHB021). Thesepatterns are reflected to variable degrees also in the B-horizonsoil geochemistry. Among the different partial leach techniques,Bioleach in general yielded the most promising results with thehighest contrast between samples near or above mineralizationand background exhibited by, e.g., As, Ag, Br, Cu, I, Mo, REE,Se and Zn. These elements are commonly enriched three foldor more compared to background. However, the other partialleaches also show positive signals <strong>of</strong> specific elements related toconcealed mineralization. For instance, Ionic Leach and EnzymeLeach detect the Zn signal quite well (to 5 times background overmineralization) but, e.g., Cu, Tl, Se and As have also compellingpatterns in the Enzyme Leach data with at least 2 to 3 timesbackground values over mineralization. At Deerhorn, high ECand IDH results coincide with elevated values <strong>for</strong> La and otherREE, Ag, As, Cu, Ni, Se, and Tl but with the exception <strong>of</strong> the REEand Tl, these elements are also elevated to the west betweenthe two mineralized zones.At Three Firs the western edge <strong>of</strong> the mineralizationgenerally coincides with a relative low in Ag, As, Cu, Ni, andREE as well as low IDH and EC. This low is flanked on either sideby higher values in all <strong>of</strong> these elements and measurements,although on the western side <strong>of</strong> the mineralization elevatedconcentrations <strong>of</strong> elements are not always coincident. Overall,however, the pattern can be interpreted as a rabbit ear anomaly.Elements that have clearly elevated values directly abovemineralization at Three Firs include the halogens I and Br as wellas Se, Tl and W.Unlike Cu or As, sample sites with high Zn values tend tobe located away from the mineralization. High Zn values areobserved above the mapped western extent <strong>of</strong> basalt as wellas at the easternmost sample site at Deerhorn, about 100 maway from samples with elevated Cu or As. Between the twomineralized zones at Deerhorn, high Zn and Cu values roughlycoincide. At Three Firs the highest Zn values occur to the east <strong>of</strong>the mineralization whereas above and west <strong>of</strong> it, the Zn signalis subdued and does not coincide well with elevated Cu or Asvalues.The SGH and OGS signatures yielded mixed results. TheSGH method produced a pronounced apical anomaly <strong>of</strong> lowmolecular weight hydrocarbons between the mineralized zonesat Deerhorn which coincides well with elevated Cu, As and Agvalues. The OSG sulphur compounds also show a possible rabbitear anomaly around the eastern mineralized zone. At Three Firsboth the OSG and SGH methods failed to produce a clear resultperhaps because <strong>of</strong> insufficient sample populations; the zone<strong>of</strong> known mineralization does not underlie the most promisinganomaly. A larger survey would be necessary to assess thesetechniques.The vegetation geochemistry yielded subdued anomaliesexcept <strong>for</strong> Cs, Rb and to a lesser extent K which are all presentat elevated concentrations above the mineralized zones at bothDeerhorn and Three Firs. These elements probably reflect theextent <strong>of</strong> potassic alteration which is intimately associatedwith mineralization. Many <strong>of</strong> the elements <strong>of</strong> interest are onlypresent at concentrations close to detection limit in the dryspruce bark, but mostly well above detection in the ashed twigs.Some elements, e.g. Se, Mo and Au, have elevated values morethan 50% above background near mineralization.Limited data also suggest that clay and carbonateamygdules in basalt are potentially capable <strong>of</strong> detecting concealedmineralization. Although further work on a larger sample set willbe needed, Mn and As in carbonate may be good indicators <strong>of</strong>proximity to mineralization. Other elements including Cu, Ag,Au, V, In and Sb are potentially adsorbed to clays. The drillcorefrom which background clay amygdules were sampled did notcontain carbonate amygdules. This observation by itself is worthinvestigating further. Carbonate may preferentially precipitateabove the periphery <strong>of</strong> oxidizing sulfide bodies, according tothe model advanced by Hamilton (1998, 2000; see below).Thus, the presence <strong>of</strong> carbonate amygdules in basalt may guideexploration to concealed mineralization.Summary <strong>of</strong> B-horizon soil responses usingdifferent techniquesTo summarize the abundance <strong>of</strong> data obtained fromthe many datasets, some fundamental parameters <strong>of</strong> usein describing the significance <strong>of</strong> the element signatures areprovided in Table 3. This table is a summary <strong>of</strong> data by allthe tested analytical methods from the Three Firs area. Wehave refrained from providing a similar summary table <strong>for</strong> theDeerhorn Survey area due to the greater complexity imposed bymultiple concealed ore zones which makes it difficult to identifythe type <strong>of</strong> geochemical response. The reader is referred to thedigital files provided to explore these data further.Once a dataset was deemed to be <strong>of</strong> adequate qualityfrom QA/QC evaluations, the approach was to first calculatethe response ratio values <strong>of</strong> each element determined by eachmethod.These calculations result in that every analytical number ischanged to a relative concentration number (i.e. response ratio- RR).An example <strong>for</strong> the calculation <strong>of</strong> Response Ratios <strong>for</strong>Br in Bioleach data from Three Firs is shown and explained inthe spreadsheet screen capture (Figure 32, column J). Thisprocedure was followed <strong>for</strong> all elements by all methods and the36
Table 3. Summary <strong>of</strong> responses <strong>of</strong> different elements in B-horizon soil geochemical data from Three Firs. Note that use <strong>of</strong> electronic data files provided on the<strong>Geoscience</strong> <strong>BC</strong> website is recommended to explore these data further.37
Figure 32. Example <strong>of</strong> the calculation <strong>of</strong> relative concentrations or response ratios using built in statistical functions in Micros<strong>of</strong>t Excel s<strong>of</strong>tware. Five samples werecollected above mineralization (highlighted yellow and by red box in chart). 1. The median element concentrations <strong>of</strong> these 5 sites (“Med Anom” values shown inblue font, L25) are compared to the median <strong>of</strong> all sites along the transect (“Med Bck” - numbers in red font, L24). The latter value was taken as the backgroundconcentration. 2. The maximum value <strong>of</strong> the 5 selected samples is shown in green font (L.26). 3. The value in L25 was then divided by that in L24 (i.e. anomalydivided by background) and the result shown as RR median (L29). 4. Finally, the RR maximum was calculated by dividing the Max anomaly (L26) by the median(L24). This now quantifies the magnitude <strong>of</strong> the anomaly that is depicted in the chart at the bottom <strong>of</strong> the figure. In the case <strong>of</strong> Br, the RR maximum is 9.87, or themaximum value is 10 times the background.38
esults summarized in Table 3. Maximum response ratios thatexceed x 2 the background are highlighted in Table 3 accordingto the following colour scheme:1. Green: Apical signatures – several sites with anomalousconcentrations directly over the zone <strong>of</strong> mineralization2. Pink: Single point anomalies – these should beconsidered with some caution since they are not alwaysreproducible.3. Blue: “Rabbit Ears” signatures – adjacent to the margins<strong>of</strong> the concealed mineralization.4. Yellow: Signatures that may be influenced by underlyinglithologies.5. Red: Slightly higher response over mineralization, butvalues quite similar along the transect6. Grey almost all values below DL.The areas identified in the color key alongside the Table areshown in the example <strong>of</strong> Cs by Bioleach (Figure 33). In this chartCs values are elevated over the basalt (potential ‘Lithologicalresponse’) and exhibit enrichments toward the east (‘Eastanomaly’) and at the far eastern end <strong>of</strong> the line. In some casesa RR >2 is not highlighted because it is not exclusive to the area<strong>of</strong> known mineralization. Note that the lithological responsecannot in every case be confidently separated from a responserelated to mineralization. This is exemplified by light REE (e.g.La) which are elevated in Bioleach and Enzyme leach resultsabove mineralization and adjacent areas, including above basalt(Figure 23). Chilcotin Group basalts contain overall higher LREEthan Triassic Nicola Group basalts (Figure 2) but at Three Firs the<strong>for</strong>mer are covered also by ~ 60 m <strong>of</strong> glaci<strong>of</strong>luvial sediments.Whereas Table 3 provides a comprehensive summary <strong>of</strong>the various anomalous signatures, it is still a kaleidoscope <strong>of</strong>colours that require further distillation in order to extract theessence <strong>of</strong> the abundance <strong>of</strong> in<strong>for</strong>mation. Table 4 is an attemptto do this, by simply adding up the number <strong>of</strong> elements thathave a relationship to the known zone <strong>of</strong> mineralization. Fromthis it is apparent that the greatest number <strong>of</strong> elements thatexhibit anomalies over the known zone <strong>of</strong> mineralization arefrom Bioleach, closely followed by ashed spruce twigs andthen Enzyme Leach. One point to note is that the low number<strong>of</strong> anomalies shown by the spruce bark is probably becausemany elements concentrations were below detection; by ashingthe bark it is probable that more elements would have beenanomalous. Clearly the conventional aqua regia digestion <strong>of</strong> thesoils and the total (4-acid) digestion were inferior methods <strong>for</strong>defining the location <strong>of</strong> the mineralization. By these methodsCa, Cd and S were the most useful elements, supplemented byU and W in the aqua regia digestion.Observed geochemical patterns in the context <strong>of</strong>the reduced column modelThe geochemical patterns observed in both survey areasare consistent with the reduced column (a.k.a. reduced chimney)model originally proposed by Hamilton (1998, 2000). In thismodel (Figure 34) reduced cations are transported upwardfrom a sulfide-rich ore body along electrical potential gradients.Reduced cations, including Fe 2+ , oxidize near the surface and atthe edge <strong>of</strong> the columns and generate acid which results in a lowpH zone directly above mineralization. Carbonate in the soil isdissolved within this acid zone and reprecipitates over the edges<strong>of</strong> the column where pH conditions allow, thereby increasingthe buffering capacity <strong>of</strong> the soil. The IDH <strong>of</strong> soil samples is aproxy <strong>for</strong> high buffering capacity and the presence <strong>of</strong> carbonatesin the soil. While Hamilton’s model provides a good idea <strong>of</strong>the processes involved, it has to be borne in mind that it isan idealized model. In the present study, the mineralizationis <strong>of</strong> porphyry style which commonly has no sharply definededges. Outside the actual mineralization, pyrite and low levels<strong>of</strong> chalcopyrite or sphalerite may still be present and pyriteoxidation will influence the cation flux. Likewise, heterogeneousoverburden, groundwater and topography will have an influenceon the surface geochemistry above concealed mineralization. Asummary interpretation <strong>of</strong> the observed geochemical pattern <strong>of</strong>Zn and Cu as well as pH and IDH loosely contextualized withinHamilton’s reduced column model is presented in Figure 35 <strong>for</strong>Deerhorn and Figure 36 <strong>for</strong> Three Firs. Note that there are alarge number <strong>of</strong> additional elements not depicted in Figures 35and 36 that show a characteristic pattern over mineralization.At Deerhorn, the highest IDH values are observed abovethe eastern margin <strong>of</strong> the eastern mineralized zone, whereas it islowest between the mineralized areas (Figure 35). It is also highnear the eastern limit <strong>of</strong> the sample traverse (at site DHB021).A relative IDH low occurs between the mineralized zones. Thehighest Cu values in soil coincide with an IDH low between themineralized zones but high Cu values also occur where IDH ishigh over basalt at the eastern end <strong>of</strong> the sample traverse andover the eastern margin <strong>of</strong> mineralization. Zinc in soils is highestmarginal to, and more distal from, the mineralization comparedto Cu, possibly reflecting primary metal zonation in the bedrockor the mobility <strong>of</strong> Zn at higher pH (>6) than <strong>for</strong> Cu (
Figure 33. Example <strong>of</strong> the Bioleach response <strong>of</strong> Cs at Three Firs. The areas referred to in Table 3 are indicated.Table 4. General summary <strong>of</strong> geochemical responses as a function <strong>of</strong> sample media and analytical method.Type <strong>of</strong> anomalyover mineralizationBioleachTotalnumber <strong>of</strong>elementsAqua regiaTotalnumber<strong>of</strong>elementsTotal (4-acid)Totalnumber <strong>of</strong>elementsEnzyme leachTotalnumber <strong>of</strong>elementsIonic leachTotalnumber<strong>of</strong>elementsSpruce twigs (ash)Total number<strong>of</strong> elementsApical 17 6 3 9 1 14 1Rabbit Ear 4 0 0 10 0 3 1Single peak 3 0 1 0 0 0 0Subtle, non-definitive 4 1 1 5 4 9 8Spruce bark (dry)Total number<strong>of</strong> elementsGrand totals 28 7 5 24 5 26 1040
Figure 34. The reduced column model. Figure was taken from Cohen et al. (2010) but concept is based on Hamilton (1998, 2000). The figure shows the development<strong>of</strong> a reduced column over sulphides in transported regolith. Metals mobile under reducing conditions migrate vertically along redox gradients. Above the water tablemetals are oxidized, creating a zone <strong>of</strong> low pH and carbonate loss. Carbonate precipitates at the edge <strong>of</strong> the reduced column. Metals such as Zn and Cd accumulatenear surface.Figure 35. Interpreted section showing the geochemical pattern at Three Firs in the context <strong>of</strong> the reduced column model <strong>of</strong> Hamilton (1998, 2000). The presence <strong>of</strong>multiple ore bodies which are tilted approximately 10° - 20 ° to the NW (Fig. 4), makes the observed geochemical pattern more complex to reconcile with the model.41
Figure 36. Interpreted section showing the geochemical pattern at Three Firs in the context <strong>of</strong> the reduced column model <strong>of</strong> Hamilton (1998, 2000). Note the extentunder the basalt and exact orientation <strong>of</strong> mineralized body is not known.At Three Firs the interpreted reduced column abovemineralization straddles the limit between till covered andbasalt + till-covered bedrock, indicating that the geochemicalsignal originating from an oxidizing sulfide body at depthpenetrates basalt cover as well as glaci<strong>of</strong>luvial sediments. This isalso observed at Deerhorn, especially with respect to Zn east <strong>of</strong>the mineralized zone. The high Cu, Zn and IDH measurements atthe eastern end <strong>of</strong> the sample traverse at Deerhorn also occurover basalt but the significance <strong>of</strong> this single sample location ispresently unknown.CONCLUSIONS• The geochemical techniques applied in this study indicatethat detection <strong>of</strong> mineralization under basalt cover ispossible.• Partial leach techniques on B-horizon soils, aboveall Bioleach, but also Enzyme Leach, Ionic Leach andto a lesser extent aqua regia digestions gave goodcontrast anomalies in soils attributable to concealedmineralization. In this context, elements that yieldedcompelling anomalies over mineralized areas in B-horizonsoils at Deerhorn, Three Firs or both include: As, Cu, Zn,Ni, Se, W, Ag, REE, Tl, In and others.• Results from more aggressive leaches (4 acid, aquaregia) are influenced by the type <strong>of</strong> cover (e.g., basaltvs. glaci<strong>of</strong>luvial sediment). The 4 acid technique can helpin delineating geological units but is not the method <strong>of</strong>choice <strong>for</strong> detecting mineralization.• Soil H + , H + a and EC data are generally consistent with thesoil geochemistry. IDH values are relatively low directlyabove mineralization and high at either margin, definingrabbit ear anomalies.• In general, spruce bark and twig geochemistry yield moresubtle, but still interpretable results compared to the soilgeochemical data. The alkali metals Rb, Cs and K producethe most compelling signals. They are elevated abovemineralization and are interpreted to reflect potassicalteration which is genetically and spatially closely relatedto porphyry style Cu-Au mineralization. At Three Firselevated Rb and Cs occur over basalt cover and suggestthe presence <strong>of</strong> potassic-altered rocks underneath.• Given that Chilcotin group basalts are vesicular andcommonly affected by columnar jointing, it is reasonableto assume that they are conduits <strong>for</strong> vertical ion transportfrom an oxidizing sulfide body at depth. Limited datasuggest that amygdules in basalt can record underlyingmineralization.RECOMMENDATIONS AND LIMITATIONSThe geochemical response <strong>of</strong> B-horizon soils and plantsare strongly dependent on the climatic conditions, surfacematerials, soil maturity and physiography. The results suggest42
that geochemical exploration <strong>for</strong> mineralization under basaltcover is potentially viable. Some aspects <strong>of</strong> the current studyrequire follow-up work. Further sampling and analytical workon amygdule geochemistry would be necessary <strong>for</strong> properevaluation <strong>of</strong> that sample medium. Further B-horizon soilsampling over basalt covered areas NE <strong>of</strong> Deerhorn in conjunctionwith evaluation <strong>of</strong> other geological data is recommended.Currently there is only subtle indication that mineralization maybe present under the basalt cover in that area. A higher sampledensity is also needed to properly evaluate the SGH and OSGmethods.Each analytical method and sample medium has its ownstrengths and weaknesses. Soil pH and EC measurements canbe made in the exploration camp and provide a dataset capable<strong>of</strong> identifying potential sulfide mineralization under the cover.Sampling <strong>for</strong> this method is quick and only a small amount <strong>of</strong>material from the Ae or top <strong>of</strong> the B-horizon (if Ae-horizon is notpresent) is needed.B-horizon soils if analysed using partial leach techniqueswork well <strong>for</strong> the identification <strong>of</strong> trace element anomaliesrelated to mineralization. Partial leach techniques, above all,Bioleach and Enzyme Leach, but also aqua regia gave the bestresults in this study. Aggressive 4 acid near total digestion, while<strong>of</strong> limited use <strong>for</strong> detecting anomalies related to mineralization,may work well <strong>for</strong> defining the extent <strong>of</strong> geological units. Plantgeochemistry promises rapid identification <strong>of</strong> potassic alterationzones and some commodity elements under cover as welldefinition <strong>of</strong> the distribution <strong>of</strong> some geological units.REFERENCESAndrews, G.D.M. and Russell, J.K. (2008): Cover thickness across the southernInterior Plateau, British Columbia (NTS 092O, P; 093A, B, C, F): constraintsfrom water-well records; <strong>Geoscience</strong> <strong>BC</strong> Summary <strong>of</strong> Activities 2007,<strong>Geoscience</strong> <strong>BC</strong>, Report 2008-1, p. 11–20.Barnett, C.T. and Williams, P.M. (2009): Using geochemistry and neural networksto map geology under glacial cover; <strong>Geoscience</strong> <strong>BC</strong>, Report 2009-3, 27p., URL [November2012].Bevier, M. L. (1983) Regional stratigraphy and age <strong>of</strong> Chilcotin Group basalts,south-central British Columbia: Canadian Journal <strong>of</strong> Earth Sciences, v.20, no. 4, p. 515–524.Blackwell, J.L., Lesage, G., Skinner, T., Eckfeldt, M., Black, E., Hamilton, J., Hertel,J., Laird, B., Madsen, J., Rainbow, A., Sherlock, R. and Sepp, M (2012):Geology <strong>of</strong> the Woodjam Property Core Area; Gold Fields CanadaExploration, unpublished digital geology map.Cohen, D. R., Kelley, D. L., Anand, R., and Coker, W. B., 2010: Major advancesin exploration geochemistry, 1998-2007: Geochemistry: Exploration,Environment, Analysis, v. 10, no. 1, p. 3-16Consolidated Woodjam Copper Corp. (2012a): New gold-copper zonediscovered at the Woodjam North property; Consolidated WoodjamCopper Corp., press release, August 7, 2012, URL
Rollinson, H. (1993): Using geochemical data: evaluation, presentation,interpretation; Longman, 177 p.Schiarizza, P., Bell, K. and Bayliss, S. (2009): Geology and mineral occurrences<strong>of</strong> the Murphy Lake area, south-central British Columbia (NTS 093A/03);in Geological Fieldwork 2008, <strong>BC</strong> Ministry <strong>of</strong> Energy, Mines and NaturalGas, Paper 2009-1, p. 169–187.Schiarizza, P., Israel, S., Heffernan, S., Boulton A., Bligh, J., Bell, K., Bayliss, S.,Macauley, J., Bluemel, B., Zuber, J., Friedman, R.M., Orchard, M.J.,Poulton, T.P. (2013): Bedrock geology between Thuya and WoodjamCreeks, south-central British Columbia, NTS92P/7, 8, 9, 10, 14, 15, 16,93A/2, 3, 6. British Columbia Geological Survey Open File 2013-05.Sherlock, R., Poos, S., Trueman, A. (2012): NI 43-101 Technical report <strong>for</strong> 2011activities on the Woodjam South property; Consolidated WoodjamCopper Corp., 185 p., URL Skinner, T. (2010): Report on the 2010 activities on the Woodjam NorthProperty; <strong>BC</strong> Ministry <strong>of</strong> Energy, Mines and Natural Gas, AssessmentReport 32 302, 81 p. URL Smee, B.W. (2009): Soil micro-layer, airborne particles, and pH: The Govettconnection: in Proceedings <strong>of</strong> the 24th IAGS, Fredricton, 2009, p. 91-94.Sun, S. and McDonough, W. F. (1989): Chemical and isotopic systematics <strong>of</strong>oceanic basalts: implications <strong>for</strong> mantle compositions and processes; inMagmatism in the Ocean Basins, A.D. Saunders and M.J. Norry (ed.),Geological Society <strong>of</strong> America, Special Publication 42, p. 313–345.Sutherland, D. (2012a): SGH-soil gas hydrocarbon predictive geochemistry;prepared <strong>for</strong> the Mineral Deposit Research Unit, Department <strong>of</strong> Earthand Ocean Sciences, University <strong>of</strong> British Columbia, unpublished report,42 p.Sutherland, D. (2012a): OSG Organo-sulphur geochemistry A predictivegeochemistry; prepared <strong>for</strong> the Mineral Deposit Research Unit,Department <strong>of</strong> Earth and Ocean Sciences, University <strong>of</strong> British Columbia,unpublished report, 33 p.Vaca, S. (2012): Variability in the Nicola/Takla Group basalts and implications<strong>for</strong> alkalic Cu-Au porphyry prospectivity in the Quesnel terrane,British Columbia, Canada; MSc thesis, University <strong>of</strong> British Columbia,Vancouver, 148 p., URL
APPENDIX: COMPARISON OF MMI AND OTHERPARTIAL LEACH METHODSAs part <strong>of</strong> the project “Seeing through Chilcotin basalts:the geochemical signal <strong>of</strong> what is hidden under-neath (092P,093A, C)”, and in addition to the sample traverses discussed inthe report, 27 samples have been collected <strong>for</strong> Mobile MetalIon (MMI) analysis. None <strong>of</strong> these sample locations are in basaltcovered areas (Figure A1), and <strong>for</strong> that reason the MMI resultsare only presented in this appendix to the report. Figures A2and A3 present a comparison <strong>of</strong> MMI with Bioleach, EnzymeLeach and Ionic Leach results <strong>for</strong> Cu, Zn, Ni, Cs and Rb. FigureA4 presents the MMI results <strong>for</strong> Au and Ag. The reader isencouraged to explore also the digital data files provided withthis report.RESULTSThe sample traverse is characterized by a swampy areawhere the soils were clay rich and water saturated, which had asignificant effect on soil geochemistry through the hydromorphicaddition <strong>of</strong> a number <strong>of</strong> elements. In all partial leach methodsthe values <strong>of</strong> Ni and Cu are by far the highest in the swampyarea (Figure A2), whereas Zn is only elevated in the Bioleachand Enzyme leach results (Figure A2). Overall, the Cu, Zn andNi signals above mineralization are subtle. Zinc shows elevatedvalues above mineralization in the Ionic Leach and Bioleach databut also at the western limit <strong>of</strong> the sample traverse, whereasthe Enzyme leach results <strong>for</strong> Zn are ambiguous with respect tomineralization. The MMI results show elevated Zn values largelyat the western extent <strong>of</strong> the sample traverse where no concealedmineralization is known (Figure A2). Copper is somewhatelevated in two samples above mineralization in the Ionic Leachresults, whereas a single value in the Enzyme Leach results maybe considered anomalous above mineralization (Figure A2). TheMMI method yields a broad zone <strong>of</strong> elevated Cu values centeredon and around the swampy area but no compelling anomalyabove mineralization (Figure A2). Nickel in the MMI data islowest above mineralization. In the other partial leach methods,with the possible exception <strong>of</strong> Ionic Leach (cf. also Figure 11 inthe report), Ni is not distinctly above background (Figure A2)and, thus, is <strong>of</strong> limited use as pathfinder element in this case.Rubidium and Cs are elements that are commonlyenriched in potassic alteration zones. The analytical results<strong>for</strong> these elements are shown in Figure A3. As with Cu, Zn andNi, the concentration <strong>of</strong> these elements seems to be stronglyinfluenced by hydromorphic concentration in swampy areas. Inthe Ionic Leach, Enzyme Leach and Bioleach results the Cs andRb concentrations are highest in the swampy area whereas nocompelling anomaly has been detected above mineralizationusing these methods. The MMI results <strong>for</strong> Rb and Cs aredistinct from the other partial leach techniques. The highest Rbconcentrations do not only come from the swampy area but als<strong>of</strong>rom the western limit <strong>of</strong> the sample traverse. However, overallthe Rb is variable and does not show an interpretable pattern.Cesium has one high value in the swampy area and one directlyabove mineralization with lower values in between. Somewhatelevated Cs values are also observed at the western limit <strong>of</strong> thesample traverse away from mineralization.Gold and Ag are generally above detection limit in theMMI results but close or at LOD <strong>for</strong> the other partial leachmethods. These are there<strong>for</strong>e only shown <strong>for</strong> MMI (Figure A4).The highest Au concentrations are observed in a single samplesite just to the east <strong>of</strong> the mineralized zone but elevated Auvalues are also observed in the swampy areas. Silver is alsohighest just to the east <strong>of</strong> the mineralized zone and additionalrelatively elevated Ag values are observed above and just west<strong>of</strong> the mineralized zone. In contrast to most other elementsdiscussed above, Ag is not particularly elevated in the swampyarea. However, overall the Ag signal above mineralization cannotbe considered a compelling anomaly.DISCUSSION AND CONCLUSIONBased on the results presented above it is evident thatpartial leach geochemical techniques are prone to delineatingfalse positives in water saturated clay rich soils, which probablycan be attributed to hydromorphic mobilization in thoseenvironments. This effect seems to be particularly pronounced<strong>for</strong> Cu and Ni in the MMI method. For Zn and Cu, the Ionic,Enzyme and Bioleach methods produce reasonably compellinganomalies above mineralization whereas no such case can bemade <strong>for</strong> MMI. However, the latter method may be superiorto other partial leaches <strong>for</strong> other elements. A subtle possiblerabbit ear anomaly is shown <strong>for</strong> Ag wheras Cs is elevatedabove mineralization in the MMI data. Thus, it is in the realm<strong>of</strong> possibilities that the MMI method is capable <strong>of</strong> detecting Csanomalies related to potassic alteration.In general, the Ionic Leach, Bioleach and Enzyme Leachresults are similar to each other but somewhat distinct fromthose from MMI. This discrepancy may be due to differencesbetween these proprietary laboratory methods but could alsobe the effect <strong>of</strong> the sample medium. Samples <strong>for</strong> MMI are takenat a standard depth <strong>of</strong> 10 to 25 cm, irrespective <strong>of</strong> the soil type,whereas <strong>for</strong> the other methods the upper B or Bf horizon istargeted.45
Figure A1. Locations <strong>of</strong> sample sites in the Deerhorn area <strong>for</strong> which MMI results were obtained (in addition to other soilgeochemical datasets). Geology from Blackwell et al. (2012).46
Figure A2. Comparison <strong>of</strong> analytical results <strong>for</strong> Zn, Cu and Ni using different partial leach methods.47
Figure A3. Comparison <strong>of</strong> analytical results <strong>for</strong> Cs and Rb using different partial leach methods.48
Figure A4. Gold and Ag analytical results by the MMI method.49