Automated Axon Tracking of 3D Confocal Laser Scanning ...
Automated Axon Tracking of 3D Confocal Laser Scanning ...
Automated Axon Tracking of 3D Confocal Laser Scanning ...

You also want an ePaper? Increase the reach of your titles
YUMPU automatically turns print PDFs into web optimized ePapers that Google loves.
AbstractThis paper presents a new algorithm for extracting the centerlines <strong>of</strong> the axons from a <strong>3D</strong> datastack collected by a confocal laser scanning microscope. Recovery <strong>of</strong> neuronal structures fromsuch datasets is critical for quantitatively addressing a range <strong>of</strong> neurobiological questions such asthe manner in which the branching pattern <strong>of</strong> motor neurons change during synapse elimination.Unfortunately, the data acquired using fluorescence microscopy contains many imaging artifacts,such as blurry boundaries and non-uniform intensities <strong>of</strong> fluorescent radiation. This makes thecenterline extraction difficult. We propose a robust segmentation method based on probabilisticregion merging to extract the centerlines <strong>of</strong> individual axons with minimal user interaction. The<strong>3D</strong> model <strong>of</strong> the extracted axon centerlines in three datasets is presented in this paper. Theresults are validated with the manual tracking results while the robustness <strong>of</strong> the algorithm iscompared with the published repulsive snake algorithm.Keywords – Maximum Intensity Projection, Segmentation, Guided Region Growing, Watershed2
1. IntroductionThe orientation <strong>of</strong> motor axons is critical in answering questions regarding synapse eliminationin a developing muscle (Keller-Peck et al., 2001). Biologists have tried to address this issue byidentifying the post-synaptic targets using transgenic mice that express fluorescent proteins insmall subsets <strong>of</strong> motor axons. The post-synaptic targets are the cells innervated by the axons.More specifically, in the neuromuscular system, these are the muscle fibers. At neuromuscularjunctions <strong>of</strong> developing mammals, the developing axonal branches <strong>of</strong> several motor neuronscompete with each other resulting in withdrawal <strong>of</strong> all branches but one (Kasthuri et al., 2003).The biological application <strong>of</strong> the developed algorithm is to reconstruct the entire innervationfield within a skeletal muscle based on images acquired from confocal microscopy. Given a <strong>3D</strong>image stack with non-uniform resolution in the x-, y- and z-direction, it is desirable to segmentmultiple axons contained in the neuron image and reduce them to one-pixel wide medial axis.Our aim here is to better understand the spatial relations <strong>of</strong> groups <strong>of</strong> axons traveling in a nerve.The features revealed by the reconstruction help neuroscientists to understand how neuronsinteract with and control muscular retracting. The size <strong>of</strong> the individual datasets range from 20-30 Megabytes, but when they are joined together to form a collage, they are typically a fewTerabytes in size. Since the data sets to be analyzed are huge, robust and automated algorithmsare needed to track the centerlines <strong>of</strong> the axons accurately.The tracking approaches introduced in the past can be broadly classified into three groups.The first class <strong>of</strong> algorithms tracks the centerlines <strong>of</strong> tubular objects in the Maximum IntensityProjection (MIP) image. As the name suggests, the MIP image along a certain direction is theprojection <strong>of</strong> maximum intensities in the dataset along that direction onto a plane perpendicularto it. This is essentially a data reduction step which provides a 2D image <strong>of</strong> the objects present in3
the <strong>3D</strong> stack. Several automatic algorithms were introduced in the past for the centerline tracking<strong>of</strong> elongated tubular objects, such as retinal vasculature (Can et al., 1999) and neurons (Zhang etal., 2006). Though being computationally efficient in tracking the centerlines, they fail to workwhen the objects seem to cross each other in the MIP image.The second category <strong>of</strong> algorithms tracks the centers by segmenting the objects in a sequence<strong>of</strong> cross-sectional images in the dataset. A popular algorithm in practice today is the snake model(Kass et al., 1987). It improves on an initial boundary by minimizing an energy functionalconsisting <strong>of</strong> internal and external energies. The authors <strong>of</strong> (Cai et al., 2006) proposed animprovement over the original snake model by incorporating a repulsive force to segment closelying cross-sections <strong>of</strong> axons. Similar to the snake model, the repulsive snake model is unable toaccurately segment the axons <strong>of</strong> blurred boundaries. Level-sets represent another approach tosegment and track using cross-sectional information, but they are computationally expensive andcan be slow to converge (Xiong et al., 2006).The final set <strong>of</strong> algorithms deploys <strong>3D</strong> methods to track the objects in volumes <strong>of</strong>microscopic data. The main advantage <strong>of</strong> these algorithms is that they can track the objectsregardless <strong>of</strong> their image orientation. The authors <strong>of</strong> (Al-K<strong>of</strong>ahi et al., 2002) built on thetemplate based approach in (Can et al., 1999). The axons over short distances were modeled ascylinders with elliptical cross-sections having a certain curvature. Four sets <strong>of</strong> directionaltemplates were used to track the centers <strong>of</strong> the axons in each iteration. Another approach wasintroduced in (Tschirren et al., 2005), where the authors used fuzzy connectivity forsegmentation and analysis <strong>of</strong> intra-thoracic airway trees. The dataset was analyzed iterativelyinside a moving cylindrical region <strong>of</strong> interest. Inside this cylinder, two regions, foreground andbackground, were grown simultaneously to compete for voxels. The centerlines could then be4
found by skeletonization process. The authors <strong>of</strong> (Streekstra et al., 2002) used derivatives <strong>of</strong> aGaussian kernel to find the direction and the location <strong>of</strong> the centerlines. The orientation <strong>of</strong> thecenterline is first found by computing the direction along which the second order derivative isthe least in magnitude. In a plane perpendicular to this direction, a point where the gradientvanishes is declared to be the center. Though the algorithms that fall in this category aretheoretically attractive, their computational costs increase significantly with the size andcomplexity <strong>of</strong> the datasets.Commercially or publicly available s<strong>of</strong>tware packages, such as NeuronJ (Meijering et al.,2004) and Reconstruct (Fiala, 2005), on the other hand, track the centerlines in such fluorescentmicroscopic stacks interactively. NeuronJ, a plug-in for the freely available s<strong>of</strong>tware, ImageJ(Abram<strong>of</strong>f et al., 2004), uses live-wire (Barrett et al., 1997) method to track the centerlines in theMIP image. The user has to select at least two points for each axon and has to guide thecenterline when there is an ambiguity. Reconstruct also needs user intervention when the axonsare close to each other. Manually segmenting huge stacks <strong>of</strong> data is a painstaking task and canlead to fatigue related bias.A new and computationally efficient tracking algorithm for extracting the centerlines <strong>of</strong> theaxons in fluorescent microscopy datasets is presented in this paper. We introduce a robust hybridalgorithm to track the centerlines <strong>of</strong> the axons in three-dimensional space with minimal userintervention. The basic approach is to track well-separated axons in the MIP plane using a lowcomplexitytwo-dimensional approach developed in (Can et al., 1999) and adopt morecomputationally sophisticated algorithms when the centerlines appear to intersect each other inthe MIP image. In addition, we make use <strong>of</strong> the cross-sectional information as the cross-over <strong>of</strong>centerlines can be easily resolved using this approach. Our approach can be summarized as: (1)5
Track the centerlines in the MIP image as far as possible, (2) switch to cross-sectional tracking ifan axon cross-over is detected and (3) switch back to MIP tracking once the cross-over isresolved. We propose a guided region merging algorithm which is efficient in segmenting theaxons when their boundaries are blurred due to imaging artifacts. Both shape and intensityinformation is used to track the axons which help us segment the axons in the cross-sectionalplane accurately.The organization <strong>of</strong> the paper is as follows. The method for extracting axon centerlines intwo dimensions is mentioned in Section 2.1. In Section 2.2, we describe the approach adopted tosolve the cross-over problem by switching to the cross-section based approach. Section 2.3introduces our guided region growing algorithm which uses a probabilistic method based on thefeatures extracted from the previous cross-sections.We conclude the paper by demonstrating the results <strong>of</strong> this algorithm in Section 3. Ouralgorithm is applied on three datasets, and the results are compared with the manual results. Todemonstrate the efficiency <strong>of</strong> our algorithm, its performance is compared with the centerlineextraction method using repulsive snake model (Cai et al., 2006).2. Materials and MethodsMaterialsThe raw data available for analysis consists <strong>of</strong> stacks <strong>of</strong> cross-sectional images <strong>of</strong> the axonsobtained from neonatal mice using laser scanning confocal microscopes (Olympus FlouviewFV500 and Bio-Rad 1024) equipped with motorized stage. For our study, the neurons <strong>of</strong> interestall expressed cytoplasmic YFP relatively uniformly inside each cell. YFP was excited with a448nm line <strong>of</strong> argon laser using an X63 (1.4NA) oil objective with a 520-550nm band-pass6
emission filter (Kasthuri et al., 2003). The images were sampled at the Nyquist limit in theimaging plane (pixel size = 0.1 micron) and over-sampled by a factor <strong>of</strong> 1.5 in the directionnormal to the imaging plane (optical section thickness = 0.2 micron), and with a 12 bit dynamicrange. Since the axons are not stained, the background is minimal in the acquired images. Thegoal <strong>of</strong> the developed algorithm is to build a three-dimensional model <strong>of</strong> the centerlines <strong>of</strong> theaxons present in the dataset.MethodsThe dataset available for analysis is a sequence <strong>of</strong> cross-sectional fluorescent microscopicimages <strong>of</strong> axons. These images can be stacked together to get a better picture <strong>of</strong> the axonspresent in the dataset. MIP-based tracking algorithms (Can et al., 1999; Zhang et al., 2006) workonly when the axons are well separated, which is <strong>of</strong>ten not the case. Thus, axon cross-over is<strong>of</strong>ten encountered when tracking them in two dimensions. Since they never intersect in threedimensions, we resort to a different approach in such special cases. The following flow chartshows the workflow <strong>of</strong> the algorithm:7
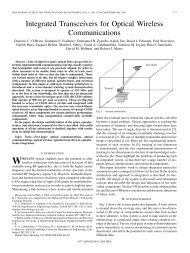
2.1 <strong>Tracking</strong> the <strong>Axon</strong>s in the MIP ImageA simple dataset is shown in Figure 1, containing two axons shown by red and blue structures.Since such a dataset is formed by stacking a sequence <strong>of</strong> cross-sectional images, each point onthe centerlines <strong>of</strong> the axons corresponds to one cross-sectional slice in the stack <strong>of</strong> data. As seenin Figure 1, there are several points where the axons seem to cross each other. But when seenfrom a cross-sectional point <strong>of</strong> view, it is clear that they do not in fact intersect.Figure 1: An example <strong>of</strong> a stack <strong>of</strong> cross-sectional images <strong>of</strong> two axons.The MIP is just a way <strong>of</strong> visualizing the axons present in the stack <strong>of</strong> data. As mentionedearlier, the MIP image is the projection <strong>of</strong> the maximum intensities along a particular directiononto a plane perpendicular to it. Figure 1 shows the three orthogonal directions along which theMIP images could be found. The algorithm begins after the user selects one <strong>of</strong> the three possibleMIP images <strong>of</strong> the dataset having the clearest details. Figure 2 shows the three MIP images in thethree orthogonal directions in one such dataset. Since the MIP image along Z-axis provides theclearest view <strong>of</strong> the individual axons, and hence is the best for analysis, it has been used in8
tracking the centerlines. After an MIP image is chosen, it is preprocessed to enhance the edges <strong>of</strong>the structures.(a)(b)(c)Figure 2 - The Maximum Intensity Projection Images: (a) MIP along Y-axis, (b) MIP along Z-axis, and (c) MIPalong X-axis. The scale bar in (a) corresponds to 3μm. The scale bars in (b) and (c) correspond to 6μm.The method described in (Can et al., 1999) is adopted to track the centerlines <strong>of</strong> the axons inthe edge-enhanced MIP image. In order to automate the initialization <strong>of</strong> the tracks, a set <strong>of</strong> seedpoints is defined on the MIP image. They serve as starting points and guide the tracking9
algorithm, and therefore must be inside the axons. Instead <strong>of</strong> searching the whole image for suchpoints, a grid <strong>of</strong> predefined resolution, which is determined by the user, is specified on the MIPimage. Only the intersection points <strong>of</strong> the horizontal and vertical grid lines are considered ascandidate seed points. Therefore, the user must ensure that the resolution <strong>of</strong> the grid has to besuch that at least a few such intersection points lie on each <strong>of</strong> the axons. From all the points onthe grid, the ones used as seeds are detected based on a threshold applied to the intensity. Thisthreshold is computed as:T = μ + σ(1)where μ and σ are the mean and standard deviation <strong>of</strong> the intensities <strong>of</strong> all the points lying on theintersection <strong>of</strong> the grid lines. In other words, all the points, from th e set <strong>of</strong> the intersection points,whose intensity exceeds the threshold, are considered to be seed points. Due to noise or presence<strong>of</strong> structures, such as neuromuscular junctions, shown inside the yellow shaded regions in Figure3(a), there are chances that some seed points are located outside the actual axons. If thealgorithm begins at any <strong>of</strong> these points, a tracking error might result. To minimize such errors,the seed points are aligned towards the center <strong>of</strong> the axons by using the directional templatebased tracking method. Directional templates are correlated with the image at varying distancesfrom the seed points to identify the edges <strong>of</strong> the axons at these locations. The seed points arethen aligned towards the center by using the distance <strong>of</strong> the edges from the seed points.It can be seen from Figure 3(a) that the neuromuscular junctions are faint and have irregularshapes. Due to this fact, the detected edges, with the seed points on the neuromuscular junctionsas the center, will be prone to errors. If we align these seed points based on the left and rightedges, the seed points will most likely now lie in the background. Therefore, after the alignmentprocess, we once again use the threshold computed using Equation (1) to determine if the seed10
points are lying on the axons or in the background. This minimizes the chances <strong>of</strong> seed pointsdetected outside the axons, either due to noise or other structures in the image. Figure 3 showsthe automatic detected seed points in the MIP image and their alignment towards the center.(a)(b)Figure 3 – Automatic detection and alignment <strong>of</strong> seed points: (a) seed points detected on a grid with a resolution <strong>of</strong>20 pixels, and (b) Center-aligned seed points. The scale bars in the figures correspond to 6μm.The two-dimensional MIP tracking method begins by defining directional templates for each<strong>of</strong> sixteen quantized directions for detecting the edges, angle <strong>of</strong> orientation, and the center points<strong>of</strong> axons present in the MIP image. As mentioned earlier, the seed points detected automaticallyin the MIP image are aligned towards the center <strong>of</strong> the axon on which they lie. With the firstunaligned seed point as center, the edges <strong>of</strong> the corresponding axon are detected by correlatingthe templates with the image at varying distances from this seed point. The angle at which thetemplate response is greatest is considered as the angle <strong>of</strong> orientation <strong>of</strong> the axon at thatparticular location. The distances from either side <strong>of</strong> the center at which the template response isgreatest are considered as the edges. This edge information is then used to align the seed points11
towards the center. Similarly, all the seed points in the MIP image are aligned towards the center<strong>of</strong> the axon on which they lie.The axons in the MIP image are tracked individually using an iterative process. Thealgorithm is initiated at the first aligned seed point in the image. Using the angle <strong>of</strong> orientation <strong>of</strong>theaxon at this particular location, the next center <strong>of</strong> the axon is predicted by moving by apredefined step size along this direction. The edges <strong>of</strong> the axons are then detected as mentionedearlier and any error in prediction is corrected by using the distance <strong>of</strong> the edges from the center.Since the axon thickness is known to be fairly smooth over small distances, the edge information<strong>of</strong> the axon in the previous iteration is used as a constraint to minimize errors. More specifically,the distance <strong>of</strong> the edges from the center in the current iteration are bounded to lie within acertain limit near the previously detected edge lengths. This limit is set equal to the step size <strong>of</strong>the algorithm, as it can be safely assumed that edge lengths corresponding to close lying centerson an axon have more similarity than those that are far spaced. An axon is said to be completelytraced in the MIP image if the predicted center lies outside the image boundary or in thebackground.During the axon tracking process, seed points are searched in the vicinity <strong>of</strong> the center, andany seed point found is labeled with the current axon number. Once a particular axon iscompletely traced, the algorithm begins with the next unlabeled seed point in the MIP image. Allthe axons are considered to be traced when every seed point in the image is labeled. Though thismethod is computationally efficient, it cannot track the centerlines when the axons seem to crossoverin the MIP image. Figure 4 shows the cross-over <strong>of</strong> axons.2.2 Detection <strong>of</strong> centerlines using cross-sectional informationA cross-over is detected by the algorithm when the centerline <strong>of</strong> the current axon intersects a12
traced axon in the MIP image. To deal with this situation, we have developed an algorithm thatworks directly on the cross-sectional information. Though this method is accurate, it iscomputationally expensive as compared the method described in the previous section. Therefore,it is applied to only a few sections in the dataset where there is an ambiguity due to the cross-over.An outline <strong>of</strong> our processing scheme is as follows. First, as mentioned earlier, the crosssectionalimages <strong>of</strong> axons in the dataset suffer from intensity non-uniformity and blurriness.Hence, all the cross-sectional im ages are preprocessed using the Hessian method <strong>of</strong> adaptivesmoothing (Carmona et al., 1998). Besides removing noise from the image, this method alsoenhances image features. The axons are then segmented using the seeded watershed algorithm(Gonzalez et al., 1992) to find their centers in the cross-sections. Hence, another set <strong>of</strong> seedpointsare introduced here that are used as the starting point for the segmentation algorithm.Unlike the previous use <strong>of</strong> seeds, the ones for this stage <strong>of</strong> the methods are specified within thecross-sectional images being analyzed and are used to roughly determine the centers <strong>of</strong> themultiple axons located within the cross section. The mean-shift algorithm (Debeir et al., 2005) isused to find the seed points. Finally, a guided region growing approach is developed toaccurately segment the axons when the seeded watersh ed algorithm fails.The process begins by identifying a cross-sectional slice where the axons in question arewell-separated. Starting from the point <strong>of</strong> cross-over in the MIP image, a search is initiated t<strong>of</strong>ind a location where the centerlines <strong>of</strong> the axons are separated by more than a certain distance,d, defined as:d = d current+ d traced(2)where d current and d traced are the diameters <strong>of</strong> the current and the intersecting axon. They aredetermined by using the left and right edge information from the template based MIP tracking13
algorithm. The blue line in Figure 4 shows this location.Figure 4 - The phenomenon <strong>of</strong> axon cross-over. The scale bar in the figure corresponds to 4μm. The figure has beenmagnified for better visualization.Since each point on the centerlines <strong>of</strong> the axons in the MIP image correspond to a crosssectionalslice, as shown in Figure 1, we pull out the corresponding slice from the dataset to startthe cross-sectional analysis. Once the axons are found to be well separated again in threedimensionalspace, the template based tracking is used again to track the axons in the MIPimage.2.2.1 <strong>Tracking</strong>The axons in the cross-sectional slices are segmented in order to find the centerlines <strong>of</strong> theaxons. Apart from providing a good visualization <strong>of</strong> the axon boundaries in the cross-sections,segmentation helps in the detection <strong>of</strong> the centers <strong>of</strong> axons when they have irregular shapes. Toavoid errors in finding the centerlines, all the axons present in the current slice, including thosethat are not yet tracked in MIP image, are tracked together. In order to find the starting points forthe segmentation algorithm, the approximate center points have to be estimated. Thus we14
introduce another set <strong>of</strong> seed points that initiate the segmentation.We begin the analysis by finding the centers <strong>of</strong> the axons in the first cross-sectional slice.The centers <strong>of</strong> the axons traced in the MIP image can be easily found by searching for localintensity maxima in that slice. But, as seen in Figure 4, not all the axons are usually traced in theMIP image before encountering a cross-over. Therefore, the seed points for the rest <strong>of</strong> the axonsin the first image are identified manually. These serve as the initial seed points for the next slicein the dataset. The axon cross-sections in the current slice will most likely be shifted from theirpositions in the previous slice. So, the centers from the previous cross-section cannot be directlyused as seeds, and need correction. The mean-shift algorithm is used for this purpose.Mean-ShiftThe mean-shift makes use <strong>of</strong> the intensity information to find the seed points in the image. Itbasically tries to find the approximate center points by searching for the center inside a movingkernel, which is a disc shaped region. The kernel is first placed at the initial seed points obtaineddirectly from the previous cross-section. The center inside the kernel is calculated based on theweighted mean with the intensity as the weights. The seed point is then updated with the meancalculated in the current iteration. The kernel is now centered at the new seed point and thecomputation is repeated again until the algorithm converges or until the number <strong>of</strong> iterationsreaches a preset threshold.The mean shift algorithm fails when close-lying axons have a considerable difference in theirintensities. The algorithm tends to move towards the brighter axon in such cases, which results inseed point being placed near the edges or sometimes entirely outside the actual axon. This isshown in Figure 6(a) inside the yellow ellipse. The corresponding segmentation result usingseeded watershed algorithm is shown in Figure 6(b).15
To avoid this problem, we introduce constraints in the algorithm that use the informationfrom the segmented regions in the previous slice. First, the radius <strong>of</strong> the kernel is determined as:R =min( r,a)2(3)where, r is the radius <strong>of</strong> a circle with the same area as the segmented region and a is the minoraxis after fitting an ellipse to the segmented region. This helps in minimizing the errors infinding the seed points when the axons have irregular shapes.The mean shift is then applied inside a window instead <strong>of</strong> the whole image. This constraintensures that the seed points do not move out <strong>of</strong> the actual axon. The size <strong>of</strong> the window is set totwice the diameter <strong>of</strong> a circle that has the same area as the segmented axon cross-section in theprevious slice. This is a reasonable assumption since the changes in axon position from one sliceto the next is known to be smooth. Figure 5 shows the trajectory <strong>of</strong> the mean-shift for an axoninside a window. The green cross indicates the starting point <strong>of</strong> the mean-shift. The trajectory <strong>of</strong>the algorithm is shown by the series <strong>of</strong> Blue crosses. The Red cross indicates the point to whichthe mean-shift converges.Figure 5 - The trajectory <strong>of</strong> the mean-shift algorithm. The scale bar in the figure corresponds to 0.2μm. Since this isa magnified version <strong>of</strong> the actual image, the pixels are seen as block-like structures.16
The seeds found by the mean-shift algorithm using the constraints is shown in Figure 6(c)and the corresponding segmentation result using seeded watershed algorithm is shown in Figure6(d).(a)(b)(c)(d)Figure 6 - Seeds estimated by the mean-shift algorithm: (a) Wrongly estimated seeds, shown inside the yellowellipse, found without constraints, (b) Segmentation results using seeds in (a), (c) Seeds found using constraints, and(d) Segmentation results using seeds in (c). The scale bars in the figures correspond to 1μm.2.2.2 Segmentation <strong>of</strong> axon cross-sectionsOnce the seed points are estimated, the axon cross-sections are segmented using the seededwatershed algorithm. The seeds act as the starting points for the segmentation algorithm and alsoprevent over-segmentation, a common problem with watershed algorithm. Figure 7 compares thesegmentation results <strong>of</strong> five axons with and without the introduction <strong>of</strong> seeds.17
(a)(b)(c)Figure 7 - Segmentation <strong>of</strong> axons using watershed: (a) Original Image, (b) Segmentation without imposition <strong>of</strong>seeds, and (c) Segmentation using watershed after imposition <strong>of</strong> seeds. The scale bar in (a) corresponds to 1μm.The traditional watershed algorithm does not use a priori information during segmentation.Because it is based only on intensity values in the image, it fails to segment close-lying or closeoveraxon cross-sections with a large difference in intensities. One approach to address this issuemakes use <strong>of</strong> seed regions rather than seed points. Figure 9(b) shows the seed regions initializedto an ellipse whose major and minor axis are set to half their values determined in the previousslice, centered at the seed points detected by the mean-shift algorithm. But, as shown in Figure9(c) inside the yellow ellipse, the seeded watershed algorithm is unable to resolve the axons.We have developed a new algorithm to accurately segment the axons in such cases. Thedeveloped method uses the watershed algorithm as its basis, but guided by constraints. Theguided region growing algorithm is based on both object features and intensity information <strong>of</strong> theobjects in the image. Roughly speaking, we use the watershed method as a preprocessing stage toidentify candidate pixels that could be added to a segment. A probabilistic approach based onlikelihood evaluation using the features to be described below is then used to evaluate thesuitability <strong>of</strong> adding a given pixels to a specific segment. We note that this method is based on anunderlying assumption (born out in practice) that the cross sectional structures <strong>of</strong> axons do notvary drastically from one cross-sectional slice to the next. Hence, a reasonable amount <strong>of</strong>18
similarity can be assumed between consecutive cross-sections. The various parameters involvedin the algorithm are discussed here.Deciding the training set 'N'Selecting the number <strong>of</strong> training samples used to estimate statistics <strong>of</strong> our features is animportant decision. A large number <strong>of</strong> samples will average out the variations in the crosssections,resulting in improper segmentation while fewer samples mean a larger variance, whichcauses increased likelihoods to lie in either <strong>of</strong> the two extremes. In our case, we have chosentraining samples from 10 previously segmented slices. We emphasize that this choice wasemployed quite successfully across the three different data sets analyzed in Section 3.Deciding the featuresThe features are extracted from previously segmented slices by fitting an ellipse to thesegmented axons. Popular features that are usually used for training a model such as this arelength <strong>of</strong> major axis, length <strong>of</strong> minor axis, perimeter, average intensity, difference in centersfrom one cross-section to the next, area and orientation (Li et al., 2007; Wang etal., 2007).Since the axon cross-sections have irregular shapes and varying intensity, only a few features canactually be useful in our case. It should be noted that even though the cross-sections haveirregular shapes, the change in their shape from one cross-sectional image to the next is notabrupt. The features have to be selected such that the likelihood increases only if the regiongrows into a particular shape and at a particular angle. We have found that orientation andperimeter are sufficient features to properly guide the algorithm to converge to the actual shape<strong>of</strong> the axon in the cross-section.Building the probabilistic feature modelAfter extracting the features from the previously segmented images, they are fit to Gaussian19
distribution and used to train the model. The mean and the covariance matrices for each axon arecalculated using these features. The similarity <strong>of</strong> the shape and size <strong>of</strong> an axon cross-sectionbetween two slices is dependent on the distance between them. In other words, the similaritybetween the cross-sections <strong>of</strong> an axon lying close together is more than those that are far-spaced.Thus, the feature vectors used for training are weighted to imply the similarity between theobjects in the current slice and the training feature. These weights are set to:( N −n+1)wn= e ,where n is the distance between the current slice and the slice where the features were extracted,and N is the number <strong>of</strong> slices used to train the model. As it can be seen, the influence <strong>of</strong> thefeature vectors decreases exponentially as we move away from the current slice. The weights arethen normalized as:wwˆ nn= , where W =W ∑ wNn=1n.where,The weighted mean for the feature vectors are then calculated as:matrix is then computed as:rμw=N∑rwˆ. fn=1rfnis the feature vector at n slices away from the current slice. The weighted covariancer N r r r rR wˆw= ∑ n.(fn− μw)*(fn− μw)n=1Once the model is built using Equations (4) and (5), it acts as the central force driving thennT(4)(5)region growing. The likelihood <strong>of</strong> occurrence <strong>of</strong> a region with the feature vector, f r , in terms <strong>of</strong>the probabilistic model can be written as:Guided region growingr r r rT −1r[(f −μ) * R *( f −μ)]11 − w w w2pfr = r e1/ 2(6)2πRwOur algorithm starts with the seed regions in the image as defined in Figure 9(b). As pixels are20
analyzed, they are marked with a label that indicates the region to which they belong. The wateris filled in the image based on a threshold that is increased in subsequent iterations. In order tomake the algorithm less computationally demanding, only the pixels lying inside a region <strong>of</strong>interest are considered for analysis. This is computed by binarizing the image. If Otsu’s method(Otsu, 1979), a popular algorithm for determining the threshold for binarization, were to be used,the axons with low intensity are not properly binarized.In order to correct this, we adopt fuzzy c-means clustering (Dunn, 1973) to compute thethreshold. The first step is to cluster the image pixels into three groups based on their intensity.The threshold is then calculated by averaging the highest intensity pixel <strong>of</strong> the lowest intensitygroup and the lowest intensity pixel <strong>of</strong> the medium intensity group, which can be written as:( I low+ Imid)T =(7)2where, I low is the highest intensity pixel <strong>of</strong> the lowest intensity group and I mid is the lowestintensity pixel <strong>of</strong> the medium intensity pixel group. This makes sure that the threshold is lowenough to properly binarize the fainter axon cross-sections. Figure 8 compares the binarizedimages obtained using the thresholds determined by Otsu’s method and the fuzzy c-meansclustering method. It can be easily seen, by comparing Figure 8(b) and (c), that thethresholdcomputed using Equation (7) is better in binarizing fainter axons in the image.(a)(b)(c)Figure 8 – Determining the threshold for binarization <strong>of</strong> cross-sectional slices: (a) Original Image, (b) Binarizationusing Otsu’s method, and (c) Binarization using Fuzzy c-means clustering. The scale bar in (a) corresponds to 2μm.21
After the region <strong>of</strong> interest is identified, the threshold for guided region growing algorithm inthe first iteration is set to one level higher than the lowest intensity pixel in the region <strong>of</strong> interest.All the pixels in the image that are lesser than this threshold are considered to be submerged inwater in the current iteration. A list <strong>of</strong> unlabeled pixels is maintained for all the pixels that aresubmerged so far. For each <strong>of</strong> the regions in the image, connected components are searched fromthis list. From the list <strong>of</strong> pixels in the connected component list, individual pixels are added tothe region and the likelihood <strong>of</strong> occurrence <strong>of</strong> the new region is computed. The pixels areretained only if there is an increase in the likelihood. The same process is repeated until thethreshold reaches to the maximum value <strong>of</strong> the pixel in the region <strong>of</strong> interest. Since these pixelsare not reordered to find alternate paths for region growing, the algorithm introduced here is agreedy one. In Figure 9(d)-(e), we compare the segmentation results <strong>of</strong> the seeded watershedalgorithm and the guided region growing algorithm.(a)(b) (c)(d) (e)Figure 9 - Segmentation <strong>of</strong> axons using guided region growing: (a) Original image with seeds found usingmean-shift, (b) Seed regions, (c) Boundaries using seeded watershed algorithm with seed regions, (d) Magnifiedversion <strong>of</strong> boundaries in (c), and (e) Boundaries detected with guided region growing. Scale bars in the figurescorrespond to 2μm.It should be noted that the accurate segmentation <strong>of</strong> the faint and the small axons is crucial inpreventing the propagation <strong>of</strong> errors in tracking to the next slice. Such errors can adverselyimpact the quantitative analyses <strong>of</strong> the underlying biological questions.22
Once the hybrid algorithm tracks all the axons in the dataset, two kinds <strong>of</strong> segments <strong>of</strong>centerlines result: fragments that were tracked using the template-based approach and those thatwere tracked using a sequence <strong>of</strong> cross-s ectional slices. In order to build the <strong>3D</strong> model <strong>of</strong> thecenterlines, we need to locate the third dimension <strong>of</strong> each <strong>of</strong> these centers. Since the centerlinestracked using the template-based approach have no cross-over ambiguity, the third dimensioncan be easily found by searching for the local maximum intensity pixel in the correspondingslices in the dataset. In the latter case, the two dimensions <strong>of</strong> the centers <strong>of</strong> the segmentedregions, along with the slice number, give us the three dimensions <strong>of</strong> the centers. The results <strong>of</strong>the <strong>3D</strong> reconstruction <strong>of</strong> centerlines <strong>of</strong> axons in three datasets are shown in the next section. Theresults are validated with the manual tracking results and are compared with the repulsive snakealgorithm for robustness.3. ResultsThree datasets were analyzed using the hybrid algorithm proposed in this paper. The centerlines<strong>of</strong> the axons are presented in both two dimensions in the MIP image and in the three-dimensionaldomain. The various parameters that were manually initialized for the datasets are:• The number <strong>of</strong> cross-sectional slices in the dataset.• The MIP image <strong>of</strong> the dataset to be analyzed and the approximate maximum width <strong>of</strong> theaxons in the MIP image.• The resolution <strong>of</strong> the grid for the automatic detection <strong>of</strong> seeds in the MIP image for the 2Ddirectional template based tracking and the step size <strong>of</strong> the algorithm.• The initial seed points for the segmentation algorithm in the first axon cross-section eachtime when an axon cross-over is detected.23
The number <strong>of</strong> cross-sections to be analyzed by the algorithm is assumed to be known by theuser. The user also needs to identify the best MIP image for analysis by looking at the MIPimages along the three orthogonal directions. A rough estimate <strong>of</strong> the width <strong>of</strong> the biggest axonin this MIP image has to be specified by the user. The resolution <strong>of</strong> the grid for the detection <strong>of</strong>seed points in the MIP image needs to be defined such that there are at least a few candidate seedpoints on each <strong>of</strong> the axons in the MIP image. Small values <strong>of</strong> step size <strong>of</strong> the MIP-basedtracking algorithm results in higher accuracy in tracking, but increases the execution time <strong>of</strong> thealgorithm. On the other hand, large values lead to faster tracking, but can result in tracking errorsand a coarse centerline. In all the datasets presented in this paper, this value was set to 3 pixels.Once the algorithm switches to the cross-sectional tracking, the user has to specify the seedpoints for the cross-sections <strong>of</strong> the axons that have not yet been tracked in the MIP image. This isdone only for the first cross-sectional image where the algorithm switches to a different method<strong>of</strong> analysis.The results <strong>of</strong> our algorithm were validated with the manual reconstruction results that wereobtained using Reconstruct. Finally, the performance <strong>of</strong> the guided region growing algorithm iscompared with the repulsive snake model on one cross-sectional image from each <strong>of</strong> the threedatasets.The first dataset contained four axons in total with 256 cross-sectional images, each having aresolution <strong>of</strong> 141 x 512 pixels. The cross-sectional images were sampled along the Y direction.Figure 10(a)-(b) show the MIP image and the cross-over <strong>of</strong> axons in the MIP image. Themaximum width <strong>of</strong> the axon was set to twenty pixels and the resolution <strong>of</strong> the grid for the MIPimage was set to ten pixels. Figure 10(c) shows the manual reconstruction <strong>of</strong> the axons. The 2DMIP and the <strong>3D</strong> model <strong>of</strong> the centerlines are shown in Figure 10(d)-(e).24
(a)(b)(c)(d)25
(e)Figure 10 – <strong>Tracking</strong> results in dataset one: (a) The MIP image <strong>of</strong> the dataset, (b) Cross-over in the MIP image(The region inside the yellow rectangle in (a) has been magnified for better visualization), (c) Manual trackingresults, (d) Centerlines in MIP image, and (e) <strong>3D</strong> model <strong>of</strong> the centerlines. The scale bars in (a) and (d) correspondto 6μm. The scale bar in (b) corresponds to 4μm.Approximately 50% <strong>of</strong> the dataset was tracked using the cross-sectional tracking algorithm.The average deviation <strong>of</strong> the centerlines detected by our algorithm from the manually trackedresults was found to be 1.75 pixels.The second dataset contained six axons with 256 cross-sectional images, each having aresolution <strong>of</strong> 43 x 512 pixels. The cross-sectional images were sampled along the X direction.Figure 11(a) shows the MIP image for this dataset. The cross-over <strong>of</strong> the axons in the MIP imageis shown inside the white ellipse in Figure 11(b). The maximum width <strong>of</strong> the axon was set t<strong>of</strong>orty pixels while the resolution <strong>of</strong> the grid for the MIP image was set to fifteen pixels. Figure11(c) shows the manual tracking results for the dataset. The 2D and the <strong>3D</strong> centerlines are shownin Figure 11(d)-(e).26
(a)(b)(c)(d)27
Figure 11 – <strong>Tracking</strong> results in dataset two: (a) The MIP image <strong>of</strong> the dataset, (b) Cross-over in the MIP image(The region inside the yellow rectangle in (a) has been magnified for better visualization), (c) Manual trackingresults, (d) Centerlines in MIP image, and (e) <strong>3D</strong> model <strong>of</strong> the centerlines The scale bars .in (a) and (d) correspondto 6μm. The scale bar in (b) corresponds to 2μm.Approximately 75% <strong>of</strong> this dataset was tracked using the cross-sectional tracking algorithm.The average deviation <strong>of</strong> the centerlines detected by our algorithm from the manually trackedresults was found to be 1.64 pixels.As the complexity <strong>of</strong> the dataset increases, a major part <strong>of</strong> the centerlines <strong>of</strong> the axons aretracked using the cross-sectional information. The final dataset contained seven axons with 256cross-sectional images, each having a resolution <strong>of</strong> 42 x 512 pixels. The cross-sectional imageswere sampled along the X direction. Due to the complex nature <strong>of</strong> the dataset, the centerlines <strong>of</strong>the axons are tracked entirely using the cross-sectional images. Hence, the centers <strong>of</strong> the axons inthe first cross-sectional image were manually identified. Figure 12(a) shows the MIP image forthe dataset. The manual tracking results for this dataset is shown in Figure 12(b). Figure 12(c)-(d) show the 2D MIP and <strong>3D</strong> model <strong>of</strong> the centerlines <strong>of</strong> the axons.28(e)
(a)(b)(c)(d)Figure 12 – <strong>Tracking</strong> results in dataset three: (a) The MIP image <strong>of</strong> the dataset, (b) Manual tracking results, (c)Centerlines in MIP image, and (d) <strong>3D</strong> model <strong>of</strong> the centerlines. The scale bars in (a) and (c) correspond to 6μm.29
In comparison with the manual tracking results, the average deviation <strong>of</strong> the tracked axoncenterlines in the third dataset was found to be 1.81 pixels.In order to demonstrate the accuracy and robustness <strong>of</strong> the proposed method in this paper, thesegmentation results are compared with that <strong>of</strong> the repulsive snake model. In this algorithm, theuser has to define the initial boundaries and the centers <strong>of</strong> the axons in the first cross-sectionalimage <strong>of</strong> the dataset. The snake then iteratively evolves to the individual boundaries <strong>of</strong> the axonsby minimizing the energy functional. The algorithms were executed on a PC with a 1.6 GHzIntel Pentium processor and 1.2 Gigabytes <strong>of</strong> memory. Since the datasets mentioned earlier inthis section contain hundreds <strong>of</strong> cross-sectional images, one cross-section from each <strong>of</strong> thedatasets, where a significant difference in segmentation can be noticed, is used to compare thetwo algorithms. Figure 13 shows the results <strong>of</strong> the two algorithms in the first dataset.(a)(b)F igure 13 - Comparison <strong>of</strong> segmentation results in dataset one: (a) Repulsive Snake Model, and (b) Guided regiongrowing. The scale bars in the figures correspond to 2μm. The figures have been magnified for better visualization.30
In this dataset, the repulsive snake algorithm was able to successfully track the axons in tenconsecutive slices. The execution time for ten slices was used to predict the time taken to analyzetheentire dataset, and was found to be approximately 60 minutes. On the other hand, theproposed algorithm analyzed this dataset in approximately 20 minutes. It can be seen that theboundaries <strong>of</strong> axons detected using the repulsive snake model are not accurate when the axonalcross-sections suffer from intensity non-uniformity. Hence, the centers <strong>of</strong> the axons found in thismanner are inaccurate which results in the propagation <strong>of</strong> error to subsequent slices. The guidedregion growing, on the other hand, is more robust in handling such situations. Figure 14compares the two algorithms in another image from the second dataset.(a)(b)Figure 14 - Comparison <strong>of</strong> segmentation results in dataset two: (a) Repulsive Snake Model, and (b) Guided regiongrowing. The scale bars in the figures correspond to 2μm. The figures have been magnified for better visualization.Due to the imaging artifacts, the repulsive snake model is unable to evolve to the trueboundaries <strong>of</strong> the axons in the image. This is overcome by the guided region growing algorithmby using the shape information from the previous slices. The repulsive snake algorithm failedafter two slices in the second dataset. Using the execution time <strong>of</strong> repulsive snake algorithm inthe two slices, the predicted time for analyzing the complete dataset was approximately 78minutes. Whereas, the proposed hybrid algorithm was able track the axon centerlines in theentire dataset in approximately 16 minutes.Figure 15 compares the two algorithms in the final dataset. Here, the repulsive snake31
algorithm worked for five consecutive slices in the dataset. Based on the execution time <strong>of</strong>repulsive snake algorithm for five slices, the time taken to analyze the whole dataset waspredicted to be approximately 84 minutes. The hybrid algorithm, on the other hand, was able totrack the centerlines <strong>of</strong> the axons in the entire dataset in approximately 24 minutes.(a)(b)Figure 15 - Comparison <strong>of</strong> segmentation results in dataset three: (a) Repulsive Snake Model, and (b) Guided regiongrowing. The scale bars in the figures correspond to 2μm. The figures have been magnified for better visualization.4. DiscussionBased on the nature <strong>of</strong> the axons in the MIP image, the datasets can be broadly categorized intothree groups:1. <strong>Axon</strong>s running mostly parallel to each other, with a few intertwined axons.2.<strong>Axon</strong>s running in bundles, with intertwined axons.3. <strong>Axon</strong>s with branches.The first two cases have been examined in the paper. The first two datasets analyzed in thepaper fall under the first category, whereas the third dataset belongs to the second group. Whenthe axons run in thick bundles, the boundaries <strong>of</strong> the axons may not be clearly visible in the MIPimage. In such a situation, the entire dataset can be tracked in the cross-sectional domain, as wasdone in the third dataset. Although the proposed algorithm cannot track axons with branches, webelieve that a few changes can help it track such structures.32
In the datasets containing branching structures, the hybrid algorithm will switch to the crosssectionalanalysis only where an axon cross-over is encountered or at axon branch points. Oncethe algorithm switches to the cross-sectional analysis, these two cases can be easily distinguishedfrom each other. If a branch point is encountered while tracking in the cross-sectional sequence,there will be a significant change in the size <strong>of</strong> the axon cross-section, since the axon crosssectionwill split into two parts. The user can then manually identify if this change is due to abranch point or caused by a sudden change <strong>of</strong> orientation <strong>of</strong> the axon with respect to the imagingplane.The algorithm proposed in the paper requires the structures in the dataset not to be orientedalong the imaging plane. This is required since if the axons are aligned parallel to the imagingplane, their cross-sections randomly appear and vanish if the images in the dataset are viewed ina sequence. When the axons are aligned this way, partially or completely, the following changescan improve the algorithm’s ability to adapt:• If all the axons in the dataset are aligned along the imaging plane, the dataset can be re-insampled normal to the imaging plane and the cross-sectional analysis can be performedthis direction. If some parts <strong>of</strong> the axon bundles are oriented along the imaging plane, thedataset can be subdivided into smaller subsets and each <strong>of</strong> them can be individually analyzed.By looking at the MIP image, the user can determine which subsets <strong>of</strong> the dataset need to bere-sampled. The centerlines from each <strong>of</strong> the subsets can then be merged together to form thecomplete centerline model.• Another way to solve this problem is to adopt cross-sectional analysis throughout the datasetand to re-slice the dataset at every step <strong>of</strong> the process. Once the orientation <strong>of</strong> an axon isfound at a particular point, the next cross-sectional slice is determined after slicing the33
dataset in a direction normal to the orientation <strong>of</strong> the axon. This ensures that the axon crosssectionsdo not randomly appear and vanish in the cross-sectional image sequence due totheir orientation with respect to the imaging plane. Although relatively more expensive thanthe previously mentioned approach, this method does not require manual intervention exceptin the first cross-sectional slice where the user has to specify the centers <strong>of</strong> the axons.A situation where the proposed hybrid algorithm fails is when the axons completely overlapin the MIP image. In such a case, our algorithm does not detect a cross-over and hence will notswitch to the cross-sectional analysis. This way, one or some <strong>of</strong> the axons in the MIP imagemight remain untraced altogether. In such rare conditions, the problem can be circumvented byanalyzing the whole dataset using cross-sectional analysis. An interesting case one might comeacross is when the structure size approaches the voxel size. Our algorithm can still be applied insuch a case. As mentioned earlier in the paper, to segment the axon cross-section, we have t<strong>of</strong>irst detect the seed points. If the structure size approached the voxel size, the seed points canstill be detected since they are detected inside a window. The window parameters are determinedbased on the segmentation result <strong>of</strong> the previous size. If the window is properly defined, themean-shift algorithm can accurately determine the seed points. The guided region growingalgorithm or the watershed can then easily determine the boundary.5. ConclusionFrom the datasets presented in this paper, it can be seen that the images have high signal to noiseratio, which makes it relatively easy to segment axons as a whole from the background.However, in many instances, axons tend to get close to each other, which make the process <strong>of</strong>tracking difficult. Significant problems in segmentation and tracking also arise when theintensity <strong>of</strong> the axon becomes weak. The hybrid algorithm presented in this paper is able to34
successfully track the centerlines <strong>of</strong> such axons in a sequence <strong>of</strong> cross-sectional images in thepresence <strong>of</strong> both such confounding circumstances. The goal <strong>of</strong> the algorithm introduced in thispaper was to reconstruct <strong>3D</strong> medial axes <strong>of</strong> the axons using the stack <strong>of</strong> microscopic images. Theinformation available from the <strong>3D</strong> reconstruction <strong>of</strong> the centerlines <strong>of</strong> the axons helpsneu rologists understand how neurons interact and control muscular retraction in mammals.A significant improvement over seeded watershed algorithm was demonstrated using theguided region growing method. The performance <strong>of</strong> our algorithm was compared with therepulsive snake algorithm and was shown to be more accurate in finding the boundaries <strong>of</strong> theaxonal cross-sections in spite <strong>of</strong> the presence <strong>of</strong> imaging artifacts. The future work wouldinvolve tracking axons in more complex datasets that contain branching patterns and run in thickbundles. Besides tracking the centerlines <strong>of</strong> axons, the proposed algorithm potentially can begeneralized for extracting centerlines <strong>of</strong> other tubular objects in a <strong>3D</strong> volume consisting <strong>of</strong> asequence <strong>of</strong> cross-sectional images.Information Sharing StatementThe sample image stacks and the s<strong>of</strong>tware developed in this paper are available upon request.ACKNOWLEDGEMENTSThe authors would like to thank Mr. H.M. Cai for the help in testing the data sets using theprogram <strong>of</strong> Repulsive Snake Model. They also would like to thank research members <strong>of</strong> the LifeScience Imaging Group <strong>of</strong> the Center for Bioinformatics (CBI), Harvard Center forNeurodegeneration and Repair (HCNR) and Brigham and Women's Hospital, Harvard MedicalSchool, for their technical comments. The research is funded by the HCNR, Harvard MedicalSchool (Wong).35
ReferencesAbram<strong>of</strong>f M.D., Magelhaes, P.J. and Ram S.J. (2004) Image processing with ImageJ.Biophotonics International. 11(7), 36-42.Al-K<strong>of</strong>ahi K.A., Lasek S., Szarowski D.H., Pace C.J., Nagy G., Turner J.N. and Roysam B.(2002) Rapid automated three-dimensional tracing <strong>of</strong> neurons from confocal image stacks. IEEETransactions on Information Technology in Biomedicine. 6(2), 171-187.Barrett W.A. and Mortensen E.N. (1997) Interactive live-wire boundary extraction. MedicalImage Analysis. 1(4), 331-341.Cai H., Xu X., Lu J., Lichtman J.W., Yung S.P. and Wong S.T. (2006) Repulsive force basedsnake model to segment and track neuronal axons in <strong>3D</strong> microscopy image stacks. NeuroImage.32(4), 1608-1620.Can A., Shen H., Turner J.N., Tanenbaum H.L. and Roysam B. (1999) Rapid automated tracingand feature extraction from retinal fundus images using direct exploratory algorithm. IEEETransactions on Information Technology in Biomedicine. 3(2), 125-138.Carmona R.A. and Zhong S.(1998) Adaptive smoothing respecting feature directions. IEEETransactions on Image Processing. 7(3), 353-358.Debeir O., Van Ham P., Kiss R. and Decaestecker C. (2005) <strong>Tracking</strong> <strong>of</strong> migrating cells underphase-contrast video microscopy with combined mean-shift processes. IEEE Trans. Med.Imaging. 24(6), 697-711.Dunn J.C. (1973) A Fuzzy Relative <strong>of</strong> the ISODATA Process and Its Use in Detecting CompactWell-Separated Clusters. Journal <strong>of</strong> Cybernetics. 3, 32-57.36
Fiala J.C. (2005) Reconstruct: a free editor for serial section microscopy. J. Microsc. 218(1), 52-61.Gonzalez R. and Woods R. (1992) Digital image processing. 2 ed., Addison Wesley, 617-626.ndKass M., Witkin A. and Terzopoulos D. (1987) Snakes: Active contour models. InternationalJournal <strong>of</strong> Computer Vision. 1(4), 321-331.Kasthuri, N. and Lichtman J.W. (2003) The role <strong>of</strong> neuronal identity in synaptic competition.Letters to Nature. 424(6947), 426-30.Keller-Peck C.R., Walsh M.K., Gan W.B., Feng G., Sanes J.R., and Lichtman J.W. (2001)Asynchronous synapse elimination in neonatal motor units: studies using GFP transgenic mice.Neuron. 31(3), 381-94.Li F., Zhou X. and Wong S.T.C. (2007) An automated feedback system with the hybrid model <strong>of</strong>scoring and classification for solving over-segmentation problems in RNAi high contentscreening. J. Microsc. Accepted for publication.Meijering E., Jacob M., Sarria J.-C.F., Steiner P., Hirling H. and Unser M. (2004) Design andvalidation <strong>of</strong> a tool for neurite tracing and analysis in fluorescence microscopy images.Cytometry Part A. 58A(2), 167-176.Otsu N. (1979) A threshold selection method from gray-level histograms. IEEE Trans. Sys.,Man., Cyber. 9, 62–66.Streekstra, G.J. and J. van Pelt. (2002) Analysis <strong>of</strong> tubular structures in three-dimensionalconfocal images. Network: Comput. Neural Syst. 13: 381-395.Tschirren J., H<strong>of</strong>fman E.A., McLennan G. and Sonka M. (2005) Intrathoracic airway trees:segmentation and airway morphology analysis from low-dose CT scans. IEEE Trans. Med.37
Imaging. 24(12), 1529- 1539.Wang M., Zhou X., King R.W. and Wong S.T.C. (2007) Context based mixture model for cellphase identification in automated fluorescence microscopy. BMC Bioinformatics. 30, 8-32.Xiong G., Zhou X. and Ji L. (2006) <strong>Automated</strong> segmentation <strong>of</strong> drosophila RNAi fluorescencecellular images using deformable models. IEEE Transactions on Circuits and Systems I. 53(11),2415-2424.Zhang Y., Zhou X., Degterev A., Lipinski M., Adjeroh D., Yuan J. and Wong S.T. (2006) Anovel tracing algorithm for high throughput imaging screening <strong>of</strong> neuron-based assays. J.Neurosci. Methods. Article in press.38