Colorimetric Protein Assays - NanoDrop
Colorimetric Protein Assays - NanoDrop
Colorimetric Protein Assays - NanoDrop
- No tags were found...

You also want an ePaper? Increase the reach of your titles
YUMPU automatically turns print PDFs into web optimized ePapers that Google loves.
<strong>Colorimetric</strong><strong>Protein</strong> <strong>Assays</strong>The information in this publication is provided for reference only. All information contained in this publication is believed to be correct andcomplete. Thermo Fisher Scientific shall not be liable for errors contained herein nor for incidental or consequential damages in connectionwith the furnishing, performance or use of this material. All product specifications, as well as the information contained in this publication, aresubject to change without notice.This publication may contain or reference information and products protected by copyrights or patents and does not convey any license under our patentrights, nor the rights of others. We do not assume any liability arising out of any infringements of patents or other rights of third parties.We make no warranty of any kind with regard to this material, including but not limited to the implied warranties of merchantability and fitness for aparticular purpose. Customers are ultimately responsible for validation of their systems.© 2010 Thermo Fisher Scientific Inc. All rights reserved. All trademarks are the property of Thermo Fisher Scientific Inc. and its subsidiaries.Copyrights in and to the technical support image are owned by a third party and licensed for limited use only to Thermo Fisher Scientific byiStockphoto. No part of this publication may be stored in a retrieval system, transmitted, or reproduced in any way, including but not limited tophotocopy, photograph, magnetic or other record, without our prior written permission.Microsoft, Windows, Windows NT and Excel are either trademarks or registered trademarks of Microsoft Corporation in the United States and/orother countries.Adobe and Acrobat are trademarks of Adobe Systems, Incorporated. All other trademarks are the property of Thermo Fisher Scientific Inc. and itssubsidiaries.<strong>NanoDrop</strong> is a trademark of Thermo Fisher Scientific. Revised 11/2010
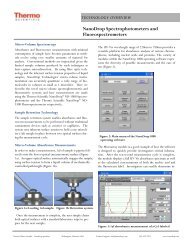
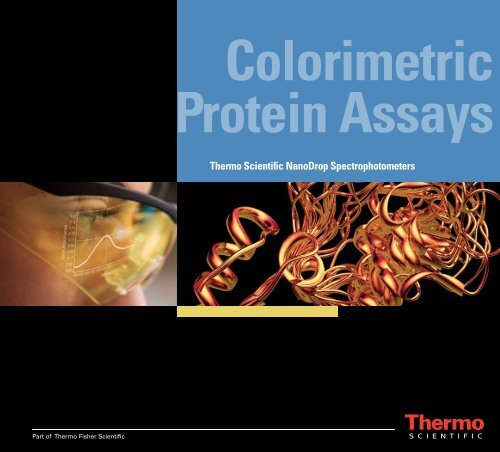
Thermo Scientific <strong>NanoDrop</strong> Spectrophotometers<strong>Colorimetric</strong> <strong>Protein</strong> <strong>Assays</strong>ContentsIntroduction 4Sample Retention Technology 5Best Practices 6Cleaning & Reconditioning 6Instrument & Cuvette Orientation 7Sampling Technique 8<strong>Colorimetric</strong> <strong>Assays</strong> 9Pierce 660 nm <strong>Protein</strong> Assay 10BCA (Bicinchoninic Acid) <strong>Protein</strong> Assay 11Bradford <strong>Protein</strong> Assay 12Modified Lowry <strong>Protein</strong> Assay 13Measurements 14Basic Protocol 14Calculations 16Standard Curves 16Calibration 17Calibration Verification 17Standard vs Control 18Troubleshooting 19Unusual Spectra 19Reproducibility 20Instrument Related Issues 21Installation Errors 22Connection Errors 23Signal Errors 23FAQs 24Technical Support 27
Thermo Scientific <strong>NanoDrop</strong> Spectrophotometers<strong>Colorimetric</strong> <strong>Protein</strong> <strong>Assays</strong>IntroductionThis booklet is meant to provide some basic protein measurement support information for colorimetricmethods relevant to Thermo Scientific <strong>NanoDrop</strong> 2000/2000c, 8000 and 1000 spectrophotometers.Please refer to the model-specific user manual for more detailed instrument and software featurerelatedinformation. Instrument-specific protocols for the four pre-configured methods described inthis guide are available under the Science tab at www.nanodrop.com.<strong>Protein</strong>s, unlike nucleic acids, can exhibit considerable diversity. The <strong>Protein</strong> A280 application isappropriate for purified proteins that contain Trp, Tyr residues or Cys-Cys disulphide bonds andexhibit absorbance at 280 nm.<strong>Colorimetric</strong> assays such as BCA, Pierce 660 nm, Bradford, and Lowry require standard curves andare more commonly used for uncharacterized protein solutions and cell lysates.Separate booklets for nucleic acid and direct A280 protein measurement methods arealso available.For technical support, please contact:Thermo Fisher Scientific | <strong>NanoDrop</strong> Products3411 Silverside Road | Bancroft Building | Wilmington, DE 19810 USAToll-free in US and Canada: 1.877.724.7690Phone: 1.302.479.7707 | Fax: 1.302.792.7155 | e-mail: nanodrop@thermofisher.comwww.nanodrop.comThermo Scientific <strong>NanoDrop</strong> Instrument Serial Numbers:<strong>NanoDrop</strong> 1000: S/N_ ________, S/N_ ________<strong>NanoDrop</strong> 2000: S/N_ ________, S/N_ ________<strong>NanoDrop</strong> 2000c: S/N_ ________, S/N_ ________<strong>NanoDrop</strong> 8000: S/N_ ________, S/N_ ________4
Thermo Scientific <strong>NanoDrop</strong> Spectrophotometers<strong>Colorimetric</strong> <strong>Protein</strong> <strong>Assays</strong>IntroductionSample RetentionTechnologyIntroduction• Pipette 1 – 2 μL sample directly onto the measurement pedestal.• Lower the sampling arm and initiate a spectral measurement using the software on the PC.• Surface tension is used to hold samples in place between two optical fibers.• Light from a xenon flashlamp passes through the top optical fiber, down through the liquidcolumn and is detected by the internal spectrometer.• When the measurement is complete, raise the sampling arm and wipe the sample from boththe upper and lower pedestals using a dry, lint-free laboratory wipe.5
Thermo Scientific <strong>NanoDrop</strong> Spectrophotometers<strong>Colorimetric</strong> <strong>Protein</strong> <strong>Assays</strong>Best PracticesSampling TechniqueVolume RequirementUse adequate sample volume to ensure good column formation.Tip: Always use 2 µL samples when measuring protein samples to ensureproper column formation. Surfactants and other components routinely usedin protein buffers may reduce the surface tension properties of the liquid.Pipettor SelectionUse calibrated pipettor with well-fitting tips.It is best to use a precision pipettor (0 – 2 μL) with low retentionprecision tips to ensure that sufficient sample (2 μL) is delivered foroptimal column formation.Tip: To avoid evaporation errors, it is essential to use an eight-channelpipettor to simultaneouslyload samples when using two or morepedestal positions on the <strong>NanoDrop</strong> 8000.Sample AliquotsAlways use fresh tips and fresh aliquots for every measurement.Tip: Repeated measurements on the same sample aliquot will result inevaporation, yielding increasing concentrations and/or column breakage.Sample HomogeneityHighly concentrated protein samples require careful attention to ensurehomogeneity before sampling.Tip: Non-reproducible results observed when making small volumemeasurements are a good indicator that the sample is not well mixed.Sample PreparationFollow assay reagent manufacturer’s recommendations for optimalsample preparation.8
Thermo Scientific <strong>NanoDrop</strong> Spectrophotometers<strong>Colorimetric</strong> <strong>Protein</strong> <strong>Assays</strong><strong>Colorimetric</strong> <strong>Assays</strong><strong>Colorimetric</strong> assays such as the Pierce 660 nm, BCA, Bradford and Lowry are generally used foruncharacterized protein solutions and cell lysates.<strong>Protein</strong> standards, pre-diluted standards and protein purification products are available fromThermo Fisher Scientific at the following website: www.piercenet.com.The information below is meant to be a useful guide for determining which assay to use. Referto the reagent or kit manufacturer for more information concerning buffer compatibility andassay optimization.Typical ReproducibilityMethod Lower Detection Limit Upper Detection Limit (minimum 5 replicates)(SD = µg/mL; CV = %)Pierce 660 nm 50 µg/mL 2000 µg/mL 50 – 125 µg/mL: ± 3 µg/mL(15:1 reagent/sample volume) >125 μg/mL: ± 2%25 µg/mL 1000 µg/mL 25 – 125 µg/mL: ± 3 μg/mL(7.5:1 reagent/sample volume) >125 µg/mL: ± 2%BCA 200 µg/mL 8000 µg/mL ± 2% (over entire range)(20:1 reagent/sample volume)10 µg/mL 200 µg/mL ± 10 µg/mL (over entire range)(1:1 reagent/sample volume)Bradford 100 μg/mL 8000 µg/mL 100 – 500 µg/mL: ± 25 μg/mL(50:1 reagent/sample volume) 500 – 8000 µg/mL: ± 5%15 μg/mL 100 µg/mL 15 – 50 µg/mL: ± 4 μg/mL(1:1 reagent/sample volume) 50 – 125 µg/mL: ± 5%<strong>Colorimetric</strong> <strong>Assays</strong>Modified Lowry 200 µg/mL 4000 µg/mL ± 2% (over entire range)(5:1 reagent/sample volume)9
Thermo Scientific <strong>NanoDrop</strong> Spectrophotometers<strong>Colorimetric</strong> <strong>Protein</strong> <strong>Assays</strong><strong>Colorimetric</strong> <strong>Assays</strong>Pierce 660 nm <strong>Protein</strong> AssayThis assay is based on a dye-metal complex that binds to proteins in an acidic solution. Uponbinding, the reddish dye-metal complex changes to green, resulting in an absorbance that ismeasured at 660 nm and normalized at 750 nm.Advantages:• Room temperature stability of the assay reagent.• A greater linear range than the Coomassie-based Bradford assays.• Compatibility with commonly used detergents and reducing agents.• Compatibility with samples lysed in Laemmli sample buffer.• Rapid mix-and-read protocol.This assay can quantify peptides that are at least 2,500 daltons if compositions include aminoacid residues that react with the dye-metal reagent (i.e., histidine, arginine, tyrosine, tryptophanand phenylalanine).Data Standard Curve0.50 -0.45 -0.40 -0.35 -0.30 -0.25 -0.20 -0.15 -0.10 -0.05 -0.00 --0.05 -560 580 600 620 640 660 680 700 720 7401mm AbsorbanceWavelength (nm)DataAbsorbanceStandard Curve0.26 -0.24 -0.22 -0.20 -0.18 -0.16 -0.14 -0.12 -0.10 -0.08 -0.06 -0.04 -0.02 -0.00 -0 200 400 600 800 1000 1200 1400 1600 1800 2000µg/mLTypical Pierce 660 nm Sample Spectrum220 230 240 250 260 270 280 290 300 310 320 330 340 350Typical Pierce 660 nm Standard Curve220 230 240 250 260 270 280 290 300 310 320 330 340 350The micro-assay has a linear range of 25 – 1000 μg/mL for BSA using a 7.5:1 reagent to sample ratio.A higher range of 50 – 2000 μg/mL for BSA may be obtained using a 15:1 reagent to sample ratio.The data presented above were generated using a 15:1 reagent/sample volume ratio. When setting upan assay for pedestal measurements, a minimum sample volume of 4 µL into 56 µL of reagent for a totalvolume of 60 µL is recommended.10
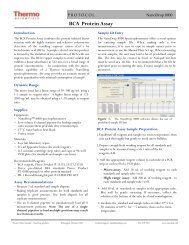
Thermo Scientific <strong>NanoDrop</strong> Spectrophotometers<strong>Colorimetric</strong> <strong>Protein</strong> <strong>Assays</strong><strong>Colorimetric</strong> <strong>Assays</strong>BCA (Bicinchoninic Acid)<strong>Protein</strong> AssayThis assay uses bicinchoninic acid (BCA) as the detection reagent for Cu +1 , which is formed whenCu +2 is reduced by protein in an alkaline environment. A purple-colored reaction productis formed by the chelation of two molecules of BCA with one cuprous ion (Cu +1 ). The resultingCu-BCA chelate formed in the presence of protein is measured at 562 nm and normalized at 750 nm.Advantages:• Exhibits less protein-to-protein variation than dye-binding methods.• Compatible with typical concentrations of most ionic and nonionic detergents.• Much easier and four times faster than the classical Lowry method.Data1mm AbsorbanceStandard Curve0.18 -0.16 -0.14 -0.12 -0.10 -0.08 -0.06 -0.04 -0.02 -0.00 -460 500 540 580 620 660 700 740Wavelength (nm)DataAbsorbanceStandard Curve0.24 -0.22 -0.20 -0.18 -0.16 -0.14 -0.12 -0.10 -0.08 -0.06 -0.04 -0.02 -0.00 -0 0.1 0.2 0.3 0.4 0.5 0.6 0.7 0.8 0.9 1.0 1.1 1.2 1.3 1.4 1.5mg/mLTypical BCA Sample Spectrum220 230 240 250 260 270 280 290 300 310 320 330 340 350Typical BCA Standard Curve220 230 240 250 260 270 280 290 300 310 320 330 340 350The micro-assay has a linear range of 20 – 125 μg/mL for BSA using a 1:1 reagent to sample ratio.A higher range of 125 – 2000 μg/mL for BSA may be obtained using a 20:1 reagent to sample ratio.The data presented above were generated using a 20:1 reagent/sample volume ratio. When setting upan assay for pedestal measurements, a minimum sample volume of 5 µL into 95 µL of reagent for a totalvolume of 100 µL is recommended.11
Thermo Scientific <strong>NanoDrop</strong> Spectrophotometers<strong>Colorimetric</strong> <strong>Protein</strong> <strong>Assays</strong><strong>Colorimetric</strong> <strong>Assays</strong>Bradford <strong>Protein</strong> AssayThis assay uses a protein-induced absorbance shift of Coomassie Blue dye as a measure of proteinconcentration. The bound protein-dye complex is measured at 595 nm and normalized at 750 nm.Advantages:• Single reagent; no working reagent preparation required.• Fast with almost immediate color development; add, mix and read results.Data Standard Curve0.50 -0.45 -0.40 -0.35 -0.30 -0.25 -0.20 -0.15 -0.10 -0.05 -0.00 --0.05 -580 600 620 640 660 680 700 720 7401mm AbsorbanceWavelength (nm)DataAbsorbanceStandard Curve0.17 -0.16 -0.15 -0.14 -0.13 -0.12 -0.11 -0.10 -0.09 -0.08 -0.07 -0.06 -0.05 -0.04 -0 200 400 600 800 1000 1200 1400 1600 1800 2000µg/mLTypical Bradford Sample Spectrum220 230 240 250 260 270 280 290 300 310 320 330 340 350Typical Bradford Standard Curve220 230 240 250 260 270 280 290 300 310 320 330 340 350The micro-assay has a linear range of 15 – 100 μg/mL for BSA using a 1:1 reagent to sample ratio.A higher range of 100 – 8000 μg/mL for BSA may be obtained using a 50:1 reagent to sample ratio.Note: The best linearity is in the 100 – 1000 μg/mL range.The data presented above were generated using a 50:1 reagent/sample volume ratio. When setting upan assay for pedestal measurements, a minimum sample volume of 4 µL in 196 µL of reagent for a totalof 200 µL is recommended.Bradford <strong>Protein</strong> AssayConsiderations• Allowing the reaction to incubate for a longer than suggested time frame increases thepotential for interfering aggregates.• Higher protein concentrations may increase the possibility of dye or dye-protein aggregatescontributing to interfering light scattering.• The use of Bradford assay reagents may result in unconditioned pedestals over time. Usethe <strong>NanoDrop</strong> Pedestal Reconditioning Compound (PR-1) as a rapid means ofreconditioning the pedestals when the hydrophobic surface properties have beencompromised and liquid columns break during measurement.12
Thermo Scientific <strong>NanoDrop</strong> Spectrophotometers<strong>Colorimetric</strong> <strong>Protein</strong> <strong>Assays</strong><strong>Colorimetric</strong> <strong>Assays</strong>Modified Lowry <strong>Protein</strong> AssayThis assay is based on the widely used and cited Lowry procedure for protein quantitation. Theprocedure involves a reaction of protein with cupric sulfate in alkaline solution, resulting information of tetradentate copper-protein complexes that is measured at 650 nm on <strong>NanoDrop</strong>spectrophotometers and normalized at 405 nm.Advantages:• Widely cited in protein research literature.• Modified cupric sulfate-tartrate reagent is stable at room temperature.Data1mm AbsorbanceStandard Curve0.50 -0.45 -0.40 -0.35 -0.30 -0.25 -0.20 -0.15 -0.10 -0.05 -0.00 --0.05 -400 440 480 520 560 600 640 680 720Wavelength (nm)Data Standard Curve0.16 -0.14 -Absorbance0.12 -0.10 -0.08 -0.06 -0.04 -0.02 -0.00 -0 0.2 0.4 0.6 0.8 1.0 1.2 1.4 1.6 1.8 2.0mg/mLTypical Modified Lowry Sample Spectrum220 230 240 250 260 270 280 290 300 310 320 330 340 350Typical Modified Lowry Standard Curve220 230 240 250 260 270 280 290 300 310 320 330 340 350The Modified Lowry has a linear range from ~ 200 μg/mL up to 4000 μg/mL using a 5:1 reagentto sample ratio.The data presented above were generated using a 5:1 reagent/sample volume ratio. When setting up anassay for pedestal measurements, a minimum sample volume of 10 µL into 40 µL of reagent for a totalvolume of 50 µL is recommended.<strong>Colorimetric</strong> <strong>Assays</strong>Considerations• Follow the assay kit manufacturer’s recommendations for all standards and samples (unknowns),ensuring both are subjected to the same timing and temperature throughout the assay.• Assay protocols for colorimetric assays specific for the <strong>NanoDrop</strong> 2000/2000c and the<strong>NanoDrop</strong> 8000 are available under the Science tab at www.nanodrop.com.13
Thermo Scientific <strong>NanoDrop</strong> Spectrophotometers<strong>Colorimetric</strong> <strong>Protein</strong> <strong>Assays</strong>MeasurementsBasic ProtocolRefer to the manufacturer’s guidelines and recommendations for sample preparation.There may be signal output differences due to the change in pH when using diluents such as dH 2Oand a neutral pH PBS buffer. Be sure to use a diluent of the same pH and ionic strength for allblanks, standards and unknown samples.1. A standard curve is required every time an assay is run.Tip: Although the operating software allows for curves to be saved and reloaded, it isrecommended that the user follow the manufacturer’s guidelines and generate a new standardcurve each time the assay is run.2. Follow prompts to initialize the spectrometer.3. After initialization, use a dry, lint-free lab wipe to remove the water from the upper and lowerpedestals. (<strong>NanoDrop</strong> 1000 and <strong>NanoDrop</strong> 8000 only.)4. Enter the values for each standard. The operating software allows for the zero reference andup to 7 additional standards. Fewer standards may be run at the user’s discretion.Tip: The appropriate blank for most colorimetric assays is dH 2O. However, for the Pierce 660 nm<strong>Protein</strong> Assay, the diluent (no protein) plus dye reagent solution is used as both the blank andthe zero reference.5. Apply 2 μL of dH 2O to the lower pedestal, lower the upper arm and select Blank.Tip: A zero reference is the diluent (no protein) plus dye reagent. The minimum requirementfor standard curve generation is the zero reference plus one standard or two standards. The<strong>NanoDrop</strong> software will not extrapolate concentrations beyond the defined standard curve.Tip: If using more than one pedestal position on the <strong>NanoDrop</strong> 8000, it is important to use amulti-channel pipettor to deliver the standard or sample aliquots.14
Thermo Scientific <strong>NanoDrop</strong> Spectrophotometers<strong>Colorimetric</strong> <strong>Protein</strong> <strong>Assays</strong>TroubleshootingConnection ErrorsIf your instrumentoperates properlymost of the time, butconnection errorsappear intermittently,the instrument maynot be receivingpower or recognizingthe USB connection.• Ensure that the USB and power cables are plugged into the backof the instrument, and that the instrument is receiving power.• Many instrument issues can be addressed by a simple power restart.1. Exit the software.2. Disconnect the instrument power cord and USB cable.3. Reconnect the instrument power cord first, then the USB cable.4. Restart the software.If the error persists, contact Technical Support. Outsideof the US and Canada, please contact your local <strong>NanoDrop</strong>products distributor.Signal ErrorsSome errormessages aretriggered whenlittle to no lightreaches the detectorduring initializationor a measurement.• Refer to the cleaning directions under the Best Practicessection on page 6.• Run the Intensity Check diagnostic. Refer to the model-specificuser guide for additional information.23
Thermo Scientific <strong>NanoDrop</strong> Spectrophotometers<strong>Colorimetric</strong> <strong>Protein</strong> <strong>Assays</strong>FAQsQ: How do I calibrate <strong>NanoDrop</strong> spectrophotometers?A: The calibration check procedure allows the user to confirm that the instrument is performingwithin specifications. If the instrument requires recalibration, contact Technical Support.Outside of the US and Canada, please contact your local <strong>NanoDrop</strong> products distributor.Q: Where is the data stored?A: The <strong>NanoDrop</strong> 2000/2000c software allows the user to designate a workbook (.twbk) ata location of the user’s preference for recording measurements. The default data storagelocation is in the My Documentsfolder. The <strong>NanoDrop</strong> 8000 and the <strong>NanoDrop</strong> 1000models automatically archive all measurement data in a folder on the C drive. Refer to themodel-specific user manual for additional details. A PDF of each manual may be found atwww.nanodrop.com.Q: Is the flash lamp continuously on, or is it on only when performing a measurement?A: The lamp is on only during measurements.Q: Are there solvent restrictions?A: Yes. Do not use hydrofluoric acid on the pedestal as it may etch the quartz optical fiber.Most other laboratory solvents typically used in life science labs, including dilute acids,are compatible with the pedestal as long as they are immediately wiped off upon thecompletion of the measurement.Tip: The use of volatile solvents for sample measurement may result in erroneous data due to therapid evaporation of the 1 – 2 µL sample volume.26
Thermo Scientific <strong>NanoDrop</strong> Spectrophotometers<strong>Colorimetric</strong> <strong>Protein</strong> <strong>Assays</strong>Additional Notes:
RNA: 40 ng-cm/µLAbsorbance = -log intensity sampleintensity blankssDNA: 33 ng-cm/µL(emolar)* 10 = (e1%) x (molecular weight of protein)dsDNA: 50 ng-cm/µLA = e* b * c(A / e1%) *10 = concentration in mg/mLc = (A * e)/b0.2 mm pathlengthc = A / e b1 Abs = 1 mg/mL
Thermo Scientific <strong>NanoDrop</strong> Spectrophotometers<strong>Colorimetric</strong> <strong>Protein</strong> <strong>Assays</strong>Thermo Fisher Scientific | <strong>NanoDrop</strong> Products3411 Silverside Road, Bancroft BuildingWilmington, DE 19810 USAwww.nanodrop.com1.877.724.7690 | 1.302.479.7707T106 Rev. 11/2010© 2010 Thermo Fisher Scientific Inc. All rights reserved. All trademarks arethe property of Thermo Fisher Scientific Inc. and its subsidiaries.