Here - Stuff
Here - Stuff Here - Stuff
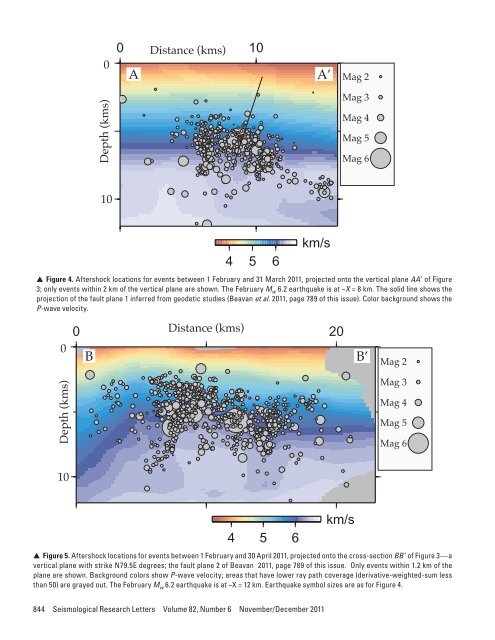
0Depth (kms)0 10Distance (kms)A A’Mag 2Mag 3Mag 4Mag 5Mag 6104 5 6km/s▲▲Figure 4. Aftershock locations for events between 1 February and 31 March 2011, projected onto the vertical plane AA’ of Figure3; only events within 2 km of the vertical plane are shown. The February M w 6.2 earthquake is at ~X = 8 km. The solid line shows theprojection of the fault plane 1 inferred from geodetic studies (Beavan et al. 2011, page 789 of this issue). Color background shows theP-wave velocity.0Distance (kms)0 10 20B B’Mag 2Depth (kms)Mag 3Mag 4Mag 5Mag 6104 5 6km/s▲ ▲ Figure 5. Aftershock locations for events between 1 February and 30 April 2011, projected onto the cross-section BB ’ of Figure 3—avertical plane with strike N79.5E degrees; the fault plane 2 of Beavan 2011, page 789 of this issue. Only events within 1.2 km of theplane are shown. Background colors show P-wave velocity; areas that have lower ray path coverage (derivative-weighted-sum lessthan 50) are grayed out. The February M w 6.2 earthquake is at ~X = 12 km. Earthquake symbol sizes are as for Figure 4.844 Seismological Research Letters Volume 82, Number 6 November/December 2011
REFERENCESAvery, H. R., J. B. Berrill, P. F. Coursey, B. L. Deam, M. B. Dewe, C. C.Francois, J. R. Pettinga, and M. D. Yetton (2004). The CanterburyUniversity strong-motion recording project. 13 th World Conferenceon Earthquake Engineering, Vancouver, B.C., Canada, 1–6 August,2004, paper 1335.[are these published proceedings? can we providename of publisher & place where published?]Barnes, P. M. (1995). High-frequency sequences deposited duringQuaternary sea-level cycles on a deforming continental shelf, northCanterbury, New Zealand. Sedimentary Geology 97, 131–156.Barnes, P. M. (1996). Active folding of Pleistocene unconformities on theedge of the Australian-Pacific plate boundary zone, offshore northCanterbury, New Zealand. Tectonics 15 (2), 623–640. Correctionto Figure 6 printed in Tectonics 15 (5), 1,110–1,111 [1996].Barnes, P., C. Castellazzi, A. Gorman and S. Wilcox (2011). SubmarineFaulting beneath Pegasus Bay, Offshore Christchurch. Short-termCanterbury Earthquake Recovery Project 2: Offshore Faults.National Institute of Water & Atmospheric Research Client reportWLG2011-28, Wellington, NZ: National Institute of Water andAtmospheric Research.Beavan, J., E. Fielding, M. Motagh, S. Samsonov, and N. Donnelly(2011). Fault location and slip distribution of the 22 February 2011M W 6.2 Christchurch, New Zealand, earthquake from geodeticdata. Seismological Research Letters 82, 789–799.Beavan, J., S. Samsonov, M. Motagh, L. Wallace, S. Ellis and N. Palmer(2010). The M w 7.1 Darfield (Canterbury) earthquake: Geodeticobservations and preliminary source model. Bulletin of the NewZealand Society for Earthquake Engineering 43, 228–235.Beyreuther, M., R. Barsch, L. Krischer, T. Megies, Y. Behr, and J.Wassermann (2010). ObsPy: A python toolbox for seismology.Seismological Research Letters 81 (3), 530–533.Dorn, C., A. G. Green, R. Jongens, S. Carpentier, A. E. Kaiser, F.Campbell, H. Horstmeyer, J. Campbell, M. Finnemore, and J.Pettinga (2010). High-resolution seismic images of potentially seismogenicstructures beneath the northwest Canterbury Plains, NewZealand. Journal of Geophysical Research, Solid Earth 115, B11303;doi:10.1029/2010JB007459.Du, W., C. H. Thurber, and D. Eberhart-Phillips (2004). Earthquakerelocation using cross-correlation time delay estimates verifiedwith the bispectrum method. Bulletin of the Seismological Society ofAmerica 94, 856–866.Eberhart-Phillips, D., M. Reyners, S. Bannister, M. Chadwick, and S.Ellis (2010). Establishing a versatile 3-D seismic velocity model forNew Zealand. Seismological Research Letters 81 (6), 992–1,000;doi:10.1785/gssrl.82.6.992.Fry, B., R. Benites, M. Reyners, C. Holden, A. Kaiser, S. Bannister, M.Gerstenberger, C. Williams, J. Ristau, and J. Beavan (2011). Verystrong shaking in New Zealand earthquakes. Eos, Transactions,American Geophysical Union.Fry, B., and M. Gerstenberger (2011). Large apparent stresses from theCanterbury earthquakes of 2010 and 2011. Seismological ResearchLetters 82, 833–838.Gledhill, K., J. Ristau, M. Reyners, B. Fry, and C. Holden (2011).The Darfield (Canterbury, New Zealand) Mw 7.1 earthquake ofSeptember 2010: A preliminary seismological report. SeismologicalResearch Letters 82, 378–386.Holden, C. (2011). Kinematic source model of the 22 February 2011M w 6.2 Christchurch earthquake using strong motion data.Seismological Research Letters 82, 783–788.Howard, M., A. Nicol, J. Campbell, and J. R. Pettinga (2005). Holocenepaleoearthquakes on the strike-slip Porters Pass Fault, Canterbury,New Zealand. New Zealand Journal of Geology and Geophysics 48(1), 59–74.Paige, C., and M. Saunders (1982). LSQR: An algorithm for sparse linearequations and sparse least squares problems. ACM Transactions onMathematical Software 8, 43–71.Petersen, T., K. Gledhill, M. Chadwick, N. Gale, and J. Ristau (2011).The New Zealand National Seismograph Network. SeismologicalResearch Letters 82, 9–20.Pettinga, J. R., M. D. Yetton, R. J. Van Dissen, and G. Downes (2001).Earthquake source identification and characterisation for theCanterbury region, South Island, New Zealand. Bulletin of the NewZealand Society for Earthquake Engineering 34, 282–317.Quigley, M., R. Van Dissen, P. Villamor, N. Litchfield, D. Barrell, K.Furlong, T. Stahl, et al. (2010). Surface rupture of the Greendalefault during the M w 7.1 Darfield (Canterbury) earthquake, NewZealand: Initial findings. Bulletin of the New Zealand Society forEarthquake Engineering 43, 236–242.Reyners, M. E., and H. Cowan (1993). The transition from subductionto continental collision: Crustal structure in the North Canterburyregion, New Zealand. Geophysical Journal International 115 (3),1,124–1,136.Sibson, R., F. Ghisetti, and J. Ristau (2011). Stress control of an evolvingstrike-slip fault system during the 2010–2011 Canterbury, NewZealand, earthquake sequence. Seismological Research Letters 82,824–832.Van Avendonk, H. J. A., W. S. Holbrook, D. Okaya, J. Austin, F. Davey,and T. Stern (2004). Continental crust under compression: A seismicrefraction study of SIGHT Transect 1, South Island, New Zealand.Journal of Geophysical Research 109; doi:10.1029/2003JB002790.Wessel, P., and W. H. F. Smith (1998). New, improved version of theGeneric Mapping Tools released. Eos, Transactions, AmericanGeophysical Union 79, 59.Wood, R. A., P. B. Andrews, and R. H. Herzer, R. A. Cook, N. de B.Hornibrook, R. H. Hoskins, A. G. Beu, et al. (1989). Cretaceousand Cenozoic Geology of the Chatham Rise Region, South Island,New Zealand. New Zealand Geological Survey Basin Studies 3,75 pp. Lower Hutt, New Zealand: New Zealand Geological Survey.Zhang, H., and C. H. Thurber (2003). Double-difference tomography:The method and its application to the Hayward fault, California.Bulletin of the Seismological Society of America 93, 1,875–1,889.Zhang, H., C. Thurber, and P. Bedrosian (2009). Joint inversion forVp, Vs, and Vp/Vs at SAFOD, Parkfield, California. Geochemistry,Geophysics, Geosystems 10 (1), Q11002.GNS Science1 Fairway Drive, AvalonLower Hutt 5040 New Zealands.bannister@gns.cri.nz(S. B.)Seismological Research Letters Volume 82, Number 6 November/December 2011 845
- Page 40 and 41: TABLE 2Solutions for fault location
- Page 42 and 43: -43.45(A)degrees N-43.50-43.552.52.
- Page 44 and 45: is still a good fit to the horizont
- Page 46 and 47: Coulomb Stress Change Sensitivity d
- Page 48 and 49: mation takes on a larger strike-sli
- Page 50 and 51: P 9.4267BLDU45P 20.1213CASY39P 2.62
- Page 52 and 53: ERMJNUMAJOINUJHJ2CBIJMIDWJOWYHNBTPU
- Page 54 and 55: (A)6.146.13(B)6.246.36Misfit6.156.1
- Page 56 and 57: (A)(B)(C)(D)▲▲Figure 10. The co
- Page 58 and 59: (A)(B)(C)(D)▲▲Figure 12. The co
- Page 60 and 61: Luo, Y., Y. Tan, S. Wei, D. Helmber
- Page 62 and 63: −44˚00' −43˚00'4-Sep-2010Mw 7
- Page 64 and 65: TABLE 1Pairs of SAR imagery used in
- Page 67 and 68: Depth (km)Coulomb Stress Change(bar
- Page 69 and 70: Crippen, R. E. (1992). Measurement
- Page 71 and 72: AlpineFaultHope Fault38 mm/yr0+ +-1
- Page 73 and 74: σ 1dσ 3Nuσ 3CM w 7.1dw 6.2u70°M
- Page 75 and 76: Right-lateral Faults(A) Range Front
- Page 77 and 78: DISCUSSIONThe 2010-2011 Canterbury
- Page 79 and 80: Large Apparent Stresses from the Ca
- Page 81 and 82: ▲ ▲ Figure 2. Observed vs. pred
- Page 83 and 84: 10Obs SA(1s)AS1AS+SDAB 2006AB+SDSA(
- Page 85 and 86: Fine-scale Relocation of Aftershock
- Page 87 and 88: −43.25°OXZ0 10 20km−43.5°−4
- Page 89: A’0 km 4 8−43.5°B’B−43.6°
- Page 93 and 94: ▲ ▲ Figure 2. A) shows three-co
- Page 95 and 96: ▲ ▲ Figure 4. Vertical accelera
- Page 97 and 98: 0.8PRPC Z0.40Normalized (Max PGA +
- Page 99 and 100: Near-source Strong Ground MotionsOb
- Page 101 and 102: (A)Magnitude, M w876542009 NZdataba
- Page 103 and 104: Scale0.5 g5 seconds▲▲Figure 4.
- Page 105 and 106: (A)(B)Spectral Acc, Sa (g)North/Wes
- Page 107 and 108: Vertical-to-horizontal PGA ratio543
- Page 109 and 110: (A)(B)Station:CCCCSolid:AvgHorizDas
- Page 111 and 112: REFERENCESAagaard, B. T., J. F. Hal
- Page 113 and 114: ▲ ▲ Figure 1. Shear-wave veloci
- Page 115 and 116: Spectral Acceleration (0.3 s), (g)I
- Page 117 and 118: Spectral Acceleration (3 s), (g)In[
- Page 119 and 120: TABLE 1Mean (μ LLH ) and standard
- Page 121 and 122: Strong Ground Motions and Damage Co
- Page 123 and 124: ings and the Modified Takeda-Slip M
- Page 125 and 126: high, but there were no buildings d
- Page 127 and 128: REFERENCES▲▲Figure 8. Heavily d
- Page 129 and 130: (A)(B)(C)(D)(E)▲▲Figure 1. A) M
- Page 131 and 132: (A) (B) (C)▲ ▲ Figure 3. A) Typ
- Page 133 and 134: (A) (B) (C)▲ ▲ Figure 4. A) Typ
- Page 135 and 136: Case StudyKey ParametersTABLE 1Key
- Page 137 and 138: ▲ ▲ Figure 9. Representative bu
- Page 139 and 140: Soil Liquefaction Effects in the Ce
0Depth (kms)0 10Distance (kms)A A’Mag 2Mag 3Mag 4Mag 5Mag 6104 5 6km/s▲▲Figure 4. Aftershock locations for events between 1 February and 31 March 2011, projected onto the vertical plane AA’ of Figure3; only events within 2 km of the vertical plane are shown. The February M w 6.2 earthquake is at ~X = 8 km. The solid line shows theprojection of the fault plane 1 inferred from geodetic studies (Beavan et al. 2011, page 789 of this issue). Color background shows theP-wave velocity.0Distance (kms)0 10 20B B’Mag 2Depth (kms)Mag 3Mag 4Mag 5Mag 6104 5 6km/s▲ ▲ Figure 5. Aftershock locations for events between 1 February and 30 April 2011, projected onto the cross-section BB ’ of Figure 3—avertical plane with strike N79.5E degrees; the fault plane 2 of Beavan 2011, page 789 of this issue. Only events within 1.2 km of theplane are shown. Background colors show P-wave velocity; areas that have lower ray path coverage (derivative-weighted-sum lessthan 50) are grayed out. The February M w 6.2 earthquake is at ~X = 12 km. Earthquake symbol sizes are as for Figure 4.844 Seismological Research Letters Volume 82, Number 6 November/December 2011


