Here - Stuff
Here - Stuff Here - Stuff
(A)−43.25°0 10 20 kmM7.1−43.5°Mag 2Mag 3Mag 4Mag 5−43.75°172° 172.5° 173°(B)−43.25°Christchurch city−43.5°Canterbury Plains−43.75°Banks peninsula172° 172.5° 173°▲ ▲ Figure 1. A) Seismicity in the time period 3 September 2010 through April 30, 2011. The M w 7.1 Darfield and M w 6.2 FebruaryChristchurch earthquakes are marked as stars. Earthquakes occurring after February 21 are filled in black, earlier events are gray. B)Seismicity in the preceding 10 years, from 1 January 2000 to 1 September 2010, as cataloged by GeoNet, illustrating the low level ofseismicity before the 2010 Darfield earthquake.840 Seismological Research Letters Volume 82, Number 6 November/December 2011
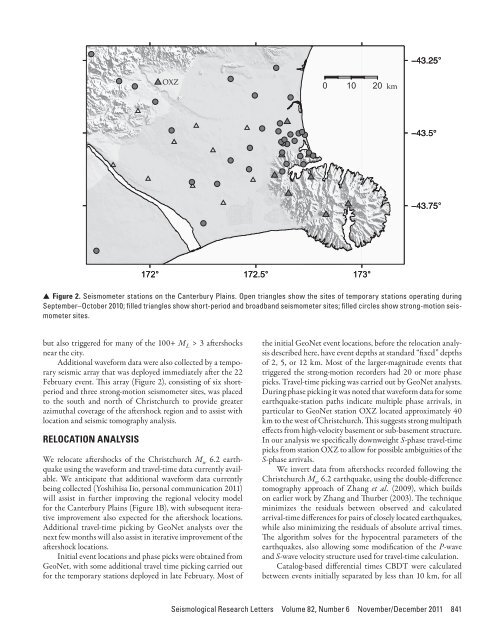
−43.25°OXZ0 10 20km−43.5°−43.75°172° 172.5° 173°▲ ▲ Figure 2. Seismometer stations on the Canterbury Plains. Open triangles show the sites of temporary stations operating duringSeptember–October 2010; filled triangles show short-period and broadband seismometer sites; filled circles show strong-motion seismometersites.but also triggered for many of the 100+ M L > 3 aftershocksnear the city.Additional waveform data were also collected by a temporaryseismic array that was deployed immediately after the 22February event. This array (Figure 2), consisting of six shortperiodand three strong-motion seismometer sites, was placedto the south and north of Christchurch to provide greaterazimuthal coverage of the aftershock region and to assist withlocation and seismic tomography analysis.RELOCATION ANALYSISWe relocate aftershocks of the Christchurch M w 6.2 earthquakeusing the waveform and travel-time data currently available.We anticipate that additional waveform data currentlybeing collected (Yoshihisa Iio, personal communication 2011)will assist in further improving the regional velocity modelfor the Canterbury Plains (Figure 1B), with subsequent iterativeimprovement also expected for the aftershock locations.Additional travel-time picking by GeoNet analysts over thenext few months will also assist in iterative improvement of theaftershock locations.Initial event locations and phase picks were obtained fromGeoNet, with some additional travel time picking carried outfor the temporary stations deployed in late February. Most ofthe initial GeoNet event locations, before the relocation analysisdescribed here, have event depths at standard “fixed” depthsof 2, 5, or 12 km. Most of the larger-magnitude events thattriggered the strong-motion recorders had 20 or more phasepicks. Travel-time picking was carried out by GeoNet analysts.During phase picking it was noted that waveform data for someearthquake-station paths indicate multiple phase arrivals, inparticular to GeoNet station OXZ located approximately 40km to the west of Christchurch. This suggests strong multipatheffects from high-velocity basement or sub-basement structure.In our analysis we specifically downweight S-phase travel-timepicks from station OXZ to allow for possible ambiguities of theS-phase arrivals.We invert data from aftershocks recorded following theChristchurch M w 6.2 earthquake, using the double-differencetomography approach of Zhang et al. (2009), which buildson earlier work by Zhang and Thurber (2003). The techniqueminimizes the residuals between observed and calculatedarrival-time differences for pairs of closely located earthquakes,while also minimizing the residuals of absolute arrival times.The algorithm solves for the hypocentral parameters of theearthquakes, also allowing some modification of the P-waveand S-wave velocity structure used for travel-time calculation.Catalog-based differential times CBDT were calculatedbetween events initially separated by less than 10 km, for allSeismological Research Letters Volume 82, Number 6 November/December 2011 841
- Page 36 and 37: -42. 5-43. 0-43. 5-44. 0-44. 5-43.2
- Page 38 and 39: “Product CSK © ASI, (ItalianSpac
- Page 40 and 41: TABLE 2Solutions for fault location
- Page 42 and 43: -43.45(A)degrees N-43.50-43.552.52.
- Page 44 and 45: is still a good fit to the horizont
- Page 46 and 47: Coulomb Stress Change Sensitivity d
- Page 48 and 49: mation takes on a larger strike-sli
- Page 50 and 51: P 9.4267BLDU45P 20.1213CASY39P 2.62
- Page 52 and 53: ERMJNUMAJOINUJHJ2CBIJMIDWJOWYHNBTPU
- Page 54 and 55: (A)6.146.13(B)6.246.36Misfit6.156.1
- Page 56 and 57: (A)(B)(C)(D)▲▲Figure 10. The co
- Page 58 and 59: (A)(B)(C)(D)▲▲Figure 12. The co
- Page 60 and 61: Luo, Y., Y. Tan, S. Wei, D. Helmber
- Page 62 and 63: −44˚00' −43˚00'4-Sep-2010Mw 7
- Page 64 and 65: TABLE 1Pairs of SAR imagery used in
- Page 67 and 68: Depth (km)Coulomb Stress Change(bar
- Page 69 and 70: Crippen, R. E. (1992). Measurement
- Page 71 and 72: AlpineFaultHope Fault38 mm/yr0+ +-1
- Page 73 and 74: σ 1dσ 3Nuσ 3CM w 7.1dw 6.2u70°M
- Page 75 and 76: Right-lateral Faults(A) Range Front
- Page 77 and 78: DISCUSSIONThe 2010-2011 Canterbury
- Page 79 and 80: Large Apparent Stresses from the Ca
- Page 81 and 82: ▲ ▲ Figure 2. Observed vs. pred
- Page 83 and 84: 10Obs SA(1s)AS1AS+SDAB 2006AB+SDSA(
- Page 85: Fine-scale Relocation of Aftershock
- Page 89 and 90: A’0 km 4 8−43.5°B’B−43.6°
- Page 91 and 92: REFERENCESAvery, H. R., J. B. Berri
- Page 93 and 94: ▲ ▲ Figure 2. A) shows three-co
- Page 95 and 96: ▲ ▲ Figure 4. Vertical accelera
- Page 97 and 98: 0.8PRPC Z0.40Normalized (Max PGA +
- Page 99 and 100: Near-source Strong Ground MotionsOb
- Page 101 and 102: (A)Magnitude, M w876542009 NZdataba
- Page 103 and 104: Scale0.5 g5 seconds▲▲Figure 4.
- Page 105 and 106: (A)(B)Spectral Acc, Sa (g)North/Wes
- Page 107 and 108: Vertical-to-horizontal PGA ratio543
- Page 109 and 110: (A)(B)Station:CCCCSolid:AvgHorizDas
- Page 111 and 112: REFERENCESAagaard, B. T., J. F. Hal
- Page 113 and 114: ▲ ▲ Figure 1. Shear-wave veloci
- Page 115 and 116: Spectral Acceleration (0.3 s), (g)I
- Page 117 and 118: Spectral Acceleration (3 s), (g)In[
- Page 119 and 120: TABLE 1Mean (μ LLH ) and standard
- Page 121 and 122: Strong Ground Motions and Damage Co
- Page 123 and 124: ings and the Modified Takeda-Slip M
- Page 125 and 126: high, but there were no buildings d
- Page 127 and 128: REFERENCES▲▲Figure 8. Heavily d
- Page 129 and 130: (A)(B)(C)(D)(E)▲▲Figure 1. A) M
- Page 131 and 132: (A) (B) (C)▲ ▲ Figure 3. A) Typ
- Page 133 and 134: (A) (B) (C)▲ ▲ Figure 4. A) Typ
- Page 135 and 136: Case StudyKey ParametersTABLE 1Key
−43.25°OXZ0 10 20km−43.5°−43.75°172° 172.5° 173°▲ ▲ Figure 2. Seismometer stations on the Canterbury Plains. Open triangles show the sites of temporary stations operating duringSeptember–October 2010; filled triangles show short-period and broadband seismometer sites; filled circles show strong-motion seismometersites.but also triggered for many of the 100+ M L > 3 aftershocksnear the city.Additional waveform data were also collected by a temporaryseismic array that was deployed immediately after the 22February event. This array (Figure 2), consisting of six shortperiodand three strong-motion seismometer sites, was placedto the south and north of Christchurch to provide greaterazimuthal coverage of the aftershock region and to assist withlocation and seismic tomography analysis.RELOCATION ANALYSISWe relocate aftershocks of the Christchurch M w 6.2 earthquakeusing the waveform and travel-time data currently available.We anticipate that additional waveform data currentlybeing collected (Yoshihisa Iio, personal communication 2011)will assist in further improving the regional velocity modelfor the Canterbury Plains (Figure 1B), with subsequent iterativeimprovement also expected for the aftershock locations.Additional travel-time picking by GeoNet analysts over thenext few months will also assist in iterative improvement of theaftershock locations.Initial event locations and phase picks were obtained fromGeoNet, with some additional travel time picking carried outfor the temporary stations deployed in late February. Most ofthe initial GeoNet event locations, before the relocation analysisdescribed here, have event depths at standard “fixed” depthsof 2, 5, or 12 km. Most of the larger-magnitude events thattriggered the strong-motion recorders had 20 or more phasepicks. Travel-time picking was carried out by GeoNet analysts.During phase picking it was noted that waveform data for someearthquake-station paths indicate multiple phase arrivals, inparticular to GeoNet station OXZ located approximately 40km to the west of Christchurch. This suggests strong multipatheffects from high-velocity basement or sub-basement structure.In our analysis we specifically downweight S-phase travel-timepicks from station OXZ to allow for possible ambiguities of theS-phase arrivals.We invert data from aftershocks recorded following theChristchurch M w 6.2 earthquake, using the double-differencetomography approach of Zhang et al. (2009), which buildson earlier work by Zhang and Thurber (2003). The techniqueminimizes the residuals between observed and calculatedarrival-time differences for pairs of closely located earthquakes,while also minimizing the residuals of absolute arrival times.The algorithm solves for the hypocentral parameters of theearthquakes, also allowing some modification of the P-waveand S-wave velocity structure used for travel-time calculation.Catalog-based differential times CBDT were calculatedbetween events initially separated by less than 10 km, for allSeismological Research Letters Volume 82, Number 6 November/December 2011 841


