Here - Stuff
Here - Stuff Here - Stuff
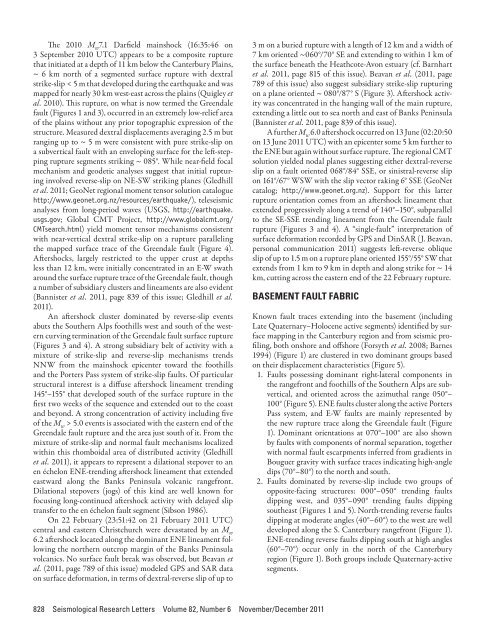
The 2010 M w 7.1 Darfield mainshock (16:35:46 on3 September 2010 UTC) appears to be a composite rupturethat initiated at a depth of 11 km below the Canterbury Plains,~ 6 km north of a segmented surface rupture with dextralstrike-slip < 5 m that developed during the earthquake and wasmapped for nearly 30 km west-east across the plains (Quigley etal. 2010). This rupture, on what is now termed the Greendalefault (Figures 1 and 3), occurred in an extremely low-relief areaof the plains without any prior topographic expression of thestructure. Measured dextral displacements averaging 2.5 m butranging up to ~ 5 m were consistent with pure strike-slip ona subvertical fault with an enveloping surface for the left-steppingrupture segments striking ~ 085°. While near-field focalmechanism and geodetic analyses suggest that initial rupturinginvolved reverse-slip on NE-SW striking planes (Gledhillet al. 2011; GeoNet regional moment tensor solution cataloguehttp://www.geonet.org.nz/resources/earthquake/), teleseismicanalyses from long-period waves (USGS, http://earthquake.usgs.gov; Global CMT Project, http://www.globalcmt.org/CMTsearch.html) yield moment tensor mechanisms consistentwith near-vertical dextral strike-slip on a rupture parallelingthe mapped surface trace of the Greendale fault (Figure 4).Aftershocks, largely restricted to the upper crust at depthsless than 12 km, were initially concentrated in an E-W swatharound the surface rupture trace of the Greendale fault, thougha number of subsidiary clusters and lineaments are also evident(Bannister et al. 2011, page 839 of this issue; Gledhill et al.2011).An aftershock cluster dominated by reverse-slip eventsabuts the Southern Alps foothills west and south of the westerncurving termination of the Greendale fault surface rupture(Figures 3 and 4). A strong subsidiary belt of activity with amixture of strike-slip and reverse-slip mechanisms trendsNNW from the mainshock epicenter toward the foothillsand the Porters Pass system of strike-slip faults. Of particularstructural interest is a diffuse aftershock lineament trending145°–155° that developed south of the surface rupture in thefirst two weeks of the sequence and extended out to the coastand beyond. A strong concentration of activity including fiveof the M w > 5.0 events is associated with the eastern end of theGreendale fault rupture and the area just south of it. From themixture of strike-slip and normal fault mechanisms localizedwithin this rhomboidal area of distributed activity (Gledhillet al. 2011), it appears to represent a dilational stepover to anen échelon ENE-trending aftershock lineament that extendedeastward along the Banks Peninsula volcanic rangefront.Dilational stepovers (jogs) of this kind are well known forfocusing long-continued aftershock activity with delayed sliptransfer to the en échelon fault segment (Sibson 1986).On 22 February (23:51:42 on 21 February 2011 UTC)central and eastern Christchurch were devastated by an M w6.2 aftershock located along the dominant ENE lineament followingthe northern outcrop margin of the Banks Peninsulavolcanics. No surface fault break was observed, but Beavan etal. (2011, page 789 of this issue) modeled GPS and SAR dataon surface deformation, in terms of dextral-reverse slip of up to3 m on a buried rupture with a length of 12 km and a width of7 km oriented ~060°/70° SE and extending to within 1 km ofthe surface beneath the Heathcote-Avon estuary (cf. Barnhartet al. 2011, page 815 of this issue). Beavan et al. (2011, page789 of this issue) also suggest subsidiary strike-slip rupturingon a plane oriented ~ 080°/87° S (Figure 3). Aftershock activitywas concentrated in the hanging wall of the main rupture,extending a little out to sea north and east of Banks Peninsula(Bannister et al. 2011, page 839 of this issue).A further M w 6.0 aftershock occurred on 13 June (02:20:50on 13 June 2011 UTC) with an epicenter some 5 km further tothe ENE but again without surface rupture. The regional CMTsolution yielded nodal planes suggesting either dextral-reverseslip on a fault oriented 068°/84° SSE, or sinistral-reverse slipon 161°/67° WSW with the slip vector raking 6° SSE (GeoNetcatalog; http://www.geonet.org.nz). Support for this latterrupture orientation comes from an aftershock lineament thatextended progressively along a trend of 140°–150°, subparallelto the SE-SSE trending lineament from the Greendale faultrupture (Figures 3 and 4). A “single-fault” interpretation ofsurface deformation recorded by GPS and DinSAR (J. Beavan,personal communication 2011) suggests left-reverse obliqueslip of up to 1.5 m on a rupture plane oriented 155°/55° SW thatextends from 1 km to 9 km in depth and along strike for ~ 14km, cutting across the eastern end of the 22 February rupture.BASEMENT FAULT FABRICKnown fault traces extending into the basement (includingLate Quaternary–Holocene active segments) identified by surfacemapping in the Canterbury region and from seismic profiling,both onshore and offshore (Forsyth et al. 2008; Barnes1994) (Figure 1) are clustered in two dominant groups basedon their displacement characteristics (Figure 5).1. Faults possessing dominant right-lateral components inthe rangefront and foothills of the Southern Alps are subvertical,and oriented across the azimuthal range 050°–100° (Figure 5). ENE faults cluster along the active PortersPass system, and E-W faults are mainly represented bythe new rupture trace along the Greendale fault (Figure1). Dominant orientations at 070°–100° are also shownby faults with components of normal separation, togetherwith normal fault escarpments inferred from gradients inBouguer gravity with surface traces indicating high-angledips (70°–80°) to the north and south.2. Faults dominated by reverse-slip include two groups ofopposite-facing structures: 000°–050° trending faultsdipping west, and 035°–090° trending faults dippingsoutheast (Figures 1 and 5). North-trending reverse faultsdipping at moderate angles (40°–60°) to the west are welldeveloped along the S. Canterbury rangefront (Figure 1).ENE-trending reverse faults dipping south at high angles(60°–70°) occur only in the north of the Canterburyregion (Figure 1). Both groups include Quaternary-activesegments.828 Seismological Research Letters Volume 82, Number 6 November/December 2011
Right-lateral Faults(A) Range Front and FoothillsNW23%10%5%5%10%15%20%14%Reverse FaultsEBouguer gravity anomalies (Hicks 1989; Bennett et al. 2000)together with information from exploration wells and seismiclines. These data have been used to contour the top of basementbelow the cover sequence (Figure 1). Two major depocenters(Pegasus-Rangiora basin to the north and Rakaia-Hinds basinto the south) are identified elongated in an easterly orientationand separated by an intervening structural high coincidentwith Banks Peninsula, where uplifted basement graywackesare exposed beneath the Miocene volcanics. Exploration wellshave penetrated late syn-rift sequences infilling these basins.Discontinuous E-W fault traces mapped in the Quaternarygravels of the Canterbury Plains along the Ashley, Rakaia, andHinds fault systems (Figure 1) are thus interpreted as surfacetraces of buried basement faults belonging to the structuraldomain of the Chatham Rise.STRUCTURAL ANALYSISW24%S(B) Canterbury Plains, Banks Peninsula andAdjacent Offshore40%30%20%10%NSOffshore, the northwestern edge of the Chatham Rise preservesa strong extensional fabric defined by closely spacedE-W striking, S-dipping normal faults that bound half-grabensinfilled with up to 2 km of inferred Late Cretaceous syn-riftsediments (Barnes 1994). Projection of these structures westwardbelow the Canterbury Plains is conjectural but is based on5%10%15%20%▲▲Figure 5. Rose diagrams of fault strike azimuths within theCanterbury region covered by Figure 1, weighted for mappedlength: A) Area of the Southern Alps rangefront and foothillswhere Torlesse basement is exposed; B) Area of the CanterburyPlains, Banks Peninsula, and offshore where basement is largelyconcealed. Top half of each plot is for faults where reverse-slipis dominant; bottom half is for faults with predominantly rightlateraland/or normal slip.Right-lateraland Normal Faults Reverse Faults42%EObserved slip senses on the three major ruptures within theearthquake sequence are consistent with the inferred pattern ofσ 1 stress trajectories (Figure 3). However, some stress heterogeneityis evident, especially near rupture terminations and faultintersections (Figure 4). In Anderson’s (1905, 1951) applicationof the Coulomb criterion for brittle shear failure to the initiationof faults within intact isotropic crust, strike-slip faultsforming in a wrench stress regime (σ v = σ 2 ) should be verticaland lie at ± ~30° to the σ 1 orientation. In contrast, large-displacementstrike-slip faults commonly lie at far higher angles(often >45°) to regional σ 1 trajectories and are distinctly “non-Andersonian” (Mount and Suppe 1987; Balfour et al. 2005).It follows that vertical, low-displacement strike-slip faults atAndersonian orientations are possibly newly formed structuresin the contemporary stress field, but they could also be inheritedfaults that happen to be optimally oriented for frictionalreactivation. Following the same argument, oblique-slip rupturesmost likely result from the reactivation of inherited faultsin the prevailing stress field.The principal ruptures of the Canterbury earthquakesequence can be viewed with these considerations in mind(Figure 3). First, the subvertical Greendale fault rupture lyingat 25°–35° to regional σ 1 is at optimal Andersonian orientation,implying that it is either a comparatively newly formed strikeslipfault or an inherited structure that is optimally orientedfor reactivation in the present stress field. It should be borne inmind that most of the inherited dip-slip faults within the basementare likely to have dips that are substantially less than vertical,though the Greendale rupture could occupy an amalgamof opposite-dipping structures. Note further, however, that atits western termination, the Greendale rupture trace curvesinto parallelism with the σ 1 stress trajectories (Figure 3), a propagationcharacteristic of low-displacement shear fractures andconsistent with the local existence of CMT mechanisms withcomponents of normal slip. Moreover, total strike-slip displacementon the Greendale fault appears not to be large becauseit has not been recognized to continue along strike into thebedrock geology of the Southern Alps foothills. In fact, at itsFigure 5Seismological Research Letters Volume 82, Number 6 November/December 2011 829
- Page 24 and 25: ▲ ▲ Figure 10. Spatial variabil
- Page 26 and 27: ▲ ▲ Figure 12. Standard spectra
- Page 28 and 29: Quigley, M., R. Van Dissen, P. Vill
- Page 30 and 31: slip on a 59-degree striking fault
- Page 32 and 33: ▲▲Figure 4. Convergence of inve
- Page 34 and 35: observations and other source studi
- Page 36 and 37: -42. 5-43. 0-43. 5-44. 0-44. 5-43.2
- Page 38 and 39: “Product CSK © ASI, (ItalianSpac
- Page 40 and 41: TABLE 2Solutions for fault location
- Page 42 and 43: -43.45(A)degrees N-43.50-43.552.52.
- Page 44 and 45: is still a good fit to the horizont
- Page 46 and 47: Coulomb Stress Change Sensitivity d
- Page 48 and 49: mation takes on a larger strike-sli
- Page 50 and 51: P 9.4267BLDU45P 20.1213CASY39P 2.62
- Page 52 and 53: ERMJNUMAJOINUJHJ2CBIJMIDWJOWYHNBTPU
- Page 54 and 55: (A)6.146.13(B)6.246.36Misfit6.156.1
- Page 56 and 57: (A)(B)(C)(D)▲▲Figure 10. The co
- Page 58 and 59: (A)(B)(C)(D)▲▲Figure 12. The co
- Page 60 and 61: Luo, Y., Y. Tan, S. Wei, D. Helmber
- Page 62 and 63: −44˚00' −43˚00'4-Sep-2010Mw 7
- Page 64 and 65: TABLE 1Pairs of SAR imagery used in
- Page 67 and 68: Depth (km)Coulomb Stress Change(bar
- Page 69 and 70: Crippen, R. E. (1992). Measurement
- Page 71 and 72: AlpineFaultHope Fault38 mm/yr0+ +-1
- Page 73: σ 1dσ 3Nuσ 3CM w 7.1dw 6.2u70°M
- Page 77 and 78: DISCUSSIONThe 2010-2011 Canterbury
- Page 79 and 80: Large Apparent Stresses from the Ca
- Page 81 and 82: ▲ ▲ Figure 2. Observed vs. pred
- Page 83 and 84: 10Obs SA(1s)AS1AS+SDAB 2006AB+SDSA(
- Page 85 and 86: Fine-scale Relocation of Aftershock
- Page 87 and 88: −43.25°OXZ0 10 20km−43.5°−4
- Page 89 and 90: A’0 km 4 8−43.5°B’B−43.6°
- Page 91 and 92: REFERENCESAvery, H. R., J. B. Berri
- Page 93 and 94: ▲ ▲ Figure 2. A) shows three-co
- Page 95 and 96: ▲ ▲ Figure 4. Vertical accelera
- Page 97 and 98: 0.8PRPC Z0.40Normalized (Max PGA +
- Page 99 and 100: Near-source Strong Ground MotionsOb
- Page 101 and 102: (A)Magnitude, M w876542009 NZdataba
- Page 103 and 104: Scale0.5 g5 seconds▲▲Figure 4.
- Page 105 and 106: (A)(B)Spectral Acc, Sa (g)North/Wes
- Page 107 and 108: Vertical-to-horizontal PGA ratio543
- Page 109 and 110: (A)(B)Station:CCCCSolid:AvgHorizDas
- Page 111 and 112: REFERENCESAagaard, B. T., J. F. Hal
- Page 113 and 114: ▲ ▲ Figure 1. Shear-wave veloci
- Page 115 and 116: Spectral Acceleration (0.3 s), (g)I
- Page 117 and 118: Spectral Acceleration (3 s), (g)In[
- Page 119 and 120: TABLE 1Mean (μ LLH ) and standard
- Page 121 and 122: Strong Ground Motions and Damage Co
- Page 123 and 124: ings and the Modified Takeda-Slip M
The 2010 M w 7.1 Darfield mainshock (16:35:46 on3 September 2010 UTC) appears to be a composite rupturethat initiated at a depth of 11 km below the Canterbury Plains,~ 6 km north of a segmented surface rupture with dextralstrike-slip < 5 m that developed during the earthquake and wasmapped for nearly 30 km west-east across the plains (Quigley etal. 2010). This rupture, on what is now termed the Greendalefault (Figures 1 and 3), occurred in an extremely low-relief areaof the plains without any prior topographic expression of thestructure. Measured dextral displacements averaging 2.5 m butranging up to ~ 5 m were consistent with pure strike-slip ona subvertical fault with an enveloping surface for the left-steppingrupture segments striking ~ 085°. While near-field focalmechanism and geodetic analyses suggest that initial rupturinginvolved reverse-slip on NE-SW striking planes (Gledhillet al. 2011; GeoNet regional moment tensor solution cataloguehttp://www.geonet.org.nz/resources/earthquake/), teleseismicanalyses from long-period waves (USGS, http://earthquake.usgs.gov; Global CMT Project, http://www.globalcmt.org/CMTsearch.html) yield moment tensor mechanisms consistentwith near-vertical dextral strike-slip on a rupture parallelingthe mapped surface trace of the Greendale fault (Figure 4).Aftershocks, largely restricted to the upper crust at depthsless than 12 km, were initially concentrated in an E-W swatharound the surface rupture trace of the Greendale fault, thougha number of subsidiary clusters and lineaments are also evident(Bannister et al. 2011, page 839 of this issue; Gledhill et al.2011).An aftershock cluster dominated by reverse-slip eventsabuts the Southern Alps foothills west and south of the westerncurving termination of the Greendale fault surface rupture(Figures 3 and 4). A strong subsidiary belt of activity with amixture of strike-slip and reverse-slip mechanisms trendsNNW from the mainshock epicenter toward the foothillsand the Porters Pass system of strike-slip faults. Of particularstructural interest is a diffuse aftershock lineament trending145°–155° that developed south of the surface rupture in thefirst two weeks of the sequence and extended out to the coastand beyond. A strong concentration of activity including fiveof the M w > 5.0 events is associated with the eastern end of theGreendale fault rupture and the area just south of it. From themixture of strike-slip and normal fault mechanisms localizedwithin this rhomboidal area of distributed activity (Gledhillet al. 2011), it appears to represent a dilational stepover to anen échelon ENE-trending aftershock lineament that extendedeastward along the Banks Peninsula volcanic rangefront.Dilational stepovers (jogs) of this kind are well known forfocusing long-continued aftershock activity with delayed sliptransfer to the en échelon fault segment (Sibson 1986).On 22 February (23:51:42 on 21 February 2011 UTC)central and eastern Christchurch were devastated by an M w6.2 aftershock located along the dominant ENE lineament followingthe northern outcrop margin of the Banks Peninsulavolcanics. No surface fault break was observed, but Beavan etal. (2011, page 789 of this issue) modeled GPS and SAR dataon surface deformation, in terms of dextral-reverse slip of up to3 m on a buried rupture with a length of 12 km and a width of7 km oriented ~060°/70° SE and extending to within 1 km ofthe surface beneath the Heathcote-Avon estuary (cf. Barnhartet al. 2011, page 815 of this issue). Beavan et al. (2011, page789 of this issue) also suggest subsidiary strike-slip rupturingon a plane oriented ~ 080°/87° S (Figure 3). Aftershock activitywas concentrated in the hanging wall of the main rupture,extending a little out to sea north and east of Banks Peninsula(Bannister et al. 2011, page 839 of this issue).A further M w 6.0 aftershock occurred on 13 June (02:20:50on 13 June 2011 UTC) with an epicenter some 5 km further tothe ENE but again without surface rupture. The regional CMTsolution yielded nodal planes suggesting either dextral-reverseslip on a fault oriented 068°/84° SSE, or sinistral-reverse slipon 161°/67° WSW with the slip vector raking 6° SSE (GeoNetcatalog; http://www.geonet.org.nz). Support for this latterrupture orientation comes from an aftershock lineament thatextended progressively along a trend of 140°–150°, subparallelto the SE-SSE trending lineament from the Greendale faultrupture (Figures 3 and 4). A “single-fault” interpretation ofsurface deformation recorded by GPS and DinSAR (J. Beavan,personal communication 2011) suggests left-reverse obliqueslip of up to 1.5 m on a rupture plane oriented 155°/55° SW thatextends from 1 km to 9 km in depth and along strike for ~ 14km, cutting across the eastern end of the 22 February rupture.BASEMENT FAULT FABRICKnown fault traces extending into the basement (includingLate Quaternary–Holocene active segments) identified by surfacemapping in the Canterbury region and from seismic profiling,both onshore and offshore (Forsyth et al. 2008; Barnes1994) (Figure 1) are clustered in two dominant groups basedon their displacement characteristics (Figure 5).1. Faults possessing dominant right-lateral components inthe rangefront and foothills of the Southern Alps are subvertical,and oriented across the azimuthal range 050°–100° (Figure 5). ENE faults cluster along the active PortersPass system, and E-W faults are mainly represented bythe new rupture trace along the Greendale fault (Figure1). Dominant orientations at 070°–100° are also shownby faults with components of normal separation, togetherwith normal fault escarpments inferred from gradients inBouguer gravity with surface traces indicating high-angledips (70°–80°) to the north and south.2. Faults dominated by reverse-slip include two groups ofopposite-facing structures: 000°–050° trending faultsdipping west, and 035°–090° trending faults dippingsoutheast (Figures 1 and 5). North-trending reverse faultsdipping at moderate angles (40°–60°) to the west are welldeveloped along the S. Canterbury rangefront (Figure 1).ENE-trending reverse faults dipping south at high angles(60°–70°) occur only in the north of the Canterburyregion (Figure 1). Both groups include Quaternary-activesegments.828 Seismological Research Letters Volume 82, Number 6 November/December 2011


